Article

Crowdsourced Knowledge in Organizational Decision Making

by
Stephen L. Dorton
1,*,
Samantha B. Harper
2,
LeeAnn R. Maryeski
1 and
Lillian K. E. Asiala
1
1
Human-Autonomy Interaction Laboratory, Sonalysts, Inc., Waterford, CT 06385, USA
2
Naval Surface Warfare Center-Dahlgren Division, Dahlgren, VA 22485, USA
*
Author to whom correspondence should be addressed.
Knowledge 2022, 2(1), 26-40; https://doi.org/10.3390/knowledge2010002
Submission received: 10 November 2021 / Revised: 10 December 2021 / Accepted: 19 December 2021 / Published: 2 January 2022

Abstract

:
Inefficiencies naturally form as organizations grow in size and complexity. The knowledge required to address these inefficiencies is often stove-piped across different organizational silos, geographic locations, and professional disciplines. Crowdsourcing provides a way to tap into the knowledge and experiences of diverse groups of people to rapidly identify and more effectively solve inefficiencies. We developed a prototype crowdsourcing system based on design thinking practices to allow employees to build a shared mental model and work collaboratively to identify, characterize, and rank inefficiencies, as well as to develop possible solutions. We conducted a study to assess how presenting crowdsourced knowledge (votes/preferences, supporting argumentation, etc.) from employees affected organizational Decision Makers (DMs). In spite of predictions that crowdsourced knowledge would influence their decisions, presenting this knowledge to DMs had no significant effect on their voting for various solutions. We found significant differences in the mental models of employees and DMs. We offer various explanations for this behavior based on rhetorical analysis and other survey responses from DMs and contributors. We further discuss different theoretical explanations, including the effects of various biases and decision inertia, and potential issues with the types of knowledge elicited and presented to DMs.

1. Introduction

As organizations grow in size and complexity, it is unfortunately natural that inefficiencies form. Crowdsourcing and collective intelligence methods provide ways to tap into the knowledge and experiences of large and diverse groups of people. Similarly, design thinking methods are hinged upon the concept of eliciting knowledge from a diverse set of participants to rapidly identify and solve inefficiencies. Although these methods have proven to be scalable, adaptable, and effective across a variety of applications, there are several nuances to be considered when implementing a crowdsourcing solution for something as context-dependent and subjective as the identification and resolution of organizational inefficiencies.
We developed the Visual Argumentation for Resolving Inefficiencies (VARI) crowdsourcing platform as one approach to solving this problem, using it as a test bed for numerous experiments regarding the collection, processing, exploitation, and dissemination of organizational knowledge from a crowd of contributors (CTs) to organizational Decision Makers (DMs). VARI is an asynchronous online environment built upon a design thinking framework that blends crowdsourcing algorithms with intuitive visualizations that enables CTs to identify, characterize, argue, and vote on organizational inefficiencies. Organizational inefficiencies, in the context of VARI, include a variety of issues that affect organizational performance and range from issues with specific underperforming personnel, inadequate funding or material resources, or suboptimal policies and workflows.
We conducted this study to develop an understanding of the connection between CTs and DMs or, more specifically, an understanding of how DMs make use of organizational knowledge provided by CTs. Knowing that the mental models of CTs and DMs may differ in many ways, and given our overarching goal, we conducted this study to answer the following research questions:
  • Are there differences in the mental models of CTs and DMs? If so, how do they differ?
  • Will crowdsourced knowledge provided by CTs significantly change perceptions of DMs? In what ways?
  • What argumentation qualities, if any, affect how receptive DMs are to CT-provided organizational and/or tacit knowledge?

1.1. Crowdsourcing, Argumentation, and Design Thinking

The term crowdsourcing is a play on “outsourcing” [1], which describes a combination of top-down organizational goals with bottom-up intellectual effort, where the goal is to achieve an outcome that is beneficial to both parties (i.e., the organization and the crowd) [2]. Put more simply, crowdsourcing has been described as simply converting work into one or more microtasks and sourcing it to a larger crowd of CTs. It should be noted, however, that there are numerous crowdsourcing approaches aside from micotask-based development of work products, such as Games with a Purpose (GWAP) or citizen science, and various approaches regarding the process order of work, quality control, and incentives for participants [3,4,5]. Crowdsourcing, or any collective intelligence method, works by taking advantage of the diversity of knowledge, skills, and abilities of the crowd, which can solve more complicated problems than any one individual expert [6]. Crowdsourcing has been demonstrated to provide value for completing work across various domains, with varying scope and complexity, such as writing creative works of fiction, developing taxonomies, or facilitating argumentation to solve logical tasks [7,8,9].
The application of crowdsourcing to argumentation is of particular relevance to this study, where we sought to collect, represent, and transfer institutional knowledge from CTs to inform organizational decision making. Renowned philosophers such as Hume and Kant have asserted that argumentation is the true means by which knowledge is transferred among people [10]. Previous studies have shown that crowdsourced argumentation can significantly increase the quality of problem solving [9]; however, there are difficulties in getting crowds of relatively untrained CTs to reliably engage in quality argumentation outside of simple logical syllogisms [11].
Design thinking is an approach to solving relatively intractable problems by engaging users or stakeholders in a collaborative process to reframe problems and overcome biases through inclusive, collaborative approaches [12,13]. Design thinking methods have been shown to allow diverse crowds of CTs to develop novel and effective solutions for difficult problems [14,15]. Because of the relative esotericism of argumentation and the success of design thinking to enable effective communication across large groups of diverse stakeholders, the VARI prototype was designed to serve as an online and asynchronous version of an iterative design thinking framework described in reference [15].

1.2. Mental Models

Mental models are an internal representation of an individual’s or group’s knowledge structure related to a specific concept [16]. Mental models are built on experience and observation, which can be used to describe, explain, and predict outcomes [17]. When applied collectively, mental models have been discussed as representations of organizational cognition—how agents within an organization model reality and how that model affects behavior [18]. In the context of VARI, a mental model is simply the collection of perceptions on the relative impact, feasibility, and preferability of the different candidate solutions to the asserted inefficiency. That is, we would say a CT and a DM have similar mental models if they vote similarly, and conversely, they have divergent mental models if they vote differently from each other.
Survey research on innovation and organizational change has shown that there may be differences in mental models across senior leadership and other employees [19]. This research showed that mid- and high-level managers reported significantly lower satisfaction with innovation in comparison to CEOs and executive leadership. Similarly, it was found that executive leadership was more satisfied with innovation at their organization than lower-level managers. These findings suggest that organizational leadership may think about the organization, values, and priorities differently than other employees.
Carrington, Combe, and Mumford [20] found that in organizational crisis management, consensus builds over time in both leader and follower teams. They examined this shift and found that the mental models of the leadership teams converged towards the follower teams, rather than the followers matching the mental models of the leaders. These findings highlight the importance of the mental models or collective perspective and understanding of the followers (non-leaders) of organizations in solving problems. Based on these findings, we posit the following hypotheses for this experiment:
Hypothesis 1 (H1).
DMs (organizational leaders) will have different mental models regarding the organization and therefore will vote differently than the CTs (non-decision makers).
Hypothesis 2 (H2).
The DMs’ votes will converge toward the CTs’ votes once they are able to review the votes and justifications of the crowd.

1.3. Resistance to Change

Decision inertia is a well-known phenomenon that has been widely studied in decision-making literature [21]. Decision inertia is the tendency to repeat previous choices regardless of the outcome or new information, which can result in the preservation of suboptimal choices [22]. Research has shown that decision inertia has been positively associated with an individual preference for consistency, where the effect of decision inertia is stronger in voluntary choices rather than in required choices [21].
Another relevant phenomenon associated with a resistance to change in decision making is confirmation bias. Confirmation bias is a cognitive bias where people are motivated to see events as being consistent with their current beliefs and expectations, rather than being inconsistent with them [23]. Despite the benefits for confirming the accuracy of a mental model or judgement, people are not likely to seek evidence that contradicts their own mental model [24]. Instead, people are more likely to seek information that supports their current beliefs, which can lead to errors and a lack of appropriate attention to new information that disconfirms their current views.
Anchoring is another related cognitive bias, where judgements are anchored to earlier information on a given topic, and new information is compared to the initial information as a reference point, rather than viewing it objectively or independently [25]. In the context of this study with VARI, crowdsourced information needed to be of substantial quality to move the DMs away from their original understanding and perceptions, which would otherwise be a conceptual anchor for their thoughts. We observed this anchoring effect in previous experiments among CTs; however, some CTs indicated that the new information changed their perceptions [26]. Based on these findings, we forward the following hypothesis for this experiment:
Hypothesis 3 (H3).
Decision inertia and cognitive biases will drive DMs to not change their votes after assessing CT votes and their justifications.

2. Materials and Methods
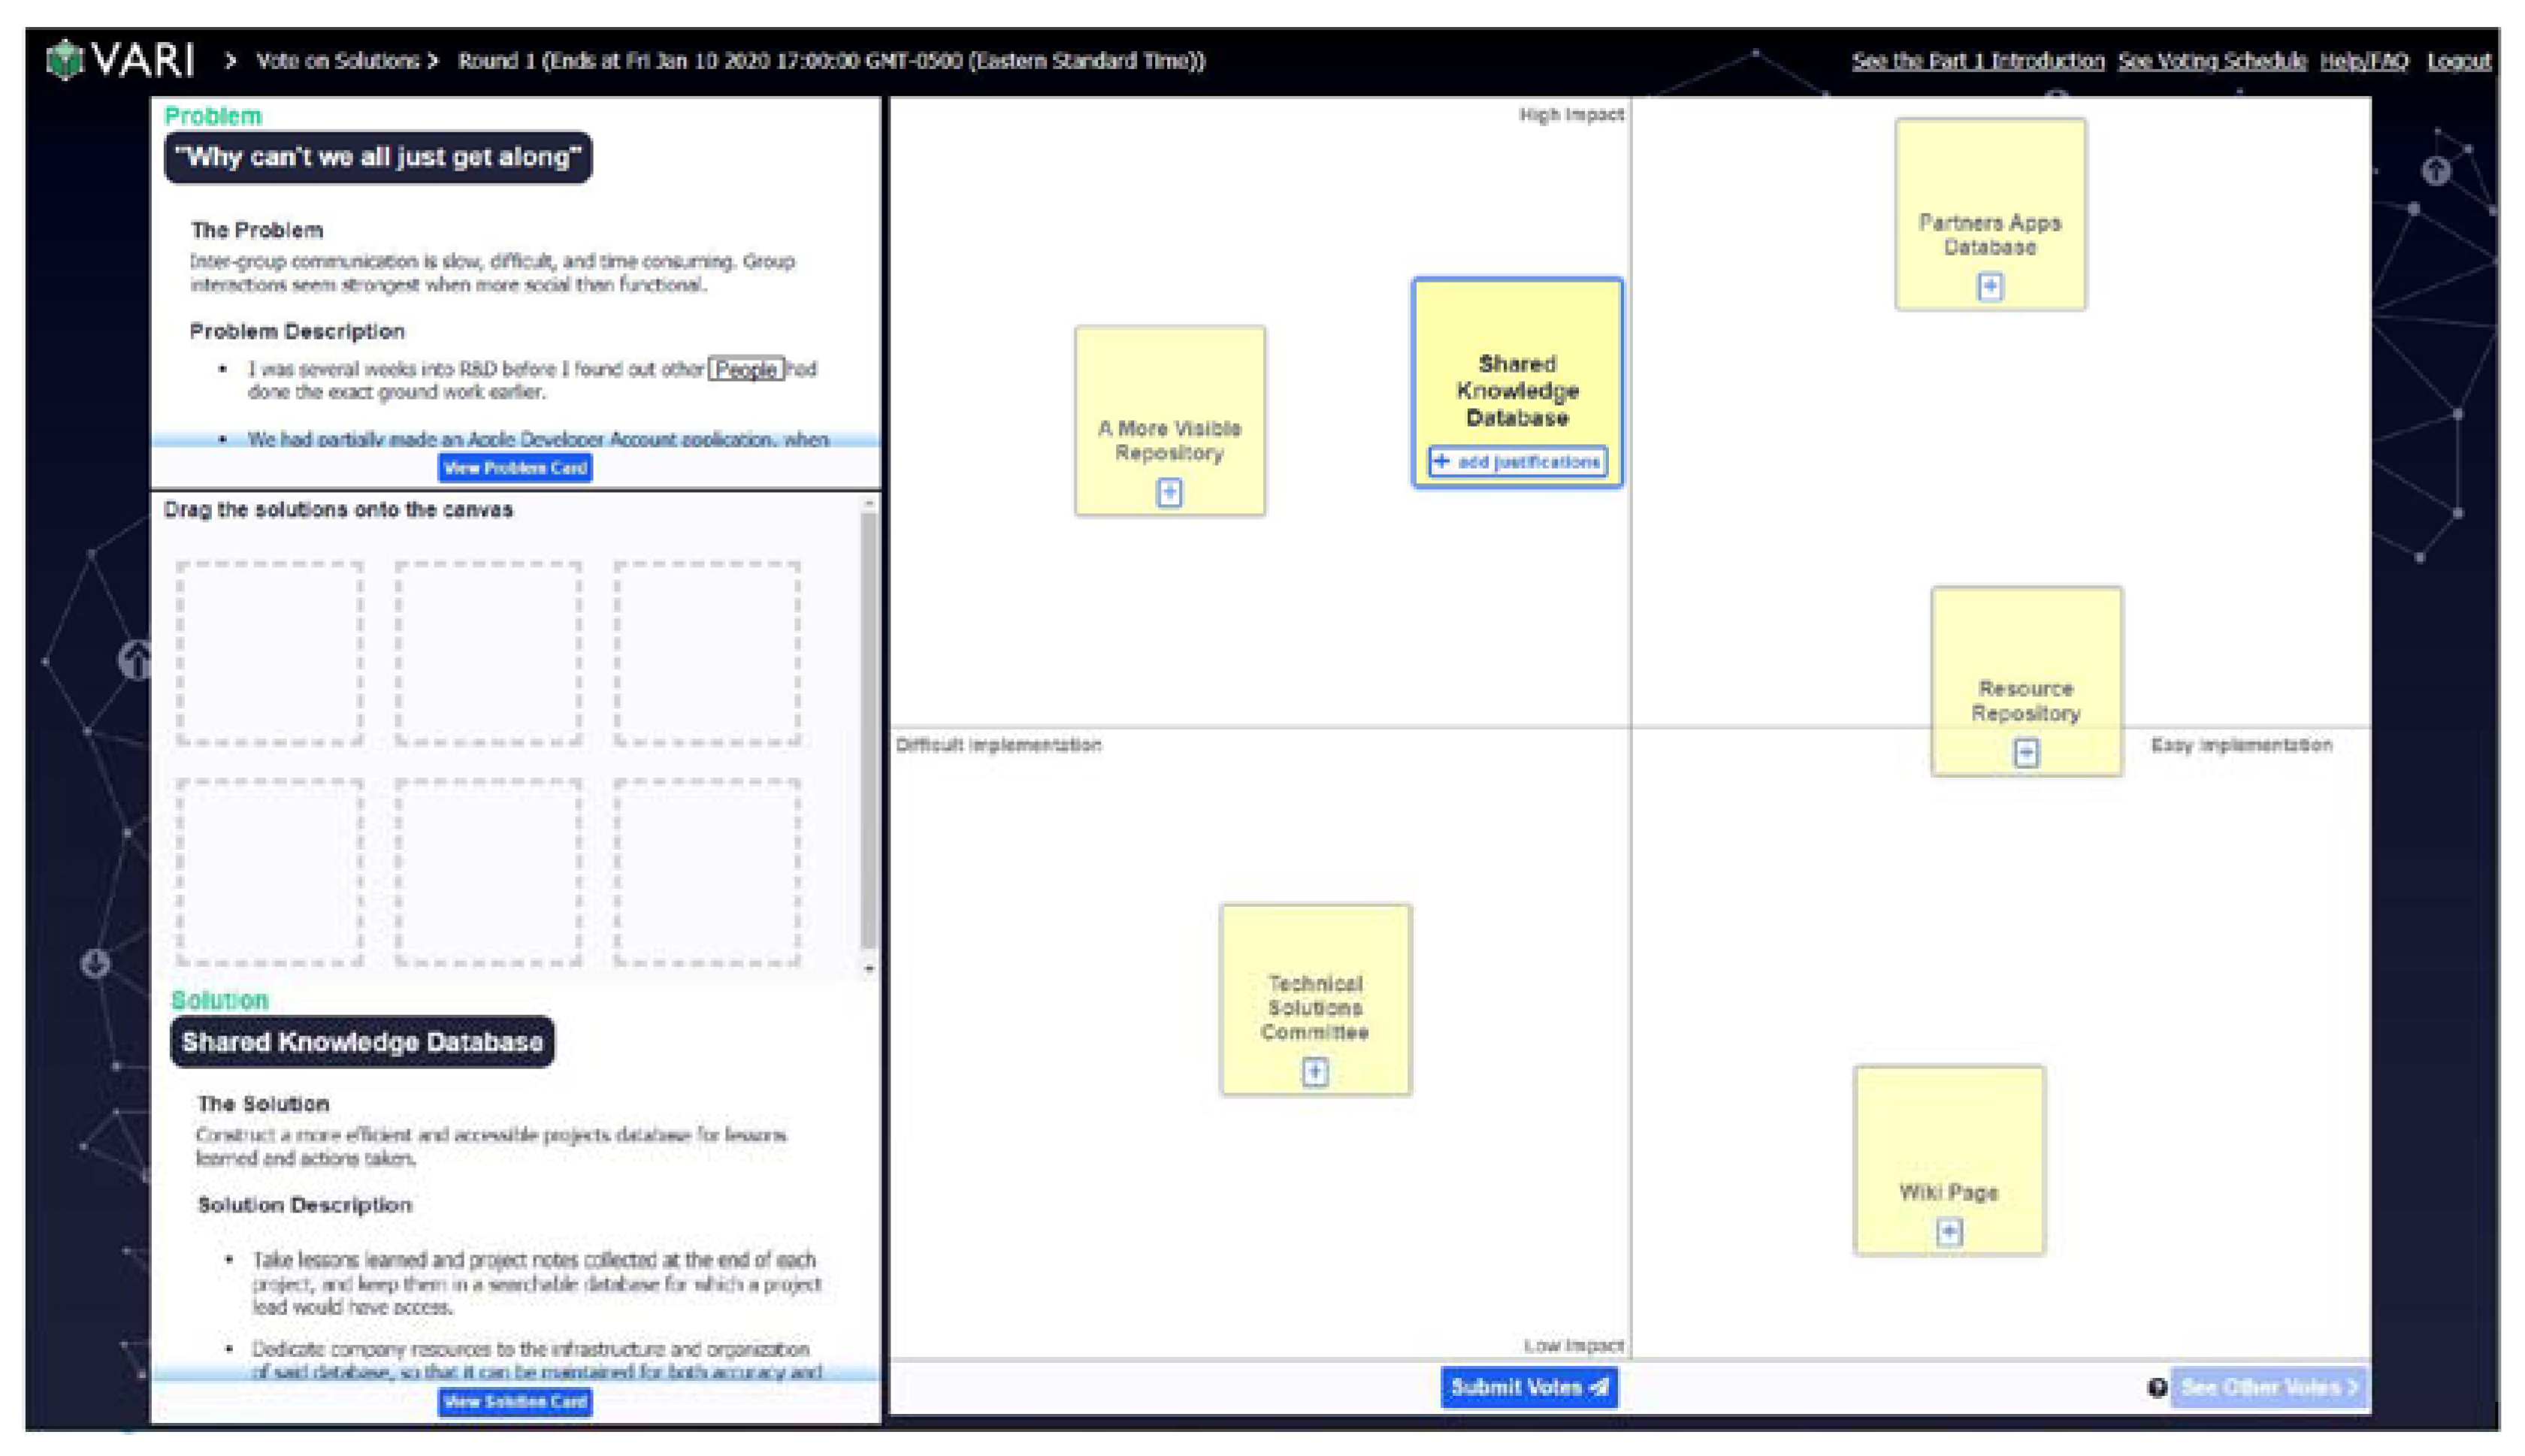
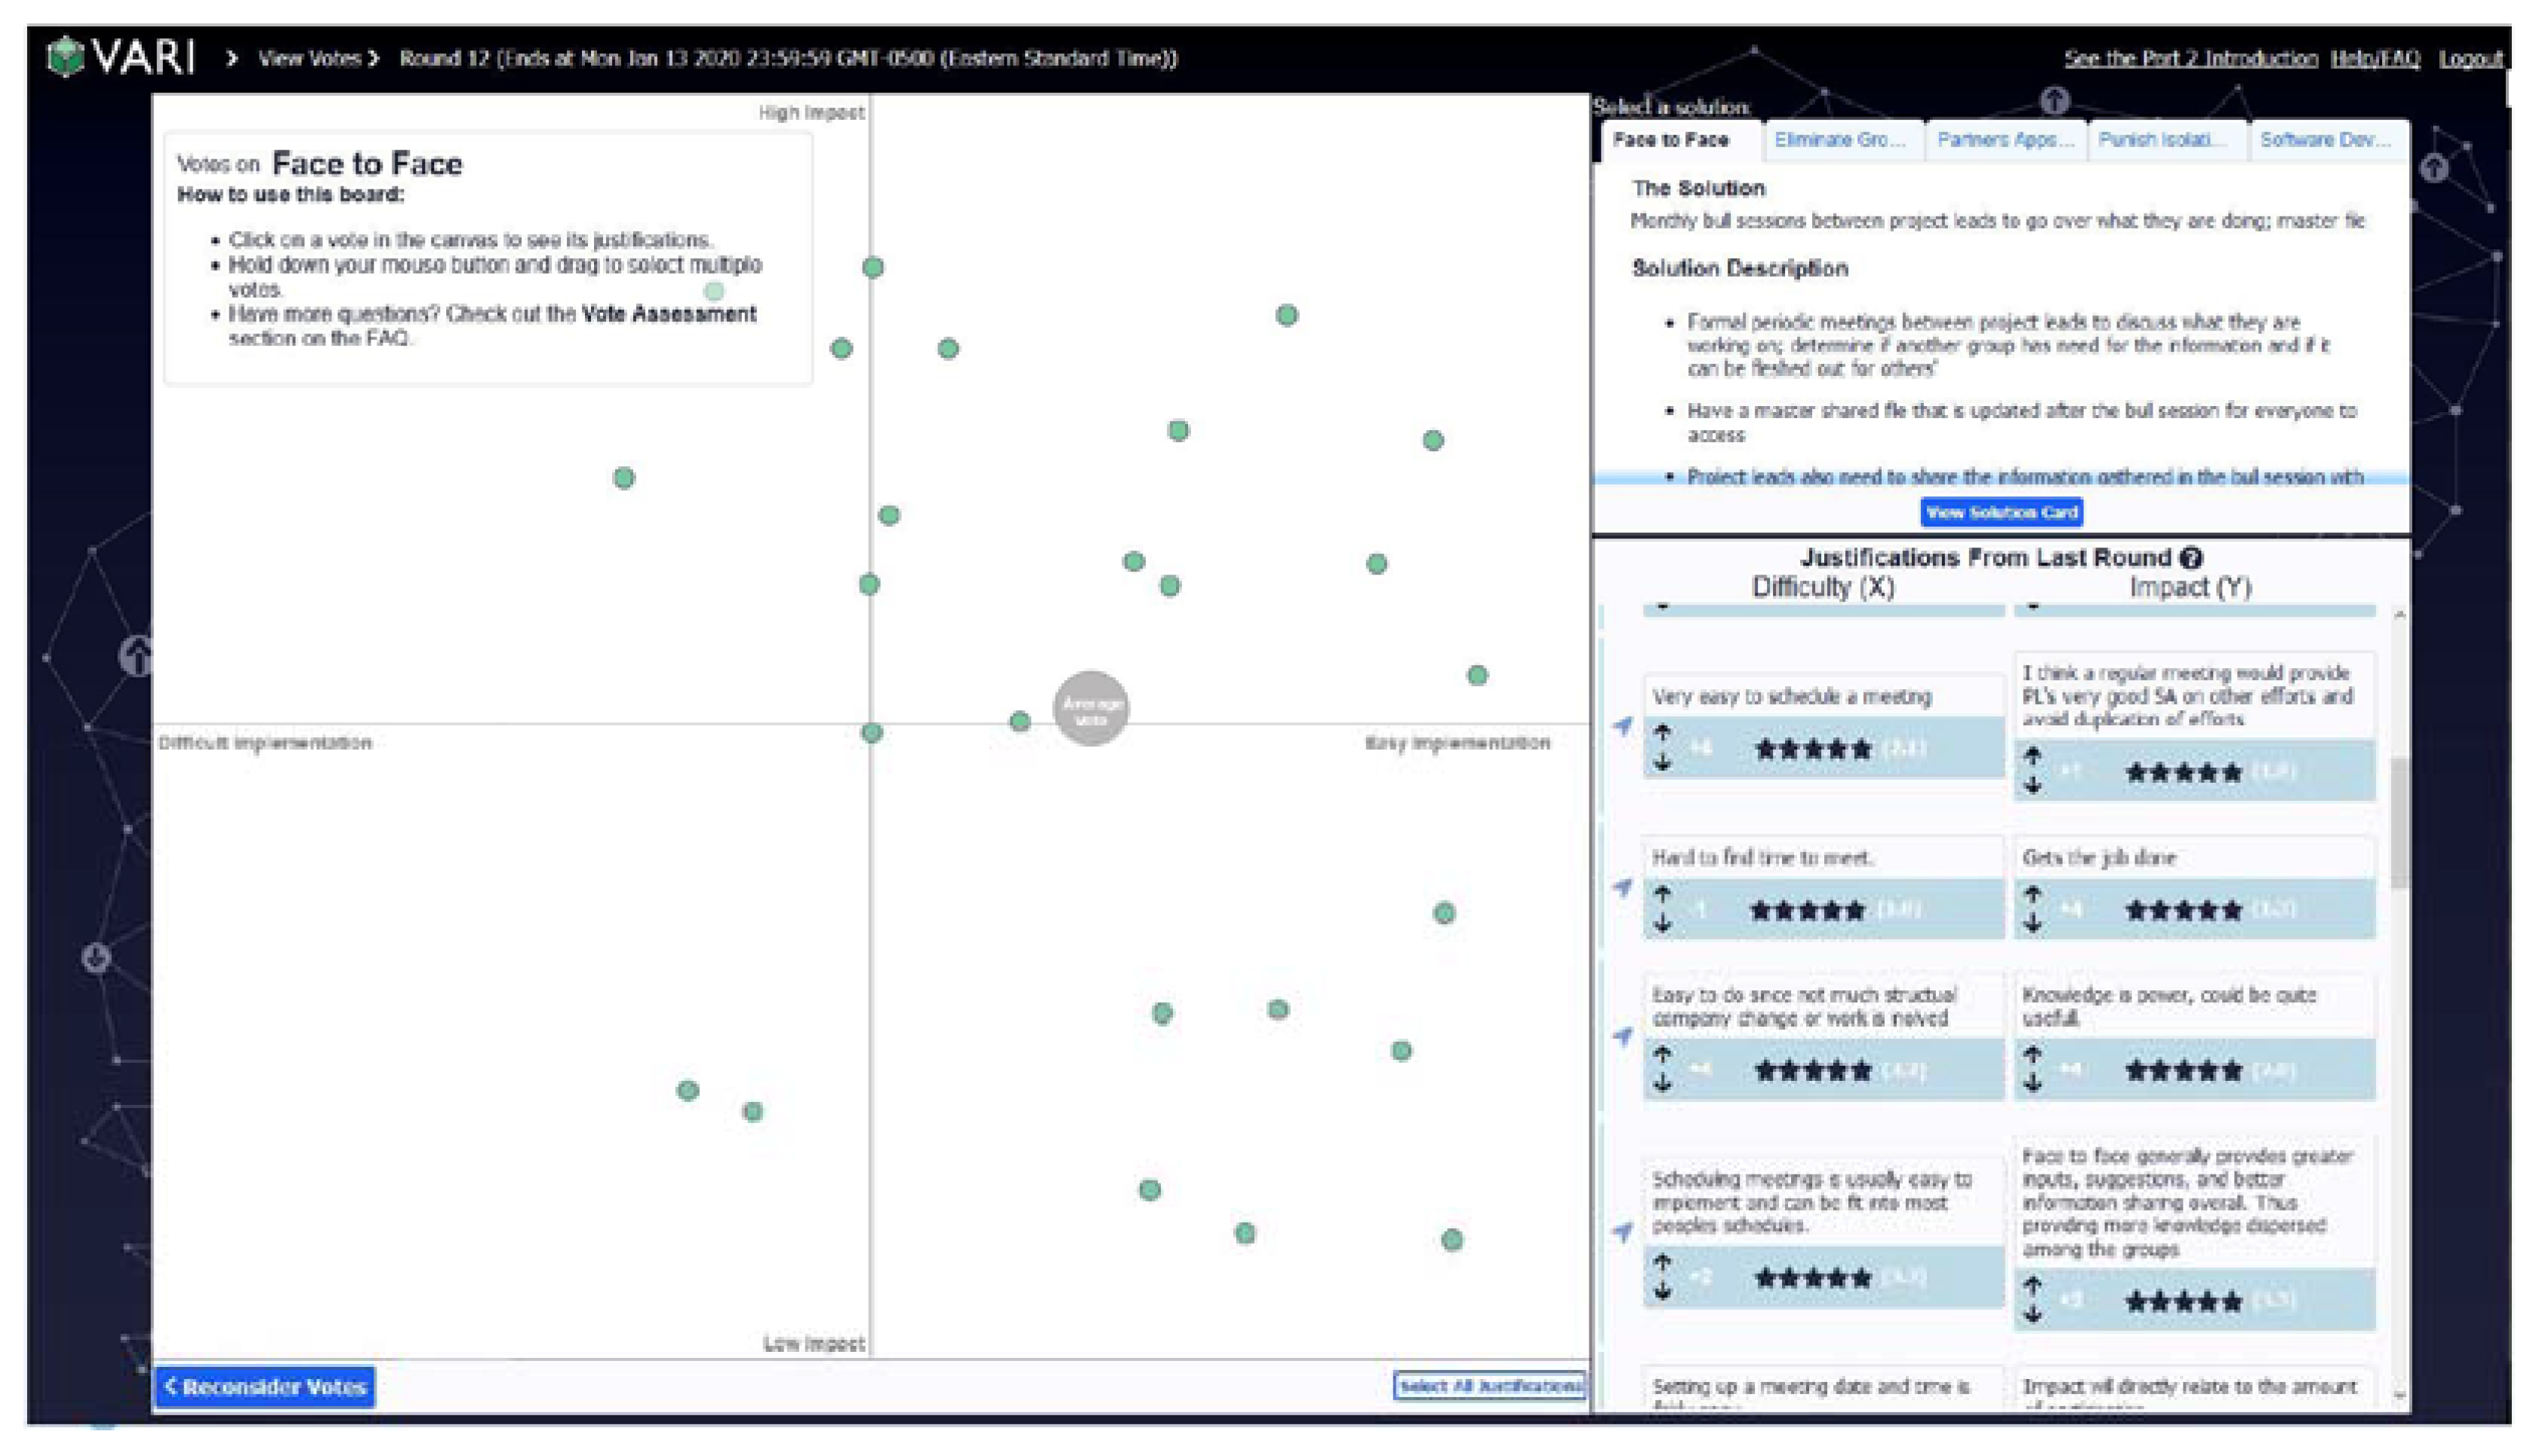
All participants (DMs) were in the same experimental group or condition, and the only independent variable was the timing of their votes (pre- or post-assessment of contributor inputs), resulting in a single variable within-subjects design.

2.1. Procedure

DMs participated in a single session that included a four-step procedure, which took between 60 and 90 min to complete. This process is described in detail in the following paragraphs.
Informed Consent, Demographics, and Training: We contacted eligible participants via email to request participation in the study. Those who responded first provided informed consent, then filled out a brief demographic questionnaire and were provided basic training on the concept and mechanics of the visual voting interface (Figure 1).
Vote and Justify: As shown in Figure 1, DMs were able to review the selected problem (generated and voted on by CTs in an earlier experiment, shown upper-left) and the top five asserted solutions (generated and voted on by CTs in a subsequent earlier experiment, details shown lower-left). After an initial review to familiarize themselves with the problem and solutions, participants placed a card, or virtual “sticky note,” representing each solution (the yellow squares) onto the voting canvas (the Cartesian plane on the right) into a position that corresponds with the relative Impact (y-axis) and Feasibility (x-axis) of each solution. Each axis included semantic anchors at the minimum and maximum values to help DMs frame their reasoning. The y-axis ranged from “Low Impact” (bottom) to “High Impact” (top), and the x-axis ranged from “Difficult Implementation” (left) to “Easy Implementation” (right). They were required to place all five solution cards on the canvas, in a forced-choice manner (i.e., cards could not overlap). DMs were also able to provide a text justification for their perception of each card’s impact and feasibility, although such inputs were not mandatory.
Assess and Reconsider: After providing their votes and justifications, DMs were shown the votes provided by CTs during a previous experiment (green dots in Figure 2). The interface showed DMs the relation of their vote compared to the crowd of CTs (the median vote of the crowd is shown as the large gray dot), as well as the text justifications provided by each CT (shown lower-right). After they assessed the votes and justifications of CTs, the DM participants were given the option to reconsider their votes (i.e., re-arrange their solution cards based on the new knowledge gained from the CTs).
Rhetorical Analysis and Surveys: After the participants reconsidered their votes, they were brought to a final survey, where they rated and ranked the possible solution cards based on a variety of rhetorical argumentation qualities on a 10-point scale. Additionally, they completed other surveys regarding system usability [27] and the general User Experience (UX) with the system.

2.2. Participants

We recruited a variety of DMs that guide organizational decision making on policy and resource allocation, which included not only executive leadership but also senior personnel from infrastructure and support staff. Table 1 provides an overview of the types of organizational DMs that were recruited to participate in this study. Detailed demographic data were not collected because we were concerned that a perceived inability to preserve anonymity might inhibit our ability to recruit and retain participants. In an organization with 300–500 employees, we identified 27 DMs. Of the 27 recruited, 11 (41%) agreed to participate in the study.

2.3. Apparatus

Participant sessions were administered through a webpage hosted on a local server (i.e., only participants with access to the organization’s network could access the VARI prototype). This allowed the DMs to access the prototype from the privacy and safety of their own offices or homes through a Virtual Private Network (VPN). This setup enabled not only high external validity (i.e., a deployed VARI system would be used in the same manner) but also enabled the participation of contributors from multiple satellite offices across the United States. Because we could not control for the screen size, aspect ratio, and resolution for each user, the VARI prototype was designed to be moderately responsive, adjusting to the size and resolution of each display in order to provide a somewhat uniform user experience.
Table 2 provides an overview of the five topics that the DMs interacted with in this experiment. These five topics (with exception of T45) were included in this experiment since they were the most highly rated out of a set of 40 topics by the crowd in a previous experiment. The top five topics were used in this experiment, as they are a relatively tractable set of solutions to debate, where the intent in the production VARI system is to send three proposed solutions to the DMs: the most preferable (both impactful and feasible), the most impactful (irrespective of feasibility), and the most feasible (irrespective of impact.

2.4. Dependent Measures

Various dependent measures were used to assess the preferences of the DMs and CTs, as well as the perceived quality of the crowdsourced solutions. Preferences for each solution (i.e., topic card) were captured with three measures:
  • Impact: The Y value of the solution on the voting canvas, normalized from −1.000 to 1.000, indicating the perceived impact of the proposed solution;
  • Feasibility: The X value of the solution on the voting canvas, normalized from −1.000 to 1.000, indicating the perceived feasibility of the proposed solution;
  • Distance to Ideal Solution (DI): The Euclidian distance of the solution’s median position (XMdn, YMdn) and the upper-right corner (1.000, 1.000), which represented the conceptual location of a solution that is perfectly impactful and perfectly feasible. As such, a lower DI indicates a more preferable solution.
Following voting on the visual voting canvas, DMs also provided various quality measures for each solution (Table 3). A variety of quality measures were used, which primarily stemmed from the rhetorical tradition of argumentation, since using logical measures alone is insufficient [28]. Rhetorical measures from the Aristotelian tradition were used, including the quality of evidence (Logos), the credibility of the asserter (Ethos), the personal relevance (Pathos), and the timeliness or urgency of the solution (Kairos), which have been used in the context of crowdsourcing or other computer-mediated collaborative work [29,30,31,32]. Kotter’s work on organizational change also states that creating a sense of urgency is critical to affect the perceptions of DMs [33]. Other measures with high face validity were also used, including the clarity of the argument, as well as the degree to which the DM found the solution to be of high quality or agreeability.

3. Results

We conducted several descriptive and inferential statistical tests to answer different research questions. Non-parametric methods such as the Spearman’s Rho (RS) were used where data failed to meet the assumption of normality, in accordance with best practices. To enable interpretability for the reader, the Mean (M) and Standard Deviation (SD) are also reported as measures of central tendency and dispersion. It should be noted that VARI uses the Median position of votes (Mdn X, Mdn Y) rather than the Mean position (μX, μY) in order to be more resilient to outliers and extreme votes, which are expected in a voting system based on subjective preferences to potentially controversial topics.
The primary analytical thrust of this study was to develop insights towards how organizational decision makers use crowdsourced knowledge or information generated by CTs in VARI to make decisions. We will answer specific research questions in the following sections.

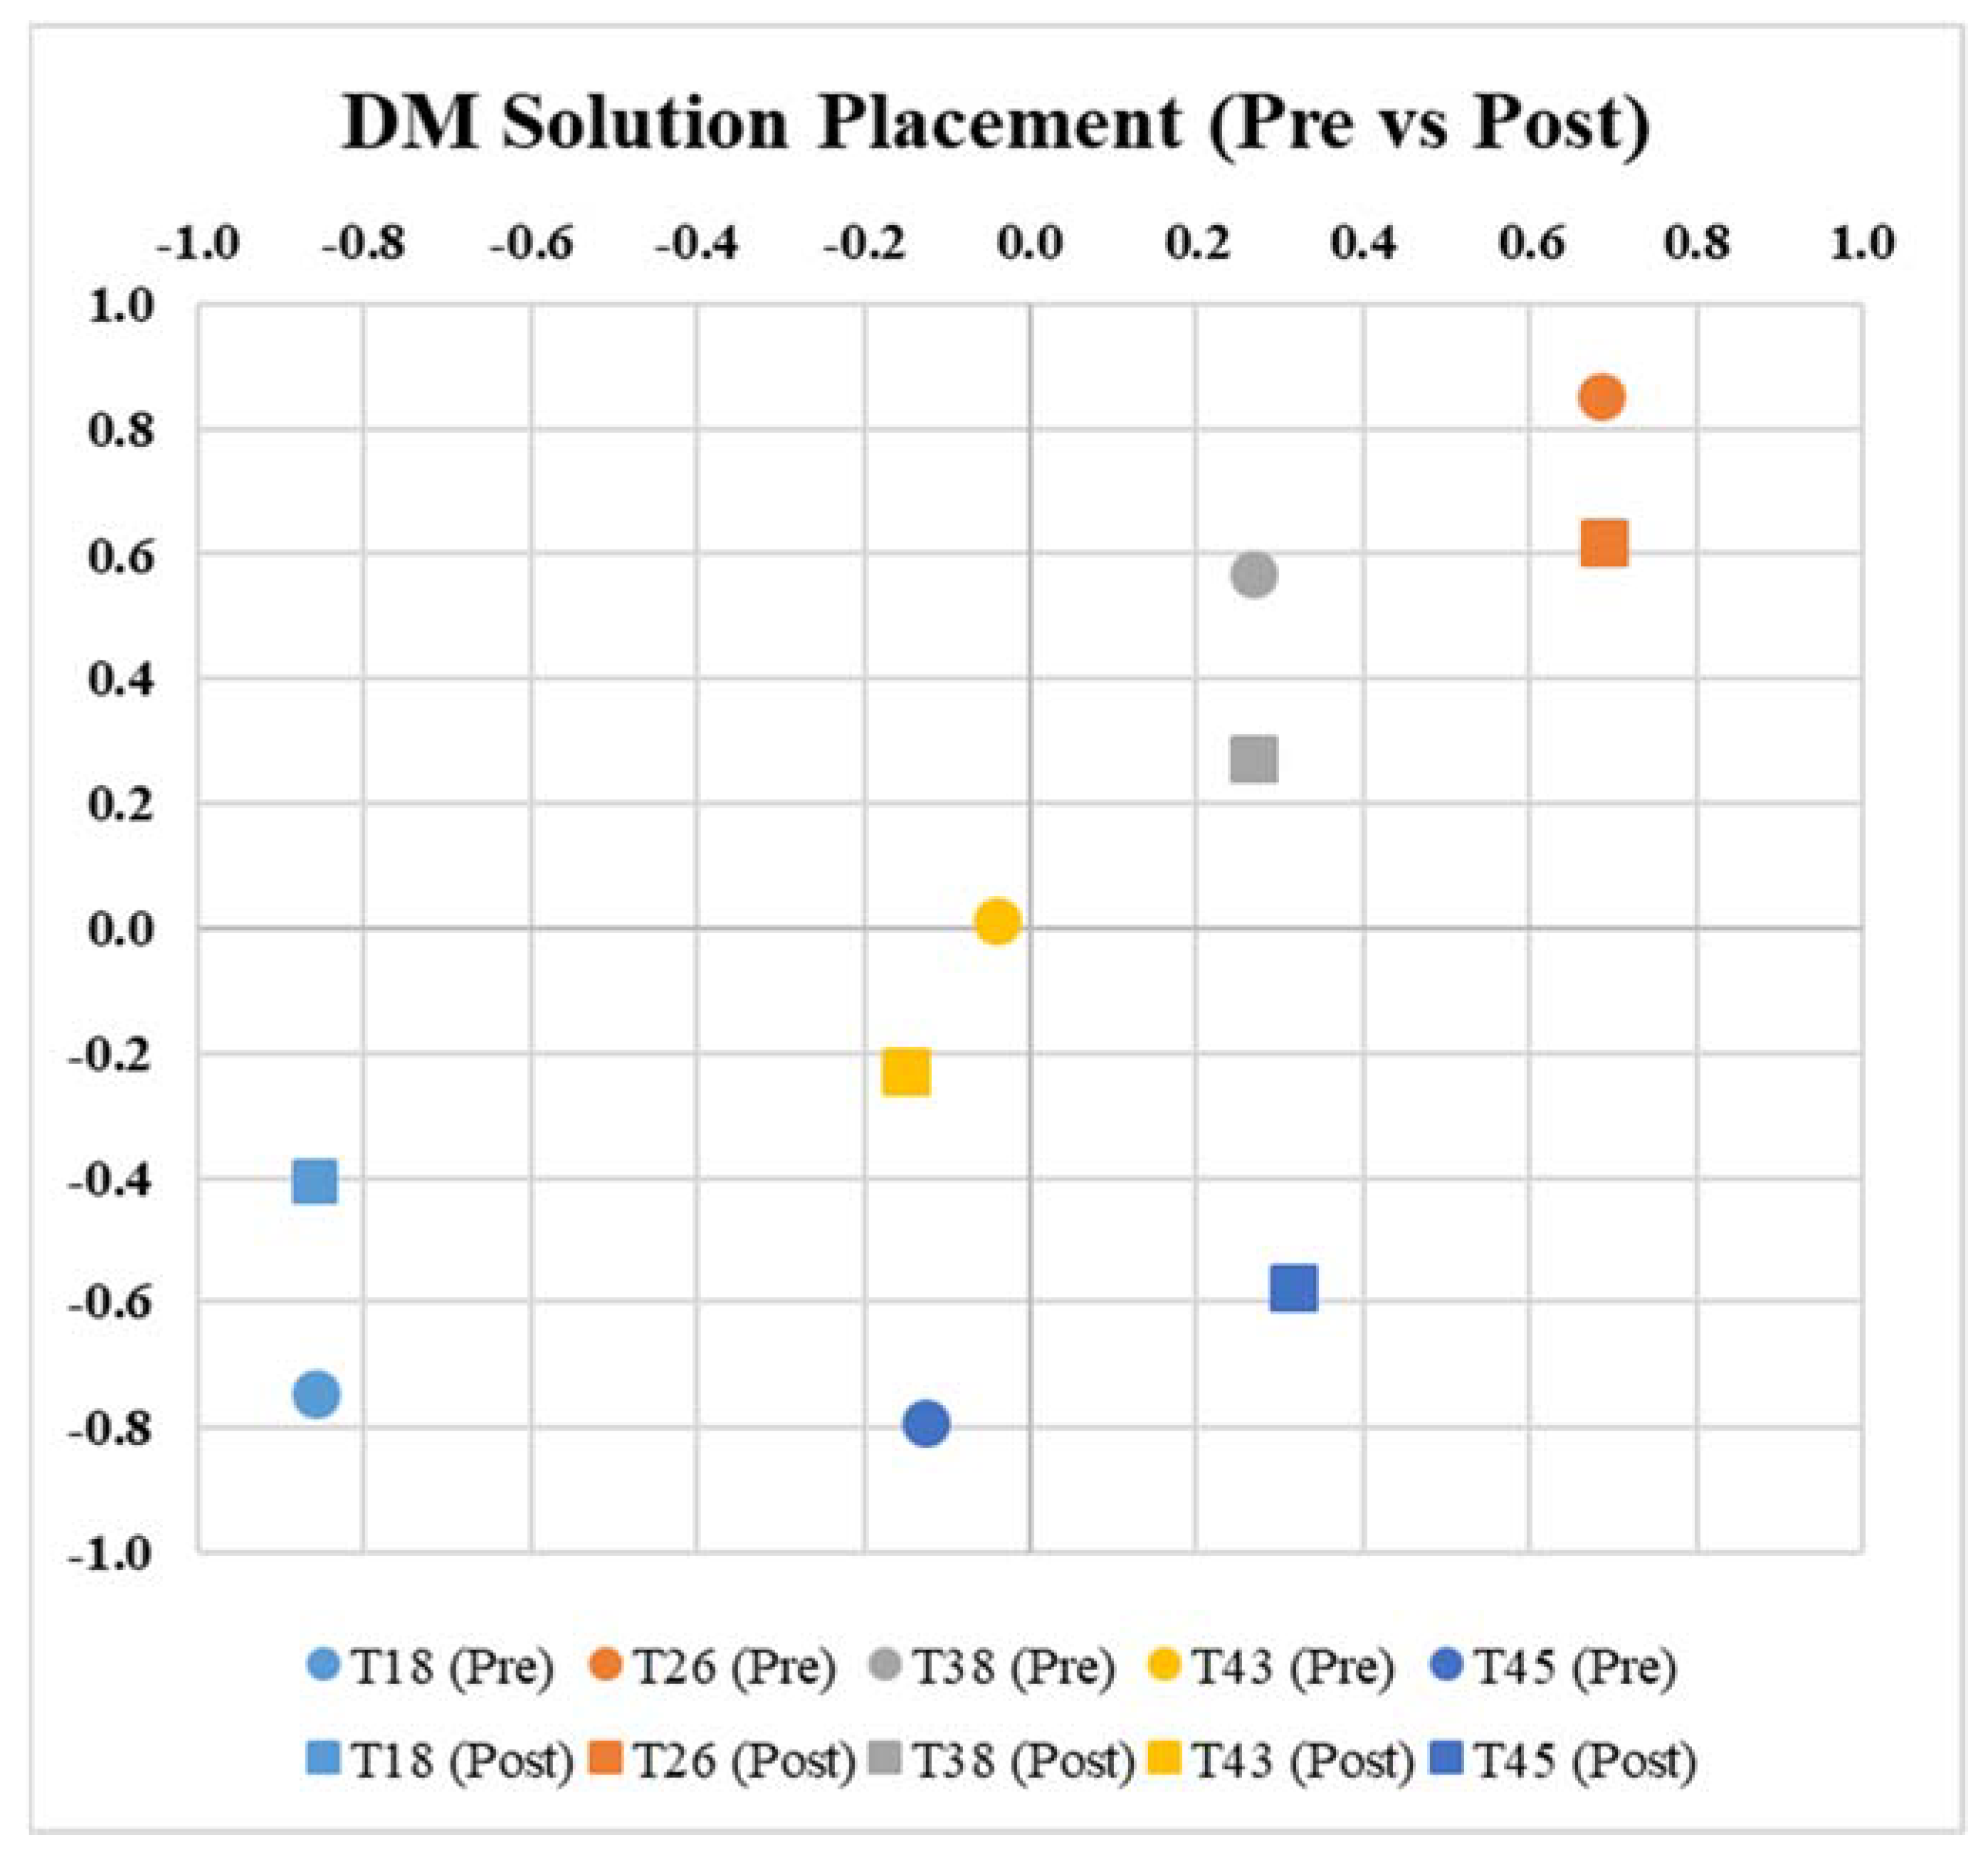
3.1. Did the DMs Vote Differently Than the CTs?

First, we address the question of whether there were any differences in how DMs and CTs appraised the different crowdsourced solutions after consuming all available information. To answer this question, we compared the final DM votes (i.e., after they had assessed the CT votes and justifications) from this experiment against the final CT votes from the immediately previous experiment (both events used the same set of solution cards). As previously described, studies have identified differences in the mental models of leadership and employees regarding aspects of their organizations [19]. Based on this research, we may expect to see differences in the way DMs and CTs voted.
As shown in Figure 3 and Table 4, there were some considerable differences in the votes of DMs and CTs. Generally speaking, the largest differences in perceptions regarded the perceived impact of the solutions. To that point, the mean absolute difference for the impact of the five solution cards (M = 0.580, SD = 0.294) was more than twice the mean absolute difference regarding the feasibility of the five solution cards (M = 0.259, SD = 0.276). While the absolute values show a clear difference, there was not a consistent directionality to the differences (i.e., DMs did not consistently vote higher or lower than CTs on either axis), and the mean value was nearly zero for both impact and ease of implementation.
As shown in Table 5, many of the differences were statistically significant. Three of the solution topics (18: Eliminate Groups, 26: Face to Face, and 38: Employee Apps Database) had significantly different DI, signifying that DMs and CTs exhibited different preferences for those three topics. Interestingly, each of those three topics had a significantly different DI for different reasons. DMs and CTs had a significantly different perception regarding the feasibility of Solution 18, while they had a significant difference in perception regarding the impact of Solution 26. Furthermore, Solution 38 had a significantly different DI, although neither the feasibility nor the impact judgements were different themselves. Finally, Solution 45 (Punish Isolationists) had a significantly different feasibility and impact assessments across DM and CT groups; however, the DI had no significant difference. As shown in Figure 4, this is because the Median location for each group fell approximately on the same indifference curve—a line or geometry where all points have equal preferences [34]. Based on these results, we can reject the null hypothesis and support H1, which states that DMs and CTs will have different mental models (as evidenced by their voting).
All of these differences resulted in only one change in solution rankings. Both DMs and CTs agreed on the first (T26), second (T38), and last place/fifth (T18) solutions (based on the minimize DI criteria); however, the third and fourth ranked solutions were alternated for DMs and CTs. From a practical perspective, it is unlikely that this would result in an outcome where DMs chose a topic that was not popular with CTs, since there was consensus in the rankings of the top two solutions across DMs and CTs. We discuss whether DMs would choose to implement any of these solutions later.

3.2. Did the CT Information Change the DM Votes?

Next, we addressed whether or not the crowdsourced information had a significant impact on the DM votes. A goal of VARI is to provide a structured grammar or syntax of argumentation to allow relatively untrained crowds to develop high quality argumentation. While quality was assessed via rhetorical analysis, we explored the outcome-based measure of whether exposing DMs to CT argumentation had a significant effect on DM voting. More colloquially, does crowdsourced information “move the needle” of how DMs think?
As shown in Figure 4 and Table 6, there were changes to the Median position of each topic, generally with regards to the perceived impact of the solution. After reading the crowdsourced information, DMs generally moved their votes towards the center of the voting canvas. The Mean absolute difference between pre- and post-information votes was 0.214 (SD = 0.165) for ease of implementation and 0.161 (SD = 0.130) for impact. As shown in Figure 4, there is a negligible difference in the appraisal of feasibility and a general tendency for impact ratings to move to center. Accordingly, the Mean change from pre- to post-information impact ratings was 0.061 (SD = 0.212), showing that the changes across the set of five solutions effectively cancel themselves out as they approach the center of the canvas. Similarly to the DM vs. CT votes, there does not appear to be a clear, consistent directionality of influence (i.e., higher or lower) of crowdsourced information on DM voting.
As shown in Table 7, there were not any statistically significant changes between pre-assessment and post-assessment of crowdsourced information on either axis or on the DI for any solution. Similarly, there was no change in solution rankings across the pre-assessment and post-assessment voting data. In other words, assessment of the crowdsourced data had no statistical or practical effect on DM voting. Thus, we reject H2, which states that DM votes will converge towards CT votes. Conversely, these results allow us to reject the null hypothesis and accept H3, which states that DMs will not change their votes based on CT inputs.

3.3. What Argument Qualities Most Affected DM Voting?

Finally, we used data collected from both the visual voting canvas and the rhetorical analysis survey to assess whether certain rhetorical qualities were associated with visual voting results. In other words, we used these data to understand whether DMs found solutions argued with certain qualities to be more feasible, impactful, or overall preferable (as measured by DI).
Table 8 shows that the two biggest rhetorical qualities affecting perception of feasibility (i.e., ease of implementation), impact, and overall preferability are the sense of urgency (or Kairos of the argument) and overall agreeability (how much they agree with the asserted solution, regardless of the quality of the argument). Overall agreeability is a high-level measure that required us to identify which specific rhetorical qualities were correlated to agreeability (remembering that a correlation is the degree to which the variability in one quantity is explained by the variability in another). Overall agreement was strongly correlated to the sense of urgency (RS = 0.72, p < 0.01) and, to a lesser extent, to the overall quality of the solution (RS = 0.36, p < 0.01) and the quality of evidence (RS = 0.32, p < 0.01).
Acknowledging these results, we conclude that emphasis should be placed on assisting CTs in developing solution cards that create a sense of urgency (i.e., conveying the sense that it is important that the solution be implemented soon) and provide quality evidence to back their claims. Interestingly, there was no significant correlation between DM overall quality ratings of the solution topics (i.e., the mean DI for all five solutions) and their responses to a Likert item on the UX survey regarding their satisfaction with the quality of VARI outputs (RS = 0.12, p > 0.05).

4. Discussion

In the following sections, we summarize key findings and various constructs to explain their occurrence. Furthermore, we discuss possible directions for future work that apply these findings and enable further insights.

4.1. Key Findings and Discussion

Conducting this experiment and subsequent analysis enabled us to glean several key insights regarding how DMs use crowdsourced knowledge for organizational decision making and several other associated phenomena. The following list summarizes conclusions and key findings from this experiment, and the following paragraphs provide possible rationales and/or implications:
  • CTs and DMs had significantly different mental models regarding the relative impact and feasibility of candidate solutions to an organizational inefficiency. There were significant differences in how ideal each solution was perceived to be; however, there was no consistent pattern as to why. Given these differences, there was an opportunity for the CT-generated knowledge to have an actionable impact on the voting of DMs.
  • Providing crowdsourced organizational knowledge from CTs had no significant impact on DM voting. That is, providing votes and argumentation from CTs caused only minor changes in DM voting, which were not significant in any dimension. These findings add weight to the case for phenomena such as decision inertia, confirmation bias, and anchoring, where DMs seemed to deviate only minimally from perspectives held prior to reviewing the crowdsourced knowledge.
  • The aspect of CT arguments that had the greatest impact on DM voting was whether the solution conveyed an adequate sense of urgency that was commensurate with the inefficiency to be solved (RS = −0.54, p < 0.01). Despite this relationship, more DM voting was explained by whether they agreed or disagreed with the solution (RS = −0.83, p < 0.01). Thus, we found that DM voting was more strongly influenced by whether they inherently agreed with the solution, rather than any specific aspect of the argument (e.g., clarity or quality of evidence presented).
Of the three key findings, the second was the most surprising (although there exists mixed literature suggesting that results could have gone this way, or differently); therefore, we will spend some effort to discuss why crowdsourced knowledge had no significant impact on DM voting. First, we will discuss more mechanical issues (i.e., low-level issues with how the system was designed and/or study was conducted), followed by more psychological constructs that may have affected the outcome. The SUS survey results regarding the DM user interface (n = 11, M = 74.32, SD = 15.93) were well above the overall mean score of 68 [35], allowing us to be confident that these findings (i.e., the lack of influence on decision making) were not affected by issues with the software itself.
Because of the nature of each role (where CTs are affected day-to-day by inefficiencies and DMs are responsible for implementing solutions to inefficiencies), one can reasonably assume that each role will look at the same set of problems and solutions from different viewpoints. As such, we find it likely that CTs will be concerned with how well solutions resolve the problem (i.e., the impact), whereas DMs will be focused on the feasibility of the solutions. If CT argumentation focused on the impact of the solutions and DMs place greater weight on the feasibility, it may explain why DMs were unmoved. We asked CTs (n = 13) in a previous experiment (it should be noted that while there were only 13 responses to this particular survey question, but there were 40 participants in each of the previous studies that generated and voted on the top 5 solutions presented to DMs in this study) and DMs (n = 11) in this experiment to indicate the degree to which their decision making was weighted towards impact and feasibility (which must total 100%). As expected, CTs placed a higher emphasis on Solution Impact (M = 48.08, SD = 20.79) than the DMs (M = 41.27, SD = 16.25), although the difference was not significant, F(1,23) = 0.78, p > 0.05, η = 0.03. Further research with a larger sample is required to determine if this phenomenon played a role.
Next, there may have been a ceiling effect in this particular set of solution topics. As part of the rhetorical analysis survey, DMs were asked, “as it is written, do you agree that this is a valid solution that merits implementation?” DMs were able to respond only with Yes (1) or No (0) to this question. Given the sample of 11 DMs and the set of 5 solution topics, the maximum number of votes could equal 55 (in the event that all DMs wanted to implement all solutions). To our surprise, there were a total of 0 Yes votes in the sample. Said differently, not a single DM thought that a single solution merited implementation. It is possible that DMs did not significantly change their voting after being exposed to CT knowledge because they found this particular set of solutions to not be preferable, and that despite their different relative preferability, they all fell below a certain threshold.
At a higher-level, there may have been an issue with psychological ownership—an individual’s perception of whether they own tangible or intangible outcomes of their efforts [36]. There are at least two types of psychological ownership: Organizational Psychological Ownership (OPO) and Knowledge-Based Psychological Ownership (KPO). Research has shown that increased OPO (the extent to which a person feels ownership of their organization) leads to increased knowledge-sharing behavior. In other words, DMs (who are generally more senior in the organization and have a more personalized perception of what solutions work) may be more likely to rely on their own knowledge when making decisions. This is somewhat supported by UX survey data, where DMs held a slightly negative view on the efficacy of crowdsourcing (i.e., sharing knowledge and collectively making decisions) when given the statement that crowdsourcing is be an effective means to solve problems ((n = 11, M = 2.67, SD = 0.50), where 1 = Strongly Disagree, 5 = Strongly Agree, and 3 = Indifferent). The concepts of OPO and KPO are similar to the concept of “locus of control,” or the degree to which a person attributes outcomes internally or to other external factors [37]. It would be insightful to understand any differences in CTs and DMs regarding OPO, KPO, and locus of control.
Finally, there are two other constructs to be considered: exchange ideology and organizational distance. Exchange ideology is a disposition referring to the expectations of an employee on what they should offer their organization, and what their organization should offer to them [38]. A low exchange ideology characterizes a free exchange of information with little regard to the sharer’s “return on investment,” whereas someone with a high exchange ideology is more likely to show more reserve in their knowledge sharing and focus on how they benefit from the exchange. Research has shown that individuals with a high exchange ideology who engage in participative decision making are more receptive to the idea of sharing information. It is possible that there is a disconnect between the participative decision making by CTs and the late-stage participation by the DMs, where DMs were not part of the formative participative decision making and therefore are less likely to value the organizational knowledge generated by the crowd. Organizational distance refers to the way that information exchange in an organization is shaped by the various networks and reward structures present in the organization [39]; more specifically, knowledge distance refers to the conceptual distance in knowledge transfer between the source and recipient of knowledge. Research suggests that the closer the recipient (DMs, in this case) are to the problem and the people working the problem (the CTs, in this case), the more likely it is that a successful transfer of knowledge will occur. In the case of VARI, DMs being intentionally held distant from CTs (to allow the CTs to work candidly, without fear of reprisal) may have adversely affected knowledge transfer. To a broader degree, DMs do not encounter the same problems as CTs, and the CTs do not deal with the logistics of implementing solutions that DMs do, which may also increase knowledge distance. There is an opportunity in VARI, however, in that continued use could cultivate organizational norms of knowledge exchange.

4.2. Possible Directions for Future Work

Based on overarching research objectives and the results obtained in this study, we propose the following as a non-exhaustive set of possible directions for future research:
  • Repeat this study with a different set of topics/solutions: It is possible that there was not significant movement in DM voting because, despite their relative impact and feasibility, DMs found all the proposed solutions to be inadequate (as evidenced by all DMs unanimously voting no on all five solutions). It is unclear if DMs would be more likely to change their position on topics that they felt were valid solutions to a problem at their organization.
  • Incorporate DM feedback into content templates and repeat the study: The results showed that DMs favored solutions for which they found to have a requisite urgency to the problem at hand. Therefore, we may find that DMs are more likely to change their perceptions and voting if the solutions are posited in a manner that highlights their urgency. Similarly, previous studies showed that there are other considerations toward improving the argumentation templates [11,26].
  • Allow DMs and CTs to co-develop solutions: As previously mentioned, a lynchpin of design thinking is the collaborative approach with all users and stakeholders [10]. The current VARI process explicitly makes both the identification and characterization of problems as well as the development and refinement of solutions a CT task. Future efforts should examine how CT and DM voting changes over time in an iterative process of co-creation, rather than having CTs develop solutions and then presenting them to DMs. There is a reasonable expectation that this would likely increase the DM ownership of that knowledge.

Author Contributions

Conceptualization, S.L.D. and L.R.M.; methodology, S.L.D. and S.B.H.; formal analysis, S.L.D. and S.B.H.; investigation, S.L.D. and S.B.H.; resources, S.L.D.; data curation, S.B.H. and S.L.D.; writing—original draft preparation, S.L.D., L.K.E.A. and L.R.M.; writing—review and editing, L.R.M., S.L.D. and L.K.E.A.; visualization, S.L.D.; supervision, S.L.D. and L.R.M.; project administration, S.L.D. and S.B.H.; funding acquisition, S.L.D. and L.R.M. All authors have read and agreed to the published version of the manuscript.

Funding

This material is based upon work supported by the Office of Naval Research under Contract No. N00014-19-C-1012. Any opinions, findings, and conclusions or recommendations expressed in this material are those of the authors and do not necessarily reflect the views of the Office of Naval Research.

Institutional Review Board Statement

The study was conducted according to the guidelines of the Declaration of Helsinki and approved by the Institutional Review Board of the New England Independent Review Board (study number 1292394, approved on 14 SEP 2020).

Informed Consent Statement

Informed consent was obtained from all subjects involved in the study.

Data Availability Statement

Data are not publicly available due to being proprietary to the participating organization and to protect the confidentiality and anonymity of the participants.

Conflicts of Interest

The authors declare no conflict of interest. The funders had no role in the design of the study; in the collection, analyses, or interpretation of data; in the writing of the manuscript, or in the decision to publish the results.

References

  1. Howe, J. The rise of crowdsourcing. Wired 2006, 14, 1–4. Available online: https://wired.com/2006/06/crowds/ (accessed on 21 December 2021).
  2. Brabham, D.C. Crowdsourcing; The MIT Press: Cambridge, MA, USA, 2013. [Google Scholar]
  3. Quinn, A.J.; Bederson, B.B. Human computation: A survey and taxonomy of a growing field. In Proceedings of the SIGCHI Conference on Human Factors in Computing Systems, Vancouver, BC, Canada, 7–12 May 2011. [Google Scholar]
  4. Wiggins, A.; Crowston, K. From conservation to crowdsourcing: A typology of citizen science. In Proceedings of the 2011 44th Hawaii International Conference on System Sciences, Kauai, HI, USA, 4–7 January 2011; pp. 1–10. [Google Scholar] [CrossRef] [Green Version]
  5. Daniel, F.; Kucherbaev, P.; Capiello, C.; Benatallah, B.; Allabakhsh, M. Quality control in crowdsourcing: A survey of quality attributes, assessment techniques and assurance actions. ACM Comput. Surv. 2018, 51, 1–7. [Google Scholar] [CrossRef] [Green Version]
  6. Hackmann, J.R. Collaborative Intelligence: Using Teams to Solve Hard Problems; Barrett-Koehler Publishers: San Francisco, CA, USA, 2011. [Google Scholar]
  7. Kim, J.; Sterman, S.; Cohen, A.A.B.; Bernstein, M. Mechanical novel: Crowdsourcing complex work through reflection and revision. In Proceedings of the 2017 ACM Conference on Computer Supported Cooperative Work and Social Computing, Portland, OR, USA, 25 February–1 March 2017. [Google Scholar]
  8. Chilton, L.; Little, G.; Edge, D.; Weld, D.S.; Landay, J.A. Cascade: Crowdsourcing taxonomy creation. In Proceedings of the SIGCHI Conference on Human Factors in Computing Systems, Paris, France, 27 April–2 May 2013; pp. 1999–2008. [Google Scholar] [CrossRef]
  9. Drapeau, R.; Chilton, L.B.; Bragg, J.; Weld, D.S. MicroTalk: Using argumentation to improve crowdsourcing accuracy. In Proceedings of the AAAI Conference on Human Computation and Crowdsourcing, Austin, TX, USA, 30 October–3 November 2016. [Google Scholar]
  10. Mercier, H.; Sperber, D. The Enigma of Reason; Harvard University Press: Cambridge, MA, USA, 2017. [Google Scholar]
  11. Dorton, S.L.; Harper, S.B.; Creed, G.A.; Banta, H.G. Up for debate: Effects of formal structure on argumentation quality in a crowdsourcing platform. In International Conference on Human-Computer Interaction; Meiselwitz, G., Ed.; Springer: Berlin/Heidelberg, Germany, 2021; pp. 36–53. [Google Scholar] [CrossRef]
  12. Dorton, S.L.; Maryeski, L.R.; Ogren, L.; Dykens, I.T.; Main, A. A Wargame-Augmented Knowledge Elicitation Method for the Agile Development of Novel Systems. Systems 2020, 8, 27. [Google Scholar] [CrossRef]
  13. Dorton, S.L.; Ganey, H.C.N.; Mintman, E.; Mittu, R.; Smith, M.A.B.; Winters, J. Human-centered alphabet soup: Approaches to systems development from related disciplines. In Proceedings of the Human Factors and Ergonomics Society Annual Meeting, Liverpool, UK, 20–22 October 2021. [Google Scholar]
  14. Liedtka, J. Evaluating the Impact of Design Thinking in Action; Darden Working Paper Series; University of Virginia: Charlottesville, VA, USA, 2018; pp. 1–48. [Google Scholar]
  15. Dorton, S.L.; Maryeski, L.R.; Costello, R.P.; Abrecht, B.R. A Case for User-Centered Design in Satellite Command and Control. Aerospace 2021, 8, 303. [Google Scholar] [CrossRef]
  16. Wilson, J.R. The place and value of mental models. In Proceedings of the Human Factors and Ergonomics Society 45th Annual Meeting, San Diego, CA, USA, 30 July–4 August 2000; pp. 49–52. [Google Scholar] [CrossRef]
  17. Rouse, W.B.; Morris, N.M. On looking into the black box: Prospects and limits in the search for mental models. Psychol. Bull. 1986, 100, 349. [Google Scholar] [CrossRef]
  18. Nobre, F.S. Cognitive Machines in Organizations: Concepts and Implications; Verlag: Berlin, Germany, 2008. [Google Scholar]
  19. Accenture. Overcoming the Barriers to Innovation: Emerging Role of the Chief Innovation Executive. 2008. Available online: http://www.innovationresource.com/wp-content/uploads/2012/07/Accenture-Study-of-Chief-Innovation-Officers.pdf (accessed on 22 December 2021).
  20. Carrington, D.J.; Combe, I.A.; Mumford, M.D. Cognitive shifts within leader and follower teams: Where consensus develops in mental models during an organizational crisis. Leadersh. Q. 2019, 30, 335–350. [Google Scholar] [CrossRef]
  21. Jung, D.; Stabler, J.; Weinhardt, C. Investigating cognitive foundations of inertia in decision-making. KIT Sci. Work. Pap. Discuss. Pap. HeiKaMaxY 2018, 10, 1–11. [Google Scholar] [CrossRef]
  22. Alós-Ferrer, C.; Hügelschäfer, S.; Li, J. Inertia and Decision Making. Front. Psychol. 2016, 7, 1–9. [Google Scholar] [CrossRef] [PubMed] [Green Version]
  23. Brown, A.; Karthaus, C.; Rehak, L.; Adams, B. The Role of Mental Models in Dynamic Decision-Making. 2009. Available online: https://apps.dtic.mil/dtic/tr/fulltext/u2/a515438.pdf (accessed on 21 December 2021).
  24. Besnard, D.; Greathead, D.; Baxter, G. When mental models go wrong: Co-occurences in dynamic, critical systems. Int. J. Hum. Comput. Stud. 2004, 60, 117–128. [Google Scholar] [CrossRef] [Green Version]
  25. Brewer, N.T.; Chapman, G.B. The fragile basic anchoring effect. J. Behav. Decis. Mak. 2002, 15, 65–77. [Google Scholar] [CrossRef]
  26. Harper, S.B.; Dorton, S.L.; Creed, G.A. Design considerations for the development of crowdsourcing systems. In Proceedings of the Human Factors and Ergonomics Society Annual Meeting, Baltimore, MD, USA, 3–8 October 2021; pp. 432–436. [Google Scholar] [CrossRef]
  27. Brooke, J. SUS: A “quick and dirty” usability scale. In Usability Evaluation in Industry; Jordan, P.W., Thomas, B., Werdmeester, B.A., McClelland, I.L., Eds.; Taylor & Francis: London, UK, 1996; pp. 189–194. [Google Scholar]
  28. Cohen, D.H. Evaluating arguments and making meta-arguments. Informal Log. 2001, 21, 73–84. [Google Scholar] [CrossRef]
  29. Rife, M.C. Ethos, Pathos, Logos, Kairos: Using a Rhetorical Heuristic to Mediate Digital-Survey Recruitment Strategies. IEEE Trans. Dependable Secur. Comput. 2010, 53, 260–277. [Google Scholar] [CrossRef]
  30. Hunt, K. Establishing a presence on the world wide web: A rhetorical approach. Tech. Comm. 1996, 43, 376–387. [Google Scholar]
  31. Higgins, C.; Walker, R. Ethos, logs, pathos: Strategies of persuasion in social/environmental reports. Acctng. Forum 2012, 36, 194–208. [Google Scholar] [CrossRef]
  32. Wachsmuth, H.; Stede, M.; El Baff, R.; Al-Khatib, K.; Skeppstedt, M.; Stein, B. Argumentation synthesis following rhetorical strategies. In Proceedings of the 27th International Conference on Computational Linguistics, Santa Fe, NM, USA, 20–26 August 2018; Available online: https://www.aclweb.org/anthology/C18-1318 (accessed on 21 December 2021).
  33. Kotter, J. Leading Change; Harvard Business Review Press: Boston, MA, USA, 2012. [Google Scholar]
  34. Yoon, K.P.; Hwang, C. Multiple Attribute Decision Making: An Introduction; Sage: Thousand Oaks, CA, USA, 1995. [Google Scholar]
  35. Brooke, J. SUS: A retrospective. J. Usability Stud. 2013, 8, 29–40. [Google Scholar]
  36. Li, J.; Yuan, L.; Ning, L.; Li-Ying, J. Knowledge sharing and affective commitment: The mediating role of psychological ownership. J. Knowl. Manag. 2015, 19, 1146–1166. [Google Scholar] [CrossRef] [Green Version]
  37. Spector, P.E. Behaviors in organizations as a function of employee’s locus of control. Psychol. Bull. 1982, 91, 482. [Google Scholar] [CrossRef]
  38. Lin, C. To share or not to share: Modeling knowledge sharing using exchange ideology as a moderator. Pers. Rev. 2007, 36, 457–475. [Google Scholar] [CrossRef]
  39. Cummings, J.L.; Teng, B.-S. Transferring R&D knowledge: The key factors affecting knowledge transfer success. J. Eng. Technol. Manag. 2003, 20, 39–68. [Google Scholar] [CrossRef]
Figure 1. User interface for voting and providing justifications.
Knowledge 02 00002 g001
Figure 2. User interface for assessing CT votes and justifications.
Knowledge 02 00002 g002
Figure 3. Median Solution Placement for CTs and DMs.
Knowledge 02 00002 g003
Figure 4. Median Solution Placement for DMs Pre- and Post-Assessment of CT Votes and Justifications.
Knowledge 02 00002 g004
Table 1. Organizational areas and roles of recruited DMs.
Organizational AreaRoles
Executive LeadershipC-Suite 1
Office of the Technical Director
Board of Directors
InfrastructureInformation Technology (IT) Department
Facilities Management
Security
Support StaffContracts
Accounting
Human Resources and Benefits
Business Development
1 Includes positions such as Chief Executive Officer (CEO), Chief Operating Officer (COO), Chief Financial Officer (CFO), etc.
Table 2. Topics (crowdsourced solutions) included for consideration.
Topic IDTopic/Solution Title and Description
T18Eliminate Groups, Form Departments: The [Organization] should eliminate the group structure and form departments of expertise instead.
T26Face-to-Face: Monthly bull sessions between project leads to go over what they are doing.
T38Employee Apps Database: This is used in particular to stem the inefficiency of remaking the same applications. This is an app database with the name, description, and point of contact.
T43Software Development CZAR: Identify a single person to manage all external software development processes and procedures.
T45Punish Isolationists 1: Provide significant discretionary incentives to groups that do more cross-group proposals/work and penalties for those who do not.
1 This topic was not generated via crowdsourcing but was inserted in a previous experiment by the research team as a deliberately contentious topic to spur argumentation.
Table 3. Rhetorical Analysis and Quality Measures.
MeasureDefinition
ClarityThe degree to which the information provided is logically structured and understandable.
Quality of EvidenceThe degree to which the evidence provided supports the asserted solution.
Credibility of ContributorsThe quality of the intelligence, character, and goodwill of the people who contributed to this solution.
RelevanceHow personally relevant this solution is to you (i.e., how much it affects you).
UrgencyAs it is written, how well does the solution match the urgency of the inefficiency it aims to resolve?
Overall QualityRegardless of whether you agree with the solution, what is the overall quality of the solution, as presented?
Overall AgreeabilityRegardless of the quality of the solution, to what extent do you agree with the solution, as presented?
VoteAs it is written, this is a valid solution that merits implementation.
Table 4. Median Positions and Distances for CT and DM Samples.
Soln.Contributor (CT) *Decision Maker (DM) **Difference
Ease (X)Impact (Y)DIEase (X)Impact (Y)DIEase (X)Impact (Y)DI
T18−0.7720.0811.996−0.858−0.4092.332−0.086−0.4900.336
T260.388−0.2211.3660.6870.6200.4920.2990.841−0.873
T380.159−0.1931.4600.2660.2731.0330.1070.466−0.427
T43−0.228−0.0341.605−0.152−0.2281.6840.076−0.1940.078
T45−0.4110.3351.5600.314−0.5741.7170.725−0.9090.157
* n = 25; ** n = 11; Note. Median positions and distances are reported. Soln. = Solution.
Table 5. ANOVA Results Comparing CT vs. DM Voting.
SolutionEase of Imp. (X)Impact (Y)Dist. to Ideal (DI)
FpηFpηFpη
T188.78<0.010.211.33>0.050.047.93<0.010.19
T262.99>0.050.086.42<0.050.167.96<0.010.19
T383.04>0.050.083.49>0.050.096.05<0.050.15
T430.69>0.050.020.04>0.050.000.18>0.050.01
T457.79<0.010.1914.23<0.010.300.10>0.050.00
Note. Significant results are shown in bold. All F values were calculated as F(1,35). Imp. = Implementation; Dist. = Distance.
Table 6. Median Positions and Distances for DM Pre- and Post-Assessment Samples.
Soln.Pre-AssessPost-AssessDifference
Ease (X)Impact (Y)DIEase (X)Impact (Y)DIEase (X)Impact (Y)DI
T18−0.858−0.7442.548−0.858−0.4092.3320.0000.335−0.216
T260.8540.6830.3490.6870.6200.492−0.167−0.0630.143
T380.5690.2680.8490.2660.2731.033−0.3030.0050.184
T430.011−0.0411.436−0.152−0.2281.684−0.163−0.1870.248
T45−0.125−0.7912.1150.314−0.5741.7170.4390.217−0.398
Note. Soln. = Solution; Ease = Ease of Implementation.
Table 7. ANOVA Results Comparing Pre- vs. Post-Assessment DM Voting.
SolutionEase of Imp. (X)Impact (Y)Dist. to Ideal (DI)
FpηFpηFpη
T180.68>0.050.030.83>0.050.040.23>0.050.01
T260.21>0.050.010.08>0.050.000.03>0.050.00
T380.17>0.050.010.12>0.050.010.05>0.050.00
T430.61>0.050.030.22>0.050.010.43>0.050.02
T450.13>0.050.010.06>0.810.000.25>0.050.01
Note. All F values were calculated as F(1,21). Imp. = implementation; Dist. = Distance.
Table 8. Correlations of Argument Quality Measures and Visual Voting Measures.
Quality MeasureEase of Imp. (X)Impact (Y)Dist. To Ideal (DI)
Clarity−0.05−0.150.17
Quality Of Evidence0.180.17−0.19
Asserter Credibility−0.010.06−0.01
Personal Relevance−0.12−0.080.09
Urgency0.35 *0.54 *−0.54 *
Overall Quality0.080.08−0.08
Overall Agreeability0.59 *0.79 *−0.83 *
* Significant to the p < 0.01 level.
Publisher’s Note: MDPI stays neutral with regard to jurisdictional claims in published maps and institutional affiliations.

