
Comparative Study of Fatty Acid Composition of Muscles of Atlantic Cod (Gadus morhua Linnaeus, 1758) with Natural Diet and Feeding near Salmon Farms
 , ,
, ,  and
and
Abstract
1. Introduction
2. Materials and Methods
2.1. Study Area and Survey Design
2.2. Sampling
2.3. Laboratory Fatty Acid Analyses
2.4. Data Analysis
3. Results
4. Discussion
Supplementary Materials
Author Contributions
Funding
Institutional Review Board Statement
Informed Consent Statement
Data Availability Statement
Conflicts of Interest
Appendix A

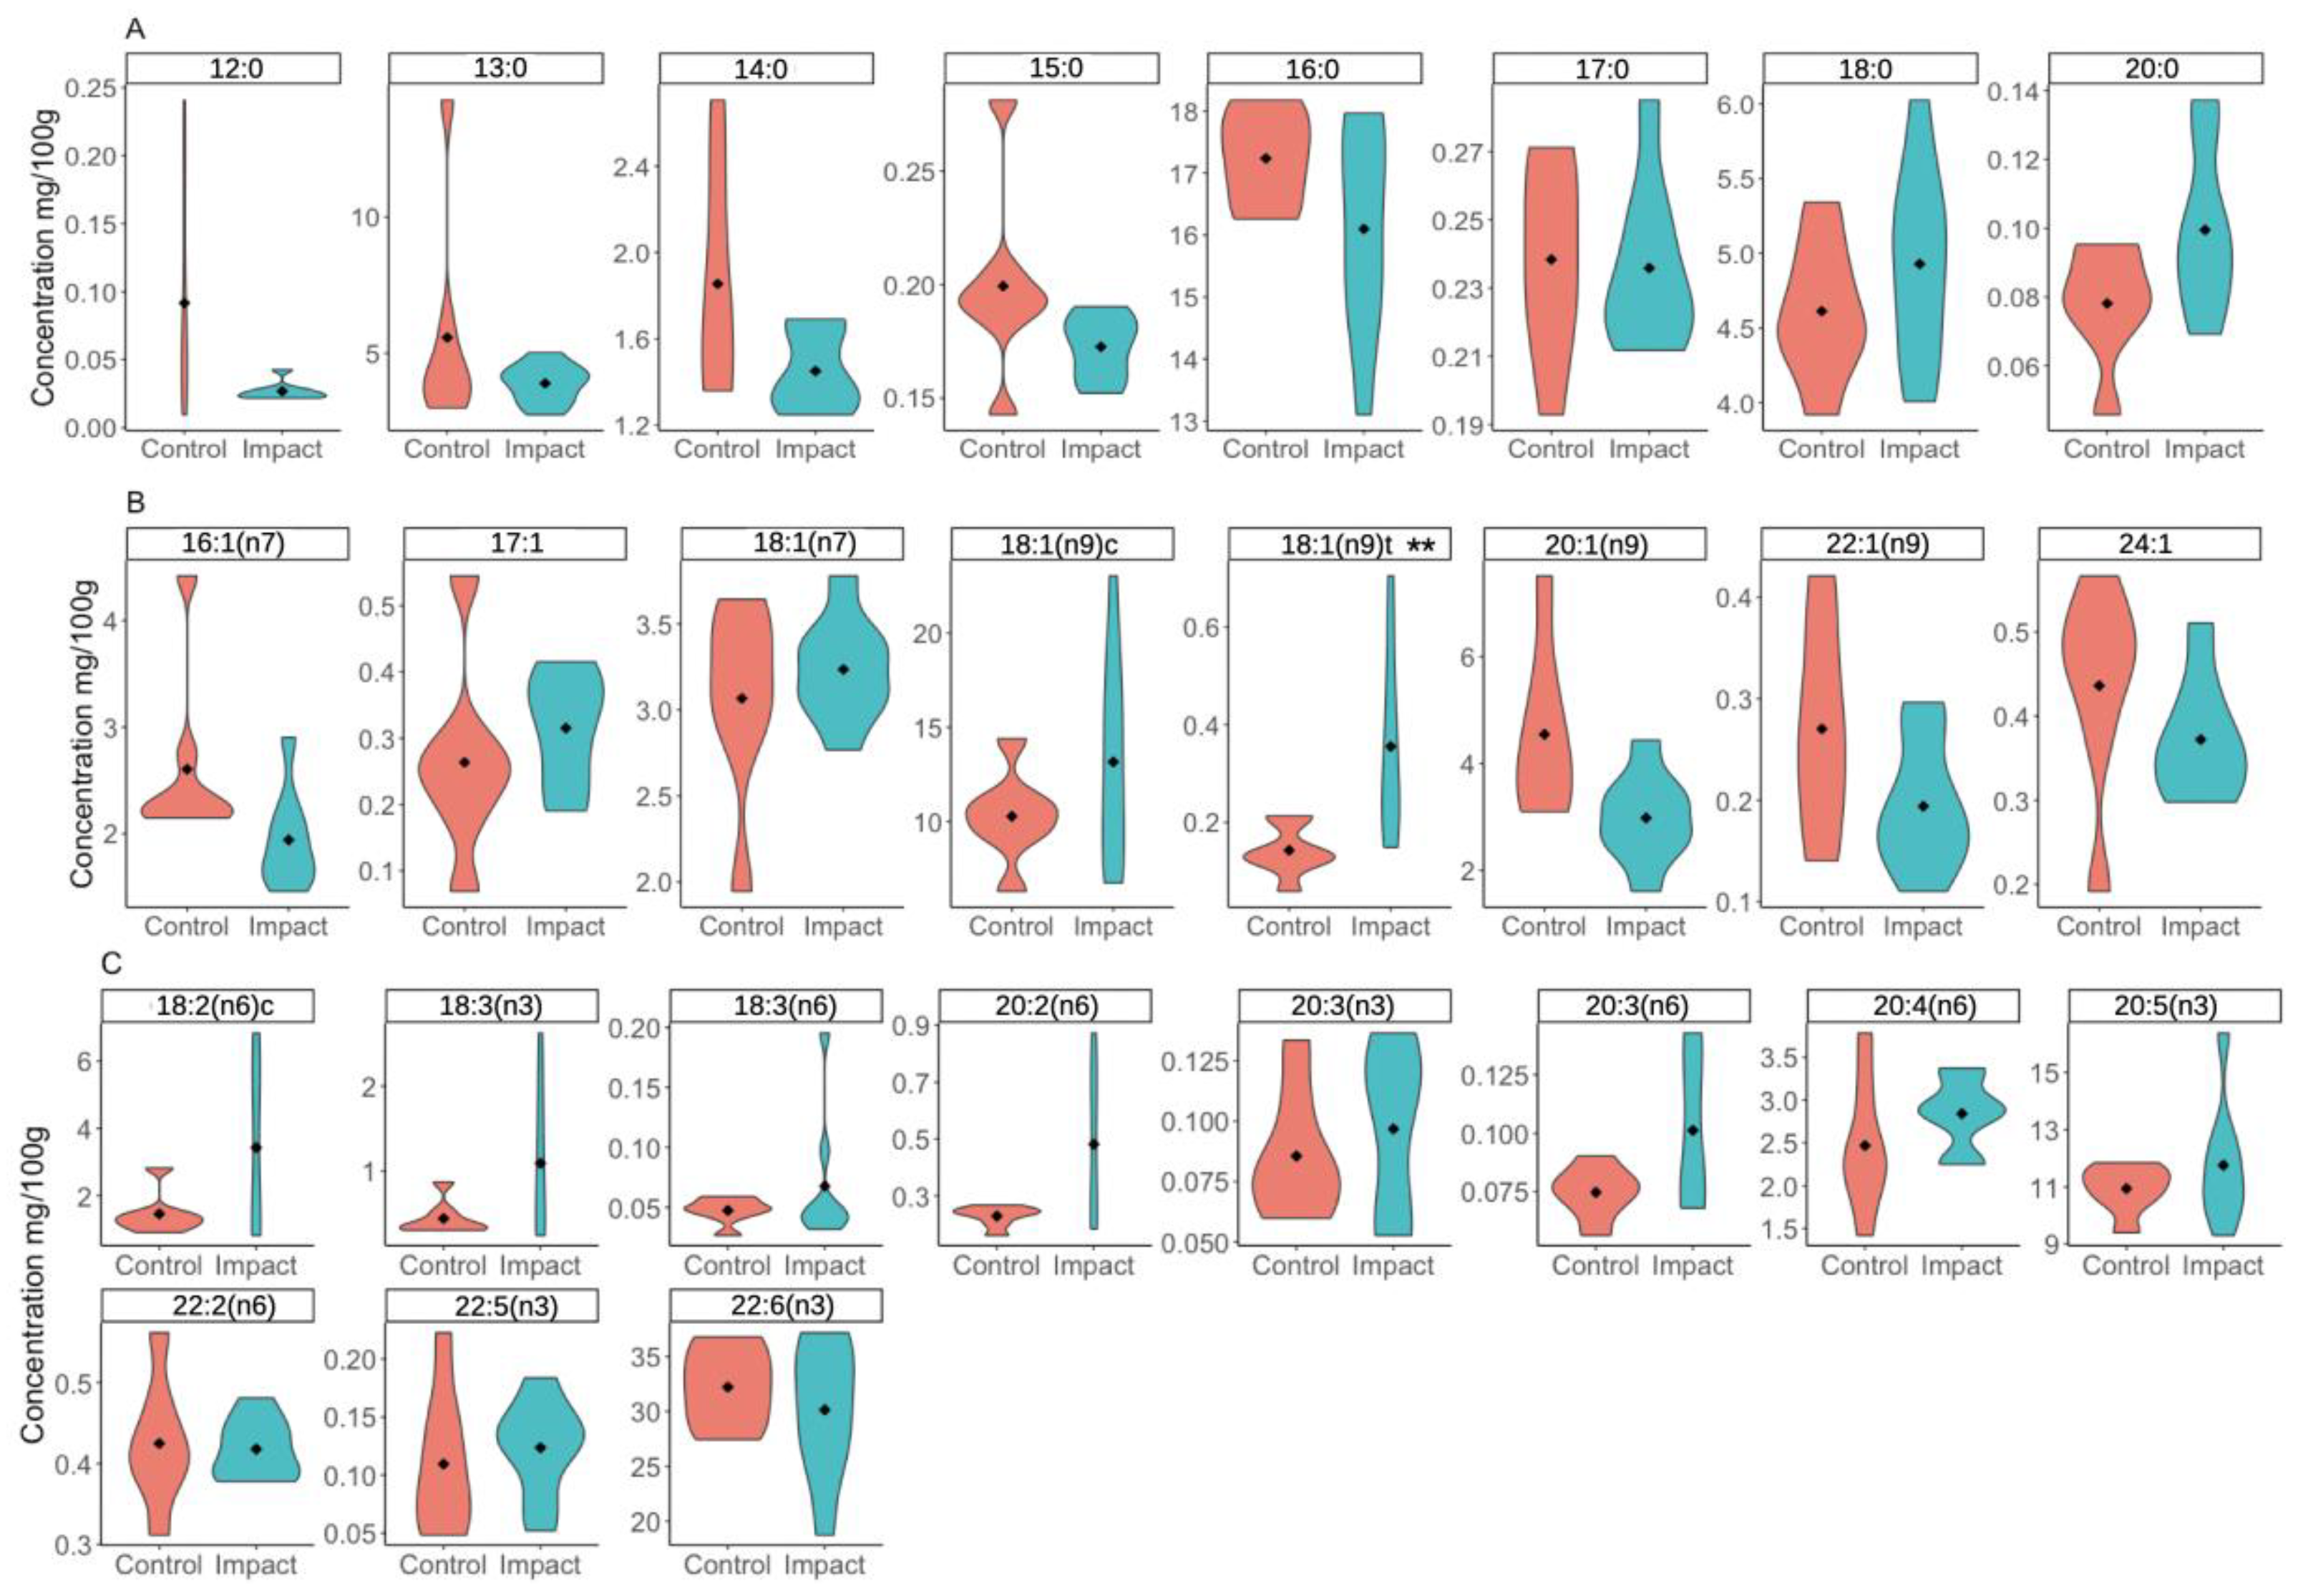
| Fatty Acid | Name(s) | p-Value | Impact | Control |
|---|---|---|---|---|
| 12:00 | Lauric_docecanoic | 0.072 | 0.0009 (0.0005) | 0.0025 (0.0023) |
| 13:00 | Tridecanoic_trideculic | 0.34 | 0.12 (0.05) | 0.17 (0.13) |
| 14:00 | Myristic_tetradecanoic | 0.34 | 0.046 (0.017) | 0.056 (0.023) |
| 15:00 | Pentadecanoic_Pentadecylic | 0.46 | 0.0054 (0.0013) | 0.0059 (0.0018) |
| 16:00 | Palmitic_hexadecanoic | 0.87 | 0.50 (0.08) | 0.50 (0.06) |
| 16:1(n7) | Palmitoleic | 0.15 | 0.06 (0.03) | 0.08 (0.04) |
| 17:00 | Margaric_Heptadecanoic | 0.87 | 0.0074 (0.0018) | 0.0069 (0.0007) |
| 17:01 | cis_10_Heptadecenoic | 0.15 | 0.010 (0.005) | 0.007 (0.004) |
| 18:00 | Stearic | 0.094 | 0.151 (0.022) | 0.134 (0.012) |
| 18:1(n9)t | Elaidic | 0.009 | 0.011 (0.007) | 0.004 (0.001) |
| 18:1(n9)c | Oleic | 0.61 | 0.45 (0.32) | 0.30 (0.09) |
| 18:1(n7) | Vaccenic | 0.61 | 0.104 (0.038) | 0.090 (0.021) |
| 18:2(n6)c | Linoleic | 0.69 | 0.13 (0.12) | 0.04 (0.02) |
| 20:00 | Arachidic_icosanoic | 0.072 | 0.0031 (0.0009) | 0.0023 (0.0006) |
| 18:3(n6) | gamma_Linolenic_Acid_GLA | 0.54 | 0.0020 (0.0013) | 0.0014 (0.0004) |
| 20:1(n9) | cis_11_Eicosenoic_gondoic | 0.15 | 0.09 (0.04) | 0.14 (0.07) |
| 18:3(n3) | Linolenic | 0.61 | 0.041 (0.044) | 0.013 (0.007) |
| 20:2(n6) | Eicosadienoic | 0.4 | 0.016 (0.012) | 0.007 (0.002) |
| 20:3(n6) | Eicosatrienoic_3n6 | 0.28 | 0.0032 (0.0014) | 0.0022 (0.0005) |
| 22:1(n9) | Erucic | 0.46 | 0.006 (0.003) | 0.008 (0.004) |
| 20:3(n3) | Eicosatrienoic_3n3 | 0.69 | 0.0032 (0.0018) | 0.0025 (0.0007) |
| 20:4(n6) | Arachidonic | 0.15 | 0.089 (0.022) | 0.070 (0.016) |
| 22:2(n6) | Docosadienoic | 0.87 | 0.013 (0.004) | 0.013 (0.004) |
| 20:5(n3) | Eicosapentaenoic_EPA | 0.19 | 0.36 (0.05) | 0.32 (0.05) |
| 24:01:00 | Nervonic | 0.34 | 0.012 (0.005) | 0.013 (0.004) |
| 22:4(n3) | Docosatetraenoic | 0.47 | 0 | 0.0026 |
| 22:5(n3) | Docosapentaenoic | 0.34 | 0.0039 (0.0016) | 0.0031 (0.0015) |
| 22:6(n3) | Docosahexaenoic_DHA | 0.78 | 0.91 (0.06) | 0.94 (0.13) |
References
- Natale, F.; Hofherr, J.; Fiore, G.; Virtanen, J. Interactions between aquaculture and fisheries. Mar. Policy 2013, 38, 205–213. [Google Scholar] [CrossRef]
- Carss, D.N. Concentrations of wild and escaped fishes immediately adjacent to fish farm cages. Aquaculture 1990, 90, 29–40. [Google Scholar] [CrossRef]
- Dempster, T.; Uglem, I.; Sanchez-Jerez, P.; Fernandez-Jover, D.; Bayle-Sempere, J.; Nilsen, R.; Bjørn, P.A. Coastal salmon farms attract large and persistent aggregations of wild fish: An ecosystem effect. Mar. Ecol. Prog. Ser. 2009, 385, 1–14. [Google Scholar] [CrossRef]
- Fernandez-Jover, D.; Arechavala-Lopez, P.; Martinez-Rubio, L.; Tocher, D.R.; Bayle-Sempere, J.T.; Lopez-Jimenez, J.A.; Martinez-Lopez, F.J.; Sanchez-Jerez, P. Monitoring the influence of marine aquaculture on wild fish communities: Benefits and limitations of fatty acid profiles. Aquac. Environ. Interact. 2011, 2, 39–47. [Google Scholar] [CrossRef]
- Bøhn, T.; Strøm, J.F.; Sanchez-Jerez, P.; Keeley, N.B.; Johansen, T.; Gjelland, K.Ø.; Sandlund, N.; Sæther, B.S.; Sætra, I.; Olsen, E.M.; et al. Ecological interactions between farmed Atlantic salmon and wild Atlantic cod populations in Norway: A review of risk sources and knowledge gaps. Rev. Aquac. 2024, 16, 1333–1350. [Google Scholar] [CrossRef]
- Menozzi, D.; Nguyen, T.T.; Sogari, G.; Taskov, D.; Lucas, S.; Castro-Rial, J.L.S.; Mora, C. Consumers’ Preferences and willingness to pay for fish products with health and environmental labels: Evidence from five european countries. Nutrients 2020, 12, 2650. [Google Scholar] [CrossRef] [PubMed]
- Meier, S.; van der Meeren, T.; Skjæraasen, J.E.; Bannister, R.J.; Rasinger, J.D.; Karlsen, Ø. Terrestrial fatty acids from feed oil in feed for farmed salmonids are transferred to the liver, gonads, and muscle of wild Atlantic cod (Gadus morhua). ICES J. Mar. Sci. 2023, 80, 1143–1154. [Google Scholar] [CrossRef]
- Ruxton, C.H.S.; Reed, S.C.; Simpson, M.J.A.; Millington, K.J. The health benefits of omega-3 polyunsaturated fatty acids: A review of the evidence. J. Hum. Nutr. Diet. 2004, 17, 449–459. [Google Scholar] [CrossRef] [PubMed]
- Folch, J.; Lee, M.; Stanley, G.A. A simple method for the isolation and purification of total lipids from animal tissues. J. Biol. Chem. 1957, 226, 497–509. [Google Scholar] [CrossRef] [PubMed]
- Beck, M. Ggord: Ordination Plots with ggplot2. R package Version 1.1.7. 2022. Available online: https://fawda123.github.io/ggord/ (accessed on 1 December 2023).
- Sjoberg, D.D. gtsummary: Presentation-Ready Data Summary and Analytic Result Tables. 2023. Available online: https://cran.r-project.org/web/packages/gtsummary/index.html (accessed on 20 April 2024).
- Johansen, T.; Besnier, F.; Quintela, M.; Jorde, P.E.; Glover, K.A.; Westgaard, J.I.; Dahle, G.; Lien, S.; Kent, M.P. Genomic analysis reveals neutral and adaptive patterns that challenge the current management regime for East Atlantic cod Gadus morhua L. Evol. Appl. 2020, 13, 2673–2688. [Google Scholar] [CrossRef] [PubMed]
- Andersen, L.B.; Grøsvik, B.E.; Karlsen, Ø.; Kvamme, B.O.; Hansen, P.K.; Husa, V.; Sandlund, N.; Stien, L.H.; Solberg, M.F. Risikorapport Norsk Fiskeoppdrett 2023. Produksjonsdødelighet Hos Oppdrettsfisk og Miljøeffekter av Norsk Fiskeoppdrett. Rapport fra Havforskningen. Available online: https://www.hi.no/hi/nettrapporter/rapport-fra-havforskningen-2023-6 (accessed on 10 March 2024).
- Uglem, I.; Toledo-Guedes, K.; Sanchez-Jerez, P.; Ulvan, E.M.; Evensen, T.; Sæther, B.S. Does waste feed from salmon farming affect the quality of saithe (Pollachius virens L.) attracted to fish farms? Aquac. Res. 2020, 51, 1720–1730. [Google Scholar] [CrossRef]
- Routray, W.; Dave, D.; Ramakrishnan, V.V.; Murphy, W. Production of High Quality Fish Oil by Enzymatic Protein Hydrolysis from Cultured Atlantic Salmon By-Products: Investigation on Effect of Various Extraction Parameters Using Central Composite Rotatable Design. Waste Biomass Valorization 2018, 9, 2003–2014. [Google Scholar] [CrossRef]
- Link, J.S.; Bogstad, B.; Sparholt, H.; Lilly, G.R. Trophic role of Atlantic cod in the ecosystem. Fish Fish. 2009, 10, 58–87. [Google Scholar] [CrossRef]
- Strøm, J.F.; Bøhn, T.; Skjæraasen, J.E.; Gjelland, K.Ø.; Karlsen, Ø.; Johansen, T.; Hanebrekke, T.; Bjørn, P.A.; Olsen, E.M. Movement diversity and partial sympatry of coastal and Northeast Arctic cod ecotypes at high latitudes. J. Anim. Ecol. 2023, 92, 1966–1978. [Google Scholar] [CrossRef] [PubMed]
- Uglem, I.; Dempster, T.; Bjørn, P.A.; Sanchez-Jerez, P.; Økland, F. High connectivity of salmon farms revealed by aggregation, residence and repeated movements of wild fish among farms. Mar. Ecol. Prog. Ser. 2009, 384, 251–260. [Google Scholar] [CrossRef]
- Critselis, E.; Tsiampalis, T.; Damigou, E.; Georgousopoulou, E.; Barkas, F.; Chrysohoou, C.; Skoumas, J.; Pitsavos, C.; Liberopoulos, E.; Tsioufis, C.; et al. High fish intake rich in n-3 polyunsaturated fatty acids reduces cardiovascular disease incidence in healthy adults: The ATTICA cohort study (2002–2022). Front. Physiol. 2023, 14, 1158140. [Google Scholar] [CrossRef] [PubMed]

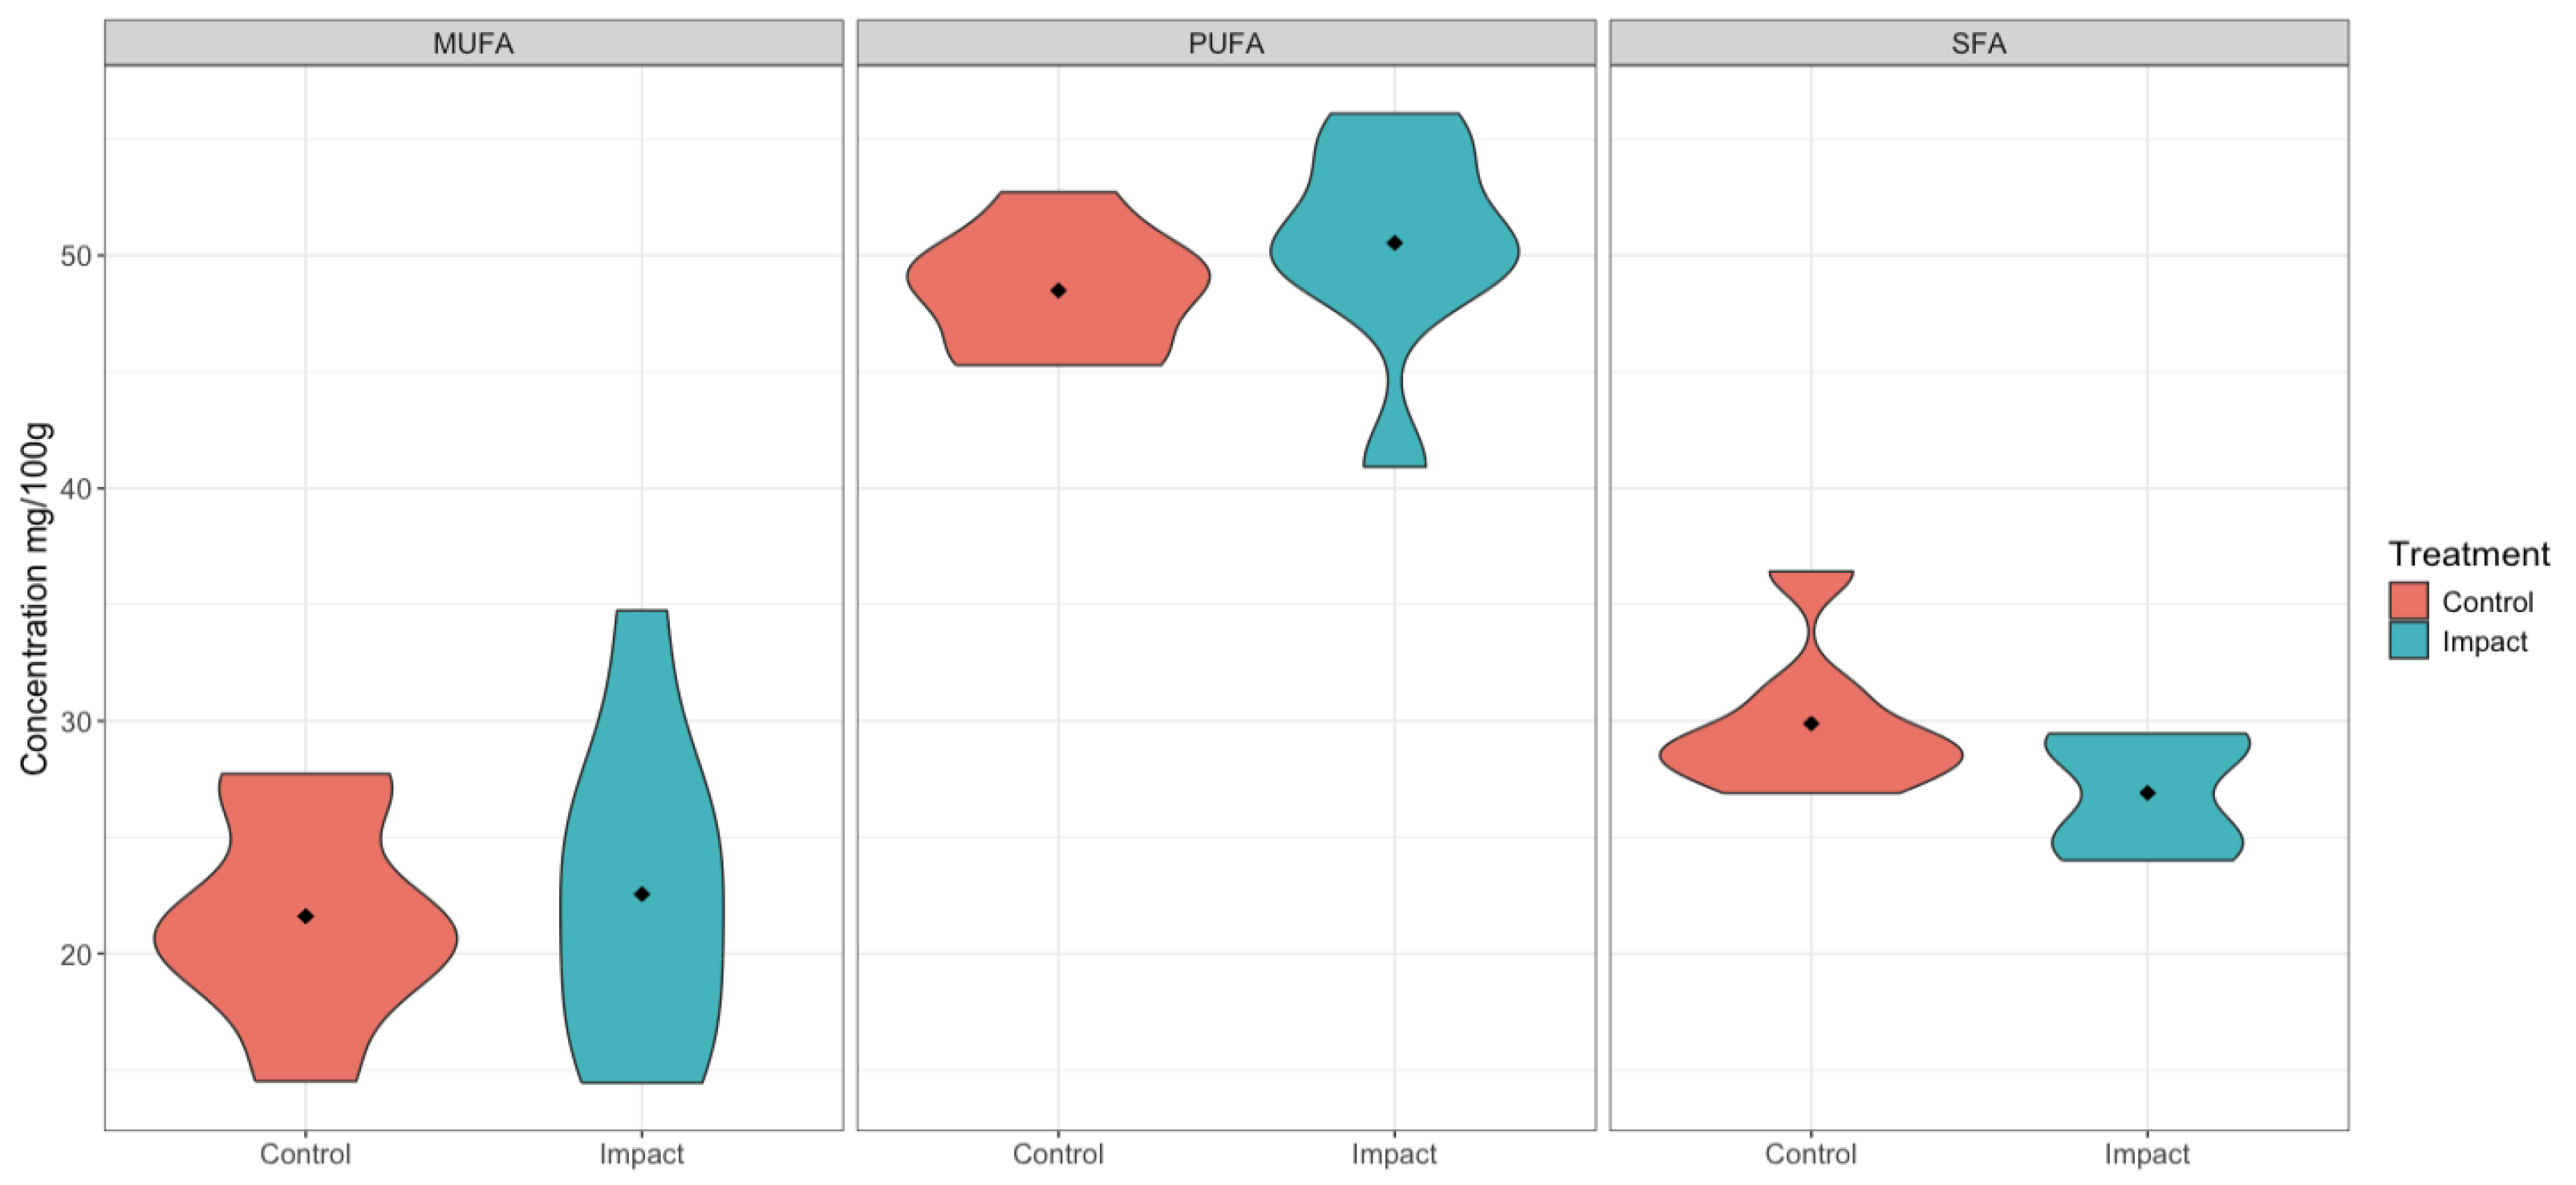

| p-Value | Impact | Control | Fatty Acid Categories |
|---|---|---|---|
| 0.96 | 0.76 (0.44) | 0.64 (0.20) | MUFA |
| 0.46 | 1.56 (0.27) | 1.42 (0.16) | PUFA |
| 0.46 | 0.83 (0.16) | 0.88 (0.16) | SFA |
Disclaimer/Publisher’s Note: The statements, opinions and data contained in all publications are solely those of the individual author(s) and contributor(s) and not of MDPI and/or the editor(s). MDPI and/or the editor(s) disclaim responsibility for any injury to people or property resulting from any ideas, methods, instructions or products referred to in the content. |
© 2024 by the authors. Licensee MDPI, Basel, Switzerland. This article is an open access article distributed under the terms and conditions of the Creative Commons Attribution (CC BY) license (https://creativecommons.org/licenses/by/4.0/).
Share and Cite
Sanchez-Jerez, P.; Atalah, J.; Sætra, I.M.; Bøhn, T.; Saether, B.-S.; Johansen, T.; Keeley, N.; van der Meeren, T.; Bjørn, P.A. Comparative Study of Fatty Acid Composition of Muscles of Atlantic Cod (Gadus morhua Linnaeus, 1758) with Natural Diet and Feeding near Salmon Farms. Aquac. J. 2024, 4, 246-254. https://doi.org/10.3390/aquacj4040018
Sanchez-Jerez P, Atalah J, Sætra IM, Bøhn T, Saether B-S, Johansen T, Keeley N, van der Meeren T, Bjørn PA. Comparative Study of Fatty Acid Composition of Muscles of Atlantic Cod (Gadus morhua Linnaeus, 1758) with Natural Diet and Feeding near Salmon Farms. Aquaculture Journal. 2024; 4(4):246-254. https://doi.org/10.3390/aquacj4040018
Chicago/Turabian StyleSanchez-Jerez, Pablo, Javier Atalah, Ingeborg Mathisen Sætra, Thomas Bøhn, Bjorn-Steinar Saether, Torild Johansen, Nigel Keeley, Terje van der Meeren, and Pål Arne Bjørn. 2024. "Comparative Study of Fatty Acid Composition of Muscles of Atlantic Cod (Gadus morhua Linnaeus, 1758) with Natural Diet and Feeding near Salmon Farms" Aquaculture Journal 4, no. 4: 246-254. https://doi.org/10.3390/aquacj4040018
APA StyleSanchez-Jerez, P., Atalah, J., Sætra, I. M., Bøhn, T., Saether, B.-S., Johansen, T., Keeley, N., van der Meeren, T., & Bjørn, P. A. (2024). Comparative Study of Fatty Acid Composition of Muscles of Atlantic Cod (Gadus morhua Linnaeus, 1758) with Natural Diet and Feeding near Salmon Farms. Aquaculture Journal, 4(4), 246-254. https://doi.org/10.3390/aquacj4040018