Article

Effects of Alternative and Sustainable Ingredients on Rainbow Trout (Oncorhynchus mykiss) Growth, Muscle Composition and Health

1
Aquaculture Program, Centre de Sant Carles de la Ràpita (IRTA-SCR), Institute of Agrifood Research and Technology (IRTA), 43540 Sant Carles de la Rapita, Spain
2
Anfaco-Cecopesca, Crta. Colexio Universitario 16, 36310 Vigo, Spain
3
Technological Center Cartif, Parque Tecnológico de Boecillo, 47151 Boecillo, Spain
*
Author to whom correspondence should be addressed.
Aquac. J. 2022, 2(2), 37-50; https://doi.org/10.3390/aquacj2020004
Submission received: 22 February 2022 / Revised: 5 April 2022 / Accepted: 12 April 2022 / Published: 20 April 2022

Abstract

:
Aquaculture supplies more than 50% of the total fish consumed by the world population. It is considered by FAO authorities that it will be the main source of fishery products by 2030. These positive data are contradicted by the fact that aquaculture relies too much on fish oil and fish meal as essential ingredients for food, which exerts significant pressure on marine ecosystems. The present study was planned to look for alternative ingredients in aquafeeds and three different ingredients were evaluated for the first time in juveniles of rainbow trout: (1) House cricket, Acheta domesticus, meal (DI) as a quality protein source; (2) a mixture of four marine microalgae species (DM), as an important source of protein and lipids; (3) protein and lipid fraction recovered from cooking water from canned tuna manufacturing processes (DP&L); and (4) a mix of the three ingredients (DMIX). All the feeds assayed were compared with a commercial feed (DC). Results showed that the formulated alternative feeds had different effects on the growth of the fish. DI and DP&L have a similar growth performance to the control, while the fish fed with DM and the DMix have a slightly lower growth (p < 0.05). No significant differences were observed in terms of FCR (Feed Conversion Ratio) and PER (Protein Efficiency Ratio) (p < 0.05). Fish muscle composition did not show any differences in moisture, protein, lipids and carbohydrates content. Only a significant difference was detected in ash and in saturated fatty acid (SFA) content (p < 0.05). The hepatosomatic index (HSI) was significantly reduced in DI compared to that observed for the DC (p < 0.05), whereas the viscerosomatic index (VSI) was significantly higher in DM. The nutritional value of the rainbow trout muscle at the end of the study shows that DM fed fish showed the highest PUFA/SFA ratio and the lowest atherogenic index (AI), whereas DMIX showed the lowest PUFA/SFA and the highest n-3/n-6 and AI. No differences were observed among diets in the thrombogenic index (TI) values. Any of these ingredients might be used as alternative sources of protein in feeds for fish aquaculture because no negative effects were detected on fish growth, muscle composition, fish health or final nutritional value, except in the case of microalgae, which needs more research to adjust its inclusion rate in the feed.

Graphical Abstract

1. Introduction

According to FAO last report of fisheries and aquaculture production, the aquaculture sector is growing in a sustained way with a prevision to reach more than 54% of the world production in 2030 with more than 109 million tons. This prevision assumes an increase of fish meal (FM) and fish oil (FO) demand because they are considered essential ingredients for aquafeed formulations [1]. Both ingredients continue to be very important as feed ingredients in aquaculture [2].
The demand predicted for FM and FO clashes with the evolution of their production and the volatility in their price observed during the last decade [3], dealing with a negative balance between the needs and the expected growth of the aquaculture sector.
New alternative ingredients have been studied and included in aquafeeds during recent years. Protein and oil derived from plants are the main alternative to FM and FO in fish feeds driven by their higher abundance and lower price compared to FM and FO [4]. However, protein and oil derived from plants contain anti-nutritional factors that produce inflammation problems in fish digestive tracts; they also have low protein content and imbalances in the essential amino acid profile, and low palatability of the feeds. They also produce a high environmental impact due to the amounts of energy, water and land needed for cultivation and growing [5,6,7].
Research on FM and FO alternatives carried out during the last decade were mostly oriented to soy-derived products [4,8,9,10], with satisfactory results in terms of growth using different substitution levels in the feeds for both marine and freshwater fishes. Only 19 of the available publications were oriented to insect meal and only 16% were related to the use of microalgae, ingredients with a high potential in the aquafeed industry [11,12,13,14]. Recently, ingredients derived from food industry by-products are being considered, taking into account the circular economy actions of the EU and their high availability and composition [15,16].
The wastes generated in tuna processing plants (heads, fins, bones and red meat) are generally used to produce fishmeal for the animal feed industry [17]. In the tuna canning industry, cooking is an indispensable step and the stickwater (SW) generated represents 60% of the processed fish weight [18,19], and approximately 4% water-soluble protein [20]. Tuna cooking water, estimated according to production calculations of more than 1,500,000 m3 in Spain and specifically in the Galicia region, is still being managed as effluents in the processing plants and their treatment and disposal cost near 2 €/m3. Few studies have been published considering the recovery and valorization of these effluents [21].
Data from a previous project carried out in ANFACO-CECOPESCA showed that this water contains 6% of protein and 1.8% of oil. The quality of the protein, lipids and bioactive compounds recovered from tuna cooking water were studied by Martinez-Montaño, et al. [22], showing that more than 70% of the protein and 12% of the lipids were precipitated by HCl. Thus, treating 10% of the tuna cooking water in Galicia would mean recovering about 60,000 liters of oil and 450,000 kg of organic matter that can be reused as feed ingredients.
The use of novel aquaculture feed ingredients is growing [23] and there is a need to study their efficiency in fish growth and feed conversion, which is essential for their industrial implementation. Thus, in this work, sustainable alternatives to the use of traditional ingredients in rainbow trout feeds were assessed by evaluating: (1) insect meal as a high quality protein source; (2) microalgal meal as a source of lipids rich in omega-3 fatty acids; (3) protein and lipid fractions recovered from the cooking water of tuna canning processes; and (4) a diet with a mix of the three previous ingredients.

2. Material and Methods

Manipulations of fish were carried out in compliance with the Guidelines of the European Union Council (2010/63/UE) and Spanish legislation for laboratory animal use.

2.1. Feed Formulation

Five diets were formulated by DIBAQ aquaculture (Segovia, Spain) and produced in the facilities of the Technological Center CARTIF (Valladolid, Spain) using the same facilities and extrusion parameters for all of them. (1) Microalgae diet (DM) with 10% inclusion, using a mix of four microalgae (Nannochloropsis gaditana, Tisochrysis lutea (CCAP 927/14), Rhodomonas lens (ECC 030) and Isochrysis galbana (CCAP 927/1) were selected due to their amino acid and fatty acid content and included at 26, 33, 20% and 21%, respectively, to cover the amino acid requirements of rainbow trout, and were produced by ANFACO-CECOPESCA (Vigo, Spain); (2) Insect diet (DI) with 15% inclusion of house cricket, Acheta domesticus, meal produced by Nutrinsect (Navarra, Spain); (3) Protein and oil from a water cooking diet (DP&L) with 7 and 8% inclusion, respectively; (4) a mix diet (DMIX) based on the inclusion of the three ingredients (10% microalgae meal, 15% insect meal, 4% protein and 8% lipid fraction from tuna canning); and (5) a commercial diet from Dibaq (DC) was considered as a control. The formulation of experimental feeds was carried out by Dibaq and the inclusion levels of the new ingredients were adjusted to fulfill the requirements of rainbow trout juveniles in terms of amino acids, minerals and fatty acids. The formulation of the feeds is presented in Table 1 whereas the proximate and amino acid composition is reflected in Table 2 and the fatty acid profile is presented in Table 3.

2.2. Experimental Procedure

In this study, 3000 rainbow trout juveniles with an initial weight of 9.15 ± 1.69 g were distributed in 15 tanks of 300 L (200 fish per tank) connected to a recirculation system (RAS) under a 12 h L: 12 h D photoperiod. Each tank was provided with continuous aeration and oxygen. Water conditions were maintained at 15 ± 1.2 °C, 0 ‰ salinity and 7 ± 0.7 mg/L dissolved oxygen. RAS parameters were maintained as stable during all the experiments. Ammonia, nitrate and nitrite were measured each day and kept at 0.0 and 0.1 mg/L, respectively. Fish were fed manually 3 times per day with 2% body weight per day (feeding ratio recommended by Dibaq) and 7 days a week. Feed amounts were adjusted every week according to the theoretical growth of the fish. The trial lasted for 60 days. Every 15 days all the fish were weighed, and their length measured. Prior to manipulation, fish were anesthetized with 200 mg/L of 2-phenoxyethanol [24].

2.3. Growth Performance and Somatic Indices

At the end of the experiment, growth performance was assessed using the following parameters:
Specific growth rate (SGR, % body weight/day = (ln final weight − ln initial weight)/days) × 100);
Feed conversion ratio (FCR = feed intake/increase in biomass);
Protein efficiency ratio (PER = increase in biomass/total protein intake);
elative growth rate (RGR = Final weight − initial weight/initial weight);
Condition Factor (CF = body weight/body length3);
Fish In Fish out (FIFO = FCR * (% fish meal + % fish oil in feed)/(FM ratio + FO ratio) [25].
Ten fish from each tank were sacrificed with an overdose of anesthetic. The liver and viscera of each fish were dissected and weighed in order to calculate the following indices:
Hepatosomatic index (HSI, % = (100 × [liver weight (g)]/[total body weight (g)]) and viscerosomatic index (VSI, % = (100 × [viscera weight (g)]/[total body weight (g)])).
Samples of the dorsal muscle and liver (N = 10 each) of the fish were kept at −20 °C until biochemical analysis.

2.4. Biochemical Analyses

Muscle composition was determined according to the standard methods of AOAC [26], moisture by drying at 104 °C for 24 h, ash by incineration at 550 °C, protein estimating crude protein –CP-(N × 6.25) by the Kjeldahl method after acid digestion (Kjeltec 2300 Auto Analyser; Tecator, Höganas, Sweden), fat by extraction with petroleum ether by the Soxhlet method using the Soxtec 1043 system HT (Foss Tecator, Sweden) and a fatty acid (FA) profile using a gas-mass chromatograph following the method based on ISO-1296-4:2015 [27].
Atherogenic index (AI): Indicates the relationship between the sum of the main saturated fatty acids and that of the main classes of unsaturated, the former being considered pro-atherogenic (favoring the adhesion of lipids to cells of the immunological and circulatory system), and the latter anti-atherogenic (inhibiting the aggregation of plaque and diminishing the levels of esterified acid, cholesterol, and phospholipids, thereby preventing the appearance of micro- and macrocoronary diseases [28] using the following equation:
AI = ((12:0 + (4 × 14:0) + 16:0))/(MUFAs + PUFAn6 + PUFAn3)
Thrombogenic index (TI): Shows the tendency to form clots in the blood vessels. This is defined as the relationship between the pro-thrombogenetic (saturated) and the anti-thrombogenetic fatty acids (MUFAs, PUFAs–n6 and PUFAs–n3) [29]. It was calculated using this equation:
TI = (C14:0 + C16:0 + C18:0)/(0.50 * MUFA) + (0.5 * PUFA n-6) + (3 * PUFA n-3) + (PUFA n-3/PUFA n-6)
Lipid biomarker analysis was carried out using pools of 10 livers and 10 spleens per tank. Samples were crushed, homogenized in isopropanol and centrifuged for 5 min at 10,000× g to obtain the extracts. Cholesterol determination was carried out on the serum samples using the total cholesterol colorimetric assay kit (Elabscience, E-BC-K109-S). This method is based on the quantification of free cholesterol and cholesterol esters. The analysis of triglycerides was performed using the ChromaDazzle Triglyceride Assay kit from AssayGenie (ref: BA0152).

2.5. Statistical Analyses

All data were tested for normality and homogeneity of variances using Levene’s test before being submitted to a one-way analysis of variance. Data were statistically analyzed using SPSS v19 (SPSS, Chicago, IL, USA) program and according to the following General Linear Model, where the tank was considered a fixed factor:
Yij = μ + αi + εij
where μ is the population mean, α the fixed effect of the tank, and εij the residual error.
One way analysis of variance (ANOVA) was carried out using the SPSS program. The differences were considered statistically significant when p < 0.05 and the Holm–Sidak post hoc test was used to perform pair wise comparisons of means between experimental groups.

3. Results

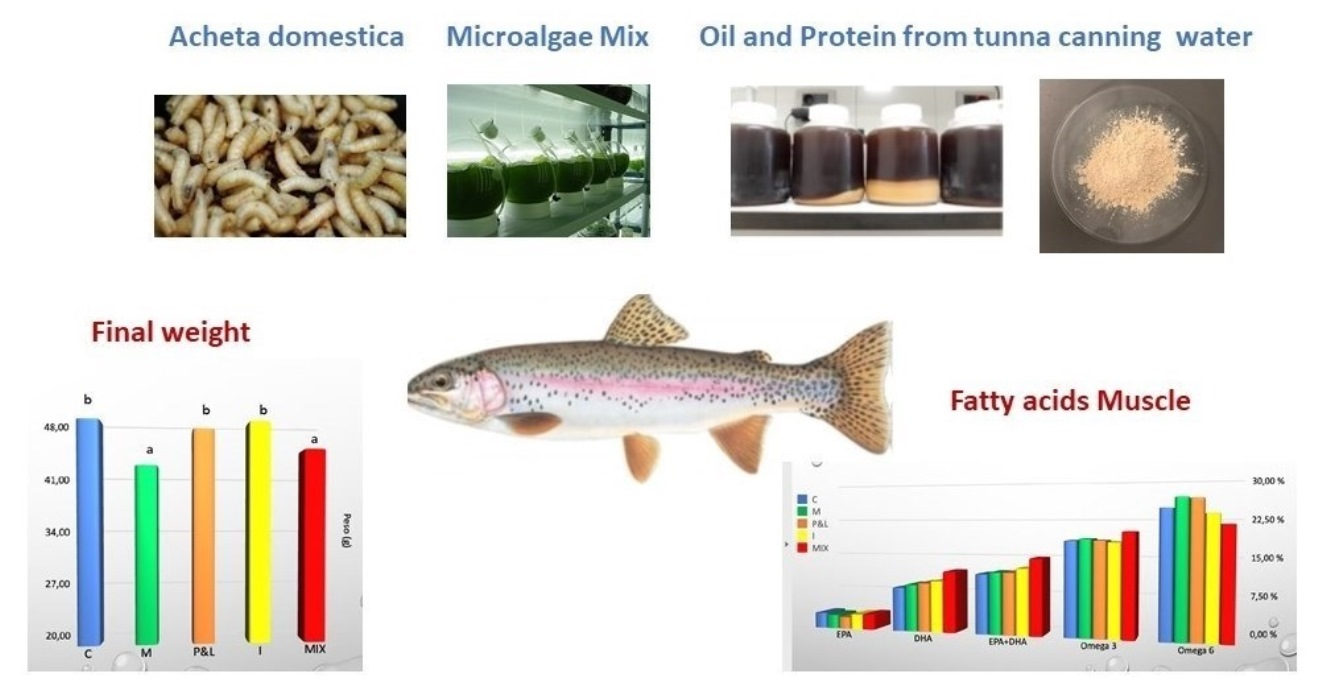
3.1. Effect of Alternative Diets on Growth Performance

At the beginning of the experiment, the juveniles weighed 9.15 ± 1.65 g (mean ± SD), their length being 9.5 ± 0.68 cm. No significant differences in the initial weight of the fish were observed among tanks or treatments. At the end of the experiment, significant differences were observed in the final weight and length among diets (Table 4). Fish fed DC, DP&L and DI showed a statistically significantly higher weight than those fed DM and DMIX (ANOVA, p < 0.05). The same trend was observed in the results of SGR and RGR (p < 0.05).
Protein efficiency (PER) and feed conversion (FCR) ratios did not show any significant difference among diets. However, a trend similar to that obtained in the growth parameters was observed (Table 4).
FI:FO results showed significant differences among diets (ANOVA, p < 0.05). The highest ratio was obtained in the DC diet with almost 0.87 kg of fish needed to produce 1 kg of trout, whereas the best ratio was for the DMix feed with a value of 0.40.

3.2. Effect of Alternative Diets on Muscle Composition

The biochemical analysis of trout muscle did not show any significant differences in terms of moisture, protein, lipids and carbohydrates content. Only a significant difference was detected in ash content (p < 0.05) (Table 5). An antagonistic result between DI and DP&L groups was found in fillet composition. DI showed the highest lipid (18.38%) and lowest protein (72.6%) content whereas DP&L fish showed the opposite (15.11 and 75.57%, respectively). DC, DM and DMIX trout muscle showed intermediate values.
Concerning the FA composition of muscle, no significant differences were observed among diets except for 18:0 fatty acid where DMIX and DC showed the highest differences (4.10 and 3.63%, respectively). Total saturated fatty acids (SFA) were significantly higher in DMIX (23.17%) and lower in DM (20.35%). Fillet of Rainbow trout fed DM feed stood out with the highest level of PUFA.
No significant differences were detected in EPA, DHA, total omega 3 and total omega 6 fatty acids (FAs) content among alternative diets, although DMIX showed the highest level of EPA, DHA and omega 3 FAs and the lowest level of omega 6 FAs. The use of these alternative diets seems to reduce EPA content in rainbow trout muscle compared to DC, except for in the DMIX fed group. An increase in DHA levels from 8.56% in DC to 11.73% in the DMIX was also observed.
The content of EPA + DHA ranged between 11.59% in DC and 14.75% in DMIX, driven by DHA content in the muscle.
Lipid health indices such as the PUFA/SFA ratio, n-3/n-6 ratio, AI and TI, show that DM stands out with the highest PUFA/SFA ratio and the lowest AI, whereas DMIX showed the lowest PUFA/SFA and the highest n-3/n-6 and AI. No differences were observed among diets in TI ratio values.

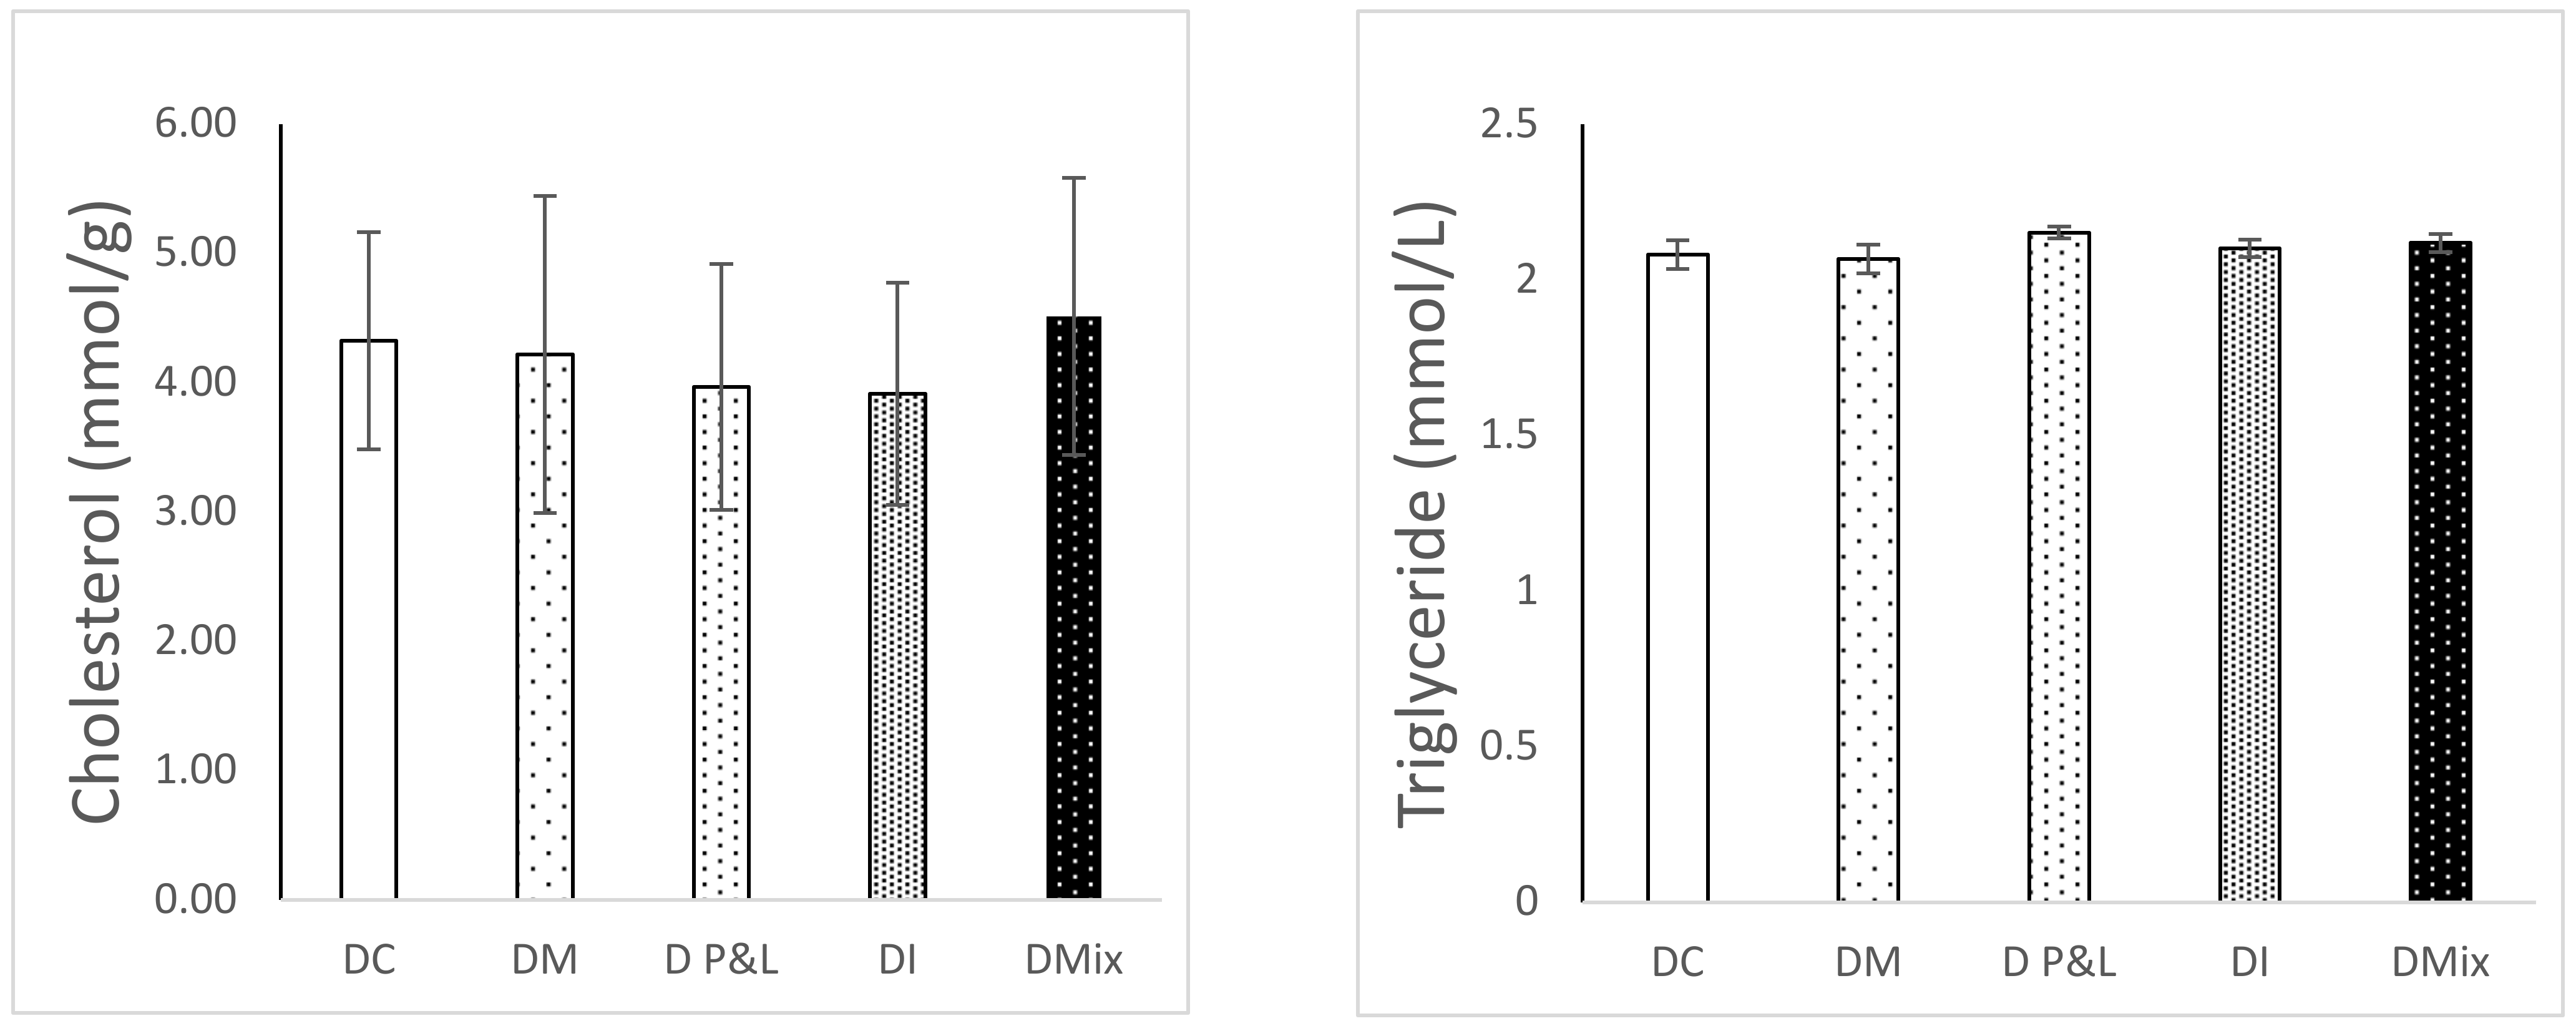
3.3. Effect of Alternative Diets on Fish Health

Figure 1 shows the results of the hepatosomatic (HSI) and viscerosomatic indices (VSI). HSI was similar in all the groups, except in the case of the fish fed the diet based on insects (1.29 ± 0.04). In that case, HSI was significantly reduced compared to that observed for the DC (1.53 ± 0.05) (ANOVA, p < 0.05). In the case of the viscerosomatic index (VSI), the results show a statistically significant increase in the fish fed a diet supplemented with microalgae (12.16 ± 0.18) (p < 0.05). Lipid biomarkers, cholesterol and triglycerides (Figure 2), did not show differences in rainbow trout liver after being fed the different alternative ingredients assayed.

4. Discussion

Intensification of aquaculture increased global production from approximately 42 to 117 MTs between 1999 and 2019 [30]. FM and FO are still the main sources of protein and lipid in aquafeeds [1,2], derived from wild fish and fish processing by-products. The increase in demand, the price fluctuation and the stagnation of FM and FO production in recent years [31], have driven the market to the substitution of these marine ingredients with a variety of plant-based ingredients and animal by-products [32,33]. New ingredients such as insect meal [34,35,36], micro- and macroalgae [37,38,39] and brewery-derived byproducts [16,40,41,42] have been recently investigated as aquafeed ingredients in an individual way with only a few studies assessing the value of alternative ingredients in side-by-side comparisons [43,44] and none have considered combining all these ingredients in the same diet.

4.1. Insect Meal

In the present study insect meal and microalgae were used alone or combined with by-products derived from the canning industry. The results obtained for growth and feed efficiency confirm previous results obtained in rainbow trout using insect meal [45,46,47] and the inclusion of insect meal in DI at the 15% level and a 60% substitution of FM did not lead to any negative effect on rainbow trout growth or performance. Similar results were observed by Renna, et al. [48], replacing 20 and 40% of defatted Hermetia illucens (HI) meal in place of 25 and 50% of FM in the trout diets of adult fish. On the other hand, St-Hilaire, et al. [45], using an inclusion higher than 15% of a full fat HI prepupae meal, observed a decrease in growth compared to the control diet. All these results on insect substitution were obtained using HI. In a recent study carried out with a pre-commercial product with a mixture of black soldier fly (HI) and meal worm (Tenebrio molitor, TM) by Acar, et al. [49], the best growth of rainbow trout was obtained with 25 and 50% substitution of FM by the commercial product. House cricket, Acheta domesticus, was the species selected in the present study as the source of a non-defatted insect meal due to its easier and standardized breeding, and the results obtained can be considered new and innovative because no previous publication using this species in rainbow trout feeds was found in the literature.
Comparing the growth performance of the fish fed insect meal with those fed the control diet, no negative effects were observed in growth and feed efficiency except for a higher fat accumulation in the fillet. Similar results were obtained in rainbow trout by other authors [48] and differ from those published by Belforti, et al. and Sealey, et al. [50,51], working with the inclusion of HI and TM meals, respectively. In these studies, the composition of trout dorsal muscle showed a significant decrease in dry matter, lipid content and in the levels of fatty acids with respect to the control diet. These differences might be due to the different insect species used in the studies.

4.2. Microalgae

Microalgae show a high potential for the substitution of FM and FO in feed formulation due to their levels of protein, fatty acid composition, and mineral profile [7,13,38]. Several algae such as Spirulina, Nannochloropsis, Chlorella, Isochrysis, Tetraselmis, Secenedesmus, and Schizochytrium have shown their good acceptance as ingredients in aquaculture feeds [52,53,54]. In the present study, a mix of species was selected due to their high content in protein, EPA and DHA, amino acids, lipids, and various minerals and the results showed a significant lower fish growth compared to the control group. In a similar experiment with rainbow trout using Nanochloropsis and Isochrysis at 9.4% replacement, a reduction of SGR and an increase of FCR were observed by Sarker, et al. [55]. The authors explained this growth depression by the low feed intake observed. However, other publications using microalgae at different inclusion levels such as Arthrospira at 7.5% [56], Scenedesmus at 5% [52] and Chlorella combined with Spirulina at 12.5 % [57], showed no effect on fish growth or feed efficiency. Considering the results obtained in the present study it might be the case that the high inclusion level of microalgae produced a negative effect due to either a lower feed intake by the fish or to a lower digestibility. Shah, et al. [54] in a review about the use of microalgae as aquafeed ingredients concluded that the inclusion of microalgae in feeds need to be evaluated at a species level, not only of the microalgae but also of the fish species, including studies of digestibility and bioavailability.

4.3. P&L Diet

Although several publications are available for studying the effect of tuna by-products included in aquafeeds either as meal or oil [58,59,60] this is the first study using protein and oil recovered from tuna water cooking as ingredients in feeds for rainbow trout. The results in fish growth and feed conversion were similar to those obtained in the DC and DI fed groups. The same results were also observed when meal obtained from tuna by-products replaced up to 75% FM in several studies carried out with Korean rockfish (Sebastes schlegeli) juveniles without affecting growth or feed conversion [61,62,63]. On the other hand, a higher inclusion of a meal from tuna by-products included at 50%, 60 and 70% by Tekenay, et al. [64] ended in a reduction of SGR and PER of rainbow trout juveniles due to the lower palatability and feed acceptance. Thus, depending on the process used for tuna manufacturing and the inclusion of by-products in fish diets, the effects of these ingredients in the proximal composition of fish might be different. For example, in a study carried out by Oncul, et al. [65] with juvenile olive flounder (Paralichthys olivaceus) using tuna by-product meal no significant differences were observed in their body composition. Similar results were also observed by Kim, et al. [61], Bae, et al. [66] and Tekenay, et al. [64] in the moisture, crude protein and ash of Korean rockfish and in rainbow trout fed the tuna by-product meal, and only lipid content was affected. In the present study, no significant changes in fillet proximal composition were observed in rainbow trout fed DP&L, although protein level was slightly increased in parallel to a reduction in the lipid content.

4.4. DMIX Diet

The DMIX diet has shown intermediate results in terms of fish growth, food conversion and fillet quality probably as a consequence of microalgae inclusion, the worst ingredient in terms of zootechnical parameters in this trial. Although, this DMIX diet produced the worst results in PER and FCR without being statistically significant, it is the diet with the best FI: FO value, a very positive result considering that half of FM and FO was used to produce the same amount of fish compared to the control. Today it is essential to promote sustainable aquaculture producing more farmed fish with fewer resources and avoiding wild fish over-exploitation.
Regarding the organosomatic indices, the HSI of fish fed DI showed the lowest values compared to the control and the rest of the alternative diets. This trend is similar to that observed in other studies, where the increasing dietary level of TM involved a decrease in HSI [50]. The same tendency was also detected when FM was totally or partially substituted by an insect meal or vegetable proteins [51]. Histopathological biomarkers are considered useful indicators of the general health of the fish [67], in our case a decrease in the HSI might indicate a reduction in the energy reserves stored in the liver used for energy production to support metabolic needs. In the case of VSI only DM fed fish showed a high value. High lipid levels in the feed usually lead to an excessive fat accumulation in the visceral cavity and in the liver of the fish although this accumulation may also depend on the fatty acid composition of the diet. In the present study the high saturated fatty acid (SFA) levels found in the DM diet may be the direct cause of the high VSI observed, instead of total lipids, because total lipid content was not the highest among the diets assayed. High levels of SFA in diets formulated with insect meal was mentioned by Mikolajczak, et al. [68] as the direct cause of the differences in organosomatic indices observed with different dietary inclusions of T. molitor and Z. morio. It is well established that lipid metabolism plays a key role in energy homeostasis in rainbow trout [69]. Changes in parameters such as triglycerides or cholesterol generally reflect the nutritional state of the animal, the endocrine function as well as the integrity of vital organs such as the liver [70]. In the present study, the levels of cholesterol and triglycerides were similar in all the diets, confirming that the alternative ingredients used in the formulation did not affect the health of the fish or the basics of lipid metabolism.
No negative effects were observed in the nutritional value of the fish and, indirectly, on human health, as a consequence of the inclusion of alternative ingredients such as insects, microalgae or industry derived by-products in rainbow trout feeds. Omega 3 levels in the fish muscle were higher than 0.6 g/100 g, considered the standard value of this species [71]. The fillet composition of DMIX fed fish shows 10% more total omega 3 than the other groups, probably as a result of the inclusion of microalgae and the oil recovered from the cooking water, which are rich in omega 3. This increase in total omega 3 fatty acids, although not significantly different, was accompanied by a decrease in total omega 6, which significantly affected the omega 3/omega 6 index. In fact, DMIX enhanced the nutritional quality of the rainbow trout with the highest ratio omega 3/omega 6. The rest of the alternative ingredients showed the same nutritional value as the control, contrary to another study where FM substitution with HI showed a consistent increase of omega 6 and a decrease of omega 3 FAs in fish muscle [48] and a decrease in omega 3/omega 6 and PUFA/SFA ratios [47]. The same tendency was observed using increasing levels of plant protein concentrate in the feeds for rainbow trout [72].
These positive results were reinforced with the low values of the AI and TI indices obtained in all the groups and at lower levels than those observed by Renna, et al. [48] and Belforti, et al. [50] in similar studies. Both indices combine the effects that single fatty acids might have on human health, specifically in increasing the incidence of pathogenic phenomenon [73]. Results of AI and TI obtained using these alternative ingredients (insects, microalgae, industry by-products) confirm that their use in a balanced diet might improve the nutritional value of rainbow trout especially if the results are compared with those obtained using plant-based diets.

5. Conclusions

This study shows the effects of the inclusion of new alternative ingredients in rainbow trout diets. The results obtained using Acheta domesticus meal, P&L recuperated from water cooking in tuna canning factories and a mix of marine microalgae in diets for rainbow trout juveniles were satisfactory. Any of these ingredients can be considered an alternative source of protein in aquafeeds, because no negative effects on growth, feed conversion, muscle composition, fish health or final nutritional value were observed. In the case of microalgae, a better adjustment both in terms of feed inclusion level and in microalgae species combination is needed. The results obtained also need to be verified by detailed studies using different concentrations of the alternative ingredients separately in the fish diets. These new alternative ingredients have a lower Fish In: Fish Out ratio than the control diet used, indicating a higher degree of environmental sustainability, providing an acceptable zootechnical efficiency. Finally, the DMIX diet formulated with an adequate percentage of microalgae can be a very good alternative because it was the most suitable, provided good results in terms of growth and conversion and produced the best fillet quality in terms of omega-3 content.

Author Contributions

Conceptualization, A.E., M.S. and L.F.; methodology, A.E., M.S. and L.F.; validation, A.E., M.S. and L.F.; formal analysis, P.F., M.F., B.B., L.R. and M.A.; investigation, all the authors; resources, M.S. and M.F.; data curation, A.E. and M.S.; writing—original draft preparation, P.F., M.S. and A.E.; writing—review and editing, A.E.; visualization, M.S. and M.F.; supervision, M.S. and A.E.; project administration, M.F., M.S. and L.F.; funding acquisition, M.S. and M.F. All authors have read and agreed to the published version of the manuscript.

Funding

This study is part of ALTERNFEED II project, funded by Programa Pleamar of Fundación Biodiversidad, Spanish Ministry for Ecological Transition and Demographic Challenge (Spanish Operational Programme EMFF 2014ESMFOP001).

Institutional Review Board Statement

The study was conducted in accordance with the Declaration of Helsinki, and the animal study protocol was approved by the Institutional Review Board of the Galician Regional Government (protocol code ES360570160901/20/FUN.01/FIS.02/MS01, date of approval 2 March 2020).

Informed Consent Statement

Not applicable.

Data Availability Statement

The data that support the findings of this study are available from the corresponding author upon reasonable request.

Acknowledgments

This study is part of ALTERNFEED II project, funded by Fundación Biodiversidad, Spanish Ministry for Ecological Transition and Demographic Challenge, through the Programa Pleamar, co-funded by EU-FEMP.

Conflicts of Interest

The authors declare no conflict of interest.

References

  1. Bandara, T. Alternative feed ingredients in aquaculture: Opportunities and challenges. J. Entomol. Zool. Stud. 2018, 6, 3087–3094. [Google Scholar]
  2. Konar, M.; Qiu, S.; Tougher, B.; Vause, J.; Tlusty, M.; Fitzsimmons, K.; Barrows, R.; Cao, L. Illustrating the hidden economic, social and ecological values of global forage fish resources. Resour. Conserv. Recycl. 2019, 151, 104456. [Google Scholar] [CrossRef]
  3. Hodar, A.R.; Vasava, R.J.; Mahavadiya, D.R.; Joshi, N.H. Fish meal and fish oil replacement for aqua feed formulation by using alternative sources a review. J. Exp. Zool. India 2019, 23, 13–21. [Google Scholar]
  4. Kalhoro, H.; Zhou, J.; Hua, Y.; Ng, W.K.; Ye, L.; Zhang, J.; Shao, Q. Soy protein concentrate as a substitute for fish meal in diets for juvenile Acanthopagrus schlegelii: Effects on growth, phosphorus discharge and digestive enzyme activity. Aquac. Res. 2018, 49, 1896–1906. [Google Scholar] [CrossRef]
  5. FAO. El Estado Mundial de la Pesca y la Acuicultura 2018. Cumplir los Objetivos de Desarrollo Sostenible; FAO: Rome, Italy, 2018. [Google Scholar]
  6. Samuelsen, T.A.; Oterhal, Å.; Kousoulaki, K. High lipid microalgae (Schizochytrium sp.) inclusion as a sustainable source of n-3 long-chain PUFA in fish feed—Effects on the extrusion process and physical pellet quality. Anim. Feed. Sci. Technol. 2018, 236, 14–28. [Google Scholar] [CrossRef]
  7. Gong, Y.; Bandara, T.; Huntley, M.; Johnson, Z.I.; Dias, J.; Dahle, D.; Sørensen, M.; Kiron, V. Microalgae Scenedesmus sp. as a potential ingredient in low fishmeal diets for Atlantic salmon (Salmo salar L.). Aquaculture 2019, 501, 455–464. [Google Scholar] [CrossRef]
  8. Berge, G.M.; Grisdale-Helland, B.; Helland, S.J. Soy protein concentrate in diets for Atlantic halibut (Hippoglossus hippoglossus). Aquaculture 1999, 178, 139–148. [Google Scholar] [CrossRef]
  9. Aksnes, A.; Hope, B.; Albrektsen, S. Size-fractionated fish hydrolysate as feed ingredient for rainbow trout (Oncorhynchus mykiss) fed high plant protein diets. II: Flesh quality, absorption, retention and fillet levels of taurine and anserine. Aquaculture 2006, 261, 318–326. [Google Scholar] [CrossRef]
  10. Deng, J.; Mai, K.; Ai, Q.; Zhang, W.; Wang, X.; Xu, W. Effects of replacing fish meal with soy protein concentrate on feed intake and growth of juvenile Japanese flounder (Paralichthys olivaceus). Aquaculture 2006, 258, 503–513. [Google Scholar] [CrossRef]
  11. Henry, M.; Gasco, L.; Piccolo, G.; Fountoulaki, E. Review on the use of insects in the diet of farmed fish: Past and future. Anim. Feed. Sci. Technol. 2015, 203, 1–22. [Google Scholar] [CrossRef]
  12. Biancarosa, I.; Sele, V.; Belghit, I.; Ørnsrud, R.; Lock, I.J.; Amlund, H. Replacing fish meal with insect meal in the diet of Atlantic salmon (Salmo salar) does not impact the amount of contaminants in the feed and it lowers accumulation of arsenic in the fillet. Food Addit. Contam. Part A 2019, 36, 1191–1205. [Google Scholar] [CrossRef] [PubMed] [Green Version]
  13. Sarker, P.K.; Kapuscinski, A.R.; Vandenberg, G.W.; Proulx, E.; Sitek, A.J. Towards sustainable and ocean-friendly aquafeeds: Evaluating a fish-free feed for rainbow trout (Oncorhynchus mykiss) using three marine microalgae species. Elem. Sci. Anthr. 2020, 8, 5. [Google Scholar] [CrossRef] [Green Version]
  14. Shaikhiev, I.; Sverguzova, S.; Sapronova, J.; Danshina, E. Using intact and minced Hermetia illucens larvae as a fodder in aquaculture (review of foreign literature). Fisheries 2020, 2020, 86–92. [Google Scholar] [CrossRef]
  15. García-Sanda, E.; Omil, F.; Lema, J. Clean production in fish canning industries: Recovery and reuse of selected wastes. Clean Technol. Env. Policy 2003, 5, 289–294. [Google Scholar] [CrossRef]
  16. Estevez, A.; Padrell, L.; Iñarra, B.; Orive, M.; san Martin, D. Brewery by-products (yeast and spent grain) as protein sources in gilthead seabream (Sparus aurata) feeds. Aquaculture 2021, 543, 736921. [Google Scholar] [CrossRef]
  17. Garrido Gamarro, E.; Orawattanamateekul, W.; Sentina, J.; Srinivasa Gopal, T.K. By-Products of Tuna Processing. Globefish Research Programme; FAO: Rome, Italy, 2013; Volume 112, 48p, Available online: https://www.fao.org/3/bb215e/bb215e.pdf (accessed on 21 February 2022).
  18. Bechtel, P.J. Properties of stickwater from fish processing byproducts. J. Aquat. Food Prod. Technol. 2005, 14, 25–38. [Google Scholar] [CrossRef]
  19. Valdez-Hurtado, S.; Goycolea-Valencia, F.; Márquez-Ríos, E.; Pacheco-Aguilar, R. Effect of complementary centrifugation on chemical and rheological composition from stickwater. Biotecnia 2018, 2, 95–103. [Google Scholar] [CrossRef]
  20. Jao, C.L.; Ko, W.C. 1,1-Diphenyl-2-picrylhydrazyl (DPPH) radical scavenging by protein hydrolysates from tuna cooking juice. Fish. Sci. 2002, 68, 430–435. [Google Scholar] [CrossRef]
  21. Tremblay, A.; Corcuff, R.; Goulet, C.; Godefroy, S.B.; Doyen, A.; Beaulieu, L. Valorization of snow crab (Chionoecetes opilio) cooking effluents for food applications. J. Sci. Food Agric. 2020, 100, 384–393. [Google Scholar] [CrossRef]
  22. Martínez-Montaño, E.; Osuna-Ruíz, I.; Benítez-García, I.; Osuna, C.O.; Pacheco-Aguilar, R.; Navarro-Peraza, R.S.; Salazar-Leyva, J.A. Biochemical and Antioxidant Properties of Recovered Solids with pH Shift from Fishery Effluents (Sardine Stickwater and Tuna Cooking Water). Waste Biomass Valoriz. 2020, 12, 1901–1913. [Google Scholar] [CrossRef]
  23. Cottrell, R.S.; Blanchard, J.L.; Halpern, B.S.; Metian, M.; Froehlich, H.E. Global adoption of novel aquaculture feeds could substantially reduce forage fish demand by 2030. Nat. Food 2020, 1, 301–308. [Google Scholar] [CrossRef]
  24. Gilderhus, P.A.; Marking, L.L. Comparative efficacy of 16 anesthetic chemicals on Rainbow Trout. N. Am. J. Fish. Manag. 1987, 7, 288–292. [Google Scholar] [CrossRef]
  25. Kok, B.; Malcorps, W.; Tlusty, M.F.; Eltholth, M.M.; Auchterloine, N.A.; Little, D.C.; Davies, S.J. Fish and feed: Using economic allocation to quantify the Fish In: Fish Out ratio of major fed aqua-culture species. Aquaculture 2020, 528, 735474. [Google Scholar] [CrossRef]
  26. AOAC (Association of Official Analytical Chemists). Official Methods of Analysis of the Association of Official Analytical Chemists, 15th ed.; Association of Official Analytical Chemists: Washington, DC, USA, 1990. [Google Scholar]
  27. Ulbricht, T.L.V.; Southgate, D.A.T. Coronary heart disease: Seven dietary factors. Lancet 1991, 338, 985–992. [Google Scholar] [CrossRef]
  28. ISO 12966-4:2015; Animal and Vegetable Fats and Oils. Gas Chromatography of Fatty Acid Methyl Esters. Part 4: Determination by Capillary Gas Chromatography. The International Organization for Standardization: Geneva, Switzerland, 2015. Available online: www.iso.org/standard/35454.html (accessed on 17 January 2018).
  29. Fernández, M.; Ordóñez, J.A.; Cambero, I.; Santos, C.; Pin, C.; de la Hoz, L. Fatty acid compositions of selected varieties of Spanish ham related to their nutritional implication. Food Chem. 2007, 101, 107–112. [Google Scholar] [CrossRef]
  30. FAO. The State of World Fisheries and Aquaculture. 2020. Available online: https://www.fao.org/state-of-fisheries-aquaculture/en/ (accessed on 25 January 2019).
  31. Tacon, A.G.J.; Hasan, M.R.; Metian, M. Demand and supply of feed ingredients for farmed fish and crustaceans: Trends and prospects. In FAO Fisheries Technical Paper; FAO: Rome, Italy, 2011; Volume 564, p. 87. [Google Scholar]
  32. Davies, S.J.; Laporte, J.; Gouveia, A.; Salim, H.S.; Woodgate, S.M.; Hassaan, M.S.; El-Haroun, E.R. Validation of processed animal proteins (mono-PAPS) in experimental diets for juvenile gilthead sea bream (Sparus aurata L.) as primary fish meal replacers within a European perspective. Aquac. Nutr. 2019, 25, 225–238. [Google Scholar] [CrossRef] [Green Version]
  33. Pelletier, N.; Klinger, D.H.; Sims, N.A.; Yoshioka, J.R.; Kittinger, J.N. Nutritional attributes, substitutability, scalability, and environmental intensity of an illustrative subset of current and future protein sources for aquaculture feeds: Joint consideration of potential synergies and trade-offs. Environ. Sci. Technol. 2018, 52, 5532–5544. [Google Scholar] [CrossRef]
  34. Belghit, I.; Liland, N.S.; Waagbø, R.; Biancarosa, I.; Pelusio, N.; Li, Y.; Krogdahl, Å.; Lock, E.J. Potential of insect-based diets for Atlantic salmon (Salmo salar). Aquaculture 2018, 491, 72–81. [Google Scholar] [CrossRef]
  35. Stamer, A. Insect proteins—A new source for animal feed. EMBO Rep. 2015, 16, 676–680. [Google Scholar] [CrossRef] [Green Version]
  36. IPIFF. The International Platform of Insects for Food and Feed. 2019. Available online: http://ipiff.org/ (accessed on 24 March 2021).
  37. Brown, M.R.; Jeffrey, S.W.; Volkman, J.K.; Dunstan, G.A. Nutritional properties of microalgae for mariculture. Aquaculture 1997, 151, 315–331. [Google Scholar] [CrossRef]
  38. Kiron, V.; Phromkunthong, W.; Huntley, M.; Archibald, I.; de Scheemaker, G. Marine micro-algae from biorefinery as a potential feed protein source for Atlantic salmon, common carp and whiteleg shrimp. Aquac. Nutr. 2012, 18, 521–531. [Google Scholar] [CrossRef]
  39. Roy, S.S.; Pal, R. Microalgae in aquaculture: A rview with special references to Nutritional value and fish dietetics. Proc. Zool. Soc. 2015, 68, 1–8. [Google Scholar] [CrossRef]
  40. Nazzaro, J.; Martin, D.S.; Perez-Vendrell, A.M.; Padrell, L.; Iñarra, B.; Orive, M.; Estévez, A. Apparent digestibility coefficients of brewer’s by-products used in feeds for rainbow trout (Oncorhynchus mykiss) and gilthead seabream (Sparus aurata). Aquaculture 2020, 530, 735796. [Google Scholar] [CrossRef]
  41. Oliva-Teles, A.; Gonçalves, P. Partial replacement of fishmeal by brewers yeast (Saccharomyces cerevisae) in diets for sea bass (Dicentrarchus labrax) juveniles. Aquaculture 2001, 202, 269–278. [Google Scholar] [CrossRef]
  42. Zhang, P.; Cao, S.; Zou, T.; Han, D.; Liu, H.; Jin, J.; Yang, Y.; Zhu, X.; Xie, S.; Zhou, W. Effects of dietary yeast culture on growth performance. immune response and disease resistance of gibel carp (Carassius auratus gibelio CAS). Fish Shellfish Immunol. 2018, 82, 400–407. [Google Scholar] [CrossRef]
  43. Trushenski, J.; Gause, B. Comparative Value of Fish Meal Alternatives as Protein Sources in Feeds for Hybrid Striped Bass. N. Am. J. Aquac. 2013, 75, 329–341. [Google Scholar] [CrossRef]
  44. Roques, S.; Deborde, C.; Richard, N.; Sergent, L.; Kurz, F.; Skiba-Cassy, S.; Fauconneau, B.; Moing, A. Characterizing alternative feeds for rainbow trout (O. mykiss) by 1H NMR metabolomics. Metabolomics 2018, 14, 155. [Google Scholar] [CrossRef] [Green Version]
  45. St-Hilaire, S.; Sheppard, C.; Tomberlin, J.K.; Irving, S.; Newton, L.; McGuire, M.A.; Mosley, E.E.; Hardy, R.W.; Sealey, W. Fly prepupae as a feedstuff for rainbow trout, Oncorhynchus mykiss. J. World Aquac. Soc. 2007, 38, 59–67. [Google Scholar] [CrossRef]
  46. Stadtlander, T.; Stamer, A.; Buser, A.; Wohlfahrt, J.; Leiber, F.; Sandrock, C. Hermetia illucens meal as fish meal replacement for rainbow trout on farm. J. Insects Food Feed 2017, 3, 165–175. [Google Scholar] [CrossRef] [Green Version]
  47. Józefiak, A.; Nogales-Mérida, S.; Mikołajczak, Z.; Rawski, M.; Kierończyk, B.; Mazurkiewicz, J. The utilization of full-fat insect meal in rainbow trout (Oncorhynchus mykiss) nutrition: The ef-fects on growth performance, intestinal microbiota and gastrointestinal tract histomorphology. Ann. Anim. Sci. 2019, 19, 747–765. [Google Scholar] [CrossRef] [Green Version]
  48. Renna, M.; Schiavone, A.; Gai, F.; Dabbou, W.; Lussiana, C.; Malfatto, V.; Prearo, M.; Capucchio, M.T.; Biasato, I.; Biasibetti, E.; et al. Evaluation of the suitability of a partially defatted black soldier fly (Hermetia illucens L.) larvae meal as ingredient for rainbow trout (Oncorhynchus mykiss Walbaum) diets. J. Anim. Sci. Biotechnol. 2017, 8, 57. [Google Scholar] [CrossRef] [PubMed]
  49. Acar, U.; Giannetto, A.; Giannetto, D.; Kesbiç, O.S.; Yilmaz, S.; Romano, A.; Tezel, R.; Türker, A.; Güllü, K.; Fazio, F. Evaluation of an innovative and sustainable pre-commercial compound as replacement of fish meal in diets for rainbow trout during pre-fattening phase: Effects on growth per-formances, haematological parameters and fillet quality traits. Animals 2021, 11, 3547. [Google Scholar] [CrossRef] [PubMed]
  50. Belforti, M.; Gai, F.; Lussiana, C.; Renna, M.; Malfatto, V.; Rotolo, L.; De Marco, M.; Dabbou, S.; Schiavone, A.; Zoccarato, I.; et al. Tenebrio Molitor meal in rainbow trout (Oncorhynchus mykiss) diets: Effects on animal performance, nutrient digestibility and chemical composition of fillets. Ital. J. Anim. Sci. 2015, 14, 4. [Google Scholar] [CrossRef] [Green Version]
  51. Sealey, W.M.; Gaylord, T.G.; Barrows, F.T.; Tomberlin, J.K.; McGuire, M.A.; Ross, C.; St-Hilaire, S. Sensory analysis of rainbow trout, Oncorhynchus mykiss, fed enriched black soldier fly prepupae, Hermetia illucens. J. World Aquac. Soc. 2011, 42, 34–45. [Google Scholar] [CrossRef]
  52. Skalli, A.; Firmino, J.P.; Andree, K.B.; Salomón, R.; Estévez, A.; Puig, P.; Gisbert, E. The in-clusion of the microalga Scenedesmus sp. in diets for rainbow trout, Onchorhynchus mykiss, juveniles. Animals 2020, 10, 1656. [Google Scholar] [CrossRef]
  53. Yarnold, J.; Karan, H.; Oey, M.; Hankamer, B. Microalgal aquafeeds as part of a circular bioeconomy. Trends Plant Sci. 2019, 24, 959–970. [Google Scholar] [CrossRef] [Green Version]
  54. Shah, M.R.; Lutzu, G.A.; Alam, A.; Sarker, P.; Chowdhury, M.K.; Parsaeimehr, A.; Liang, Y.; Daroch, M. Microalgae in aquafeeds for a sustainable aquaculture industry. J. Appl. Phycol. 2018, 30, 197–213. [Google Scholar] [CrossRef]
  55. Sarker, P.K.; Kapuscinski, A.R.; McKuin, B.; Fitzgerald, D.S.; Nash, H.M.; Greenwood, C. Microalgae-blend tilapia feed eliminates fishmeal and fish oil, improves growth, and is cost viable. Sci. Rep. 2020, 10, 1–14. [Google Scholar] [CrossRef]
  56. Teimouri, M.; Amirkolaie, A.K.; Yeganeh, S. The effects of dietary supplement of Spirulina platensis on blood carotenoid concentration and fillet color stability in rainbow trout (Oncorhynchus mykiss). Aquaculture 2013, 415, 224–228. [Google Scholar] [CrossRef]
  57. Dallaire, V.; Lessard, P.; Vandenberg, G.; de la Noüe, J. Effect of algal incorporation on growth, survival and carcass composition of rainbow trout (Oncorhynchus mykiss) fry. Bioresour. Technol. 2007, 98, 1433–1439. [Google Scholar] [CrossRef]
  58. Goddard, S.; Al-Shagaa, G.; Ali, A. Fisheries by-catch and processing waste meals as ingre-dients in diets for Nile tilapia, Oreochromis niloticus. Aquac. Res. 2008, 39, 518–525. [Google Scholar] [CrossRef]
  59. Saïdi, S.A.; Azaza, M.S.; Abdelmouleh, A.; van Pelt, J.; Kraïem, M.M.; El-Feki, A. The use of tuna industry waste in the practical diets of juvenile Nile tilapia (Oreochromis niloticus, L.): Effect on growth performance, nutrient digestibility and oxidative status. Aquac. Res. 2010, 41, 1875–1886. [Google Scholar] [CrossRef]
  60. Hernández, C.; Olvera-Novoa, M.A.; Smith, D.M.; Hardy, R.W.; González-Rodríguez, B. Enhancement of shrimp Litopenaeus vannamei diets based on terrestrial protein sources via the inclusion of tuna by-product protein hydrolysates. Aquaculture 2011, 317, 117–123. [Google Scholar] [CrossRef]
  61. Kim, K.D.; Jang, J.W.; Kim, K.W.; Lee, B.J.; Hur, S.W.; Han, H.S. Tuna by-product meal as a dietary protein source replacing fishmeal in juvenile Korean rockfish Sebastes schlegeli. Fish. Aquat. Sci. 2018, 21, 29. [Google Scholar] [CrossRef]
  62. Jeon, G.H.; Kim, H.S.; Hyung, S.H.; Cho, S.H. The effect of the dietary substitution of fishmeal with tuna by-product meal on growth, body composition, plasma chemistry and amino acid profiles of juvenile Korean rockfish (Sebastes schlegeli). Aquac. Nutr. 2014, 20, 753–761. [Google Scholar] [CrossRef]
  63. Kim, H.S.; Jung, W.G.; Myung, S.H.; Cho, S.H.; Kim, D.S. Substitution effects of fishmeal with tuna byproduct meal in the diet on growth, body composition, plasma chemistry and amino acid profiles of juvenile olive flounder (Paralichthys olivaceus). Aquaculture 2014, 431, 92–98. [Google Scholar] [CrossRef]
  64. Tekenay, A.A.; Deveciler, E.; Güroy, D. Effects of dietary tuna by-products on feed intake and utilization of rainbow trout Oncorhychus mykiss. J. Fish. Int. 2009, 4, 8–12. [Google Scholar]
  65. Oncul, F.O.; Aya, F.A.; Hamidoghli, A.; Won, S.; Lee, G.; Han, K.R.; Bai, S.C. Effects of the dietary fermented tuna by-product meal on growth, blood parameters, nonspecific immune response, and disease resistance in juvenile olive flounder, Paralichthys olivaceus. J. World Aquac. Soc. 2019, 50, 65–77. [Google Scholar] [CrossRef] [Green Version]
  66. Bae, K.M.; Kim, K.W.; Lee, S.M. Evaluation of rice distillers dried grain as a partial re-placement for fish meal in the practical diet of the juvenile olive flounder Paralichthys olivaceus. Fish. Aquat. Sci. 2015, 18, 151–158. [Google Scholar]
  67. Sadekarpawar, S.; Parikh, P. Gonadosomatic and hepatosomatic indices of freshwater fish Oreochromis mossambicus in response to a plant nutrient. World J. Zool. 2013, 8, 110–118. [Google Scholar]
  68. Mikołajczak, Z.; Rawski, M.; Mazurkiewicz, J.; Kierończyk, B.; Józefiak, D. The effect of hydrolyzed insect meals in sea trout fingerling (Salmo trutta m. trutta) diets on growth performance, microbiota and biochemical blood parameters. Animals 2020, 10, 1031. [Google Scholar] [CrossRef] [PubMed]
  69. Kostyniuk, D.J.; Culbert, B.M.; Mennigen, J.A.; Gilmour, K.M. Social status affects lipid metabolism in rainbow trout, Oncorhynchus mykiss. Am. J. Physiol. Regul. Integr. Comp. Physiol. 2018, 315, 241–255. [Google Scholar] [CrossRef] [PubMed] [Green Version]
  70. Zubay, G. Biochemistry, 3rd ed.; Brown Publishers: Dallas, TX, USA, 1993; ISBN 0-697-14267-5. [Google Scholar]
  71. Spiller, G.A. Handbook of Lipids in Human Nutrition; CRS Press, Inc.: Boca Raton, FL, USA, 1996; Volume 33431, p. 54. [Google Scholar]
  72. Palmegiano, G.B.; Daprá, F.; Forneris, G.; Gai, F.; Gasco, L.; Guo, K.; Peiretti, P.G.; Sicuro, B.; Zocaratto, I. Rice protein concentrate meal as a potential ingredient in practical diets for rainbow trout (Oncorhynchus mykiss). Aquaculture 2006, 258, 357–367. [Google Scholar] [CrossRef]
  73. Garaffo, M.; Vassallo-Agius, R.; Nengas, Y.; Lembo, E.; Rando, R.; Maisano, R.; Dugo, G.; Giuffrida, D. Fatty Acids Profile, Atherogenic (IA) and Thrombogenic (IT) Health Lipid Indices, of Raw Roe of Blue Fin Tuna (Thunnus thynnus L.) and Their Salted Product “Bottarga”. Food Nutr. Sci. 2011, 2, 736–743. [Google Scholar]
Figure 1. Hepatosomatic index (HSI; left panel) and viscerosomatic index (VSI; right panel) of the fish fed the experimental diets: DC (control diet), DM (Microalgae diet), DP&L diet (Protein and lipid from tuna water cooking), Insect diet (DI) and Mix diet (DMIX). Different letters indicate significant differences (ANOVA, p < 0.05).
Aquacj 02 00004 g001
Figure 2. Cholesterol (mmol/g; left panel) and Triglyceride (mmol/L; right panel) content in the serum of the fish fed the experimental diets: DC (control diet), DM (Microalgae diet), DP&L diet (Protein and lipid from tuna water cooking), Insect diet (DI) and Mix diet (DMIX).
Aquacj 02 00004 g002
Table 1. Formulation (%) of rainbow trout diets used in the study. DC: Control diet; DI: Insect meal diet; DM: Microalgal meal diet; DP&L: Protein and lipid from tuna canning diet; DMIX: diet with all the ingredients mixed; TWC: Tuna water from canning.
IngredientsDCDIDMDP&LDMIX
Squid meal 18.32---8.87
Fish meal 231.5915.7216.5023.8315.00
Insect meal-15.00--15.00
Microalgae--10.00-10.00
Protein (TWC)---7.004.00
Oil (TWC)---8.008.00
Starch 14.500.798.115.756.13
Wheat gluten 315.0015.0018.0015.0014.48
Wheat 415.6015.005.0010.0010.00
Soy bean 50.0014.400.009.700.00
Fish oil 64.008.008.00--
Krill oil4.00----
Plant oil 411.659.8512.0312.846.00
AA mix (Aminopro) 73.003.004.145.00-
Lysine 81.001.001.000.660.75
Threonine 80.420.430.690.700.85
Methionine 8----0.20
Choline 90.160.160.160.160.16
Antibacterian 100.150.150.150.150.15
Antifungal 100.020.020.020.020.02
Antioxidant 110.130.130.130.130.13
Attractant 120.100.100.100.100.10
Anhydrous betaine 130.070.070.070.070.07
Vitamin Conc. 140.100.100.100.100.10
Organic mineral Conc. 140.100.100.100.100.10
Vitamin C 140.100.100.100.100.10
1: Inproquisa S.A., Madrid, Spain; 2: Sarval Bio Industry, Barcelona, Spain; 3: Soficada Ibérica, Barcelona, Spain; 4: Alforpe S.L. Segovia, Spain; 5: Calidad Pascual, Madrid, Spain; 6: Barna S.A., Vizacaya, Spain; 7: Eurocoyal S.L. Barcelona, Spain; 8: Pecus Veterinaria, Tarragona, Spain; 9: Cealvet S.L. U., Tarragona, Spain; 10: Adiveter S.L., Tarragona, Spain; 11: Ecos Metique S. L., Murcia, Spain; 12: Lucta S.A., Barcelona, Spain; 13: Orffa Additives, Breda, Netherlands; 14: Miavit Nutricion Animal, Tarragona, Spain.
Table 2. Proximate composition (% DW), calcium and phosphorus content and main amino acid content of the feeds used in the study. DC: Control diet; DI: Insect meal diet; DM: Microalgal meal diet; DP&L: Protein and lipid from tuna canning diet; DMIX: diet with all the ingredients mixed; TWC: Tuna water from canning.
Composition (% DW)DCDIDMDPLDMIX
Moisture5.716.186.495.726.08
Protein45.0045.0045.0045.0045.00
Fat24.0024.0024.0024.0024.00
Fibre0.861.670.501.340.47
Calcium1.091.101.401.251.18
Phosphorus1.011.001.001.031.05
Met1.040.831.000.860.90
Met + Cys1.601.341.491.401.30
Lys3.272.893.212.732.70
Thre1.801.801.801.801.80
Arg2.412.162.362.141.95
His1.090.860.961.040.85
Trp0.400.350.410.370.29
Val2.392.102.142.161.80
Table 3. Fatty acid composition (% of Total Fatty Acids) of the diets used in the study. DC: Control diet; DI: Insect meal diet; DM: Microalgal meal diet; DP&L: Protein and lipid from tuna canning diet; DMIX: diet with all the ingredients mixed; TWC: Tuna water from canning. SFA: Saturated fatty acids, MUFA: Monounsaturated fatty acids, PUFA: Polyunsaturated fatty acids, EPA: Eicosapentaenoic acid, DHA: Docosahexaenoic acid.
Fatty Acids (%TFA)DCDIDMDP&LDMIX
14:03.112.022.852.102.79
15:00.250.220.590.400.58
16:012.9714.0818.1212.5217.72
18:03.053.644.423.534.37
Total saturated (SFA)21.3821.2827.7119.8027.16
16:13.372.533.502.513.41
18:1n-920.5822.0916.9819.4917.09
18:1n-73.372.982.792.852.90
20:10.130.520.440.440.43
24:10.210.210.280.230.30
Total monounsaturated (MUFA)28.3528.9324.8125.9724.68
18:2n-626.5427.0315.9927.0215.97
18:3n-60.210.280.320.410.33
20:4n-60.470.490.510.460.50
Total n-6 PUFA27.6428.1917.5128.5717.49
18:3n-36.066.716.105.796.04
20:3n-30.770.811.150.821.13
20:5n-3 (EPA)4.793.304.523.494.47
22:5n-30.490.440.580.500.57
22:6n-3 (DHA)4.144.1711.218.3711.14
Total n-3 PUFA18.9218.3326.4221.5926.14
Total PUFA46.9446.5244.4050.5444.08
n-3/n-60.680.651.510.761.49
PUFA/SFA2.202.191.602.551.62
EPA + DHA8.937.4715.7311.8615.61
Table 4. Initial and final weight and length, growth (SGR and RGR, %), condition factor (CF), feed conversion (FCR) and protein efficiency (PER) ratios and FIFO values of rainbow trout juveniles fed the experimental diets (Control, DC; Insect meal, DI; microalgal meal, DM; Protein and lipids from tuna cooking water, DP&L and mixed diet, DMIX). Different letters indicate significant differences (One-way ANOVA p < 0.05).
DCDIDMDP&LDMIX
Initial weight (g)9.11 ± 1.549.08 ± 1.819.27 ± 1.599.09 ± 1.839.21 ± 1.68
Initial length (cm)9.61 ± 0.639.46 ± 0.719.45 ± 0.699.52 ± 0.729.49 ± 0.64
Final weight (g)47.8 ± 7.2 b47.81 ± 7.55 b42.23 ± 7.5 a46.79 ± 6 b44.43 ± 6.65 a
Final length (cm)15.02 ± 0.8 c14.53 ± 0.83 b14.11 ± 0.95 a14.54 ± 0.68 b14.47 ± 0.8 b
CF1.46 ± 0.1 a1.55 ± 0.12 c1.49 ± 0.12 ab1.52 ± 0.11 bc1.46 ± 0.11 a
SGR (%)2.67 ± 0.08 c2.67 ± 0.06 c2.44 ± 0.04 a2.64 ± 0.02 c2.53 ± 0.0 b
RGR (%)4.24 ± 0.24 c4.26 ± 0.2 c3.55 ± 0.13 a4.14 ± 0.08 c3.82 ± 0.01 b
PER (%)3.19 ± 0.133.16 ± 0.162.98 ± 0.873.03 ± 0.102.89 ± 0.08
FCR0.68 ± 0.030.7 ± 0.030.73 ± 0.020.71 ± 0.030.74 ± 0.03
FIFO0.87 ± 0.04 c0.60 ± 0.03 b0.65 ± 0.02 b0.61 ± 0.02 b0.40 ± 0.01 a
Table 5. Muscle proximate (% DW) and fatty acid (% Total Fatty Acids) composition (Average, AV, and SD values) of rainbow trout juveniles fed the experimental diets: Control (DC), Insect meal (DI), Microalgal meal (DM), Protein and Lipid from tuna cooking water (DP&L) and Mixed diet (DMIX). Different letters indicate significant differences (One-way ANOVA p < 0.05). Atherogenic (AI) and Thrombogenic (TI) indices are also included.
DCDIDMDP&LDMIX
CompositionAvSDAvSDAvSDAvSDAvSD
Moisture (%)76.335.8076.675.8077.000.0077.335.8077.675.80
Protein (%)73.583.6072.602.9073.722.5075.575.3073.962.00
Fat (%)16.320.4518.380.7515.790.4015.110.7616.580.10
Carbohydrates (%)4.210.303.420.354.491.153.210.403.260.32
Ash (%)5.89 a0.105.60 b0.306.01 a0.406.11 a0.206.20 a0.20
Fatty Acids (% TFA)
14:02.280.322.060.361.880.071.810.041.910.17
15:00.250.010.280.090.280.050.300.070.340.11
16:013.370.4913.990.4712.430.0813.300.9214.720.65
18:03.630.063.810.183.570.193.920.194.100.19
20:00.330.010.320.050.330.020.340.040.320.04
24:00.120.010.080.070.120.010.130.010.030.06
Total saturated21.69 ab0.8122.24 ab0.2620.35 b0.1821.43 ab1.0123.17 a1.13
16:13.190.143.130.312.900.282.630.123.160.36
18:1n-922.020.5621.542.1422.111.0722.031.5721.213.22
18:1n-72.820.212.610.302.520.142.390.052.460.05
20:12.820.102.820.202.830.152.780.142.690.09
24:10.380.010.350.030.360.010.380.040.350.02
Total monounsaturated32.050.4331.291.9731.521.6531.011.7830.702.86
18:2n-622.360.5221.463.0624.090.5223.950.5919.503.08
18:3n-60.370.070.330.060.450.060.390.050.310.08
20:4n-60.490.010.470.030.470.020.460.020.450.01
Total n-6 PUFA24.170.6423.223.0926.050.4625.890.6021.253.15
18:3n-34.550.094.740.094.590.214.490.064.600.10
20:3n-31.110.111.110.171.170.081.040.031.220.17
20:5n-33.030.222.910.852.690.082.330.263.020.90
22:5n-30.900.070.850.220.780.030.750.080.860.16
22:6n-38.560.309.874.089.251.599.612.1511.733.63
Total n-3 PUFA18.150.2117.887.3818.471.2818.212.3719.864.46
Total PUFA43.630.8942.434.2645.851.6945.542.6842.242.92
n-3/n-60.750.020.810.440.710.040.700.080.960.31
PUFA/SFA2.01 a0.121.91 ab0.202.25 a0.072.13 a0.221.83 b0.18
EPA + DHA11.590.1912.784.7511.941.5411.942.3914.754.52
AI0.3 0.31 0.26 0.27 0.31
TI0.12 0.13 0.12 0.13 0.12
Publisher’s Note: MDPI stays neutral with regard to jurisdictional claims in published maps and institutional affiliations.

