Review

Environmental Hydrogen Concentration as a Novel Factor Determining Changes in Redox Potential

1
Department of Gastrointestinal and Hepato-Biliary-Pancreatic Surgery, Nippon Medical School, Bunkyo-ku, Tokyo 113-8692, Japan
2
Department of Gastrointestinal Surgery, Musashino Tokushukai Hospital, Nishitokyo, Tokyo 188-0013, Japan
Physiologia 2025, 5(4), 36; https://doi.org/10.3390/physiologia5040036
Submission received: 11 August 2025 / Revised: 18 September 2025 / Accepted: 22 September 2025 / Published: 23 September 2025
(This article belongs to the Special Issue Feature Papers in Human Physiology—3rd Edition)

Abstract

Intracellular oxidation–reduction (redox) potential is a key factor regulating various physiological phenomena in the cell. Monitoring this potential change is therefore important for understanding physiological homeostasis in cells. Herein, we propose a new approach for the real-time, non-invasive estimation of the redox potential impacting biological metabolism and reactive oxygen species generation. Enzymes, specifically oxidoreductases, play a crucial role in catalyzing redox reactions by facilitating the transfer of electrons and hydrogen atoms between molecules. The redox potential of substrates, such as nicotinamide adenine dinucleotide, is determined by the ratio of its oxidized and reduced forms, while that of enzymes, such as succinate dehydrogenase, is determined using the reference electrode in protein-film voltammetry. Although the standard hydrogen electrode potential is defined as zero under standard conditions, the electrode potential of a reversible hydrogen electrode changes according to the ratio of the hydrogen ions (H+) and hydrogen gas (H2) in the biological fluids, as a reference electrode. The pH is maintained at 7.4 ± 0.1 in the arterial blood and the H2 that produced by the gut microbiota is measured in the endo-tidal breath for clinical diagnosis. The H2 in the endo-tidal breath equilibrates arterial blood during gas exchange in the lungs, as well as in whole-body tissues, due to the systemic circulation. In this study, H2 can be measured in the environmental gas compared to the atmosphere, and may serve as a novel factor for redox potential changes in redox enzymes, impacting biological metabolism and reactive oxygen species generation.

1. Introduction

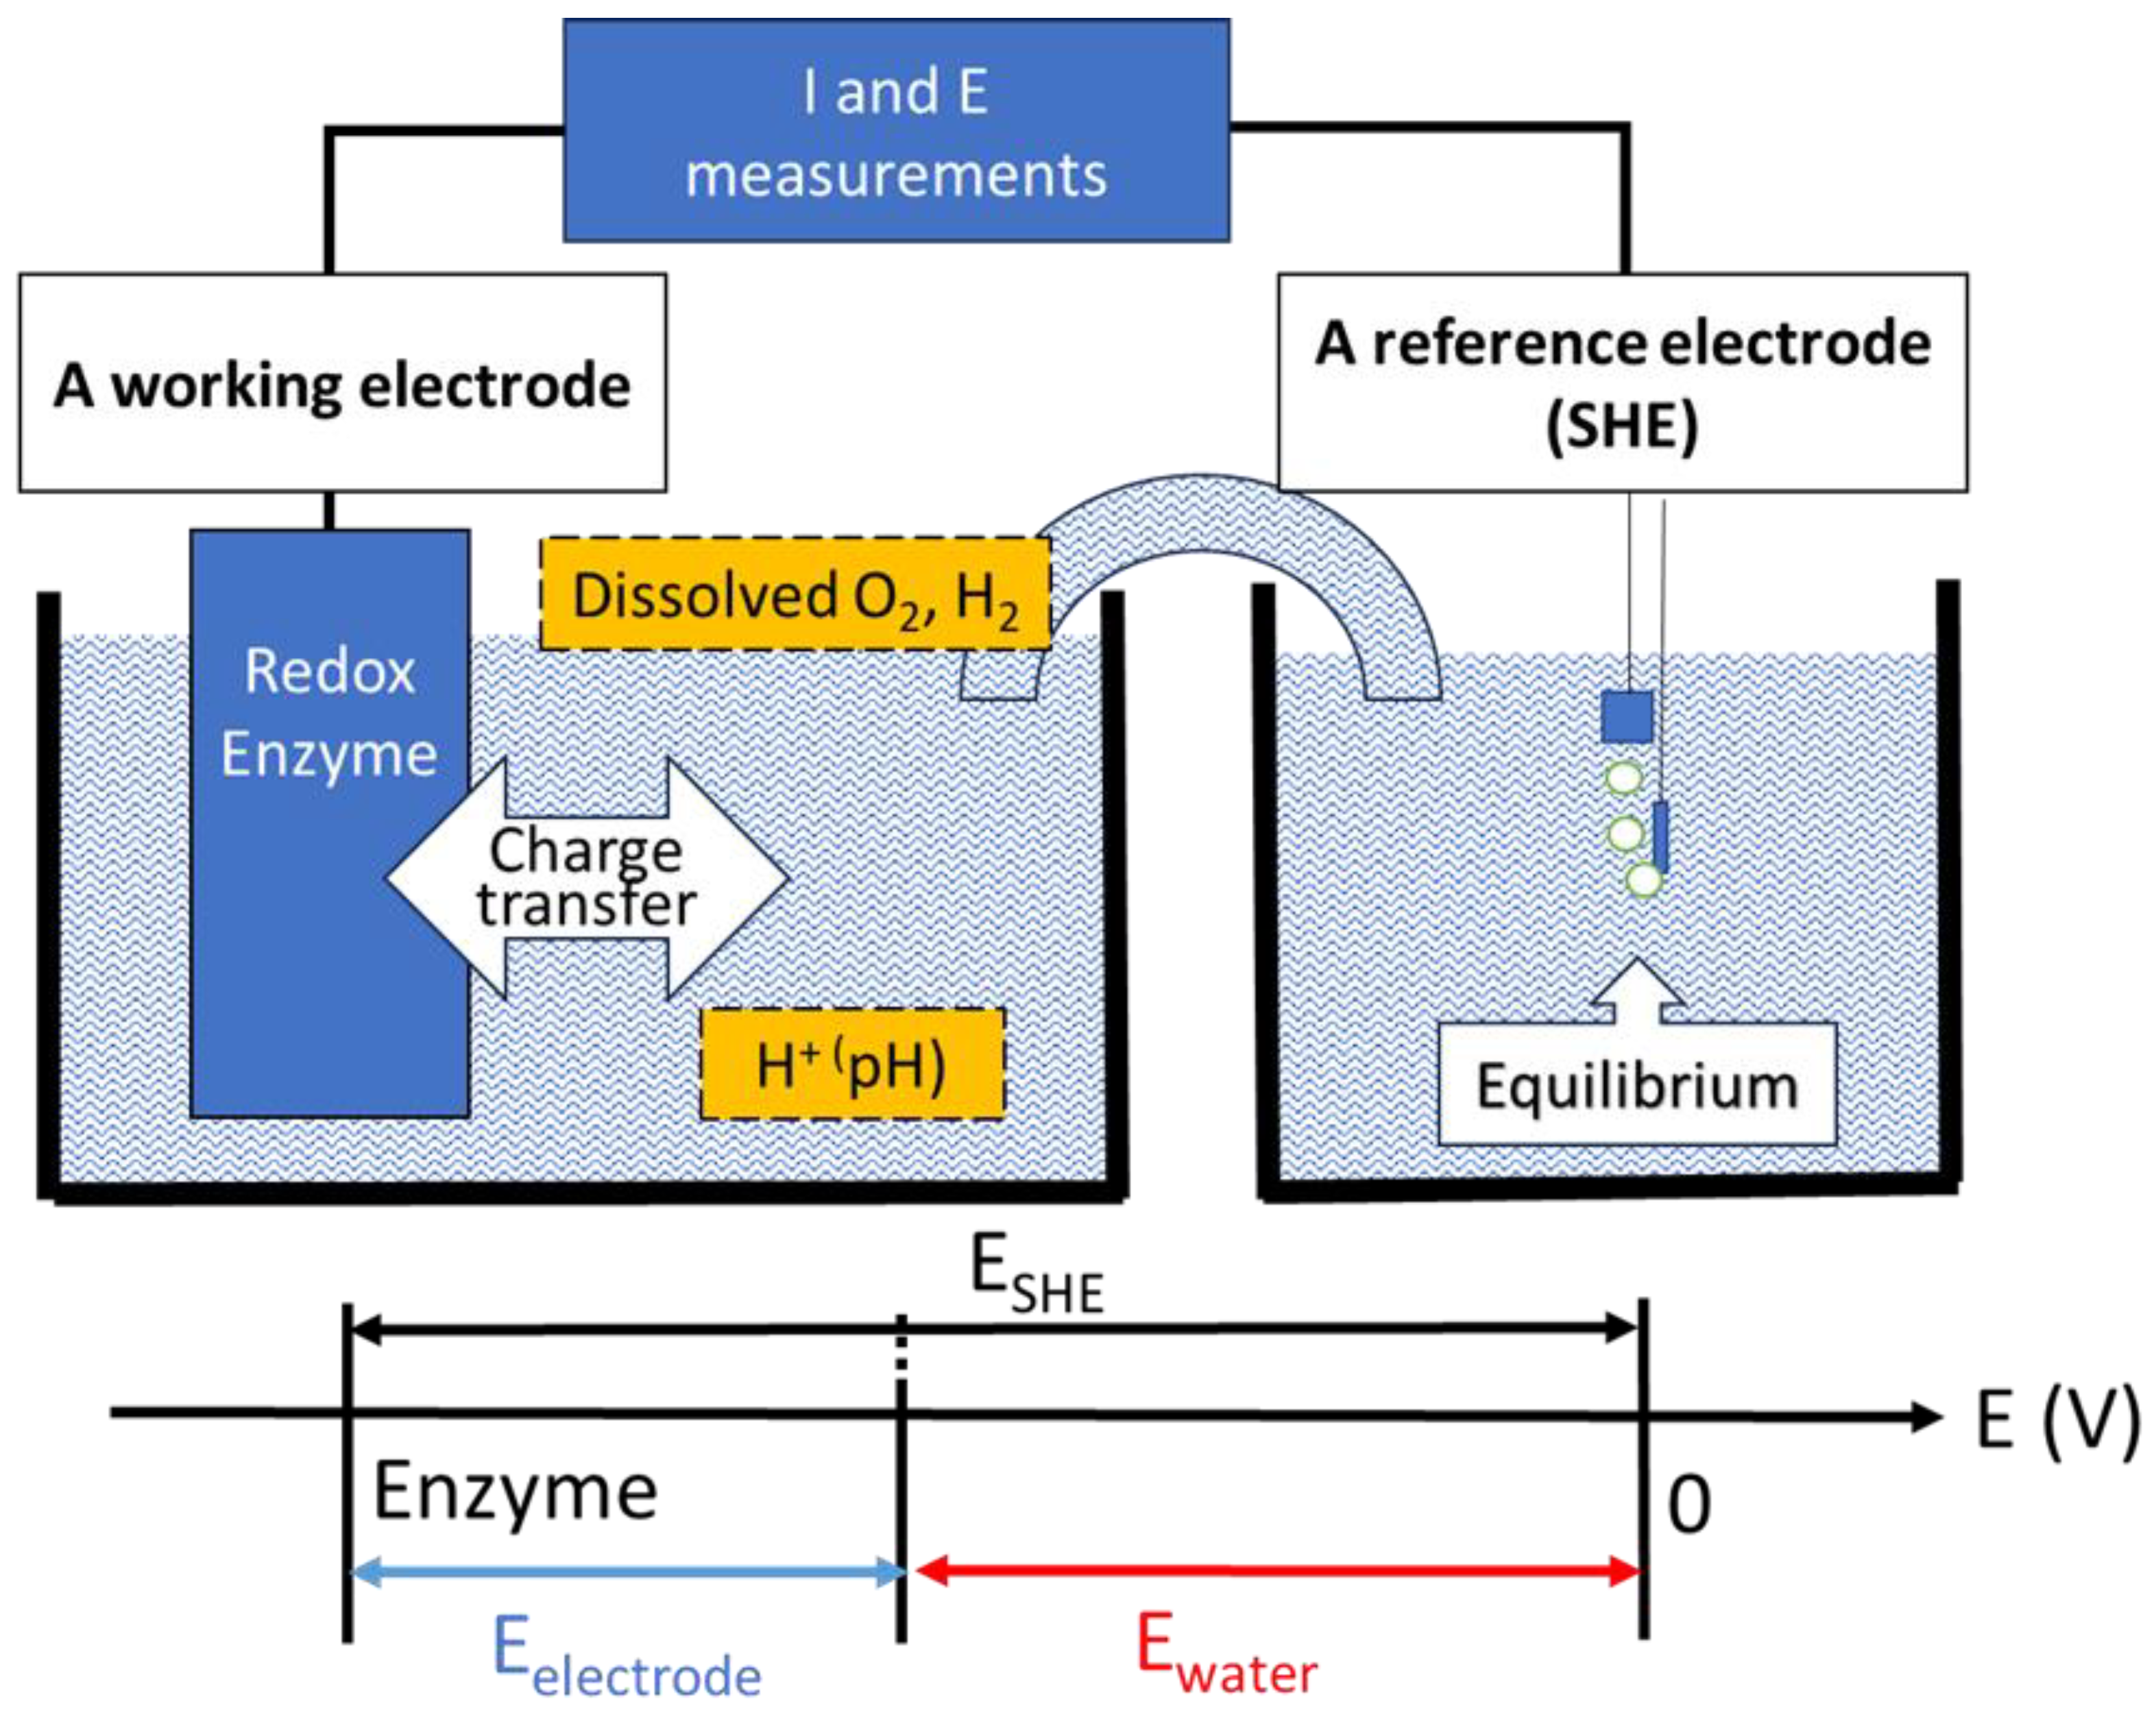
The energetics of electron flow is determined by the reduction-oxidation (redox) potentials of organic and inorganic cofactors as determined by the protein environment [1]. For example, in aerobic respiration, oxygen (O2) is the final electron acceptor and reduced to water (H2O). In anaerobic respiration, the hydrogen ion (H+) is the final electron acceptor, and hydrogen (H2) is produced by several members of the gastrointestinal tract microbiota [2]. Oxidoreductases can couple the oxidation and reduction of at least two substrates. The activity of those enzymes depends on both the substrate concentrations and electrochemical potential of the enzymes due to catalysis and electron transfer [3]. Since cofactors of the active center (e.g., iron, heme, and copper) can be covered by proteins, the influence of other redox substrates is limited, except the substance and product. In protein film voltammetry, some enzymes can be wired to electrodes and function in either direction of the reaction depending on the electrochemical driving force (Figure 1) [4].
The working electrode, with a film of redox enzyme, is placed in a solution-filled electrochemical cell. The addition of a reference and counter electrode yields the three-electrode set-up utilized in standard electrochemical measurements. Potentials are applied between the working and reference electrodes, and current flows through the counter electrode. The gas flow (e.g., O2 and CO2 concentration) is controlled.
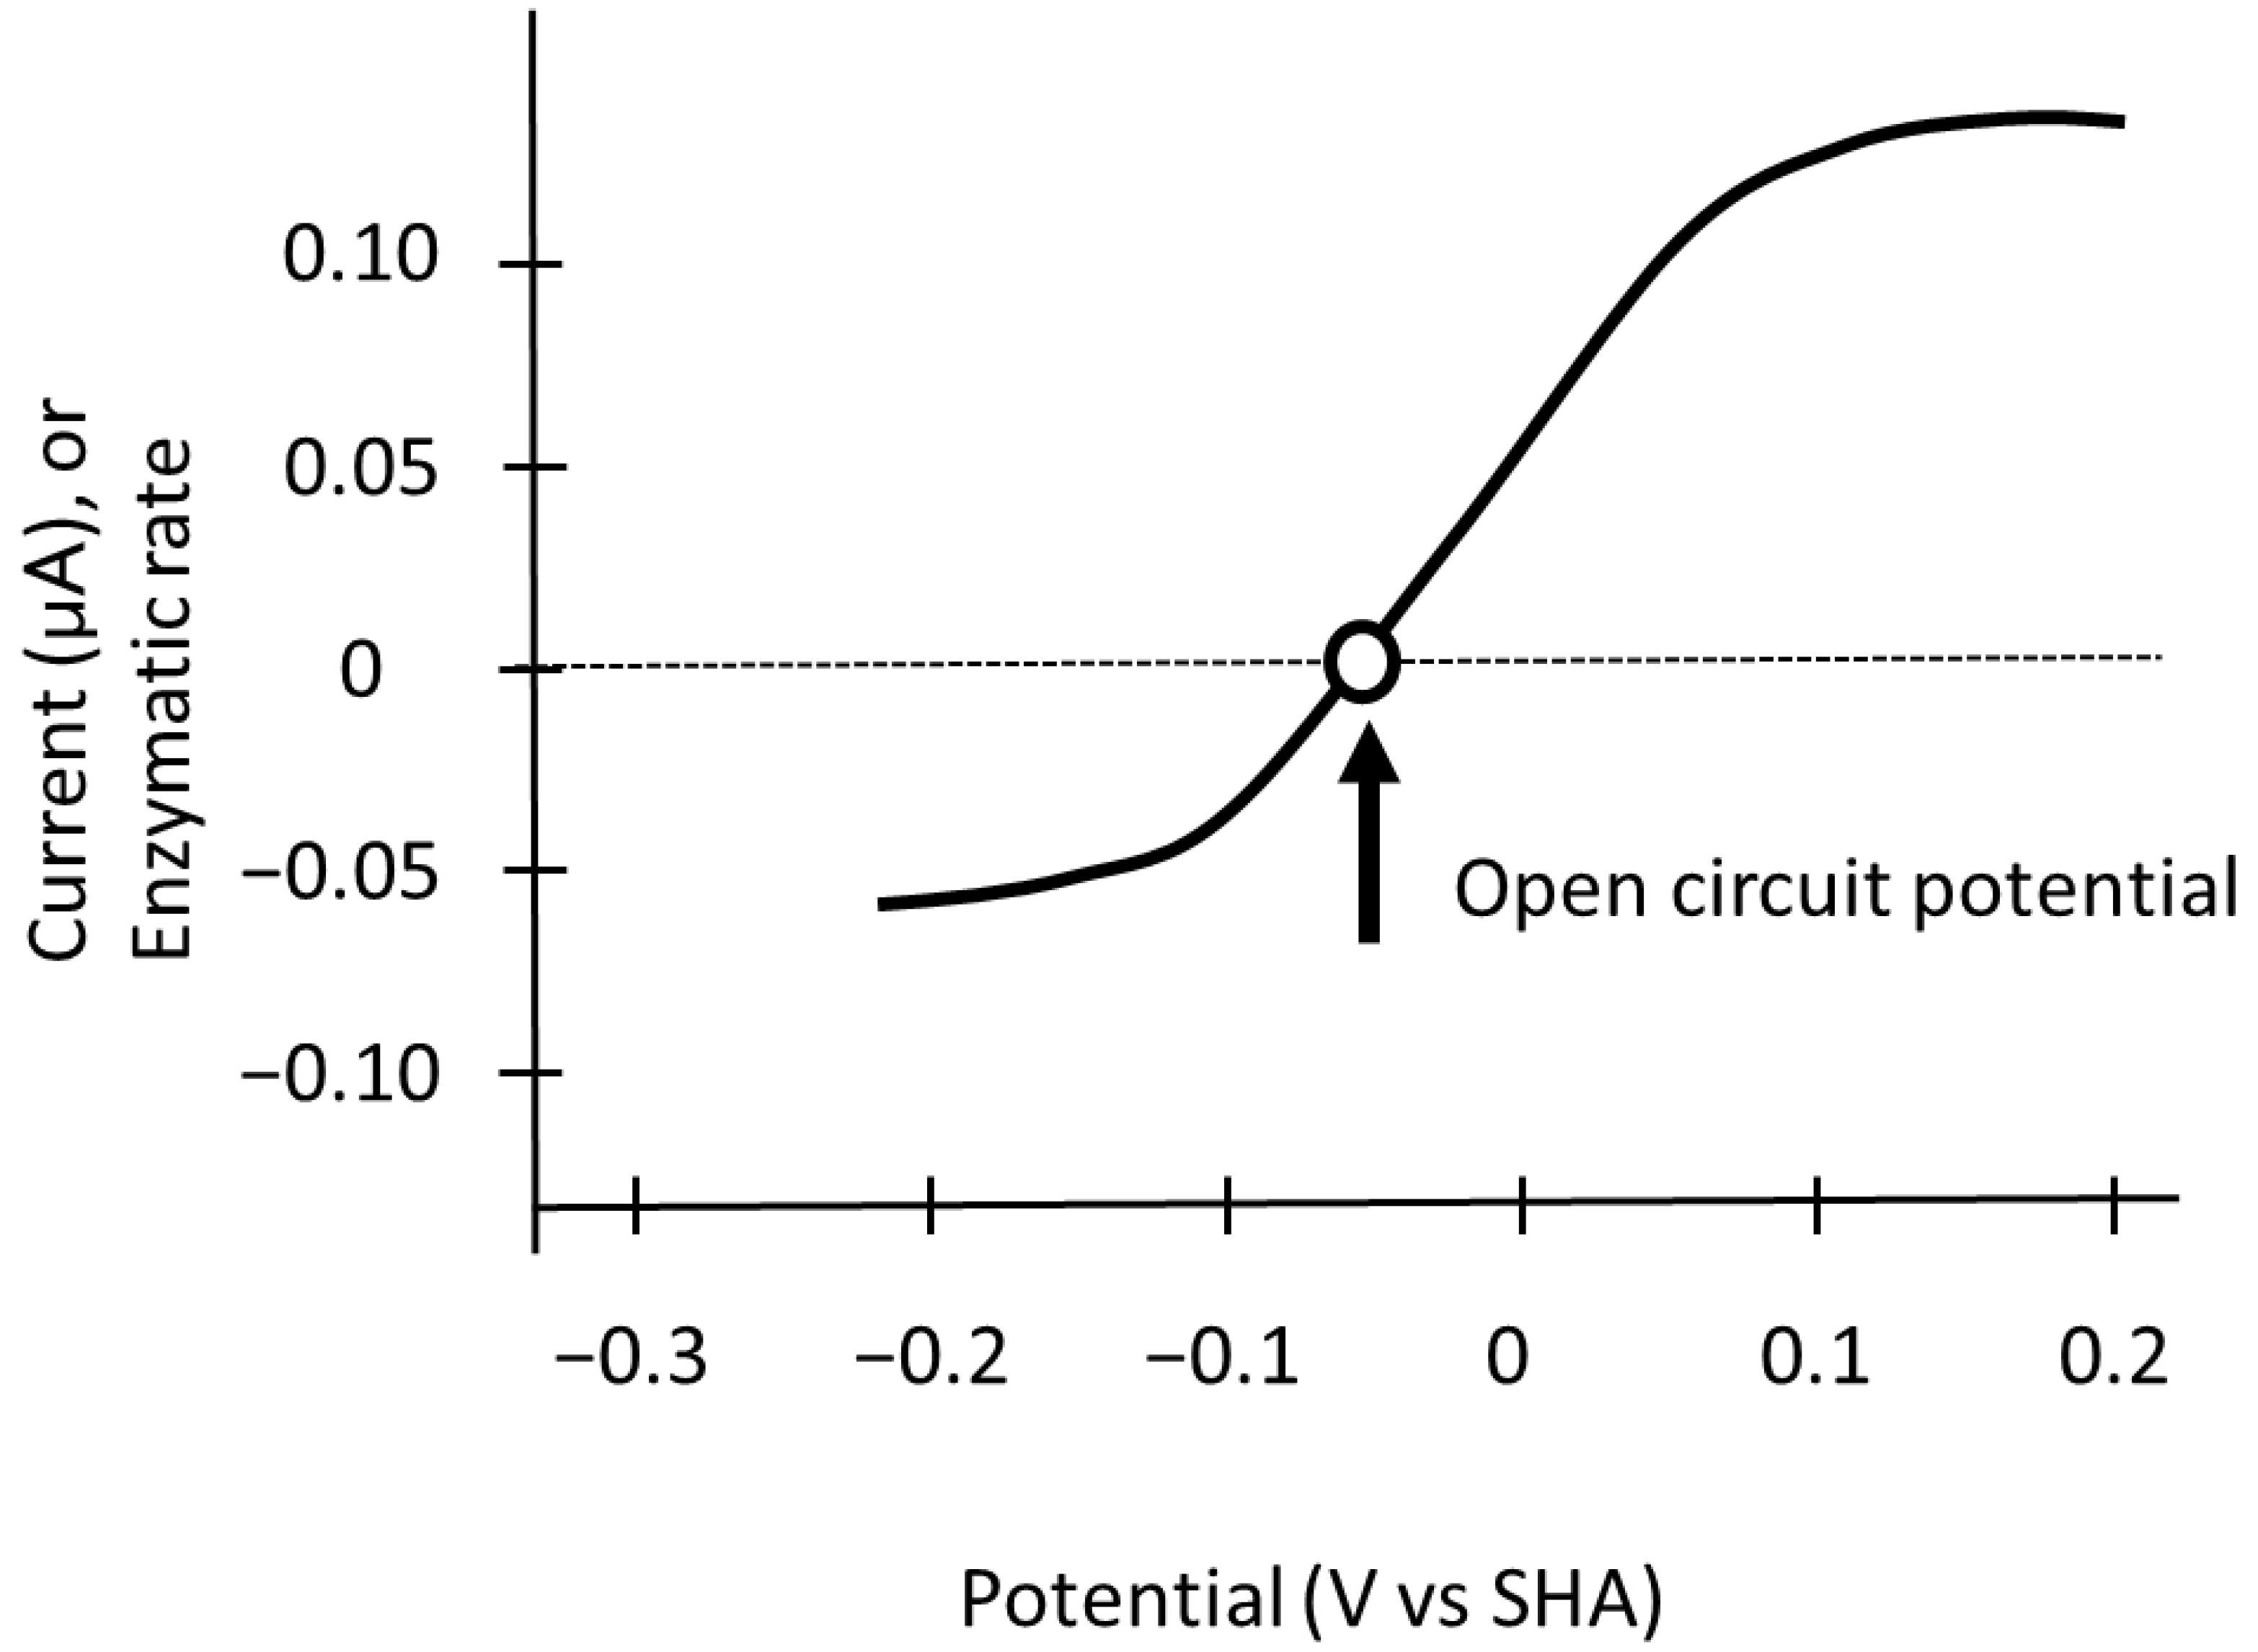
Thermodynamics predicts only the value of the open circuit potential (OCP), where i = 0, such that the forward and reverse reactions proceed at exactly the same rate (Figure 2) [5].
In reversible redox catalysis, the ideal potential-current response displays a single sigmoidal wave that crosses the zero-current axis at the open circuit potential (OCP), marked by an open circle, and reaches a potential-independent limiting current at a relatively high overpotential. When the electrode potential is above the OCP, the forward reaction (i.e., oxidation) occurs, with the reaction rate (current) proportional to the electrode potential. In contrast, when the electrode potential is below the OCP, the reverse reaction (the reduction) proceeds, and the current is similarly proportional to the electrode potential. Finally, in electro-catalysis, as in simple electrochemistry, a potential-independent process eventually becomes rate-limiting at a high overpotential.
This potential equates the formal reduction potential of the substrate/product combination, which can be calculated for any concentration ratio using both the Nernst equation and published value [6]. Even in intracellular fluids comprising various redox substances, the redox potential of the active center of the redox enzyme exhibits a constant potential against the standard hydrogen electrode (SHE) because the substrate specificity of the redox enzyme prevents reactions with other solutes, and the substrate and product are in equilibrium. In the case of succinate dehydrogenase (SDH) in complex II of the respiratory chain, the potential-current wave exhibits a sigmoidal increase in succinate oxidation activity upon increasing the electrode potential, but the wave for fumarate reduction shows a decreased wave upon reducing the electrode potential [7]. Thus, the direction and rate of the catalytic reaction of the redox enzyme depend on alterations in the electrode potential of the active center. The redox potential of SDH exhibits weak dependence on pH (10 mV per pH unit), while the redox potential of the substrate/product couple decreases 60 mV per pH unit [8]. Nonetheless, there is no indicator of the alteration in the potential of the redox enzyme in vivo and it is unclear if the electrochemical potential of the redox enzyme has any physiological relevance.

2. Redox Potential of Water as the Environment of the Redox Enzyme

The environment of living organisms and cultured cells is neutral and aerobic. Water is in equilibrium with gaseous oxygen (O2) and/or hydrogen (H2), as well as hydrogen ions (H+) from oxygen reduction and hydrogen ion reduction [9].
4H+(aq) + O2(g) + 4e ⇄ 2H2O
2H+(aq) + 2e ⇄ H2(g)
O2 and H2 evolution reactions occur when the electrode potentials are high and low, respectively. The range of electrochemical potential is called the electrochemical window. The Nernst equation links the equilibrium potential of an electrode, E, to its standard potential, E0, and the concentrations or pressures of the reacting components at a given temperature, T.
E = E 0 R T n F l n ( r e d u c e d o x i d a i z e d )
where n is the number of electrons transferred, F is Faraday’s constant and R is the universal gas constant. As O2 and/or H+ increase, their electrochemical potential increases. As H2 increases, its electrochemical potential decreases. The redox potential of water is determined according to the Nernst equation: E = +0.815 V for 1 bar-O2 and E = −0.414 V for 1 bar-H2 at pH 7 and 25 °C. Thus, the gaseous O2 and H2 partial pressures above the equilibrium solution determine the electrochemical potential of the solution according to the Nernst equation and is employed to measure the partial pressure of dissolved gases utilizing a Clark electrode with a permeable membrane [10]. At 37 °C, the change in the O2/H2O redox potential combined with the dissolved O2 tension (DOT) and H+ activity is determined by the Nernst equation in pure water [11] as follows:
E = + 15.4 × l o g D O T   61.5 × p H   ( m V ) .
The redox potential of cell-free media is a proportional logarithm of the DOT, with slopes of +21.7 and +34.7 mV/Δlog(DOT), which is greater than 15.4 mV, as predicted by the Nernst equation for pure water. The redox potential of hybridoma cells during exponential growth and at confluence was reported to be in the range of −130 to +70 mV for reduced and oxidized conditions at a constant DOT ranging from 3 to 300% [12]. Different O2 concentrations not only influence the absolute redox values, but also involve oxidation of proteins and/or the generation of reducing agents, such as thiols. O2 is essential for aerobic metabolism, and arterial blood O2 tension is clinically measured to diagnose respiratory and/or circulatory function.
A cell is not at equilibrium, and there are weak couplings between various redox pairs, resulting in the establishment of different redox potentials for coexisting redox pairs in a cell [13]. One of the most common uses of electrochemistry is to measure hydrogen ion concentration of a solution. However, pH is more related to hydrogen ion activity than hydrogen ion concentration.
p H = l o g a H +
a H + = f × H + ,
where a H + is activity of hydrogen ions, f is activity coefficient, and [H+] is hydrogen ion concentration. However, since it is defined in terms of a quantity that cannot be measured by a thermodynamically valid method, Equation (4) can be only a notional definition of pH [14]. The U.S. National Institute of Standards and Technology has defined pH values in terms of the electromotive force existing between certain standard electrodes in specified solutions where the sample (X) and the standard pH solution (S) as follows;
p H X = p H S + E X E S z ,
which depends upon a half-cell reaction of the hydrogen electrode (Equation (2)) according to the Nernst equation. The Nernst slope is calculated as follows;
z = R T F × l n 10 = 2.303 × R T F ,
where R is the gas constant (R = 8.314 J K−1 mol−1), T is the temperature (K), and F is the Faraday constant (F = 9.6485 × 10⁴ C mol−1). Glass electrodes sensitive to H+ are the most commonly employed sensors in chemistry and related disciplines. The formation of an electric potential difference on a thin glass membrane in contact with solution was observed similarly to the hydrogen electrode by Cremer in 1906 and used for the construction of a device that measures the acidity of solutions by Haber and Klemensiewicz in1909 [15]. The glass electrode is in fact a half cell with a membrane forming contact with the other half-cell: Ag|AgCl; KCl|glass membrane. In order to maintain homeostasis, the human body utilizes several physiological adaptations, one of which is maintaining the acid-base balance [16]. H+ (40 nM at pH 7.4) is equilibrated with phosphate (2 mM), bicarbonate (25 mM), and hemoglobin (15 g/dL) in the blood. Dissolved O2 homeostasis is tightly regulated and relies mainly on hemoglobin. While a small fraction of O2 (about 2%) is dissolved in plasma, the majority (approximately 98%) is carried by hemoglobin in red blood cells [17]. Therefore, it is not possible to use the pH nor dissolved O2 as an index of electrochemical potential in the human body due to those buffering systems.
H2 is an inert gas in mammalian cells due to the lack of hydrogenase enzyme. H2 does not readily dissociate into H+ in pure water. However, it can react with water in the presence of a catalyst, such as platinum [18]. Although the pH is proportional to the redox potential, equilibrium behavior for the H+/H2 couple has been verified at gold electrodes from H2 partial pressures of 1 to about 6 × 10⁻⁴ atm [19]. Primary pH standard values can be deduced from electrochemical data from the cell without transference using the hydrogen gas electrode, known as the Harned cell [14]. Thus, environmental H2 partial pressure appears to be a redox potential-specific and sensitive factor of the hydrogen electrode in the solution where pH is buffered. It is hypothesized that the environmental H2 concentration is a novel factor determining changes in the redox potential of the water solution.

3. Measurement of the Reversible Hydrogen Electrode Potential as a Reference Electrode

The SHE serves as the fundamental reference element in electrochemical devices [20]. It consists of a platinum electrode and an acidic solution with the unit activity of protons (H+) (pH 0), through which H2(g) supplied at a fugacity of 1.00 bar (fH2 = 1.00 bar) passes, ideally in the form of small bubbles. However, if at least one of these parameters is not unitary, the SHE becomes a reversible hydrogen electrode (RHE) and its potential deviates from that of the SHE. The hydrogen electrode is based on the redox half-cell reaction (Equation (2)). The electrode potential was calculated from the activity of H+ and the fugacity of H2 using the Nernst equation, as follows:
E R H E = E 0 R T 2 F l n f H 2 a H + 2 = 0 2.303 R T 2 F × log f H 2 a H + 2 = 0 2.303 R T 2 F × l o g f H 2 2 × l o g a H +   ( V ) ,
where a H + is the activity of H+, and f H 2 is the fugacity of H2. The value of 2.303RT/2F, the Nernst slope, was calculated at 25 °C (T = 297.15 K) as follows:
2.303 R T 2 F = 2.303 × 8.314 × 297.15 2 × 9.6485 × 10 4 = 0.0590 2
In a liquid mixture, the fugacity of each component is equal to that of the vapor component in equilibrium with the liquid. H2 is a trace gas that comprises only a minuscule portion of the atmosphere and has a mixing ratio of around 0.530 ± 0.006 ppm with seasonal change [21]. The surface layers of the world’s oceans are generally supersaturated with H2, typically 2- to 5-fold (up to 15-fold) relative to the atmosphere, where H2 is mainly generated by nitrogen fixation by cyanobacteria [22]. Mammalian cells lack functional hydrogenase genes, but H2 is fermented by the gut microbiome and a part of H2 is exhaled from the lungs by the systemic circulation [23]. The organs and tissues are saturated by H2 in the alveolar air [24]. The mean breath H2 concentration in healthy Japanese subjects was 13 ppm, which was 20-fold relative to the atmosphere [25]. The H+ concentration at pH 7.4 is 40 nM, whereas the dissolved H2 concentration in the solution equilibrated with 13 ppm-H2 is calculated as 10 nM using Henry’s law constants [Hcp = 7.8 × 10⁻⁴ (mol/(L∙bar))].
Application of the Nernst equation allows for explanation of the influence of the activity of H+(aq) and the fugacity of H2(g) on the potential of the hydrogen electrode. This is achieved in two stages. In the first stage, the fugacity of H2(g) is assumed to be a unit, while the activity of H+(aq) is varied between 10−14 and 1.00 M. The potential of RHE is calculated from Equations (2) and (8) as
E R H E = 0 0.0590 × p H   ( V )   a t   25   ° C .
A negative logarithm function is used to convert very small numbers into more manageable values. The concentration of H+ in any solution ranges from 1 mol to 10−14 mol per liter of solution and pH ranges between 0.00 and 14.00. The pH is defined by the electrode potential difference as compared to the standard pH solution for the quantitative measure of the acidity or alkalinity of an aqueous solution [17]. In the second stage, the activity of H+(aq) is a unit, while the fugacity of H2(g) is varied between 0.53 × 10⁻⁶ (the atmosphere) and 1.00 bar. The fugacity of H2 at low pressure is equal to the ratio of the partial pressure of H2 (PH2) over the standard pressure (PH2/P0, P0 = 1.00 bar) and is equal to its concentration in the atmosphere above sea level ( C H 2 ). The potential of RHE is calculated as
E R H E = 0 + 0.0590 2 × p H 2   ( V )   a t   25   ° C .
where pH2 is defined as
p H 2 = log f H 2 = l o g P H 2 P 0 = log C H 2 ,
and pH2 varies between 0.00 and 6.28. The potential of the RHE is calculated using the pH of the solution, as well as the pH2 measured with an H2 gas sensor at a gaseous H2 concentration in equilibrium with the solution. If both the fugacity of H2 and the activity of H+ are not a unit, The potential of RHE is calculated from Equations (11) and (12) as
E R H E = 0.0590 2 × p H 2 0.0590 × p H   ( V )   a t   25   ° C .
Instead of an SHE, which requires an acidic solution to be continuously supplied with H2 gas as a reference electrode potential, the RHE is a half-cell with a well-defined and highly reproducible electrode potential [26].

4. Alterations in the Electrode Potential of the Active Site of Oxidoreductases

Prominent members of redox centers include cytochromes and cupredoxins with hemes and blue-copper centers, respectively. Together, these centers cover the entire range of reduction potentials, the electrochemical window, in biology [27]. The redox potential of the solution represents its mixed potential. The redox environment of a linked set of redox couples, such as those found in biological fluids, organelles, cells, or tissues, is determined by the sum of the products of the reduction potentials and reducing capacities of the linked redox couples that are present [28]. Historically, several approaches have been developed to estimate the actual cellular reduction potentials for the oxidized/reduced nicotinamide adenine dinucleotide and glutathione/glutathione disulfide ratios as solutes, as well as to determine whether a given substance undergoes reduction or oxidation [29,30]. The intracellular fluid contains various redox substances, as well as dissolved O2, H2 and H+ (pH) (Figure 3).
Redox enzymes are large and electronically insulating through most of their volume, which stabilizes the redox potentials of their active centers against the standard hydrogen electrode, even if the ratio of substrate/product is not constant. The solution contains many redox pairs with different redox potentials, e.g., nicotinamide adenine dinucleotide, glutathione, and thiols, as well as oxygen and hydrogen gases. The redox potential of the solution represents its mixed potential.
The electrode potential can be regarded as the potential difference between a point in the solid conductor (metal) and a point in the electrolytic solution [31]. In practical measurements, the electrode potential is measured as a relative value by introducing an additional electrode (i.e., a reference electrode). For example, dissolved O2 is measured using a Clark electrode with a permeable membrane [32] and pH (H+) is measured using a glass electrode. Each oxidoreductase has a specific intrinsic redox potential (E°) of the active site relative to the SHE [33]. The potential of the redox center (E°′) is stable due to both the substrate specificity of the enzyme and the substrate/product equilibrium state. It is calculated as the potential difference relative to the redox potential of water (E water), rather than based on the ratio of the oxidized/reduced redox couple. Every redox center has different electrochemical potential in the solution as compared to water as a solvent (the mixed potential) (Figure 4).
E ° = E ° E w a t e r
The electrode potential is the potential difference between a point in the solid conductor (the redox enzyme) and another point in the electrolytic solution (the Galvani potential). In practical measurements, the electrode potential is measured as a relative value by introducing an additional electrode (reference electrode). For example, it is used to measure the potential of a water containing dissolved oxygen, hydrogen, and hydrogen ions (pH), as well as to determine whether reduction or oxidation of a substance occurs in a potential-pH diagram. The electrode potential of a redox enzyme is determined by the redox potential difference between the redox enzyme’s active center and water.
The redox potential of water is determined by the relative concentrations of O2 and H2. When the O2 tension decreases due to O2 consumption and the environmental fluid becomes reduced, the electrode potential of the oxidoreductase increases, whereas when the O2 tension increases due to exogenous O2 supply and the environmental fluid becomes oxidized, the electrode potential of the oxidoreductase decreases. Reducing conditions resulted in the highest viable cells, monoclonal antibody concentrations, and thiol production in hybridoma cells [12]. Oxidant conditions resulted in a detrimental effect in all culture parameters, increasing the specific glucose, glutamine, and O2 consumption rates, as well as inducing the apoptotic process.
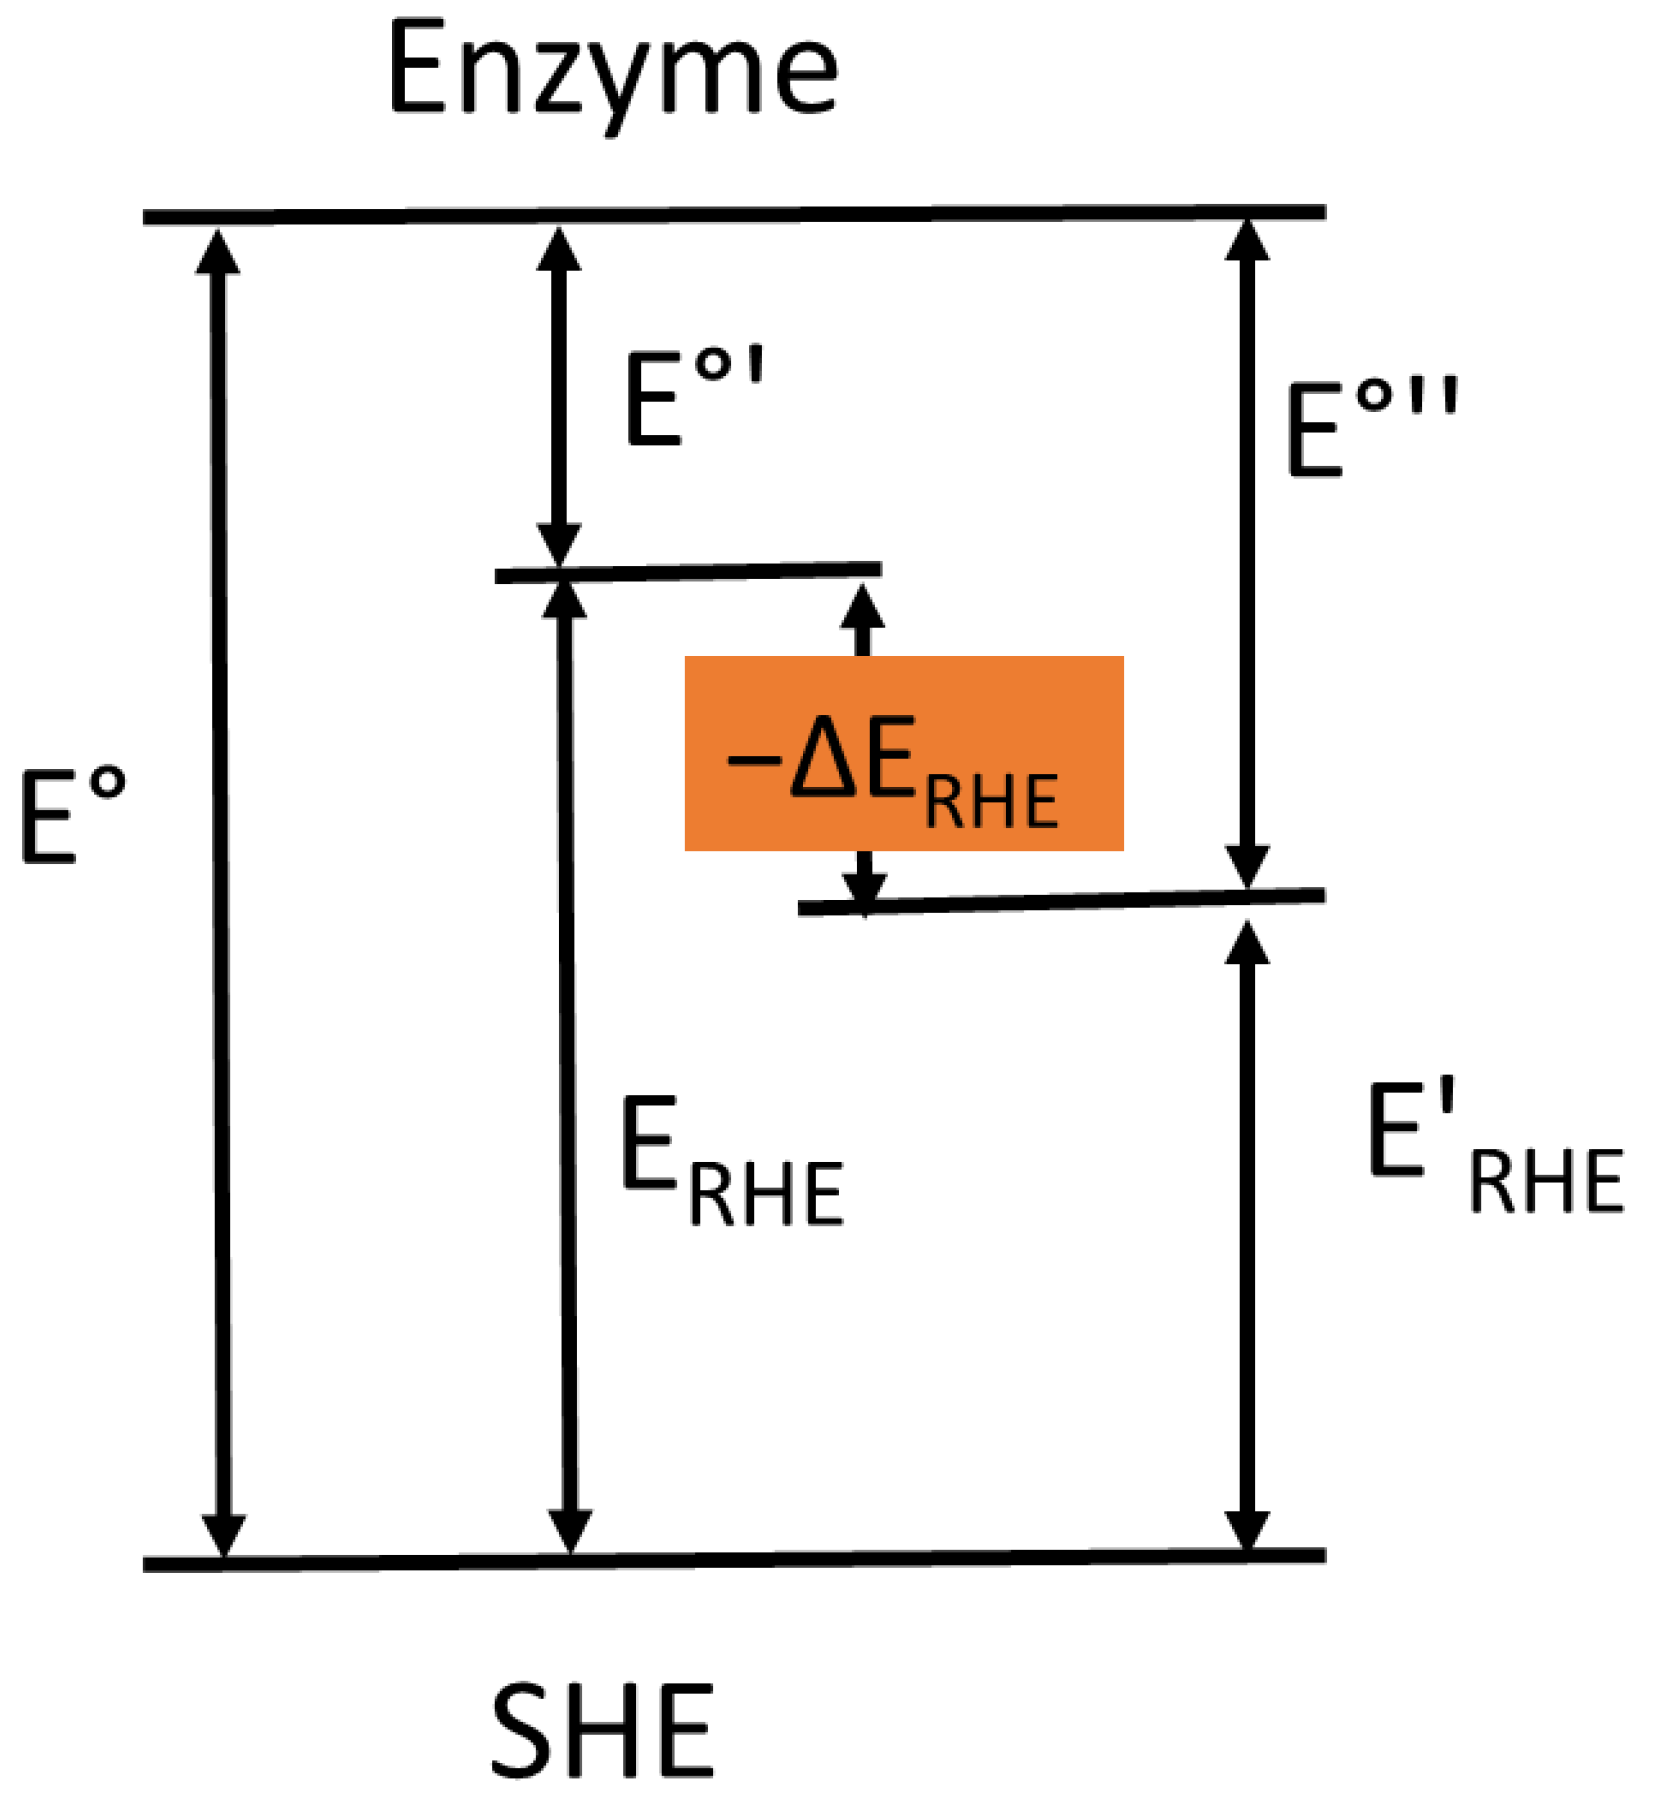
The standard potential of any redox enzyme should be reported with respect to the SHE. The conversion of potential values between a RHE and the SHE can be easily accomplished using the below equation:
E ° = E ° + E R H E
where E° is measured versus the SHE; E°′ is the potential measured versus the RHE; and ERHE is the potential of the RHE versus the SHE (Figure 5). When measurements are made at other H2 pressures, the sum of the electrode potential of enzyme (E°′) and reversible hydrogen electrode potential (ERHE) is equal to the sum of the electrode potential of enzyme (E°″) and reversible hydrogen electrode potential (E′RHE).
E ° = E ° + E R H E = E ° + E R H E
Changes in the electrode potential of the redox enzyme is generated by changes in the reversible hydrogen electrode potential as follows:
E = E ° E ° = E R H E E R H E
Reversible hydrogen electrodes, which depend on the solution pH and hydrogen gas pressure, are widely used experimentally as a reference electrode. When the reversible hydrogen electrode potential changes with pH and hydrogen pressure, the electrode potential difference (ΔE) is determined by these changes in the reversible hydrogen electrode potential (ΔERHE).
When environmental H2 tension increases and the environmental fluid becomes reduced in spite of pH buffer systems, the electrode potential of the redox enzyme will be considered. An increase in the H2 partial pressure (environmental concentration) was shown to reduce the redox potential of a phosphate buffer solution according to the Nernst equation [25].
E ° = E ° E R H E
The electrode potential of the redox enzyme will increase due to an increase in the H2 partial pressure. Changes in the electrode potential can be calculated wherever pH is buffered as follows:
E = E R H E = 2.303 R T 2 F p H 2 p H 2 = 0.0590 2 × p H 2 p H 2   ( V )   a t   25   ° C .
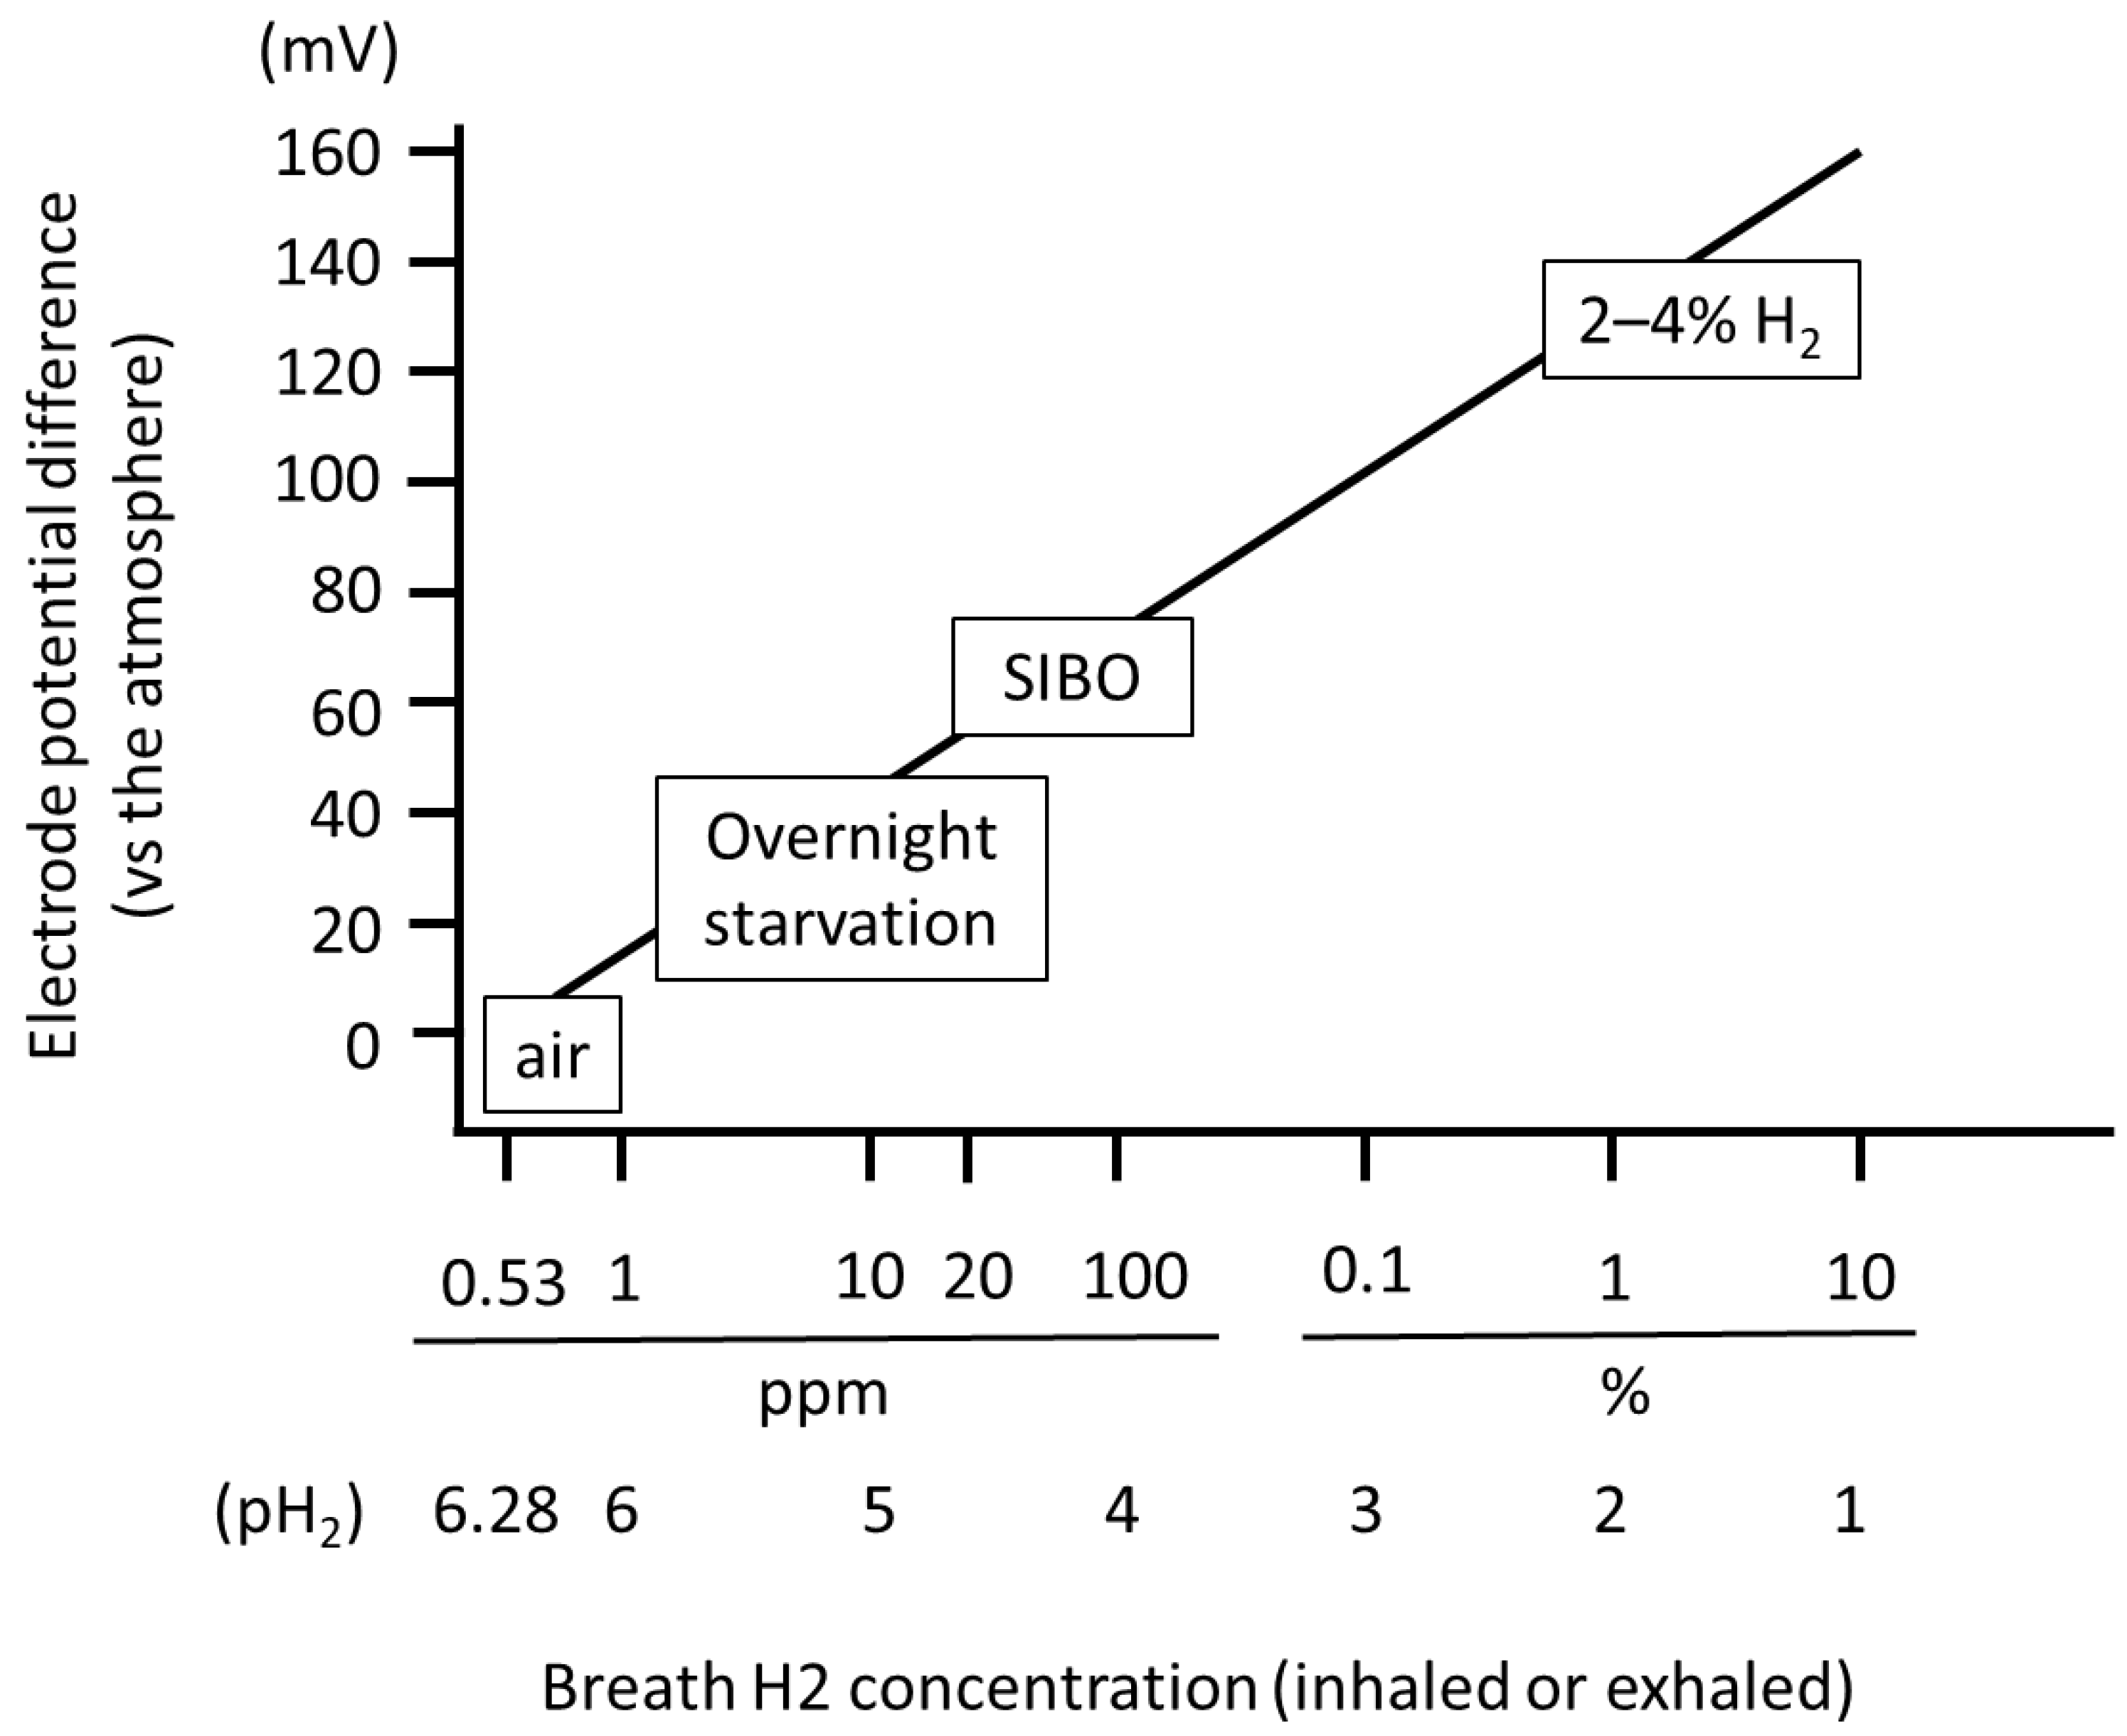
Therefore, under aerobic conditions, the lower limit of H2 concentration is the atmospheric H2 concentration, and an increase in H2/a decrease in pH2 leads to an increase in the electrode potential of the redox enzymes as follows at 37 °C (310.15 K) (Figure 6).
E = 0.0615 2 × p H 2 6.28   ( V )   a t   37   ° C .
The H2 concentration in the exhaled/inhaled breath ranges from 0.53 ppm to 4%. The pH2 (negative logarithm of H2 concentration) ranges from 6.28 to 1.4. The electrode potential difference against the atmosphere is proportional to the pH2.

5. Environmental O2 and/or H2 Levels Change the Direction of Redox Reactions and Reactive Oxygen Species (ROS) Generation

Most (~98%) of the oxygen in blood is bound to hemoglobin in red blood cells (RBCs), while dissolved O2 in the plasma and RBC water is about 2% of the total [17]. The solubility of O2 is minimal (0.3 vol% at a O2 tension of 100 mmHg), and O2 is consumed at complex IV of the respiratory chain. In an animal model, 100% O2 administration doubled the subcutaneous and large intestine intramural O2 tension and increased the O2 tension to 40% in the small intestine [34]. During hyperbaric O2 conditions the magnetic resonance imaging (MRI)-derived extracellular O2 tension in the brain was markedly lower than the arterial pO2, but slightly higher than the cerebral venous pO2 [35]. Cerebral venous blood is still not fully saturated (below 100 mmHg) up to 3.5 atmosphere absolute (ATA) of hyperbaric oxygen (2660 mmHg) [36]. This is because dissolved O2 in the blood plasma is rapidly consumed, and O2 is released from hemoglobin in RBCs, which results in a venous O2 partial pressure below 100 mmHg. Hyperbaric oxygen (4.8 ATA) rapidly produces intracellular bioenergetic dysfunction and induces oxygen toxicity in human pulmonary cells [37].
Exogenous hypoxic conditions (0.2% O2) in an in vitro study reduced mitochondrial O2 concentration and reactive oxygen species (ROS) levels, whereas exogenous hyperoxic conditions (40% O2, 300 mmHg) increased mitochondrial O2 concentration and ROS levels [38]. Ischemia–reperfusion injury is tissue damage caused by ROS when the blood supply returns to tissues after ischemia or O2 deprivation. The mean mitochondrial O2 tension in rat liver was demonstrated to drop from approximately 30–40 mmHg to approximately 10 mmHg during ischemia [39]. The 15 min reperfusion time led to a complete alteration in the mitochondrial O2 distribution, which flattened overall as compared to the baseline situation. The mitochondrial O2 tension histograms revealed that both low- and high-O2 regions were more prominently present, with some development toward higher O2 during reperfusion. Above-normal O2 levels in the blood can increase the production of ROS, potentially contributing to reperfusion injury [40]. Such a negative effect is supported by the Australian Air Versus Oxygen in Myocardial Infarction (AVOID) trial, which reported larger infarct sizes in patients with ST-segment elevation myocardial infarction (STEMI) who received O2 compared to those who did not receive O2 [41]. ROS are primarily produced by complexes I and III of the respiratory chain via reverse electron transport [42]. Since the direction of electron flow depends upon the electric potential gradient, relatively high mitochondrial O2 tension would affect the redox potential of the active center in both complexes I and III. Both reducing and oxidant conditions were maintained in 1 l bioreactors through automatic control of the inlet gas composition at constant dissolved O2 tension [12]. As culture redox potential increased, a linear decrease in the maximum concentration of viable cells, monoclonal antibodies, and thiols, as well as an increase in the various nutrient consumption rates was observed. Such a behavior indicates that a more oxidant environment is detrimental to culture performance. Instead of inlet O2 tension, culture redox potential can also be controlled by manipulating other independent variables, such as pH or by the addition of different antioxidants [43].
For a long time, H2 was thought to be a “biologically inert gas” which could not react with biomolecules under normal pressure. The biological effect of H2 is much less understood compared to that of O2. Interestingly, it has been reported that inhalation of H2 gas reduced oxidative stress, the volume of cerebral infarction, and the size of myocardial infarction in a rat model [44,45]. When H2 was added to mitochondria isolated from A549 cells, electron transport by succinate was reversed to forward electron transport, and ROS generated primarily from respiration was suppressed [46]. In complex I, environmental H2 influence the direction of electron transport and ROS generation. H2 decreases mitochondrial membrane potential by 11%. ROS generation in complex III is suppressed by mitochondrial membrane potential depletion [47]. Furthermore, in order to prevent ischemia–reperfusion injury, inhalation of 2–4% H2 is required prior to injury. Since the H2 concentration of the atmosphere is below one-millionth, 2–4% H2 inhalation would compensate with fluctuations of the redox potential due to changes in mitochondrial O2 tension during ischemia–reperfusion from 0–10 mmHg to 30–40 mmHg-O2.

6. Fluctuations in Environmental H2 Concentration and Metabolism

In the healthy human, H2 is produced by the gut microbiota and exhaled according to the H2 partial pressure gradient. In young women, breath H2 was reported to exhibit an obvious circadian rhythm, increasing in the morning, decreasing to a minimum by 16:00, and then increasing again during the night [48]. Breath H2 excretion depends not only on feeding and fasting patterns, but also on host organ function [49]. Consumption of a low-carbohydrate diet for 24 h prior to measurement reduces breath H2 excretion [50]. Resistant starch and dietary fiber have been shown to increase breath H2 excretion [51,52]. Higher breath H2 concentrations during fasting have been reported in patients with exocrine pancreatic insufficiency and small intestinal bacterial overgrowth (SIBO) [53,54]. Body weight, body mass index, and visceral fat in patients with SIBO have been shown to be inversely correlated with H2 production [55]. A previous in vivo study demonstrated that 4% H2 inhalation for 1 h twice a day for 6 months reduced the body weight of rats and increased the level of metabolites such as glucose 6 phosphate dehydrogenase (G6PD) and 6-phosphogluconate dehydrogenase (Pentose Phosphate Pathway) and malic acid (TCA cycle and cytosol) involved in reactions that reduced nicotinamide adenine dinucleotide phosphate (NADP+) to NADPH [56]. In PFV the oxidative current of G6PD rapidly increased in the applied potential from +0.2 to +0.8 V vs. Ag/AgCl [57]. Glutathione reductase (GR) catalyzes the reduction of oxidized glutathione (GSSG) to reduced glutathione (GSH) using NADPH as the reducing cofactor, and the initial-velocity of GR reached saturation depending on the concentration of NADPH [58]. Although H2 concentration in the breath varies during the day, short-term exposure to high concentrations of H2 may influence redox enzyme reaction rates, leading to reduction of NADP+ and GSSG. Therefore, environmental H2 in a gaseous state may be a novel approach for the electrode potential of redox enzymes to evaluate the kinetic characteristics and metabolic function. The importance of the enzyme kinetics involved must be addressed in future studies to fully grasp how reversible hydrogen electrode potential influence the cellular redox state and oxidative stress.

7. Conclusions

H2 is fermented by the colonic microbiotas and exhaled from the lungs out of the body. A breath H2 test noninvasively measures the end-tidal H2 concentration, which is equilibrated within the tissues. When the H2 partial pressure of the tissues is higher than that of the end-tidal H2, H2 will be exhaled to the alveoli. However, when the H2 partial pressure of the tissues is lower than that of the end-tidal H2, H2 will be diffused to the tissues. The H2 concentration is typically expressed as a percentage of hydrogen in the atmosphere, and as such, the breath H2 concentration can be thought of as being equal to its partial pressure. The reversible hydrogen electrode potential depends on the logarithm of the gaseous H2 partial pressure equilibrated with the solution and H+ activity in the solution. In this study, the negative logarithm of environmental H2 concentration is introduced as an index of redox potential in human body as compared to the air in order to evaluate metabolic function and ROS generation.

Funding

This research received no external funding.

Institutional Review Board Statement

Not applicable.

Informed Consent Statement

Not applicable.

Data Availability Statement

Not applicable.

Conflicts of Interest

T.K. has filed a patent application for the technology described in this paper.

Abbreviations

The following abbreviations are used in this manuscript:
O2Oxygen
H2OWater
H+Hydrogen ion
H2Hydrogen
OCPOpen Circuit Potential
SHEStandard Hydrogen Electrode
SDHSuccinate dehydrogenase
DOTDissolved Oxygen Tension
RHEReversible Hydrogen Electrode
ROSReactive Oxygen Species
RBCRed blood cell
ATAAtmosphere absolute
SIBOSmall intestinal bacterial overgrowth
CO2Carbon dioxide
G6PDGlucose 6 phosphate dehydrogenase
NADP+Nicotinamide adenine dinucleotide phosphate
GSHglutathione
GSSGGlutathione disulfide
GRGlutathione reductase

References

  1. McGuinness, K.N.; Fehon, N.; Feehan, R.; Miller, M.; Mutter, A.C.; Rybak, L.A.; Nam, J.; AbuSalim, J.E.; Atkinson, J.T.; Heidari, H.; et al. The energetics and evolution of oxidoreductases in deep time. Proteins 2024, 92, 52–59. [Google Scholar] [CrossRef] [PubMed]
  2. Smith, N.W.; Shorten, P.R.; Altermann, E.H.; Roy, N.C.; McNabb, W.C. Hydrogen cross-feeders of the human gastrointestinal tract. Gut Microbes 2018, 10, 270–288. [Google Scholar] [CrossRef]
  3. Elliott, S.J.; Léger, C.; Pershad, H.R.; Hirst, J.; Heffron, K.; Ginet, N.; Blasco, F.; Rothery, R.A.; Weiner, J.H.; Armstrong, F.A. Detection and interpretation of redox potential optima in the catalytic activity of enzymes. Biochim. Biophys. Acta (BBA)-Bioenerg. 2002, 1555, 54–59. [Google Scholar] [CrossRef]
  4. Adamson, H.; Bond, A.M.; Parkin, A. Probing biological redox chemistry with large amplitude Fourier transformed ac voltammetry. Chem Commun. (Camb.) 2017, 53, 9519–9533. [Google Scholar] [CrossRef]
  5. Léger, C.; Bertrand, P. Direct Electrochemistry of Redox Enzymes as a Tool for Mechanistic Studies. Chem. Rev. 2008, 108, 2379–2438. [Google Scholar] [CrossRef]
  6. Gates, A.J.; Kemp, G.L.; To, C.Y.; Mann, J.; Marritt, S.J.; Mayes, A.G.; Richardoson, D.J.; Butt, J.N. The relationship between redox enzyme activity and electrochemical potential-cellular and mechanistic implications from protein film electrochemistry. Phys. Chem. Chem. Phys. 2011, 13, 7720–7731. [Google Scholar] [CrossRef]
  7. Pershad, H.R.; Hirst, J.; Cochran, B.; Ackrell, B.A.C.; Armstrong, F.A. Voltammetric studies of bidirectional catalytic electron transport in Escherichia coli succinate dehydrogenase: Comparison with the enzyme from beef heart mitochondria. Biochim. Biophys. Acta-Bioenerg. 1999, 1412, 262–272. [Google Scholar] [CrossRef]
  8. Hirst, J.; Sucheta, A.; Ackrell, B.A.C.; Armstrong, F. Electrocatalytic Voltammetry of Succinate Dehydrogenase: Direct Quantification of the Catalytic Properties of a Complex Electron-Transport Enzyme. J. Am. Chem. Soc. 1996, 118, 5031–5038. [Google Scholar] [CrossRef]
  9. Chaplin, M. Water Structure and Science. Available online: https://water.lsbu.ac.uk/water (accessed on 17 September 2025).
  10. Wolfbeis, O.S. Luminescent sensing and imaging of oxygen: Fierce competition to the Clark electrode. Bioessays 2015, 37, 921–928. [Google Scholar] [CrossRef]
  11. Pluschkell, S.B.; Flickinger, M.C. Improved methods for investigating the external redox potential in hybridoma cell culture. Cytotechnology 1995, 19, 11–26. [Google Scholar] [CrossRef] [PubMed]
  12. Meneses-Acosta, A.; Gómez, A.; Ramírez, O.T. Control of redox potential in hybridoma cultures: Effects on MAb production, metabolism, and apoptosis. J. Ind. Microbiol. Biotechnol. 2012, 39, 1189–1198. [Google Scholar] [CrossRef]
  13. Milo, R.; Phillips, R. What is the redox potential of a cell? In Cell Biology by the Numbers, 1st ed.; Garland Science: New York, NY, USA, 2015; pp. 189–196. [Google Scholar]
  14. Buck, R.P.; Rondinini, S.; Covington, A.; Baucke, F.; Brett, C.; Camoes, M.; Milton, M.; Mussini, T.; Naumann, R.; Pratt, K.; et al. Measurement of pH definition, standards, and procedures. Pure Appl. Chem. 2002, 74, 2169–2200. [Google Scholar] [CrossRef]
  15. Scholz, F. From the Leiden jar to the discovery of the glass electrode by Max Cremer. J. Solid. State Electrochem. 2011, 15, 5–14. [Google Scholar] [CrossRef]
  16. Hopkins, E.; Sanvictores, T.; Sharma, S. Physiology, Acid Base Balance. In StatPearls; StatPearls Publishing: Treasure Island, FL, USA, 2025. [Google Scholar] [PubMed]
  17. Pittman, R.N. Oxygen transport. In Regulation of Tissue Oxygenation, 2nd ed.; Morgan & Claypool: San Rafael, CA, USA, 2016; pp. 1–99. [Google Scholar] [CrossRef]
  18. Martineau, F.; Fourel, F.; Bodergat, A.M.; Lecuyer, C. D/H equilibrium fractionation between H2O and H2 as a function of the salinity of aqueous solutions. Chem. Geol. 2012, 291, 236–240. [Google Scholar] [CrossRef]
  19. Rosen, M.; Schuldiner, S. The H+/H2 equilibrium potential dependence on H2 partial pressure on gold electrodes. Electrochim. Acta 1973, 18, 687–690. [Google Scholar] [CrossRef]
  20. Jerkiewicz, G. Standard and Reversible Hydrogen Electrodes: Theory, Design, Operation, and Applications. ACS Catal. 2020, 10, 8409–8417. [Google Scholar] [CrossRef]
  21. Novelli, P.C.; Lang, P.M.; Masarie, K.A.; Hurst, D.F.; Myers, R.; Elkins, J.W. Molecular hydrogen in the troposphere: Global distribution and budget. J. Geophys. Res. 1999, 104, 30427–30444. [Google Scholar] [CrossRef]
  22. Lappan, R.; Shelley, G.; Islam, Z.F.; Leung, P.M.; Lockwood, S.; Nauer, P.A.; Jirapanjawat, T.; Ni, G.; Chen, Y.J.; Kessler, A.J.; et al. Molecular hydrogen in seawater supports growth of diverse marine bacteria. Nat. Microbiol. 2023, 8, 581–595. [Google Scholar] [CrossRef] [PubMed]
  23. Carbonero, F.; Benefiel, A.; Gaskins, H. Contributions of the microbial hydrogen economy to colonic homeostasis. Nat. Rev. Gastroenterol. Hepatol. 2012, 9, 504–518. [Google Scholar] [CrossRef]
  24. Yamamoto, R.; Homma, K.; Suzuki, S.; Sano, M.; Sasaki, J. Hydrogen gas distribution in organs after inhalation: Real-time monitoring of tissue hydrogen concentration in rat. Sci. Rep. 2019, 9, 1255. [Google Scholar] [CrossRef]
  25. Kiyama, T.; Tokunaga, A.; Naji, A.; Barbul, A. Changes in the negative logarithm of end-tidal hydrogen partial pressure indicate the variation of electrode potential in healthy Japanese subjects. Sci. Rep. 2023, 13, 15473. [Google Scholar] [CrossRef]
  26. Roscher, J.; Holze, R. Reference Electrodes. Encyclopedia 2023, 3, 478–489. [Google Scholar] [CrossRef]
  27. Liu, J.; Chakraborty, S.; Hosseinzadeh, P.; Yu, Y.; Tian, S.; Petrik, I.; Bhagi, A.; Lu, Y. Metalloproteins containing cytochrome, iron-sulfur, or copper redox centers. Chem. Rev. 2014, 23, 4366–4469. [Google Scholar] [CrossRef]
  28. Schafer, F.Q.; Buettner, G.R. Redox environment of the cell as viewed through the redox state of the glutathione disulfide/glutathione couple. Free Radic. Biol. Med. 2001, 30, 1191–1212. [Google Scholar] [CrossRef]
  29. Krebs, H.A. The redox state of nicotinamide adenine dinucleotide in the cytoplasm and mitochondria of rat liver. Adv. Enzym. Regul. 1967, 5, 409–434. [Google Scholar] [CrossRef]
  30. Kirlin, W.G.; Kirlin, W.G.; Cai, J.; Thompson, S.; Díaz, D.; Kavanagh, T.J.; Jones, D.P. Glutathione redox potential in response to differentiation and enzyme inducers. Free Radic. Biol. Med. 1999, 27, 1208–1218. [Google Scholar] [CrossRef] [PubMed]
  31. Matsumoto, K.; Miyazaki, K.; Hwang, J.; Yamamoto, T.; Sakuda, A. Electrode Potentials Part 1: Fundamentals and Aqueous Systems. Electrochemistry 2022, 90, 102001. [Google Scholar] [CrossRef]
  32. Clark, L.C., Jr.; Wolf, R.; Granger, D.; Taylor, Z. Continuous recording of blood oxygen tensions by polarography. J. Appl. Physiol. 1953, 6, 189–193. [Google Scholar] [CrossRef]
  33. Boettcher, S.W.; Oener, S.Z.; Lonergan, M.C.; Surendranath, Y.; Ardo, S.; Brozek, C.; Kempler, P.A. Potentially Confusing: Potentials in Electrochemistry. ACS Energy Lett. 2021, 6, 261–266. [Google Scholar] [CrossRef]
  34. Ratnaraj, J.; Kabon, B.; Talcott, M.R.; Sessler, D.I.; Kurz, A. Supplemental oxygen and carbon dioxide each increase subcutaneous and intestinal intramural oxygenation. Anesth. Analg. 2004, 99, 207–211. [Google Scholar] [CrossRef]
  35. Muir, E.R.; Cardenas, D.P.; Duong, T.Q. MRI of brain tissue oxygen tension under hyperbaric conditions. Neuroimage 2016, 133, 498–503. [Google Scholar] [CrossRef] [PubMed]
  36. Lambertsen, C.J.; Dough, R.H.; Cooper, D.Y.; Emmel, G.L.; Loeschcke, H.H.; Schmidt, C.F. Oxygen toxicity; effects in man of oxygen inhalation at 1 and 3.5 atmospheres upon blood gas transport, cerebral circulation and cerebral metabolism. J. Appl. Physiol. 1953, 5, 471–486. [Google Scholar] [CrossRef] [PubMed]
  37. Hossain, T.; Secor, J.T.; Eckmann, D.M. Hyperbaric oxygen rapidly produces intracellular bioenergetics dysfunction in human pulmonary cells. Chem. Biol. Interact. 2024, 404, 111266. [Google Scholar] [CrossRef]
  38. Wiese, A.K.; Prior, S.; Chambers, T.C.; Higuchi, M. Intracellular Oxygen Concentration Determined By Mitochondrial Respiration Regulates Production of Reactive Oxygen Species. Integr. Cancer Biol. Res. 2017, 1, 6. [Google Scholar]
  39. Mik, E.G.; Johannes, T.; Zuurbier, C.J.; Heinen, A.; Houben-Weerts, J.H.; Balestra, G.M.; Stap, J.; Beek, J.F.; Ince, C. In vivo mitochondrial oxygen tension measured by a delayed fluorescence lifetime technique. Biophys. J. 2008, 95, 3977–3990. [Google Scholar] [CrossRef] [PubMed]
  40. Zweier, J.L.; Talukder, M.A.H. The role of oxidants and free radicals in reperfusion injury. Cardiovasc. Res. 2006, 70, 181–190. [Google Scholar] [CrossRef]
  41. Stub, D.; Smith, K.; Bernard, S.; Nehme, Z.; Stephenson, M.; Bray, J.E.; Cameron, P.; Barger, B.; Ellims, A.H.; Taylor, A.J.; et al. Air versus oxygen in ST-segment-elevation myocardial infarction. Circulation 2015, 131, 2143–2150. [Google Scholar] [CrossRef]
  42. Tabata Fukushima, C.; Dancil, I.S.; Clary, H.; Shah, N.; Nadtochiy, S.M.; Brookes, P.S. Reactive oxygen species generation by reverse electron transfer at mitochondrial complex I under simulated early reperfusion conditions. Redox Biol. 2024, 70, 103047. [Google Scholar] [CrossRef]
  43. Higareda, A.E.; Possani, L.D.; Ramírez, O.T. The use of culture redox potential and oxygen uptake rate for assessing glucose and glutamine depletion in hybridoma cultures. Biotechnol. Bioeng. 1997, 56, 555–563. [Google Scholar] [CrossRef]
  44. Ohsawa, I.; Ishikawa, M.; Takahashi, K.; Watanabe, M.; Nishimaki, K.; Yamagata, K.; Katsura, K.; Katayama, Y.; Asoh, S.; Ohta, S. Hydrogen acts as a therapeutic antioxidant by selectively reducing cytotoxic oxygen radicals. Nat. Med. 2007, 13, 688–694. [Google Scholar] [CrossRef]
  45. Hayashida, K.; Sano, M.; Ohsawa, I.; Shinmura, K.; Tamaki, K.; Kimura, K.; Endo, J.; Katayama, T.; Kawamura, A.; Kohsaka, S.; et al. Inhalation of hydrogen gas reduces infarct size in the rat model of myocardial ischemia-reperfusion injury. Biochem. Biophys. Res. Commun. 2008, 373, 30–35. [Google Scholar] [CrossRef]
  46. Ishihara, G.; Kawamoto, K.; Komori, N.; Ishibashi, T. Molecular hydrogen suppresses superoxide generation in the mitochondrial complex I and reduced mitochondrial membrane potential. Biochem. Biophys. Res. Commun. 2020, 522, 965–970. [Google Scholar] [CrossRef]
  47. Bleier, L.; Dröse, S. Superoxide generation by complex III: From mechanistic rationales to functional consequences. Biochim. Biophys. Acta 2013, 1827, 1320–1331. [Google Scholar] [CrossRef] [PubMed]
  48. Kagaya, M.; Iwata, M.; Toda, Y.; Nakae, Y.; Kondo, T. Circadian rhythm of breath hydrogen in young women. J. Gastroenterol. 1998, 33, 472–476. [Google Scholar] [CrossRef]
  49. Gasbarrini, A.; Corazza, G.R.; Gasbarrini, G.; Montalto, M.; Di Stefano, M.; Basilisco, G.; Parodi, A.; Usai-Satta, P.; Vernia, P.; Anania, C.; et al. Methodology and indications of H2-breath testing in gastrointestinal diseases: The Rome Consensus Conference. Aliment. Pharmacol. Ther. 2009, 29, 1–49. [Google Scholar]
  50. Avallone, E.V.; De Carolis, A.; Loizos, P.; Corrado, C.; Vernia, P. Hydrogen breath test–diet and basal H2 excretion: A technical note. Digestion 2010, 82, 39–41. [Google Scholar] [CrossRef]
  51. van Munster, I.P.; de Boer, H.M.; Jansen, M.C.; de Haan, A.F.; Katan, M.B.; van Amelsvoort, J.M.; Nagengast, F.M. Effect of resistant starch on breath-hydrogen and methane excretion in healthy volunteers. Am. J. Clin. Nutr. 1994, 59, 626–630. [Google Scholar] [CrossRef]
  52. Nagano, A.; Ohge, H.; Tanaka, T.; Takahashi, S.; Uemura, K.; Murakami, Y.; Sueda, T. Effects of different types of dietary fibers on fermentation by intestinal flora. Hiroshima J. Med. Sci. 2018, 67, 1–5. [Google Scholar]
  53. Yao, C.K.; Tuck, C.J.; Barrett, J.S.; Canale, K.E.; Philpott, H.L.; Gibson, P.R. Poor reproducibility of breath hydrogen testing: Implications for its application in functional bowel disorders. United Eur. Gastroenterol. J. 2017, 5, 284–292. [Google Scholar] [CrossRef] [PubMed]
  54. Uetsuki, K.; Kawashima, H.; Ohno, E.; Ishikawa, T.; Iida, T.; Yamamoto, K.; Furukawa, K.; Nakamura, M.; Honda, T.; Ishigami, M.; et al. Measurement of fasting breath hydrogen concentration as a simple diagnostic method for pancreatic exocrine insufficiency. BMC Gastroenterol. 2021, 21, 211. [Google Scholar] [CrossRef]
  55. Jung, S.E.; Joo, N.S.; Han, K.S.; Kim, K.N. Obesity Is Inversely Related to Hydrogen-Producing Small Intestinal Bacterial Overgrowth in Non-Constipation Irritable Bowel Syndrome. J. Korean Med. Sci. 2017, 32, 948–953. [Google Scholar] [CrossRef] [PubMed]
  56. Adzavon, Y.M.; Xie, F.; Yi, Y.; Jiang, X.; Zhang, X.; He, J.; Zhao, P.; Liu, M.; Ma, S.; Ma, X. Long-term and daily use of molecular hydrogen induces reprogramming of liver metabolism in rats by modulating NADP/NADPH redox pathways. Sci. Rep. 2022, 12, 3904. [Google Scholar] [CrossRef] [PubMed]
  57. Miyawaki, O.; Yano, T. Electrochemical bioreactor with immobilized glucose-6-phosphate dehydrogenase on the rotating graphite disc electrode modified with phenazine methosulfate. Enzym. Microb. Technol. 1993, 15, 525–529. [Google Scholar] [CrossRef]
  58. Pannala, V.R.; Bazil, J.N.; Camara, A.K.S.; Dash, R.K. A biophysically based mathematical model for the catalytic mechanism of glutathione reductase. Free Radic. Biol. Med. 2013, 65, 1385–1397. [Google Scholar] [CrossRef] [PubMed]
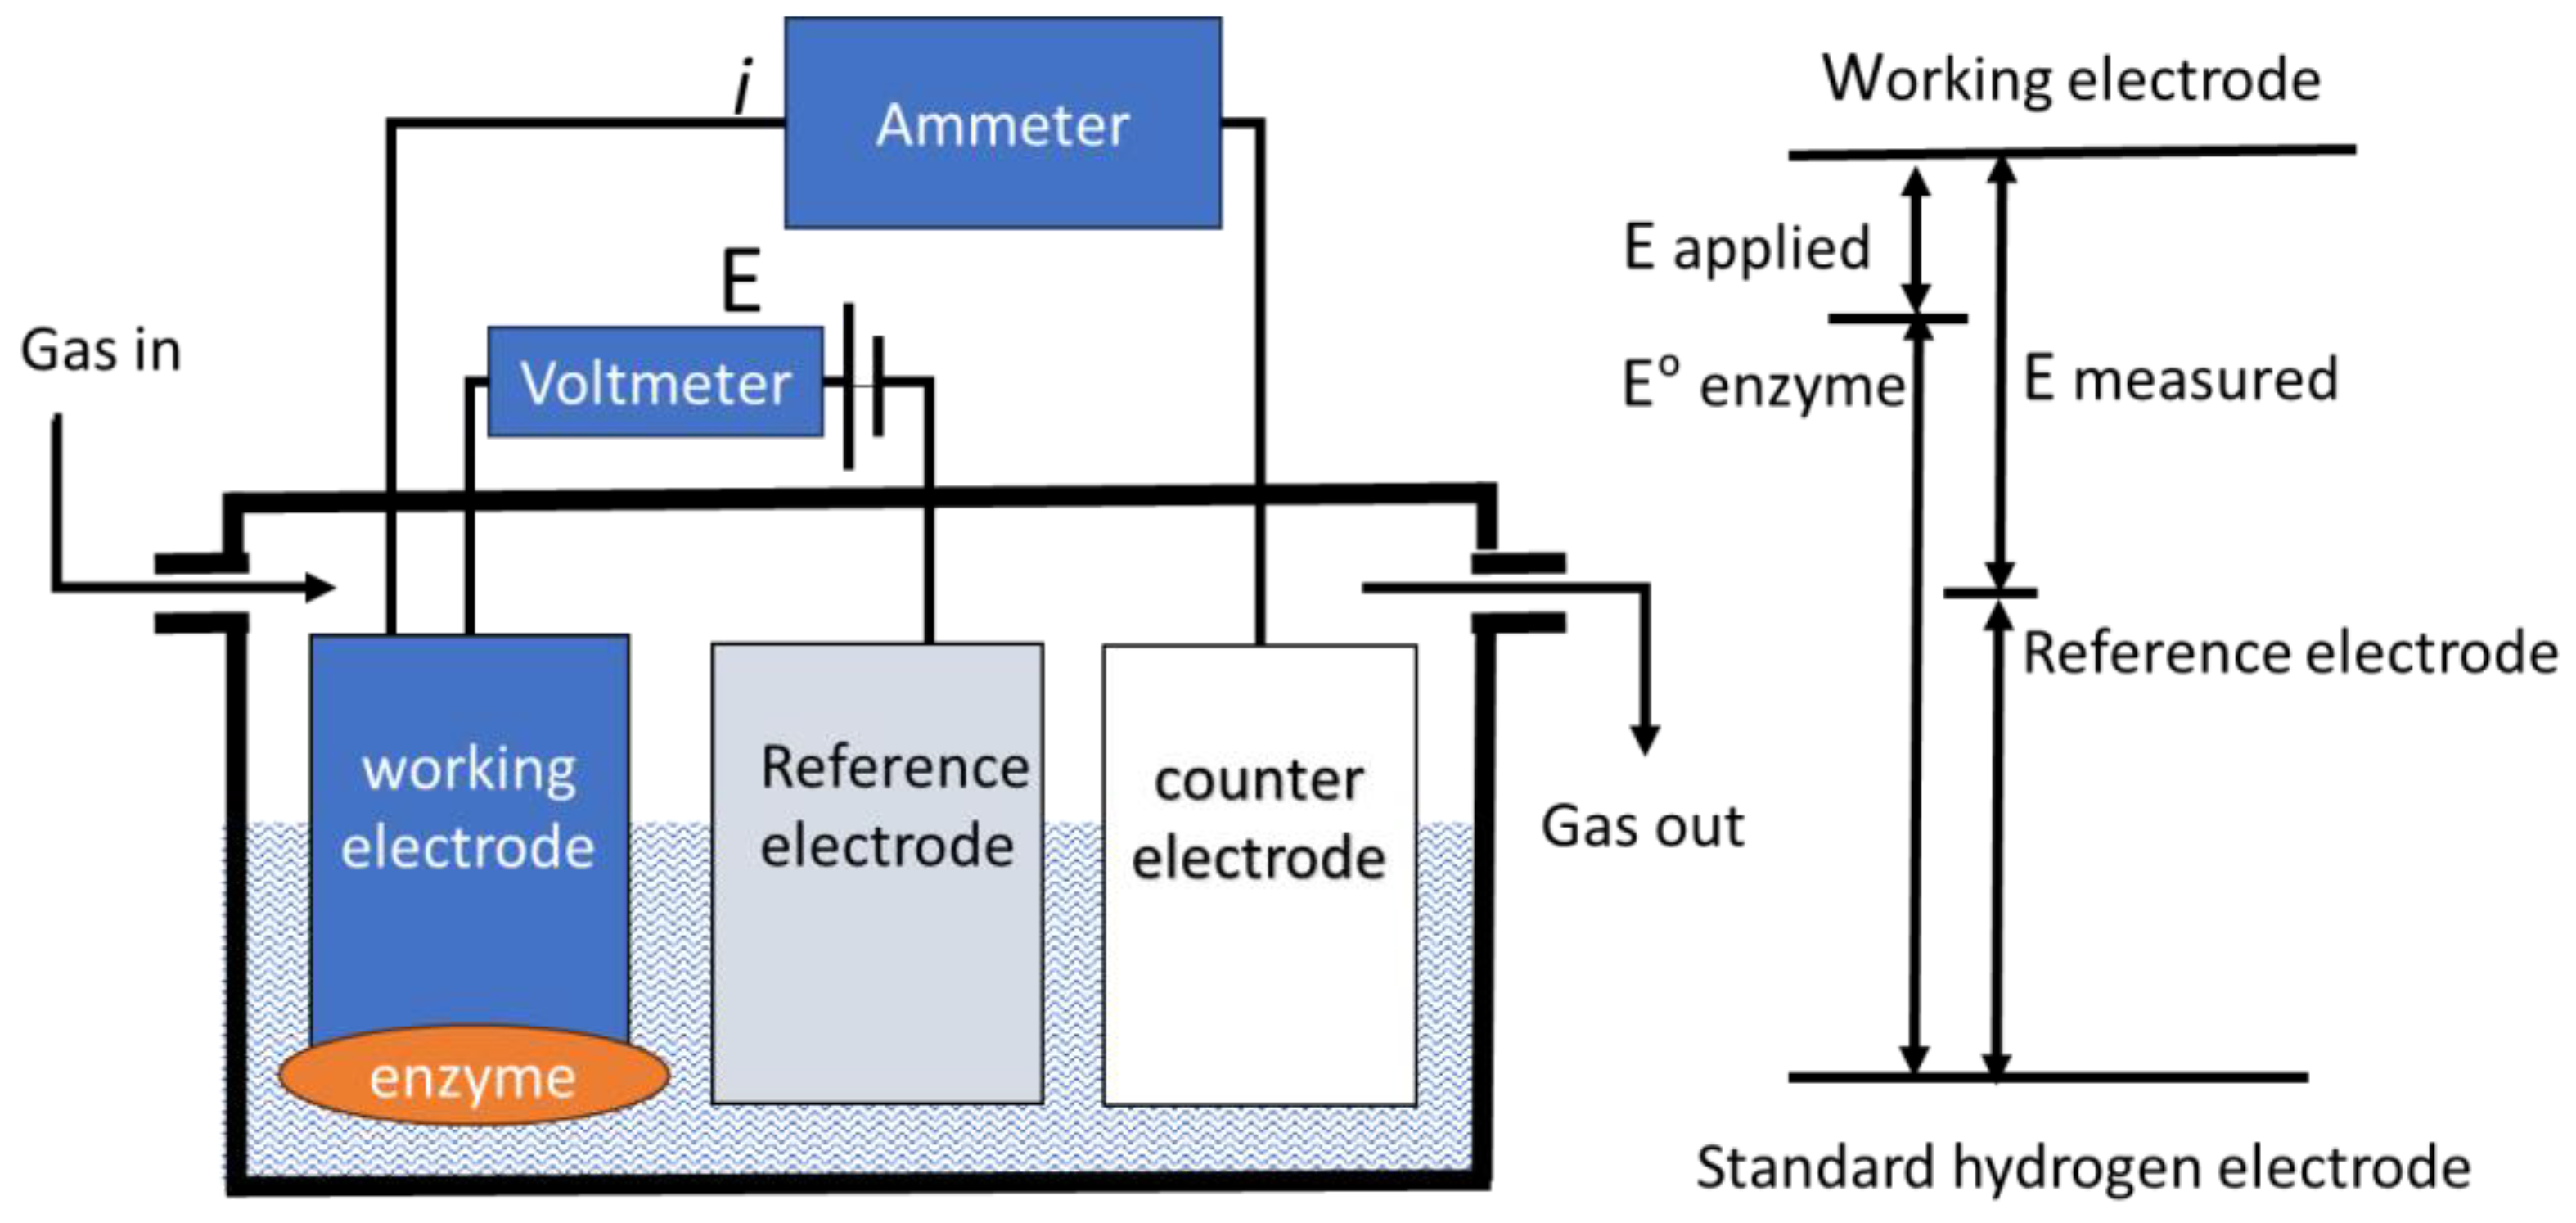
Figure 1. Schematic showing the protein film electrochemistry set-up.
Physiologia 05 00036 g001
Figure 2. Ideal potential-current response for reversible redox catalysis.
Physiologia 05 00036 g002
Figure 3. Redox potentials of the enzyme and the solution.
Physiologia 05 00036 g003
Figure 4. Relationship between a working electrode (redox enzyme) and a reference electrode (standard hydrogen electrode, SHE).
Physiologia 05 00036 g004
Figure 5. Redox potential of the enzyme and reversible hydrogen electrode (RHE).
Physiologia 05 00036 g005
Figure 6. Electrode potential difference against the atmosphere (ΔE) compared to breath H2 concentration.
Physiologia 05 00036 g006
Disclaimer/Publisher’s Note: The statements, opinions and data contained in all publications are solely those of the individual author(s) and contributor(s) and not of MDPI and/or the editor(s). MDPI and/or the editor(s) disclaim responsibility for any injury to people or property resulting from any ideas, methods, instructions or products referred to in the content.