Article

Comparison of Blood Flow Characteristics in Young Healthy Males between High-Intensity Interval and Moderate-Intensity Continuous Exercise

by
Brett R. Baughman
and
Brandon J. Sawyer
*
Department of Kinesiology, College of Health Sciences, Point Loma Nazarene University, San Diego, CA 92106, USA
*
Author to whom correspondence should be addressed.
Physiologia 2024, 4(3), 253-265; https://doi.org/10.3390/physiologia4030015
Submission received: 16 May 2024 / Revised: 13 July 2024 / Accepted: 16 July 2024 / Published: 18 July 2024
(This article belongs to the Special Issue Exercise Physiology and Biochemistry: 2nd Edition)

Abstract

:
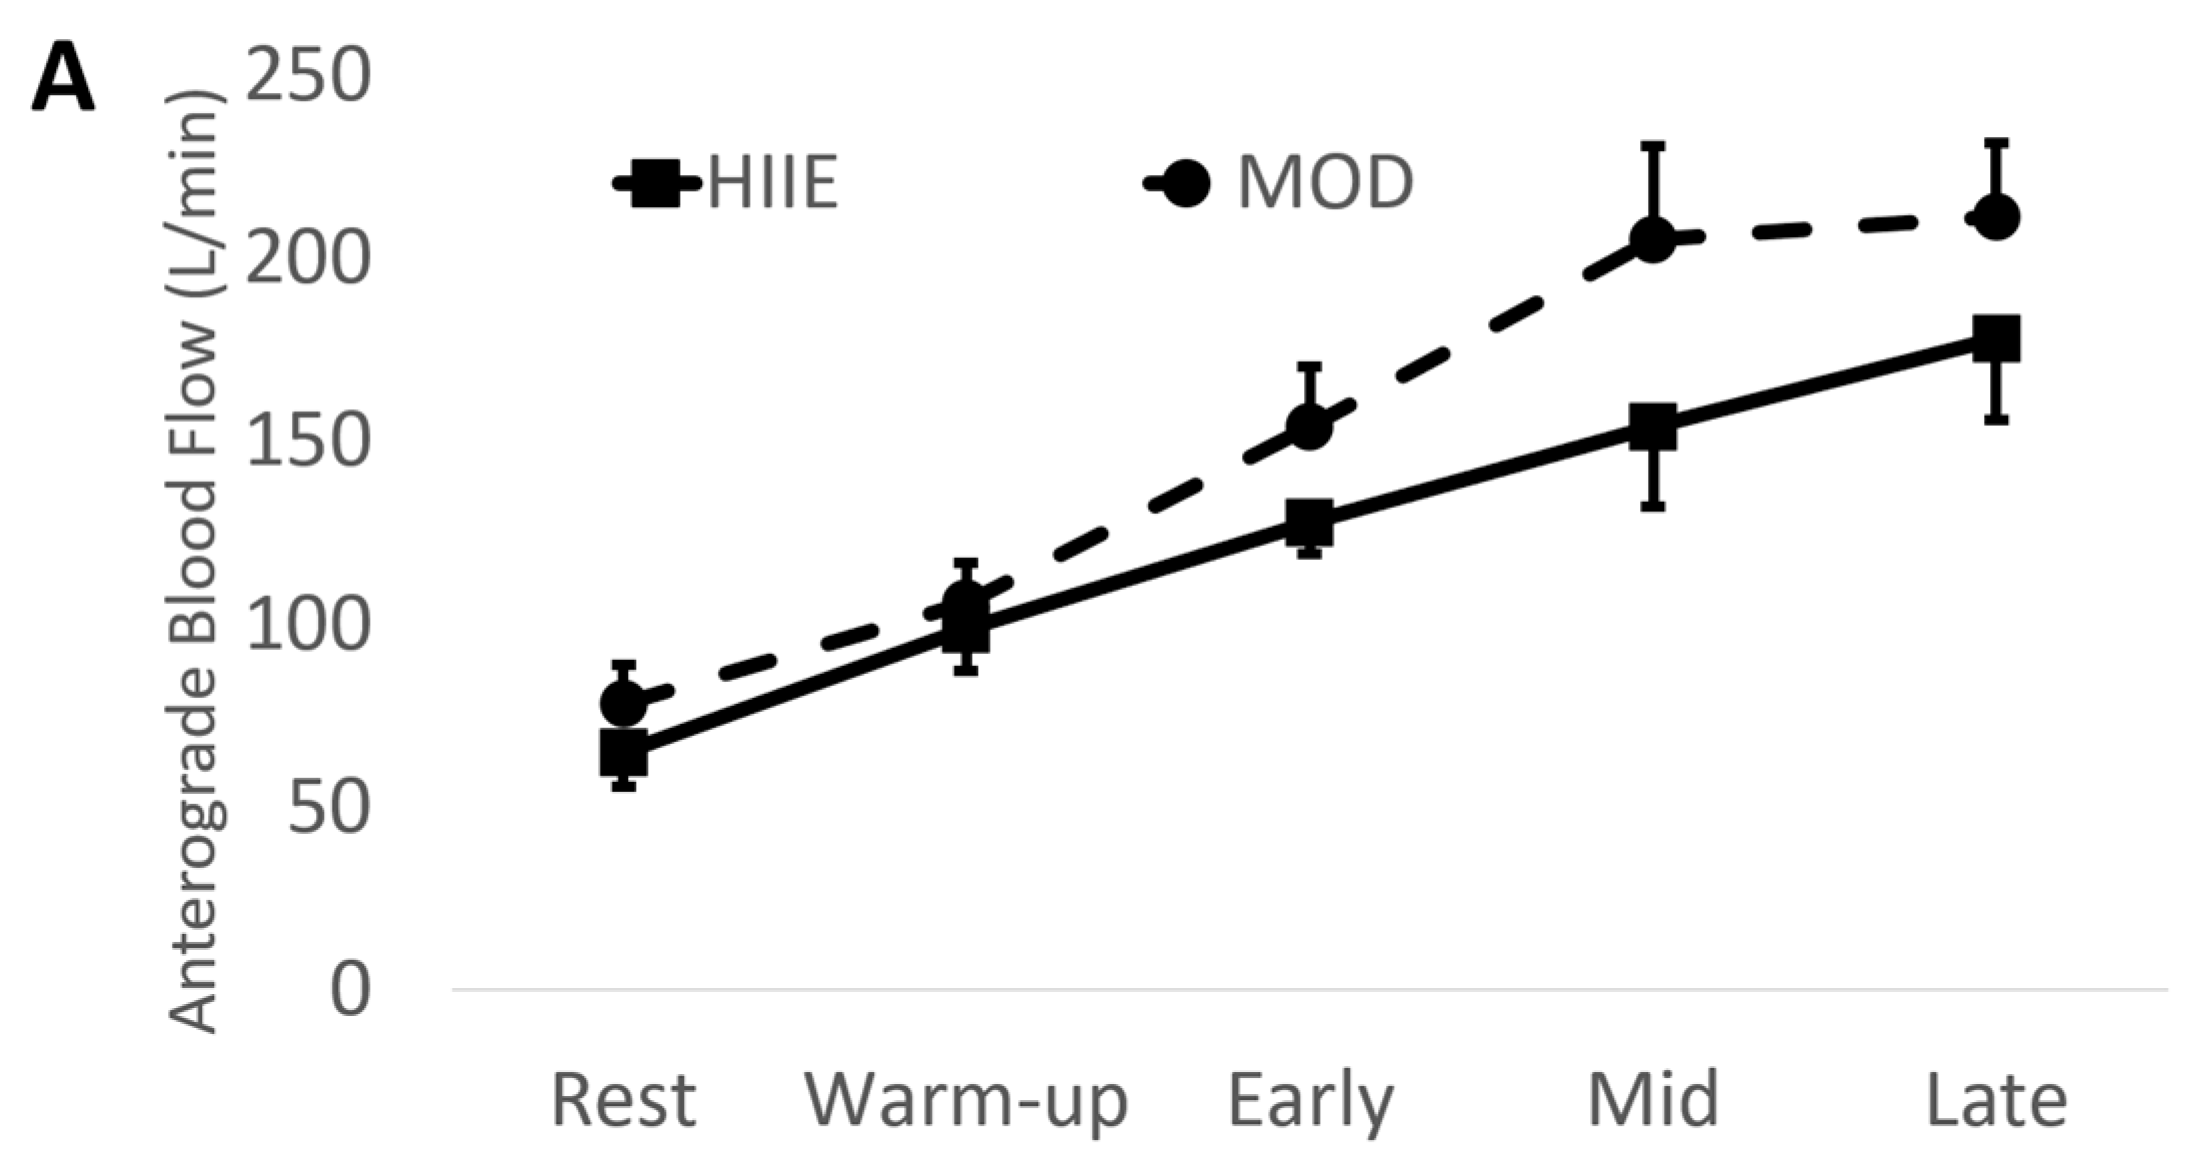
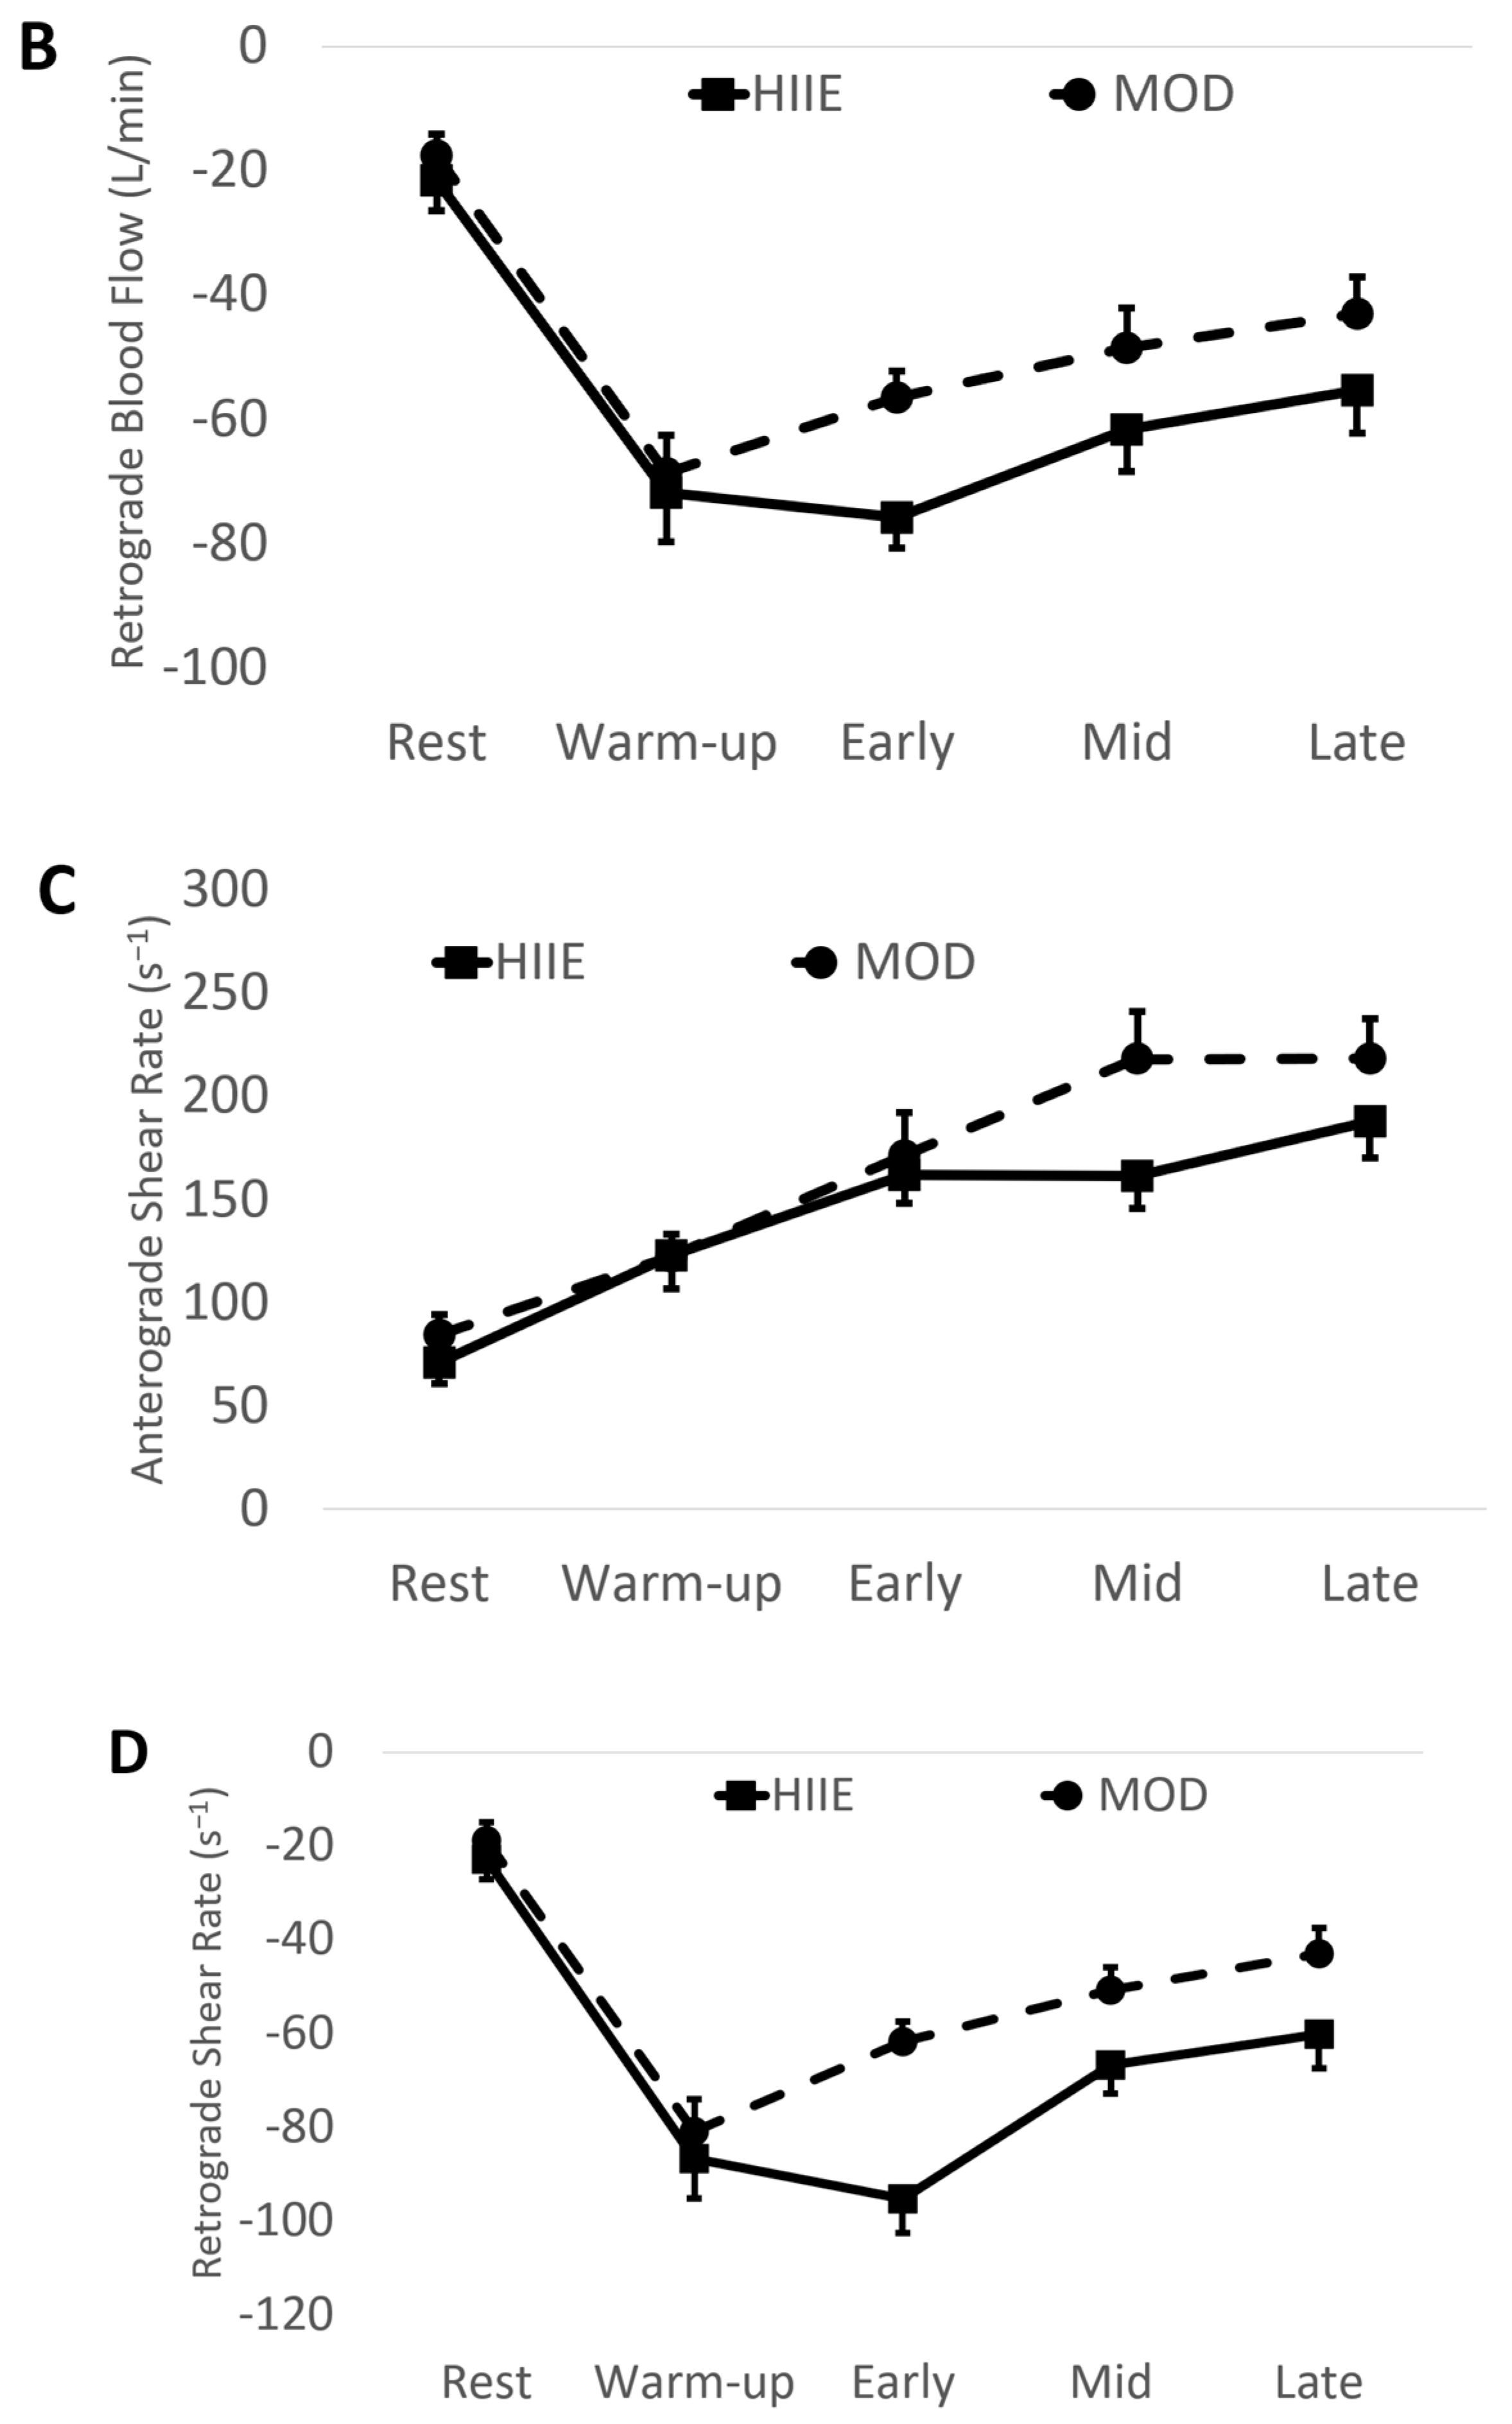
Researchers have hypothesized that high-intensity interval exercise (HIIE) and moderate-intensity continuous exercise (MOD) lead to different patterns of shear stress in the brachial artery. These differing patterns of shear stress are thought to partially explain the differing chronic adaptations to these two types of exercise. No study has directly compared blood flow characteristics during HIIE and MOD. Sixteen healthy males (Age: 23 ± 3 years) completed two randomly assigned exercise visits: HIIE (10 × 1 min intervals at 90–95% of HRmax with 1 min of recovery between) or MOD (30 min at 70% of HRmax) on an electronically braked cycle ergometer. Brachial artery blood flow velocity and diameter were measured for a total of 12 min during each of the exercise sessions. Both anterograde blood flow (MOD: 191.3 ± 80.3 mL/min, HIIE: 153.9 ± 67.5 mL/min, p = 0.03) and shear rate (MOD: 203.5 ± 78.1 s−1, HIIE: 170.8 ± 55.5 s−1, p = 0.04) were higher during MOD compared to HIIE. Both retrograde blood flow (MOD: −48.7 ± 21.3 mL/min, HIIE: −63.9 ± 23.3 cm/s, p < 0.01) and shear rate (MOD: −51.5 ± 19.8 s−1, HIIE: −73.8 ± 28.4 s−1, p < 0.01) were of greater magnitude during HIIE compared to MOD. During exercise, brachial artery diameter (p = 0.34) did not differ between HIIE and MOD. Continuous moderate cycling exercise leads to higher brachial artery anterograde shear rate and blood flow, but lower retrograde shear rate and blood flow when compared to high-intensity interval exercise. These differences during exercise in blood flow characteristics could shed light on the differing chronic adaptations to these two types of exercise.

1. Introduction

The impaired ability of vascular endothelial cells to produce and release nitric oxide which induces vasodilation is considered the first step in the progression of atherosclerosis [1]. Endothelial function is non-invasively measured via high-resolution ultrasound using flow-mediated dilation (FMD) [2]. Meta-analyses on FMD studies concluded that for every 1% increase in FMD, there is an 8 to 13% decreased risk of cardiovascular disease [3,4]. The beneficial effects of exercise training on FMD are well established [5,6]. A meta-analysis [7] and other studies [8,9] show that high-intensity interval training (HIIT) is more effective than moderate-intensity continuous training (MICT) in improving FMD, but some studies show similar effects between protocols [10,11,12,13]. In these studies, it is possible that structural adaptations had previously occurred in response to continuous exercise training, therefore lowering the stimulus for dilation during the FMD procedure [14].
Although most studies focused on changes in the artery’s ability to dilate (FMD), a few have noted structural adaptations leading to a larger artery diameter [9,14,15,16,17]. While it is implied that both structural (increased artery diameter) and functional (increased FMD) adaptations are beneficial for artery health [14,18], most of the evidence is centered on FMD [3,4]. Two studies have shown that moderate-intensity continuous training led to an increase in resting brachial artery diameter (structural adaptation) without increases in endothelial function (FMD) over 6 and 12 weeks [16] as well as 8 weeks [9]. Since the primary mechanism for artery adaptations in response to exercise training is proposed to be the shear stress exerted on artery walls [6,14] and these two different types of exercise led to different adaptations, it may be partially explained by a different pattern or degree of shear stress that each elicits (i.e., higher shear stress may lead to greater or more rapid adaptations).
Shear stress has been measured via ultrasound assessment during exercise in a handful of studies [19,20,21,22,23,24,25,26]. To our knowledge, no study has directly compared high-intensity interval exercise (HIIE) and moderate-intensity continuous exercise (MOD) during-exercise blood flow of a single bout of exercise. However, various intensities for continuous exercise have been evaluated [20] and it seems anterograde shear rate increases concomitantly with exercise intensity, with a possible plateau around 70% of maximum heart rate (HRmax). These findings from Birk et al. [20] potentially offer further insight into during-exercise shear rate between these two popular exercise protocols. Specifically, as exercise intensity increases, shear rate increases, but possibly only to a certain % of maximum heart rate. Furthermore, no study has compared the acute effects of HIIE and MOD on FMD, low-flow mediated constriction (L-FMC), and the composite endpoint of vascular reactivity (COM). Therefore, we aimed to compare the brachial artery blood flow characteristics during and after HIIE and MOD.

2. Materials and Methods

2.1. Participants and Power Calculations

Using the means and standard deviations for anterograde shear rate during exercise between 50 and 85% of HRmax from Birk et al. [20], we conducted an a priori power analysis using the F-test: fixed effects ANOVA-one way procedure in G*Power (Germany) [27] and found a sample size of 8 would be needed to provide 95% power at 0.05 α level. A separate power analysis, using the means and standard deviations for FMD following an acute bout of continuous exercise at 85% maximal heart rate [20] using the F-test: fixed effects ANOVA-special, main effects, and interactions procedure in G*Power (Germany) [27] concluded that a sample size of 16 would produce a power of 0.96 in order to detect a 5% change in FMD following an acute bout of exercise. A total of 20 male participants were initially recruited to account for attrition and to produce a power large enough to detect a change in during-exercise shear rate as well as acute changes in FMD. Participant inclusion criteria included male volunteers between the ages of 18 and 30 years of age, non-smoking, no “Yes” answers on the Physical Activity Readiness Questionnaire (PAR-Q), and a clear acoustic window for optimal imaging of the brachial artery. Male participants were excluded if we could not find a clear acoustic window for their brachial artery, they were outside of the age range, were smokers, or had any “Yes” answers on the PAR-Q. Smokers were excluded from the study due to the known drastically negative effects smoking has on artery function [28].

2.2. Screening and Overview

All participants completed a screening visit in which we measured height and weight, calculated body mass index (BMI), and conducted an ultrasound assessment of the brachial artery during 10 min of continuous and interval cycle ergometer exercise (Monark 839E, Varberg, Sweden) in order to verify that a suitable acoustic window was present. Participants who were not excluded were then asked to return to the lab for 3 separate visits (maximal exercise test visit and 2 exercise visits) during the same time of day with a minimum of 48 h apart. To adhere to FMD guidelines, participants were fasted (≥8 h) and avoided exercise, caffeine, alcohol, drugs, supplements, and medications at least 24 h prior to the 2 exercise visits [29,30].

2.3. Maximal Exercise Test

All participants performed a ramp-style maximal exercise test on a cycle ergometer (Monark 839E, Varberg, Sweden) during their second visit. Pulmonary ventilation and gas exchange were measured continuously with a Parvo Medics TrueOne 2400 (Parvo Medics, Sandy, UT, USA), while heart rate was measured with a Polar heart rate monitor (Polar, Lake Success, NY, USA). The Parvomedics TrueOne2400 has shown to be a highly valid and reliable source to assess maximal oxygen uptake (VO2max) [31]. Standard 2-point calibration was performed per manufacturer’s instructions. After collecting resting data for 2 min, participants pedaled on a stationary cycle ergometer at a cadence of their own choice (above 50 RPM) at 50 watts for 5 min during their warm-up phase. Following the warm-up phase, power output increased continuously until volitional exhaustion. Using a non-exercise VO2max estimation, we determined a ramp slope that would lead to VO2max in ~10 min resulting in a range of 15–30 W/min increments [32]. To verify attainment of VO2max, following a 10 min active cool-down period in which participants pedaled at their warm-up intensity, each participant performed a verification test on the cycle ergometer at a constant power of 100% of the peak power obtained during the ramp test until exhaustion [33]. See Sawyer et al. [34] for more details on why a verification test at 100% of the peak power obtained during the ramp test was used instead of a supramaximal intensity as suggested by Poole and Jones [33]. VO2max during each test was obtained by the average of the two highest consecutive 15 s oxygen uptake values. VO2max was defined as the higher VO2 of the ramp and verification tests. Verbal encouragement was given throughout both tests.

2.4. Exercise Visits

The 3rd and 4th visits were identical except for the exercise protocol. In random order, participants completed cycle ergometer (Monark 839E, Varberg, Sweden) high-intensity interval exercise (HIIE) during one visit and moderate-intensity continuous exercise (MOD) during the other. HIIE consisted of 29 min of exercise (5 min warm-up + ten 1 min intervals at 90–95% HRmax separated by 1 min at ~50 W + 5 min cool-down) and MOD lasted 40 min (5 min warm-up + 30 min cycling at ~70% HRmax + 5 min cool-down). Heart rate was monitored continuously, and power output was adjusted to keep HR in the target range at all times.

2.5. Brachial Artery Ultrasound

Brachial artery flow-mediated dilation (FMD) was measured with a Terason t3000 high-resolution ultrasound machine (Terason Ultrasound, Burlington, MA, USA) with a 10 MHz multi-frequency linear array probe by an experienced sonographer (who has performed the procedure over 500 times). FMD was assessed before and after exercise during visits 3 and 4. Participants rested supine on a vascular imaging table in a quiet, dimly lit room for 20 min prior to pre-exercise FMD assessment. After the rest period (pre-exercise) and within 10 min of exercise cessation, the sonographer recorded the first 60 s as the preocclusion baseline diameter measurement (Base). Next, the blood pressure cuff was inflated on the forearm to 250 mmHg for the 5 min occlusion period. During the last 60 s of occlusion, images were recorded to measure minimum occlusion diameter (Min). After five min of occlusion, the cuff was rapidly deflated and images were recorded continuously for the next three min to assess peak artery diameter (Peak). During exercise, ultrasound assessment (visits 3 and 4) consisted of 5 × 3 min intervals (total = 15 min). The 5 separate measurements included (1) resting, (2) warm-up, (3) early, (4) middle, and (5) late (see Figure 1).
The participant’s right arm rested lightly on an adjustable height podium, while the sonographer held the ultrasound probe securely against the medial brachium. While the participant’s left arm was rested on the ergometer handlebars, participants were asked to relax their arm and try to limit any excessive movement. Each 3 min recording during HIIE included 2 intervals and 1 recovery period. In order to minimize error in subsequent ultrasound assessments, investigators recorded the distance of the probe from the medial epicondyle of the humerus, marked the exact location and angle of the probe, and recorded the height of the podium, and all ultrasound settings were noted in the participant’s file so they could be duplicated during subsequent visits. Cardiovascular suite (Quipu, Pisa, Italy), a validated brachial artery edge-detection software, was used by a blinded investigator to analyze the ultrasound images to detect/calculate Base, Peak, Min, blood flow velocity, shear rate, FMD, L-FMC, and COM [35,36]. Blood flow was calculated as the product of brachial artery cross-sectional area and velocity. The following equations were used to calculate FMD, L-FMC, and COM from ultrasound analysis:
F M D = P e a k B a s e B a s e × 100 %
L F M C = M i n B a s e B a s e × 100 %
C O M = P e a k M i n B a s e × 100 %
To test our reliability between tests, a separate investigator, in a blinded fashion, randomly assigned 10 duplicate FMD videos to be reassessed to find the coefficients of variation and intra-class correlations to confirm objectivity and trial-to-trial reliability. The coefficients of variation were 0.5, 0.5, 7.9, 0.3, 4.6, and 3.7% for Base, Peak, FMD%, Min, L-FMC%, and COM%, respectively. The intra-class correlation for each variable was 0.98, 0.98, 0.98, 0.99, 0.94, and 0.98 for Base, Peak, FMD%, Min, L-FMC%, and COM%, respectively.

2.6. Statistical Analysis

For analysis purposes, to simplify and focus on type of exercise, the 3 during-exercise measurement periods (early, mid, and late) were combined as an “exercise average”. A one-way ANOVA was used to compare during-exercise shear rate, blood velocity, blood flow, and artery diameter by exercise type (HIIE vs. MOD). A within-between two-way ANOVA was used to assess differences across time (pre vs. post), by exercise type, and the time × exercise type interaction in the following variables: FMD, L-FMC, COM, Min, Base, and Peak. In order to ensure we captured the period during HIIE with the highest blood flow and shear rate, we calculated “HIIE On” and “HIIE Off”. HIIE On included the last 15 s of each interval and the first 15 s of each recovery period. HIIE Off included the last 15 s of recovery and the first 15 s of each interval. These time periods were chosen based on the periods with the highest heart rates during a similar 1 min on/1 min off HIIE protocol in a previous study [37]. We used a one-way ANOVA with Bonferroni post hoc testing to compare brachial artery variables among HIIE On, HIIE Off, and MOD during exercise average. A priori significance value was set at p < 0.05. Shapiro–Wilk tests were used to ensure all dependent variables were normally distributed, therefore meeting the assumptions of the parametric statistics used. For descriptive statistics, means and standard deviations were calculated. For our reliability measurements above, we used Cronbach alpha for intra-class correlations and calculated coefficients of variation with the following equation: C V = s t a n d a r d   d e v i a t i o n m e a n × 100 % . All statistical procedures were performed using SPSS software version 28 (IBM, Armonk, NY, USA).

3. Results

Of the 20 participants enrolled in the study, 2 were excluded due to excessive movement during the initial ultrasound assessment, 2 dropped out due to scheduling, and 1 participant’s during-exercise data were removed due to image quality but the FMD, L-FMC, and COM measures were of high quality. Therefore, the during-exercise data include 15 participants and the pre- and post-exercise data include 16 participants. Descriptive statistics are shown in Table 1. The results of the Shapiro–Wilk tests showed all dependent variables to be normally distributed.

3.1. During Exercise

There were no significant differences between exercise type with brachial artery diameter (see Figure 2).
Using the mean values of early, mid, and late combined (IE: “exercise average” see Table 2 and Figure 3), we found significantly higher anterograde velocity, blood flow, and shear rate during MOD compared to HIIE.
Conversely, retrograde velocity, blood flow, and shear rate were of greater magnitude during HIIE compared to MOD (See Figure 3).
A total of 62 video files were used for the HIIE On (30) vs. HIIE Off (32) analysis. Significant main effects were found for all variables except diameter. Post hoc testing showed MOD elicited higher anterograde shear rate, velocity, and blood flow compared to HIIE On, but not HIIE Off. Conversely, HIIE On elicited a greater magnitude of retrograde shear rate, velocity, and blood flow than both MOD and HIIE Off (See Table 3).

3.2. Vascular Measures

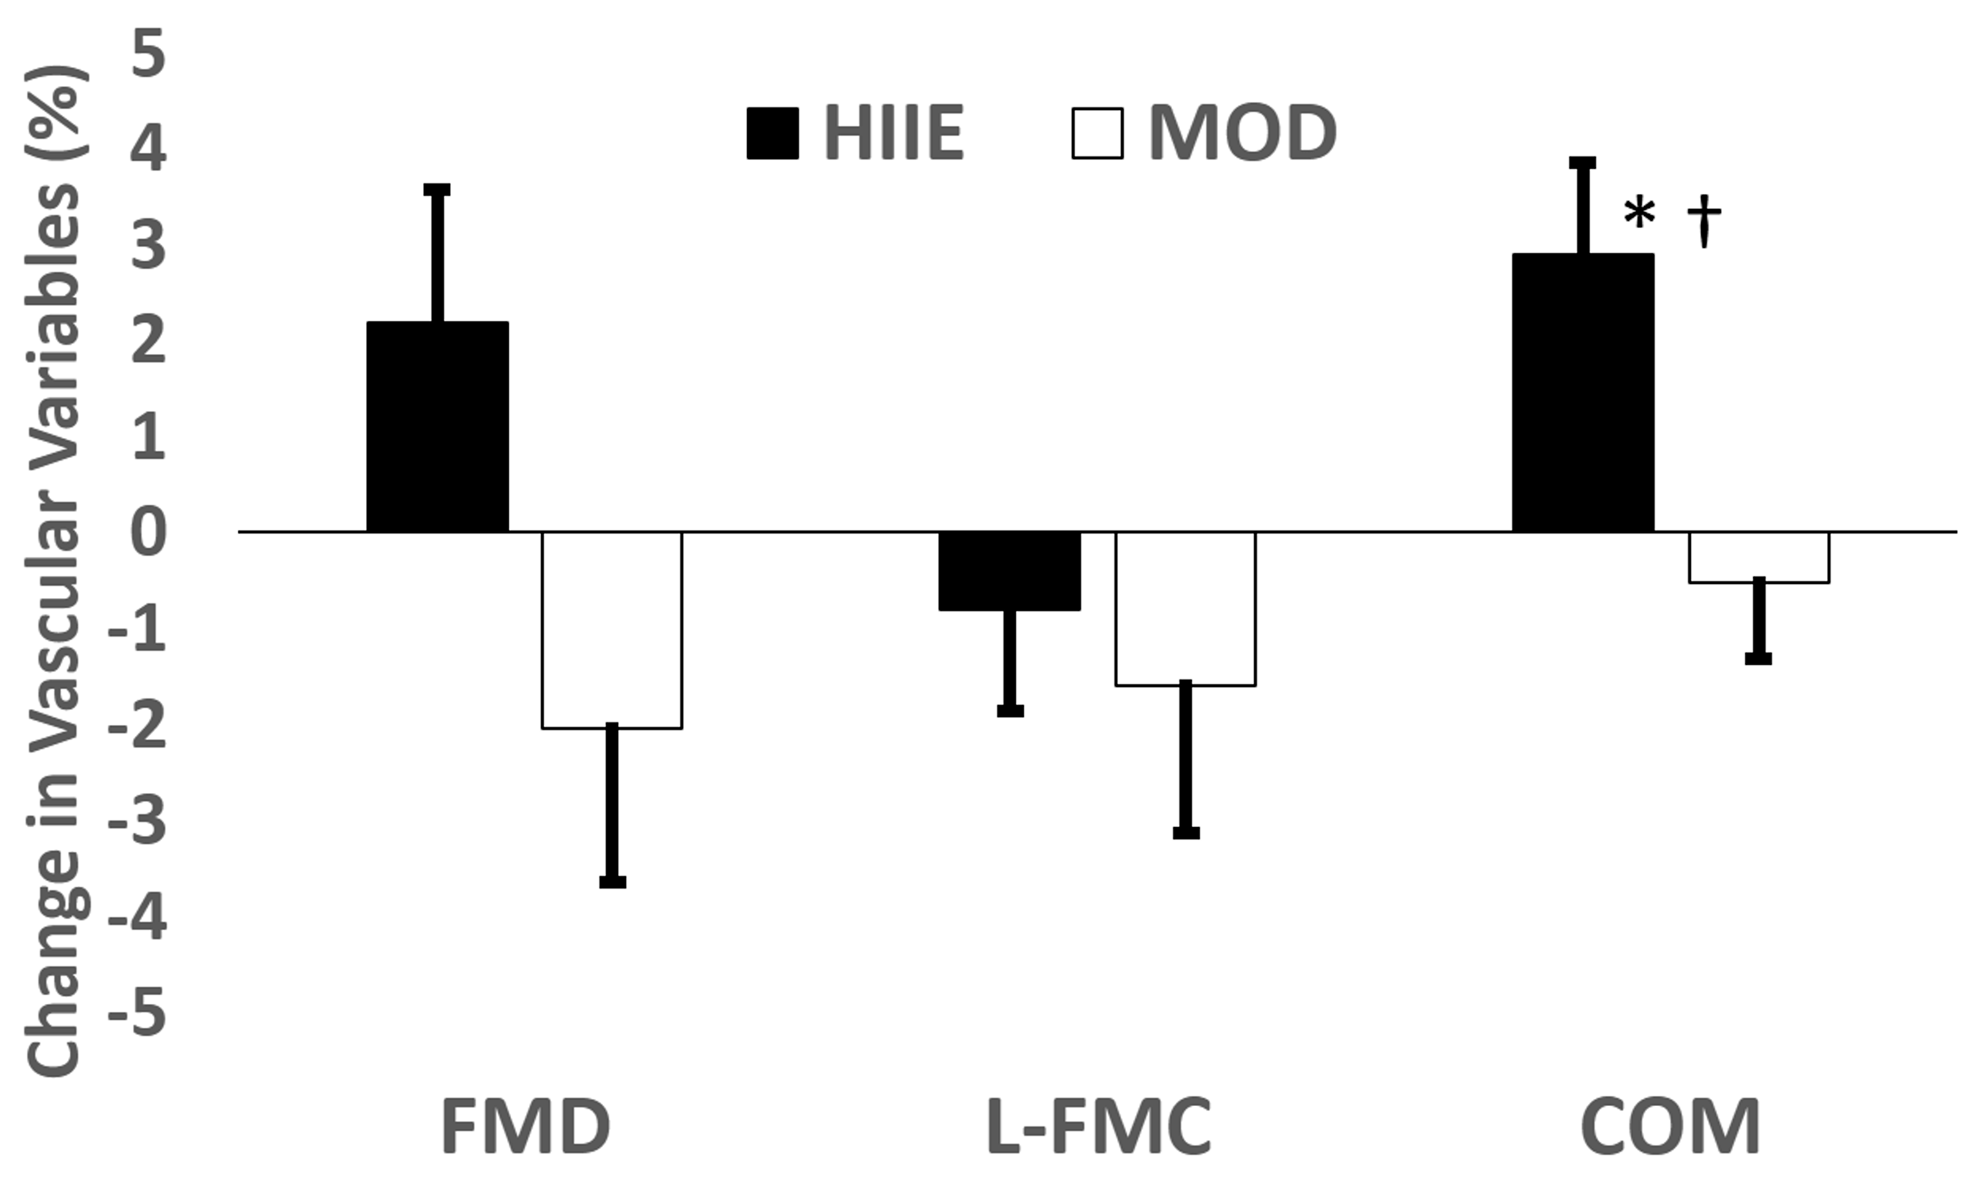
We recorded and analyzed 64 ultrasound videos consisting of pre- and post-exercise intervention FMD assessments. Following HIIE, there was a significant decrease in Base (p = 0.04), but no change following MOD (p = 0.19). The peak decreased with MOD (p = 0.04), but did not change with HIIE (p = 0.08). Min decreased following HIIE (p = 0.02) and showed a marginal decrease after MOD (p = 0.06). There were no significant changes seen with FMD (MOD: Pre 6.30 ± 2.89, Post 4.20 ± 5.75, p = 0.21; HIIE: Pre 5.44 ± 4.11, Post 7.58 ± 5.99, p = 0.15; Interaction p = 0.09) or L-FMC (MOD: Pre −0.32 ± 3.26, Post −1.96 ± 5.50, p = 0.31; HIIE: Pre −0.20 ± 2.34, Post −0.98 ± 4.76, p = 0.47; Interaction p = 0.67). Following HIIE, COM increased significantly (Pre 5.64 ± 3.21, Post 8.57 ± 3.16, p = 0.01), but did not change with MOD (Pre 6.62 ± 2.86, Post 6.16 ± 4.69, p = 0.56). Exercise x time interactions were observed for COM (p = 0.02) and Peak (p = 0.05). See Figure 4.

4. Discussion

To our knowledge, this study is the first to primarily focus on the comparison of during-exercise blood flow characteristics between high-intensity interval and moderate-intensity continuous exercise. Based on the previous literature, we hypothesized HIIE would elicit a significantly higher shear rate, blood velocity, and blood flow when compared to MOD; however, our results show the MOD intervention elicited a higher anterograde shear rate, blood flow, and blood velocity compared to HIIE. Additionally, HIIE led to a greater magnitude of retrograde shear rate, blood flow, and blood velocity compared to MOD. The acute effects of these two exercise protocols on our vascular function measurements show that HIIE led to vasoconstriction of the brachial artery immediately post-exercise, although there was no change in vasoconstriction during cuff occlusion (L-FMC) and no change in peak brachial artery diameter even with the lower starting diameter, resulting in greater COM after HIIE. MOD led to similar results except for a decrease in peak diameter resulting in lower COM and FMD compared to HIIE.
The majority of studies [7,8,9] show that HIIT is more effective than MICT in improving FMD, but some studies show similar effects between protocols [10,11,12,13]. Interestingly, two studies comparing HIIT [9] or sprint interval training SIIT [16] to MICT have shown a possible structural adaptation via increased baseline brachial artery diameter in the MICT group only. Both of these studies support the hypothesis of Green et al. [38] that structural adaptation due to training would lower the stimulus for dilation during FMD procedure and may explain the lack of effect of MICT on FMD. Our results suggest that moderate-intensity continuous exercise could lead to structural adaptations faster than HIIE due to a higher sustained anterograde shear rate in MOD. These findings mostly help to explain the physiology behind artery adaptations to different exercise protocols but could also have practical implications. With some interventions showing no improvement in FMD after MICT [9,16] and others showing less improvement in FMD after MICT compared to HIIT, this is typically interpreted as HIIT being superior for artery adaptations [7,8,9] and could lead to exercisers and practitioners shying away from using MICT to improve artery health. Our findings, if confirmed, could support the use of MICT for artery adaptations as a worthy and comparable alternative to HIIT for exercisers who do not prefer to use HIIT or just want more options for exercise. Further research combining during-exercise blood flow measurements and changes in brachial artery diameters over training is needed to confirm this hypothesis.
Our study is the first to compare during-exercise blood flow between HIIE and MOD. Other studies measuring during-exercise brachial artery blood flow during continuous cycle ergometer exercise have reported similar anterograde blood flow and shear rate values (approximately 250 mL/min or 250 s−1, respectively) to our MOD exercise [20,21,23,25,39]. The intensity of the cycle ergometer exercise in most of the studies [21,23,25,39] was between 100 and 120 watts for all participants, which was very similar to our average wattage during MOD of 110 watts. Birk et al. [20] and Birk et al. [19] prescribed exercise in a more similar fashion to the present study as % of HRmax but showed a higher anterograde shear rate (322 s−1) at 70% of HRmax [20] and (~450 s−1) at 80% of HRmax [19] compared to our MOD (203 s−1) which was between 70 and 75% of HRmax. This difference in anterograde shear rate may be partially explained by the participants in the current study having a ~10% larger artery diameter. Retrograde shear rate seems to vary more across studies ranging from −5 s−1 [19] to −100 s−1 [25]. The retrograde shear rate during our MOD of −51 s−1 falls right in this range.
The anterograde shear rate and blood flow during our HIIE protocol were significantly lower than MOD in the current study and lower than the reported values in the previous studies using continuous moderate exercise [20,23,25,39] and continuous vigorous exercise [19,20]. Birk et al. [20] found a significant increase in during-exercise shear rate between 50% and 70% HRmax, but saw no increase from 70 to 85%, suggesting a plateau in brachial artery shear rate somewhere in the transition from moderate to vigorous exercise. Our results potentially extend the findings of Birk et al. [20] showing that after the plateau, the anterograde blood flow and shear rate in the brachial artery go down significantly lower than that seen during moderate continuous exercise. Our HIIE On vs. Off analyses further show that the higher-intensity exercise periods (HIIE On) actually elicit lower anterograde and more pronounced retrograde blood flow and shear rate compared to the recovery periods (HIIE Off). The blood flow characteristics during MOD were similar to those during HIIE Off, but significantly different compared to HIIE On. This is further evidence of vasoconstriction of the brachial artery during exercise to support increased blood flow to the legs during higher intensity bouts of exercise.
Potential mechanisms for lower brachial artery anterograde blood flow/shear rate and more pronounced retrograde blood blow/shear rate include more sympathetic nervous system innervation-driven systemic vasoconstriction during HIIE, more metabolite-driven lower extremity vasodilation during HIIE, more thermoregulatory demands during HIIE, and more brachial artery vasoconstriction during HIIE. As exercise intensity increases, sympathetic activity increases, leading to greater systemic vasoconstriction, greatly affecting the resistance vessels downstream of the brachial artery, potentially lowering anterograde blood flow and increasing (more negative) retrograde blood flow [40,41]. In addition, the higher intensity of exercise during HIIE would require greater lower extremity skeletal muscle metabolism resulting in increased local vasodilator release sending more blood to the lower extremities and away from the brachial artery [40,41].
Simmons et al. [24] showed that brachial artery anterograde blood flow increased during a single bout of continuous exercise as skin temperature increased. Our data also show an increase in anterograde blood flow from warm-up throughout each stage of exercise in both MOD and HIIE, but HIIE was still lower than MOD, suggesting a unique effect of HIIE on blood flow in the brachial artery. Simmons et al. [24] showed a significant vasoconstriction of the brachial artery at the onset of exercise leading to higher retrograde blood flow and shear rate. Our study and Padilla et al. [23] also show vasoconstriction at exercise onset, although not significant, which most likely leads to the immediate increase (more negative) in retrograde shear rate (See Figure 3D). Our study and others [23,24] show that this increased retrograde shear rate slowly dissipates as exercise continues. Uniquely, our study shows that the retrograde shear rate did not dissipate as quickly in HIIE as it did in MOD (see Figure 3D), which may be partially due to the artery diameter difference (~4%, not significant) between HIIE and MOD during the “early” phase of exercise.
Our data show no changes with FMD within either group. Previous literature for assessing acute FMD has not been standardized, and a high variability between results has been noted [42]. These data are consistent with Currie et al. [43], who saw no difference 1 h following exercise, although our study recorded post-exercise FMD immediately (within 10 min). This could be a potential limitation to the study, as the majority of research focused on acute vascular function has varied with exact timing for post-FMD, varying from <10 min to 48 h [20,43,44,45,46]. There was no change with L-FMC following exercise, which conflicts with the findings of Gori et al. [47]. However, Gori et al. [47] evaluated the radial artery and performed an acute bout of isometric handgrip exercises instead of the brachial artery and cycle ergometer exercise. Lastly, COM increased after HIIE but not with MOD. To our knowledge, this is the first study to measure COM following an acute bout of exercise. The increase in COM following HIIE was driven by lower baseline and minimum occlusion diameters with no change in peak diameter, whereas peak diameter decreased after COM.

Strengths and Limitations

The strengths of the study include the cross-over design in which participants serve as their own control and use of current ultrasound guidelines for sonography and analysis. The implications of the acute effects of exercise on the vascular measures may be limited due to the immediate assessment of FMD after exercise, but this is the first study to look at the effects of two types of exercise on all three vascular measures. The study was not adequately powered to withstand P-value adjustments associated with a comparison of all five during-exercise time points, so the during-exercise values were compared as a whole. Using a 3 min recording period for HIIE to match 3 min of MOD could have led to over an estimation of true mean blood flow/shear rate with an interval set for 1:1. The exercise dosages between MOD and HIIE were purposely not matched with the intention to replicate “real world” conditions, where exercisers undergo shorter-duration exercise while completing high-intensity interval exercise compared to moderate continuous exercise. Further research should be performed in different age groups, women, and training populations in order to draw further conclusions on during-exercise blood flow.

5. Conclusions

Our study was the first to compare during-exercise blood flow between HIIE and MOD as well as the vascular measures of endothelial function. In conclusion, we showed that moderate-intensity continuous exercise elicits higher anterograde and less pronounced retrograde shear rate and blood flow compared to high-intensity interval exercise. We also showed that HIIE may have a unique immediate effect of acutely enhancing vascular reactivity. The differences in blood flow may in part explain differences observed in chronic adaptations to these distinct exercise protocols. Potential implications of our study could suggest the involvement of MOD and HIIE into exercise prescriptions to reap the benefits of vascular structural and functional adaptations. Further research measuring during-exercise blood flow periodically over the course of long-term training is needed to confirm this hypothesis.

Author Contributions

Conceptualization, B.J.S.; methodology, B.J.S.; software, B.J.S.; validation, B.J.S.; formal analysis, B.J.S.; investigation, B.J.S. and B.R.B.; resources, B.J.S. and B.R.B.; data curation, B.J.S.; writing—original draft preparation, B.J.S. and B.R.B.; writing—review and editing, B.J.S. and B.R.B.; visualization, B.J.S. and B.R.B.; supervision, B.J.S.; project administration, B.J.S. All authors have read and agreed to the published version of the manuscript.

Funding

This research received no external funding.

Institutional Review Board Statement

This study obtained approval from the Point Loma Nazarene University institutional review board, adhered to the requirements of the U.S. Federal Policy for the Protection of Human Participants (45 CFR, Part 46), and conformed to the ethical standards of the Declaration of Helsinki. PLNU Expedited Review #1308.

Informed Consent Statement

Informed consent was obtained from all participants involved in the study. Written informed consent was obtained from the participants to publish this paper.

Data Availability Statement

Data will be shared upon direct request to the corresponding author.

Acknowledgments

We would like to thank all of our participants for their time. We would also like to thank the following research technicians for their help with the study: Jenny Beers, Patricia Benedict, Kaiti Freeberg, Stephanie Gagnon, Tony Shunk, Janie Unkefer, and Francisco Zavala.

Conflicts of Interest

The authors declare no conflicts of interest.

References

  1. Vanhoutte, P.M. Endothelial dysfunction: The first step toward coronary arteriosclerosis. Circ. J. 2009, 73, 595–601. [Google Scholar] [CrossRef]
  2. Celermajer, D.S.; Sorensen, K.E.; Gooch, V.M.; Spiegelhalter, D.J.; Miller, O.I.; Sullivan, I.D.; Lloyd, J.K.; Deanfield, J.E. Non-invasive detection of endothelial dysfunction in children and adults at risk of atherosclerosis. Lancet 1992, 340, 1111–1115. [Google Scholar] [CrossRef]
  3. Inaba, Y.; Chen, J.A.; Bergmann, S.R. Prediction of future cardiovascular outcomes by flow-mediated vasodilatation of brachial artery: A meta-analysis. Int. J. Cardiovasc. Imaging 2010, 26, 631–640. [Google Scholar] [CrossRef]
  4. Ras, R.T.; Streppel, M.T.; Draijer, R.; Zock, P.L. Flow-mediated dilation and cardiovascular risk prediction: A systematic review with meta-analysis. Int. J. Cardiol. 2013, 168, 344–351. [Google Scholar] [CrossRef] [PubMed]
  5. Green, D.J. Exercise training as vascular medicine: Direct impacts on the vasculature in humans. Exerc. Sport. Sci. Rev. 2009, 37, 196–202. [Google Scholar] [CrossRef] [PubMed]
  6. Thijssen, D.H.; Maiorana, A.J.; O’Driscoll, G.; Cable, N.T.; Hopman, M.T.; Green, D.J. Impact of inactivity and exercise on the vasculature in humans. Eur. J. Appl. Physiol. 2010, 108, 845–875. [Google Scholar] [CrossRef]
  7. Ramos, J.S.; Dalleck, L.C.; Tjonna, A.E.; Beetham, K.S.; Coombes, J.S. The impact of high-intensity interval training versus moderate-intensity continuous training on vascular function: A systematic review and meta-analysis. Sports Med. 2015, 45, 679–692. [Google Scholar] [CrossRef]
  8. Hollekim-Strand, S.M.; Bjørgaas, M.R.; Albrektsen, G.; Tjønna, A.E.; Wisløff, U.; Ingul, C.B. High-intensity interval exercise effectively improves cardiac function in patients with type 2 diabetes mellitus and diastolic dysfunction: A randomized controlled trial. J. Am. Coll. Cardiol. 2014, 64, 1758–1760. [Google Scholar] [CrossRef] [PubMed]
  9. Sawyer, B.J.; Tucker, W.J.; Bhammar, D.M.; Ryder, J.R.; Sweazea, K.L.; Gaesser, G.A. Effects of high-intensity interval training and moderate-intensity continuous training on endothelial function and cardiometabolic risk markers in obese adults. J. Appl. Physiol. (1985) 2016, 121, 279–288. [Google Scholar] [CrossRef]
  10. Currie, K.D.; Dubberley, J.B.; McKelvie, R.S.; MacDonald, M.J. Low-volume, high-intensity interval training in patients with CAD. Med. Sci. Sports Exerc. 2013, 45, 1436–1442. [Google Scholar] [CrossRef]
  11. Klonizakis, M.; Moss, J.; Gilbert, S.; Broom, D.; Foster, J.; Tew, G.A. Low-volume high-intensity interval training rapidly improves cardiopulmonary function in postmenopausal women. Menopause 2014, 21, 1099–1105. [Google Scholar] [CrossRef] [PubMed]
  12. Mitranun, W.; Deerochanawong, C.; Tanaka, H.; Suksom, D. Continuous vs interval training on glycemic control and macro- and microvascular reactivity in type 2 diabetic patients. Scand. J. Med. Sci. Sports 2014, 24, e69–e76. [Google Scholar] [CrossRef] [PubMed]
  13. Moholdt, T.; Aamot, I.L.; Granøien, I.; Gjerde, L.; Myklebust, G.; Walderhaug, L.; Brattbakk, L.; Hole, T.; Graven, T.; Stølen, T.O.; et al. Aerobic interval training increases peak oxygen uptake more than usual care exercise training in myocardial infarction patients: A randomized controlled study. Clin. Rehabil. 2012, 26, 33–44. [Google Scholar] [CrossRef] [PubMed]
  14. Tinken, T.M.; Thijssen, D.H.; Black, M.A.; Cable, N.T.; Green, D.J. Time course of change in vasodilator function and capacity in response to exercise training in humans. J. Physiol. 2008, 586, 5003–5012. [Google Scholar] [CrossRef] [PubMed]
  15. Dinenno, F.A.; Tanaka, H.; Monahan, K.D.; Clevenger, C.M.; Eskurza, I.; DeSouza, C.A.; Seals, D.R. Regular endurance exercise induces expansive arterial remodelling in the trained limbs of healthy men. J. Physiol. 2001, 534, 287–295. [Google Scholar] [CrossRef] [PubMed]
  16. Shenouda, N.; Gillen, J.B.; Gibala, M.J.; MacDonald, M.J. Changes in brachial artery endothelial function and resting diameter with moderate-intensity continuous but not sprint interval training in sedentary men. J. Appl. Physiol. (1985) 2017, 123, 773–780. [Google Scholar] [CrossRef] [PubMed]
  17. Spence, A.L.; Carter, H.H.; Naylor, L.H.; Green, D.J. A prospective randomized longitudinal study involving 6 months of endurance or resistance exercise. Conduit artery adaptation in humans. J. Physiol. 2013, 591, 1265–1275. [Google Scholar] [CrossRef] [PubMed]
  18. Green, D.J.; Spence, A.; Halliwill, J.R.; Cable, N.T.; Thijssen, D.H. Exercise and vascular adaptation in asymptomatic humans. Exp. Physiol. 2011, 96, 57–70. [Google Scholar] [CrossRef]
  19. Birk, G.K.; Dawson, E.A.; Atkinson, C.; Haynes, A.; Cable, N.T.; Thijssen, D.H.; Green, D.J. Brachial artery adaptation to lower limb exercise training: Role of shear stress. J. Appl. Physiol. (1985) 2012, 112, 1653–1658. [Google Scholar] [CrossRef]
  20. Birk, G.K.; Dawson, E.A.; Batterham, A.M.; Atkinson, G.; Cable, T.; Thijssen, D.H.; Green, D.J. Effects of exercise intensity on flow mediated dilation in healthy humans. Int. J. Sports Med. 2013, 34, 409–414. [Google Scholar] [CrossRef]
  21. Green, D.; Cheetham, C.; Reed, C.; Dembo, L.; O’Driscoll, G. Assessment of brachial artery blood flow across the cardiac cycle: Retrograde flows during cycle ergometry. J. Appl. Physiol. (1985) 2002, 93, 361–368. [Google Scholar] [CrossRef] [PubMed]
  22. Green, D.J.; Bilsborough, W.; Naylor, L.H.; Reed, C.; Wright, J.; O’Driscoll, G.; Walsh, J.H. Comparison of forearm blood flow responses to incremental handgrip and cycle ergometer exercise: Relative contribution of nitric oxide. J. Physiol. 2005, 562, 617–628. [Google Scholar] [CrossRef] [PubMed]
  23. Padilla, J.; Simmons, G.H.; Vianna, L.C.; Davis, M.J.; Laughlin, M.H.; Fadel, P.J. Brachial artery vasodilatation during prolonged lower limb exercise: Role of shear rate. Exp. Physiol. 2011, 96, 1019–1027. [Google Scholar] [CrossRef] [PubMed]
  24. Simmons, G.H.; Padilla, J.; Young, C.N.; Wong, B.J.; Lang, J.A.; Davis, M.J.; Laughlin, M.H.; Fadel, P.J. Increased brachial artery retrograde shear rate at exercise onset is abolished during prolonged cycling: Role of thermoregulatory vasodilation. J. Appl. Physiol. (1985) 2011, 110, 389–397. [Google Scholar] [CrossRef] [PubMed]
  25. Thijssen, D.H.; Dawson, E.A.; Black, M.A.; Hopman, M.T.; Cable, N.T.; Green, D.J. Brachial artery blood flow responses to different modalities of lower limb exercise. Med. Sci. Sports Exerc. 2009, 41, 1072–1079. [Google Scholar] [CrossRef] [PubMed]
  26. Tinken, T.M.; Thijssen, D.H.; Hopkins, N.; Dawson, E.A.; Cable, N.T.; Green, D.J. Shear stress mediates endothelial adaptations to exercise training in humans. Hypertension 2010, 55, 312–318. [Google Scholar] [CrossRef] [PubMed]
  27. Faul, F.; Erdfelder, E.; Lang, A.G.; Buchner, A. G*Power 3: A flexible statistical power analysis program for the social, behavioral, and biomedical sciences. Behav. Res. Methods 2007, 39, 175–191. [Google Scholar] [CrossRef] [PubMed]
  28. Ozaki, K.; Hori, T.; Ishibashi, T.; Nishio, M.; Aizawa, Y. Effects of chronic cigarette smoking on endothelial function in young men. J. Cardiol. 2010, 56, 307–313. [Google Scholar] [CrossRef] [PubMed]
  29. Corretti, M.C.; Anderson, T.J.; Benjamin, E.J.; Celermajer, D.; Charbonneau, F.; Creager, M.A.; Deanfield, J.; Drexler, H.; Gerhard-Herman, M.; Herrington, D.; et al. Guidelines for the ultrasound assessment of endothelial-dependent flow-mediated vasodilation of the brachial artery: A report of the International Brachial Artery Reactivity Task Force. J. Am. Coll. Cardiol. 2002, 39, 257–265. [Google Scholar] [CrossRef]
  30. Thijssen, D.H.; Black, M.A.; Pyke, K.E.; Padilla, J.; Atkinson, G.; Harris, R.A.; Parker, B.; Widlansky, M.E.; Tschakovsky, M.E.; Green, D.J. Assessment of flow-mediated dilation in humans: A methodological and physiological guideline. Am. J. Physiol.-Heart Circ. Physiol. 2011, 300, H2–H12. [Google Scholar] [CrossRef]
  31. Bassett, D.R.; Howley, E.T.; Thompson, D.L.; King, G.A.; Strath, S.J.; McLaughlin, J.E.; Parr, B.B. Validity of inspiratory and expiratory methods of measuring gas exchange with a computerized system. J. Appl. Physiol. (1985) 2001, 91, 218–224. [Google Scholar] [CrossRef] [PubMed]
  32. Sedgeman, D.; Dalleck, L.; Clark, I.E.; Jamnick, N.; Pettitt, R.W. Analysis of square-wave bouts to verify VO2max. Int. J. Sports Med. 2013, 34, 1058–1062. [Google Scholar] [CrossRef] [PubMed]
  33. Poole, D.C.; Jones, A.M. Measurement of the maximum oxygen uptake VO2max: VO2peak is no longer acceptable. J. Appl. Physiol. (1985) 2017, 122, 997–1002. [Google Scholar] [CrossRef] [PubMed]
  34. Sawyer, B.J.; McMahon, N.; Thornhill, K.L.; Baughman, B.R.; Mahoney, J.M.; Pattison, K.L.; Freeberg, K.A.; Botts, R.T. Supra-Versus Submaximal Cycle Ergometer Verification of VO2max in Males and Females. Sports 2020, 8, 163. [Google Scholar] [CrossRef] [PubMed]
  35. Gemignani, V.; Faita, F.; Ghiadoni, L.; Poggianti, E.; Demi, M. A system for real-time measurement of the brachial artery diameter in B-mode ultrasound images. IEEE Trans. Med. Imaging 2007, 26, 393–404. [Google Scholar] [CrossRef] [PubMed]
  36. Ghiadoni, L.; Faita, F.; Salvetti, M.; Cordiano, C.; Biggi, A.; Puato, M.; Di Monaco, A.; De Siati, L.; Volpe, M.; Ambrosio, G.; et al. Assessment of flow-mediated dilation reproducibility: A nationwide multicenter study. J. Hypertens. 2012, 30, 1399–1405. [Google Scholar] [CrossRef] [PubMed]
  37. Tucker, W.J.; Sawyer, B.J.; Jarrett, C.L.; Bhammar, D.M.; Gaesser, G.A. Physiological Responses to High-Intensity Interval Exercise Differing in Interval Duration. J. Strength Cond. Res. 2015, 29, 3326–3335. [Google Scholar] [CrossRef] [PubMed]
  38. Green, D.J.; O’Driscoll, G.; Joyner, M.J.; Cable, N.T. Exercise and cardiovascular risk reduction: Time to update the rationale for exercise? J. Appl. Physiol. (1985) 2008, 105, 766–768. [Google Scholar] [CrossRef] [PubMed]
  39. Tinken, T.M.; Thijssen, D.H.; Hopkins, N.; Black, M.A.; Dawson, E.A.; Minson, C.T.; Newcomer, S.C.; Laughlin, M.H.; Cable, N.T.; Green, D.J. Impact of shear rate modulation on vascular function in humans. Hypertension 2009, 54, 278–285. [Google Scholar] [CrossRef]
  40. Delp, M.D.; Laughlin, M.H. Regulation of skeletal muscle perfusion during exercise. Acta Physiol. Scand. 1998, 162, 411–419. [Google Scholar] [CrossRef]
  41. Just, T.P.; Cooper, I.R.; DeLorey, D.S. Sympathetic Vasoconstriction in Skeletal Muscle: Adaptations to Exercise Training. Exerc. Sport Sci. Rev. 2016, 44, 137–143. [Google Scholar] [CrossRef] [PubMed]
  42. Dawson, E.A.; Green, D.J.; Cable, N.T.; Thijssen, D.H. Effects of acute exercise on flow-mediated dilatation in healthy humans. J. Appl. Physiol. (1985) 2013, 115, 1589–1598. [Google Scholar] [CrossRef] [PubMed]
  43. Currie, K.D.; McKelvie, R.S.; Macdonald, M.J. Flow-mediated dilation is acutely improved after high-intensity interval exercise. Med. Sci. Sports Exerc. 2012, 44, 2057–2064. [Google Scholar] [CrossRef] [PubMed]
  44. Bailey, T.G.; Perissiou, M.; Windsor, M.; Russell, F.; Golledge, J.; Green, D.J.; Askew, C.D. Cardiorespiratory fitness modulates the acute flow-mediated dilation response following high-intensity but not moderate-intensity exercise in elderly men. J. Appl. Physiol. (1985) 2017, 122, 1238–1248. [Google Scholar] [CrossRef] [PubMed]
  45. Hwang, I.C.; Kim, K.H.; Choi, W.S.; Kim, H.J.; Im, M.S.; Kim, Y.J.; Kim, S.H.; Kim, M.A.; Sohn, D.W.; Zo, J.H. Impact of acute exercise on brachial artery flow-mediated dilatation in young healthy people. Cardiovasc. Ultrasound 2012, 10, 39. [Google Scholar] [CrossRef] [PubMed]
  46. Rognmo, O.; Bjørnstad, T.H.; Kahrs, C.; Tjønna, A.E.; Bye, A.; Haram, P.M.; Stølen, T.; Slørdahl, S.A.; Wisløff, U. Endothelial function in highly endurance-trained men: Effects of acute exercise. J. Strength Cond. Res. 2008, 22, 535–542. [Google Scholar] [CrossRef]
  47. Gori, T.; Grotti, S.; Dragoni, S.; Lisi, M.; Di Stolfo, G.; Sonnati, S.; Fineschi, M.; Parker, J.D. Assessment of vascular function: Flow-mediated constriction complements the information of flow-mediated dilatation. Heart 2010, 96, 141–147. [Google Scholar] [CrossRef]
Figure 1. During exercise, ultrasound assessment for visits 3 and 4 consisted of a 20 min supine rest period, a pre-exercise flow-mediated dilation (FMD) test, 5 × 3 min during exercise blood flow measurement periods, a transition period, and a post-exercise FMD. The five separate measurements included (1) seated rest on the bike, (2) warm-up, (3) early, (4) middle, and (5) late. HIIE: high-intensity interval exercise; MOD: moderate-intensity continuous exercise; WU: warm up; CD: cool-down; SR: seated rest; BF = 3 min blood flow measurement period.
Physiologia 04 00015 g001
Figure 2. Brachial artery diameter before and during exercise. Mean ± SD; HIIE: high-intensity interval exercise; MOD: moderate-intensity continuous exercise.
Physiologia 04 00015 g002
Figure 3. (A) Anterograde blood flow, (B) Retrograde blood flow, (C) Anterograde shear rate, and (D) Retrograde shear rate during both exercise bouts. Mean ± SD; HIIE (solid lines): high-intensity interval exercise; MOD (dashed lines): moderate-intensity continuous exercise.
Physiologia 04 00015 g003aPhysiologia 04 00015 g003b
Figure 4. Change in all vascular function measures after acute exercise (post−pre). Mean delta ± standard error. * Significant time effect within exercise type. † Significant exercise type × time interaction.
Physiologia 04 00015 g004
Table 1. Descriptive statistics of all participants.
Mean ± SD (n = 16)
Age (yr)22.5 ± 3.2
Height (cm)176.95 ± 8.64
Weight (kg)77.78 ± 9.18
BMI (kg/m2)25.5 ± 3.0
VO2max (mL/kg/min)43.6 ± 6.2
Table 2. All brachial artery measurements during exercise. Mean of early, mid, and late.
MOD (n = 15)HIIE (n = 15)p Value #F StatisticEffect Size (Partial eta2)
Diameter (mm)4.30 ± 0.424.22 ± 0.330.340.910.012
Anterograde Blood Flow (mL/min)191.3 ± 80.3153.9 ± 67.50.03 *4.890.039
Retrograde Blood Flow (mL/min)−48.7 ± 21.3−63.9 ± 23.3<0.01 *9.010.027
Anterograde Blood Velocity (cm/s)21.7 ± 8.118.0 ± 6.10.02 *5.270.065
Retrograde Blood Velocity (cm/s)−5.5 ± 2.0−7.8 ± 2.8<0.01 *15.580.170
Anterograde Shear Rate (s−1)203.5 ± 78.1170.8 ± 55.50.04 *4.440.055
Retrograde Shear Rate (s−1)−51.5 ± 19.8−73.8 ± 28.4<0.01 *16.540.179
HIIE: high-intensity interval exercise; MOD: moderate-intensity continuous exercise. Values represent mean ± standard deviation. # Degrees of freedom for these comparisons = 1. * Significant difference (p < 0.05).
Table 3. All brachial artery measurements from the HIIE On, HIIE Off, and Moderate exercise periods.
HIIE OnHIIE OffMOD Post Hoc p-Values
Main Effect p-Values #, F Statistic, Partial eta2On vs. OffOn vs. MODOff vs. MOD
Diameter (mm)4.22 ± 0.384.22 ± 0.374.30 ± 0.420.72, 0.45, 0.0101.001.001.00
Anterograde Blood Flow (mL/min)142.5 ± 73.7164.8 ± 81.7191.3 ± 80.30.04 *, 2.89, 0.0590.810.04 *0.48
Retrograde Blood Flow (mL/min)−77.5 ± 29.6−49.6 ± 21.9−48.7 ± 21.3<0.01 *, 10.93, 0.192<0.01 *<0.01 *1.00
Anterograde
Blood Velocity (cm/s)
16.4 ± 6.519.2 ± 7.821.7 ± 8.10.01 *, 3.71, 0.0750.460.01 *0.46
Retrograde Blood Velocity (cm/s)−9.22 ± 3.2−6.0 ± 2.7−5.5 ± 2.0<0.01 *, 13.94, 0.233<0.01 *<0.01 *1.00
Anterograde Shear Rate (s−1)154.8 ± 56.1181.7 ± 71.5203.5 ± 78.10.02 *, 3.55, 0.0720.410.02 *0.58
Retrograde Shear Rate (s−1)−88.4 ± 31.3−57.8 ± 27.7−51.5 ± 19.8<0.01 *, 13.45, 0.226<0.01 *<0.01 *0.92
Values represent Mean ± SD. # Degrees of freedom for all main effects = 3. * Significant difference (p < 0.05).
Disclaimer/Publisher’s Note: The statements, opinions and data contained in all publications are solely those of the individual author(s) and contributor(s) and not of MDPI and/or the editor(s). MDPI and/or the editor(s) disclaim responsibility for any injury to people or property resulting from any ideas, methods, instructions or products referred to in the content.