Article

Eco-Friendly vs. Traditional Cleaning in Healthcare Settings: Microbial Safety and Environmental Footprint

1
Department of Chemical, Pharmaceutical and Agricultural Sciences, University of Ferrara, 44121 Ferrara, Italy
2
Punto 3 Srl, 44121 Ferrara, Italy
3
LTTA—LABORATORIO PER LE TECNOLOGIE DELLE TERAPIE AVANZATE, University of Ferrara, 44121 Ferrara, Italy
4
CIB—Interdepartmental centre of Biotechnologies, University of Ferrara, 44121 Ferrara, Italy
*
Author to whom correspondence should be addressed.
Hygiene 2025, 5(3), 37; https://doi.org/10.3390/hygiene5030037
Submission received: 20 June 2025 / Revised: 25 July 2025 / Accepted: 8 August 2025 / Published: 22 August 2025

Abstract

Growing concern for environmental sustainability has resulted in the implementation of sanitization methods that respect ecological principles. This research evaluates a “green” sanitizing protocol that uses CAM (Minimum Environmental Criteria)-compliant products against a traditional protocol within two ASL Roma 1 facilities. The study performed a Life Cycle Assessment (LCA) following ISO 14040, ISO 14044, and ISO 14067 standards to measure greenhouse gases emissions. Microbiological sampling was conducted according to established protocols across three different risk zones utilizing contact plates and surface swabs. The Life Cycle Assessment showed that CO2 emissions reduced by 49.6% to 53.3% at different sites due to reduced energy use together with concentrated detergents and improved washing cycles. Microbiological testing revealed notable decreases in contamination rates across both cleaning systems yet demonstrated the “green” system achieved superior results specifically within high-risk zones. The “green” protocol matched traditional cleaning methods hygienically but delivered significant environmental advantages which positions it as a sustainable hospital cleaning solution.

1. Introduction

In recent years, public awareness of environmental issues has increased. As a result, advancing sustainable practices is key to balancing social productivity and ensuring the responsible use of environmental resources [1]. Within sustainable development research, Life Cycle Assessment (LCA) is a key tool for gauging the effectiveness of sustainability measures and assessing the environmental impacts of a product or process design [2,3]. According to the European Commission, LCA is the primary methodology currently available for evaluating the estimated environmental burden of products [4].
In healthcare facilities, ensuring effective hygiene procedures is crucial for controlling cross-contamination among patients, combating antimicrobial resistance (AMR), and minimizing the need for costly interventions following microbial breaches [5,6]. There is a growing need to explore biologically active molecules capable of fighting prevalent nosocomial pathogens, particularly given the increasing resistance resulting from antibiotic misuse [7]. Consequently, research efforts are shifting toward eco-friendly products and their nanoformulations. Traditionally, managing microbial contamination has relied heavily on chemical-based sanitation methods, despite their clear limitations and ongoing issues with contamination, rising AMR among hospital microbes, and the environmental impact of certain chemicals [8,9,10]. Therefore, monitoring microbial presence in inanimate environments can help evaluate the effectiveness of routine cleaning and disinfection practices, providing essential data to guide corrective actions, choose appropriate cleaning agents, and assess the cost effectiveness of different approaches. This study examined the real-world effectiveness of sustainable and eco-friendly products that meet the hospital’s Minimum Environmental Criteria (CAMs) compared to traditional methods using detergents, chemical disinfectants, and conventional microfiber.
In healthcare settings, cleaning agents must meet strict requirements not only for antimicrobial efficacy but also for safety, surface compatibility, ease of use, and time efficiency. Products commonly used often exhibit significant ecological side effects such as aquatic toxicity, VOC emissions, and poor biodegradability, raising concerns about long-term environmental burden, especially in high-frequency hospital use [11,12]. Growing awareness of these impacts has prompted regulatory bodies and institutional procurement systems to adopt greener criteria, such as the CAM in Italy and EU Ecolabel certifications. A number of studies have attempted to evaluate the trade-off between microbiological performance and ecological impact of these agents, with mixed results depending on application protocol, surface types, and microbial burden [13]. However, comprehensive comparative analyses of conventional versus eco-friendly solutions in real-life clinical environments remain scarce. In this context, our study aimed to assess whether a green cleaning protocol, based on CAM-compliant, biodegradable products, could achieve comparable microbiological outcomes while reducing environmental footprint.
We hypothesized that the eco-friendly cleaning protocol would demonstrate equivalent or superior microbiological efficacy compared to the traditional method, while significantly reducing environmental impact.

2. Materials and Methods

2.1. Sampling Plan

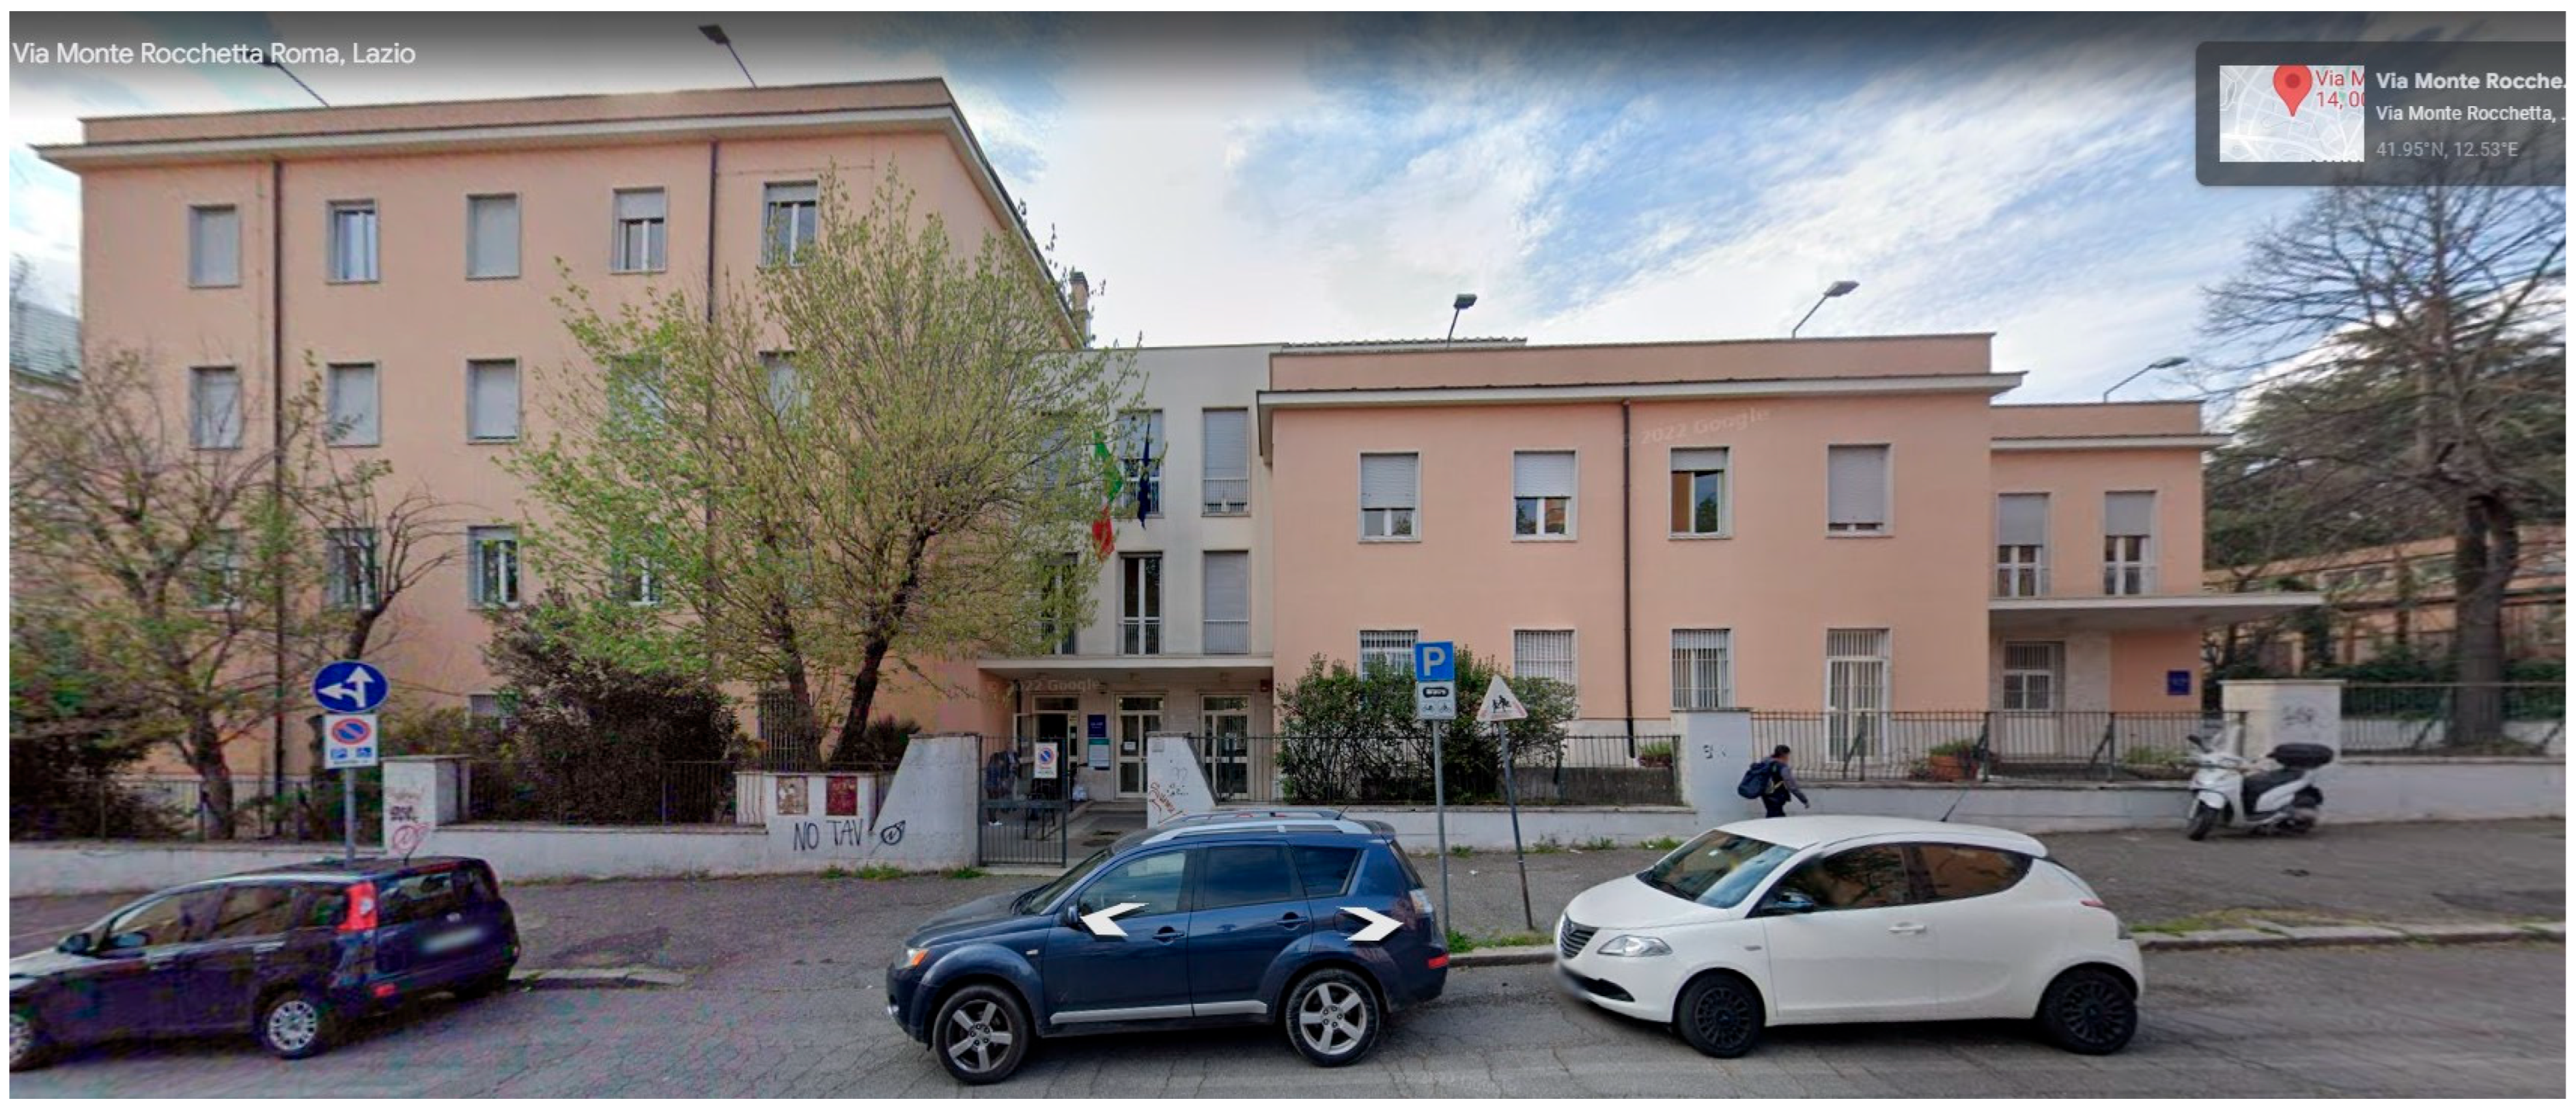
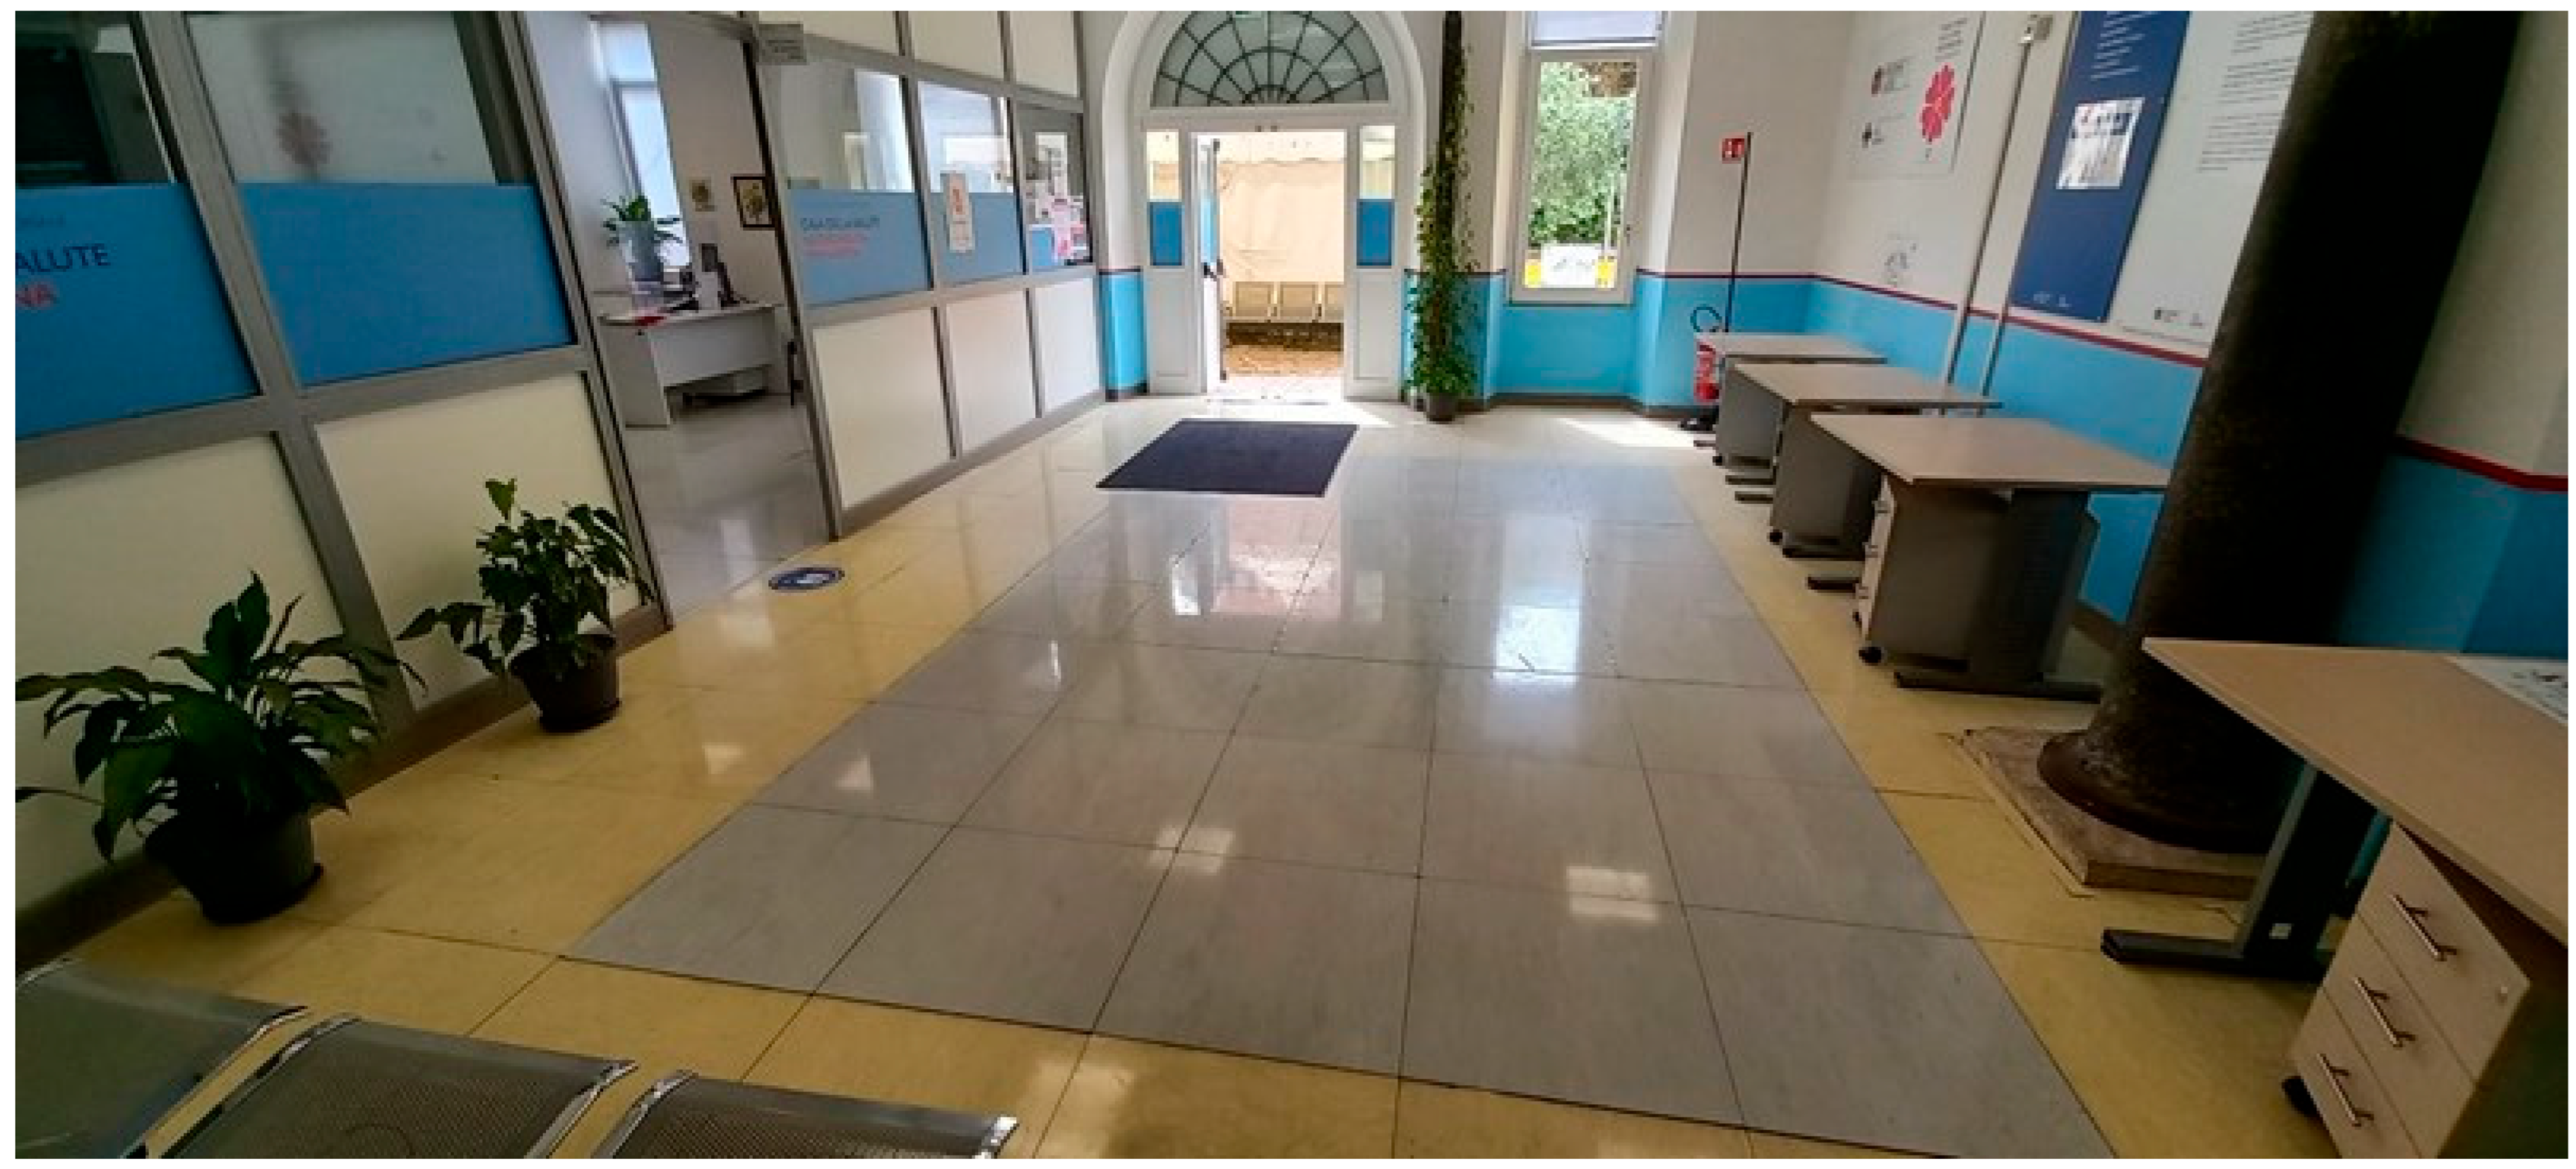
The study took place at two healthcare facilities within the ASL (Azienda Sanitaria Locale) Roma 1 district, specifically at the Monte Rocchetta Nursing Home and the Presidio Nuovo Regina Margherita Hospital. The headquarters of ASL Roma 1—District 3—Monte Rocchetta is located at Via Monte Rocchetta, 14—00139 Rome, hereinafter referred to as Monte Rocchetta (MR). The reference site is a civil and healthcare cleaning environment comprising waiting rooms (Figure 1), offices, outpatient clinics, interview areas, service rooms, and connecting corridors. These locations were selected due to their representative variety of surface types, contamination levels, cleaning frequencies, and cleaning methods typical of civil and health cleaning settings. The sampled zones cover all areas within the building, covering a total surface area of 3061.60 square meters (Figure 2).
The Presidio Nuovo Regina Margherita is located at Via Roma Libera, 76—00153 Roma (hereafter referred to as RG, Regina Margherita—Figure 3). This site is a hospital building that includes surgical areas, connecting spaces, waiting areas, services, and operating rooms. This site was selected for analysis as it represents the typical range of surfaces, contamination levels, cleaning frequencies, and procedures characteristic of healthcare settings. The sampled zones encompass the entire building, totaling 15,900.64 square meters.
Based on clinical insights and existing procedures, a sampling protocol was developed [14]. Each sample was collected three times. The sampling took place in various risk areas within the hospital facilities, including green (low-risk), yellow (low-to-average risk), and orange (average-risk) zones. To collect samples, we used multiple areas of the hospital, such as patient rooms (where we took samples from frequently touched floors and surfaces), patient bathrooms (with samples from floors and surfaces like toilets, sinks, and showers that are often touched), waiting rooms, and corridors within the same ward. We collected samples both prior to and following cleaning.

2.2. Microbiological Evaluation

To standardize sampling procedures, microbiological analysis was performed using RODAC contact plates and swabs pre-treated with Dey-Engley neutralizing solution, both of which were provided by Liofilchem (Roseto degli Abruzzi, TE, Italy). An initial surface evaluation was carried out through visual inspection, focusing on cleanliness, surface integrity, and the presence of moisture [15,16].
Microbial contamination was assessed by determining aerobic colony counts (ACC) following a 48 h incubation at 37 °C on tryptic soy agar (TSA) RODAC plates supplemented with neutralizing agents. Specific microbial groups were targeted using selective media: MacConkey Agar (MCA) for Enterobacteriaceae, Mannitol Salt Agar (MSA) for staphylococci, and Sabouraud dextrose agar (SDA) for fungi, including yeasts and molds.
Flat surfaces were sampled by pressing contact plates against the surface using a standardized weight applicator (VWR Collection, International, Milan, Italy) for 30 s. Additionally, the same flat areas were resampled using sterile cotton swabs pre-moistened with neutralizing solution, following a consistent 10 × 10 cm (100 cm2) sterile template. For non-flat or irregular surfaces, the same swabbing method was applied, covering the entire hand-contact area.
Swab samples were stored in temperature-controlled insulated containers (0–4 °C), with real-time monitoring via data logger during transport to the laboratory. Upon arrival, swabs were vortexed to enhance the release of microorganisms into the diluent. The resulting suspension was then transferred and evenly spread onto 90 mm Petri dishes containing 20 mL of different agar media—tryptic soy agar (TSA), MacConkey agar (MCA), mannitol salt agar (MSA), and Sabouraud dextrose agar (SDA)—to support the growth of a broad range of microbial taxa. The Petri dishes were incubated at 36 ± 1 °C for 24–48 h, except for the SDA plates, which were incubated at 25 °C for 72–120 h.
Colony growth was quantified and interpreted according to standardized thresholds: minimal growth (6–39 colonies, ≈2.5 CFU/cm2) and scant growth (<6 colonies, <2.5 CFU/cm2) were considered acceptable. Following incubation, colonies were enumerated, isolated, and subjected to identification procedures [17,18].
A total of 236 samples were collected for each sampling protocol (TT and TG). The sampled surfaces included beds, chairs, tables, armchairs, floors, toilets, sinks, showers, and bathroom flooring. Additionally, shared areas, including tables, chairs, and floors, in both healthcare facilities, were assessed.

2.3. Microbial Identification

Bacterial colonies displaying distinct phenotypic characteristics—such as morphology, shape, and pigmentation—were selected for further analysis. These isolates were preserved in 50% (v/v) glycerol at −80 °C for long-term storage. Identification of the selected bacterial strains was performed using API identification systems (bioMérieux Italia, Grassina, FI, Italy), in accordance with the manufacturer’s instructions [19].

2.4. Cleaning Procedures

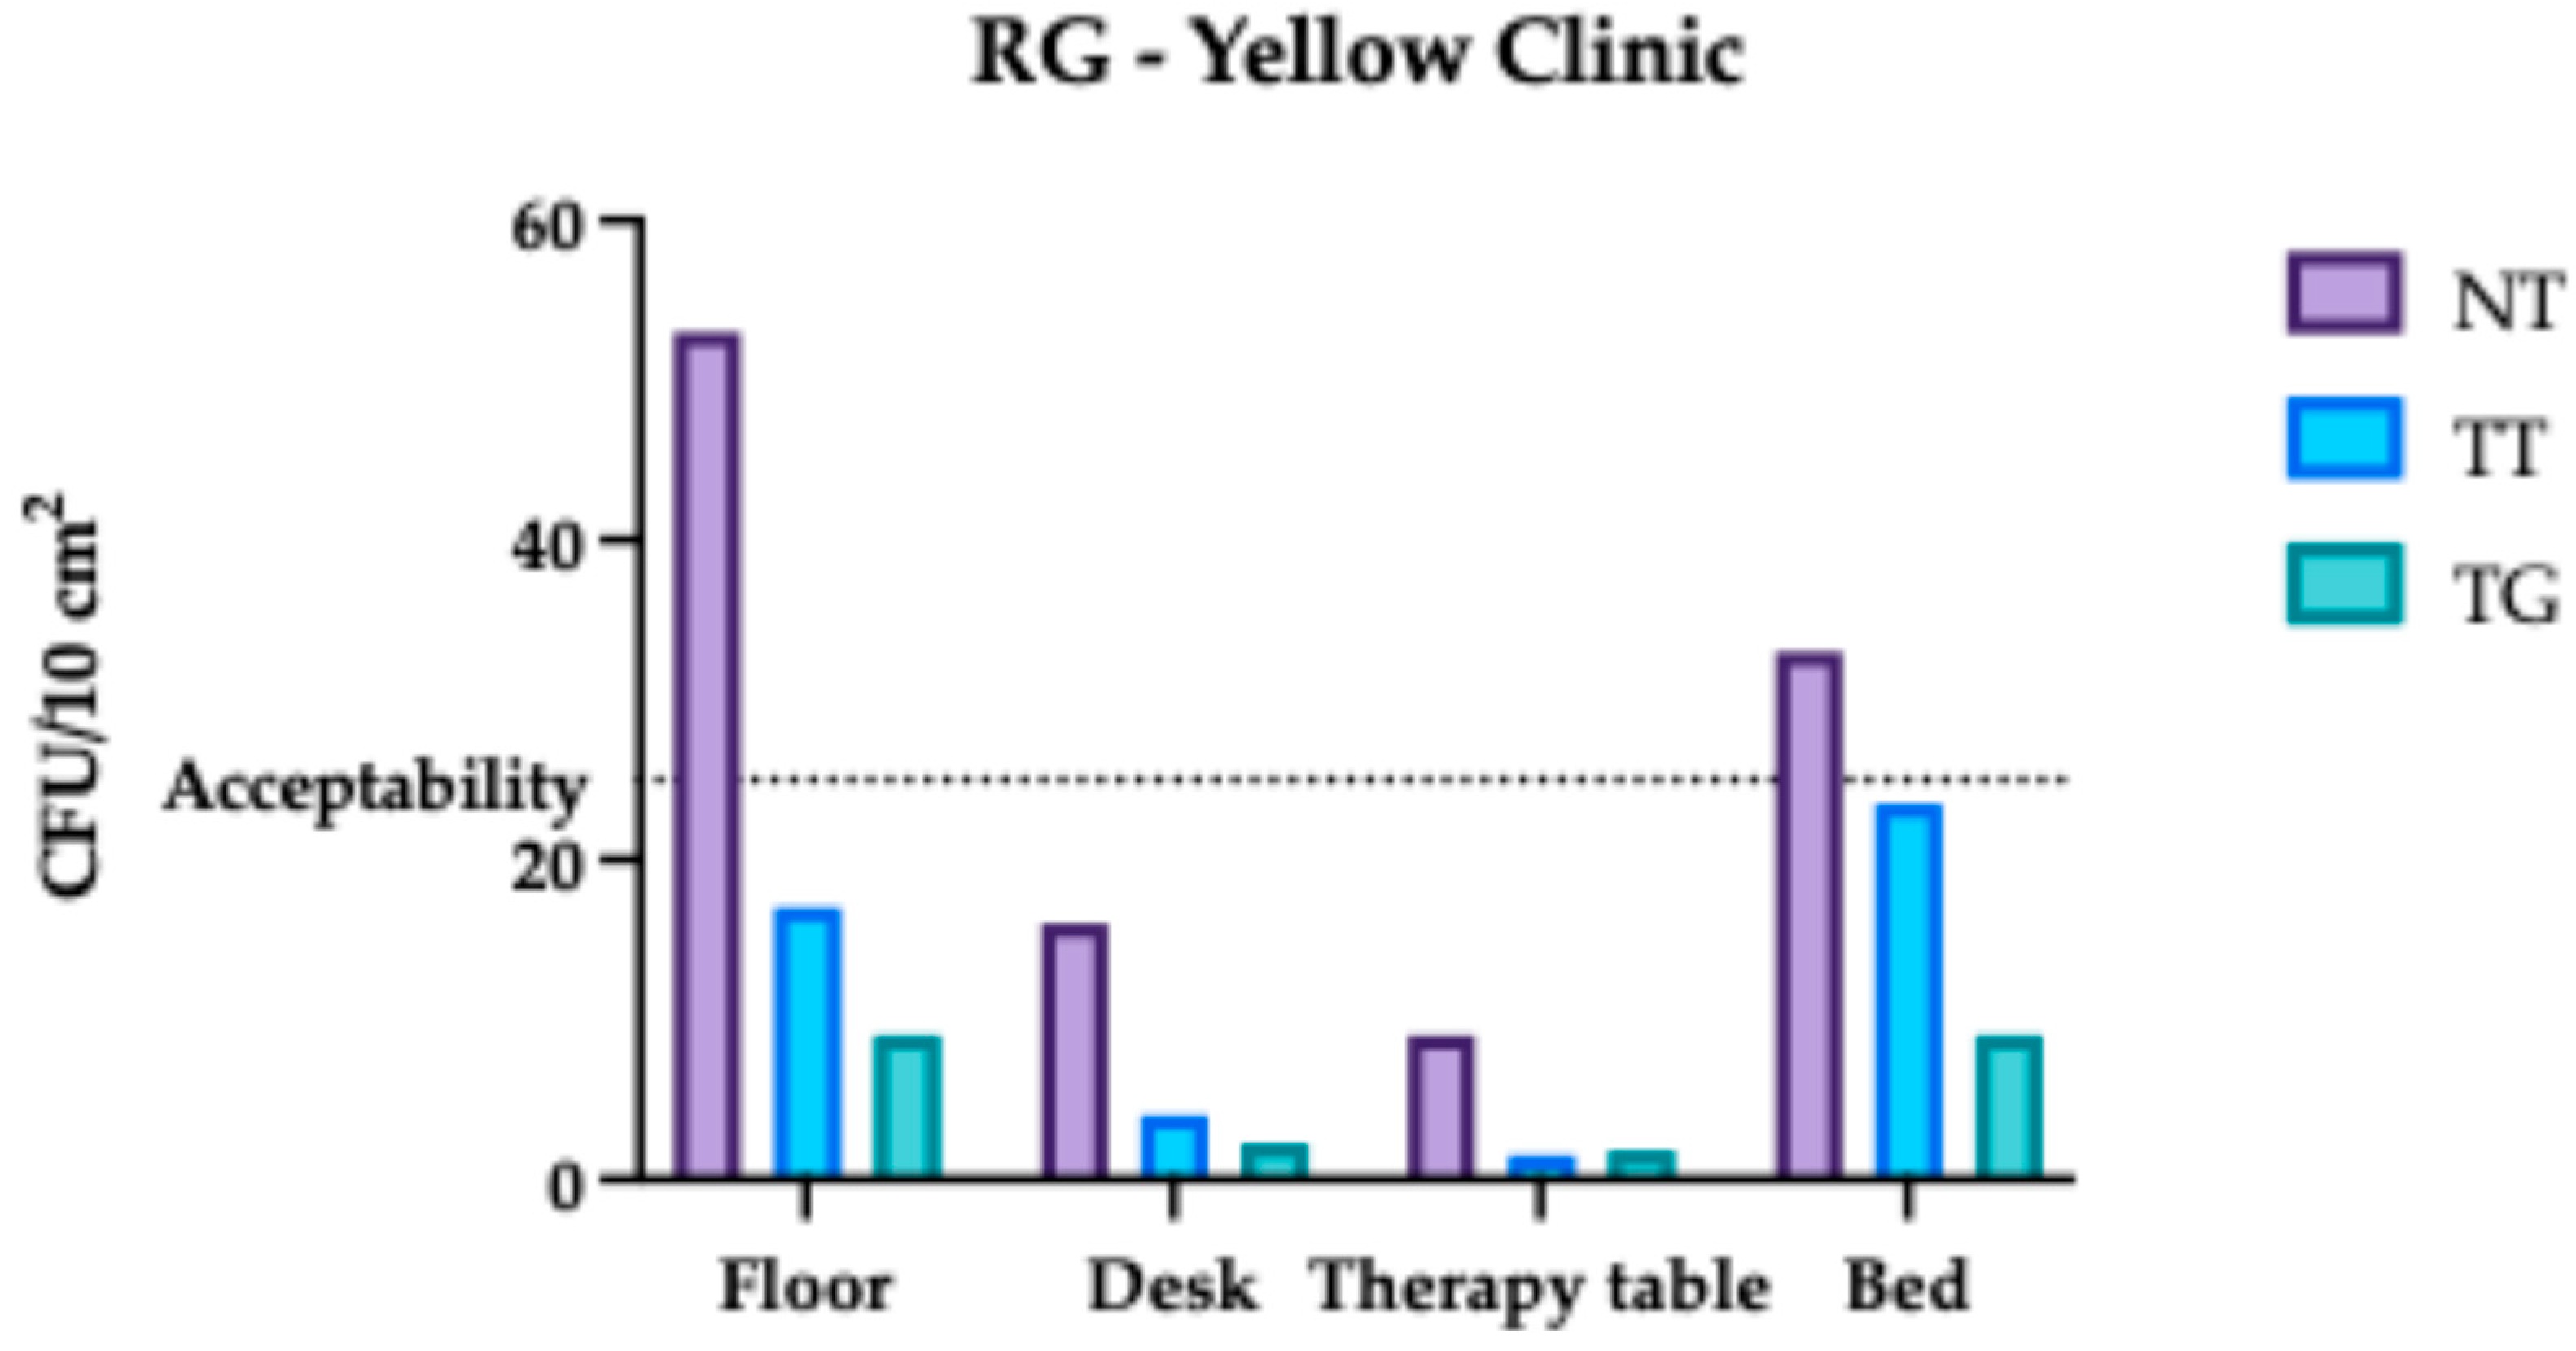
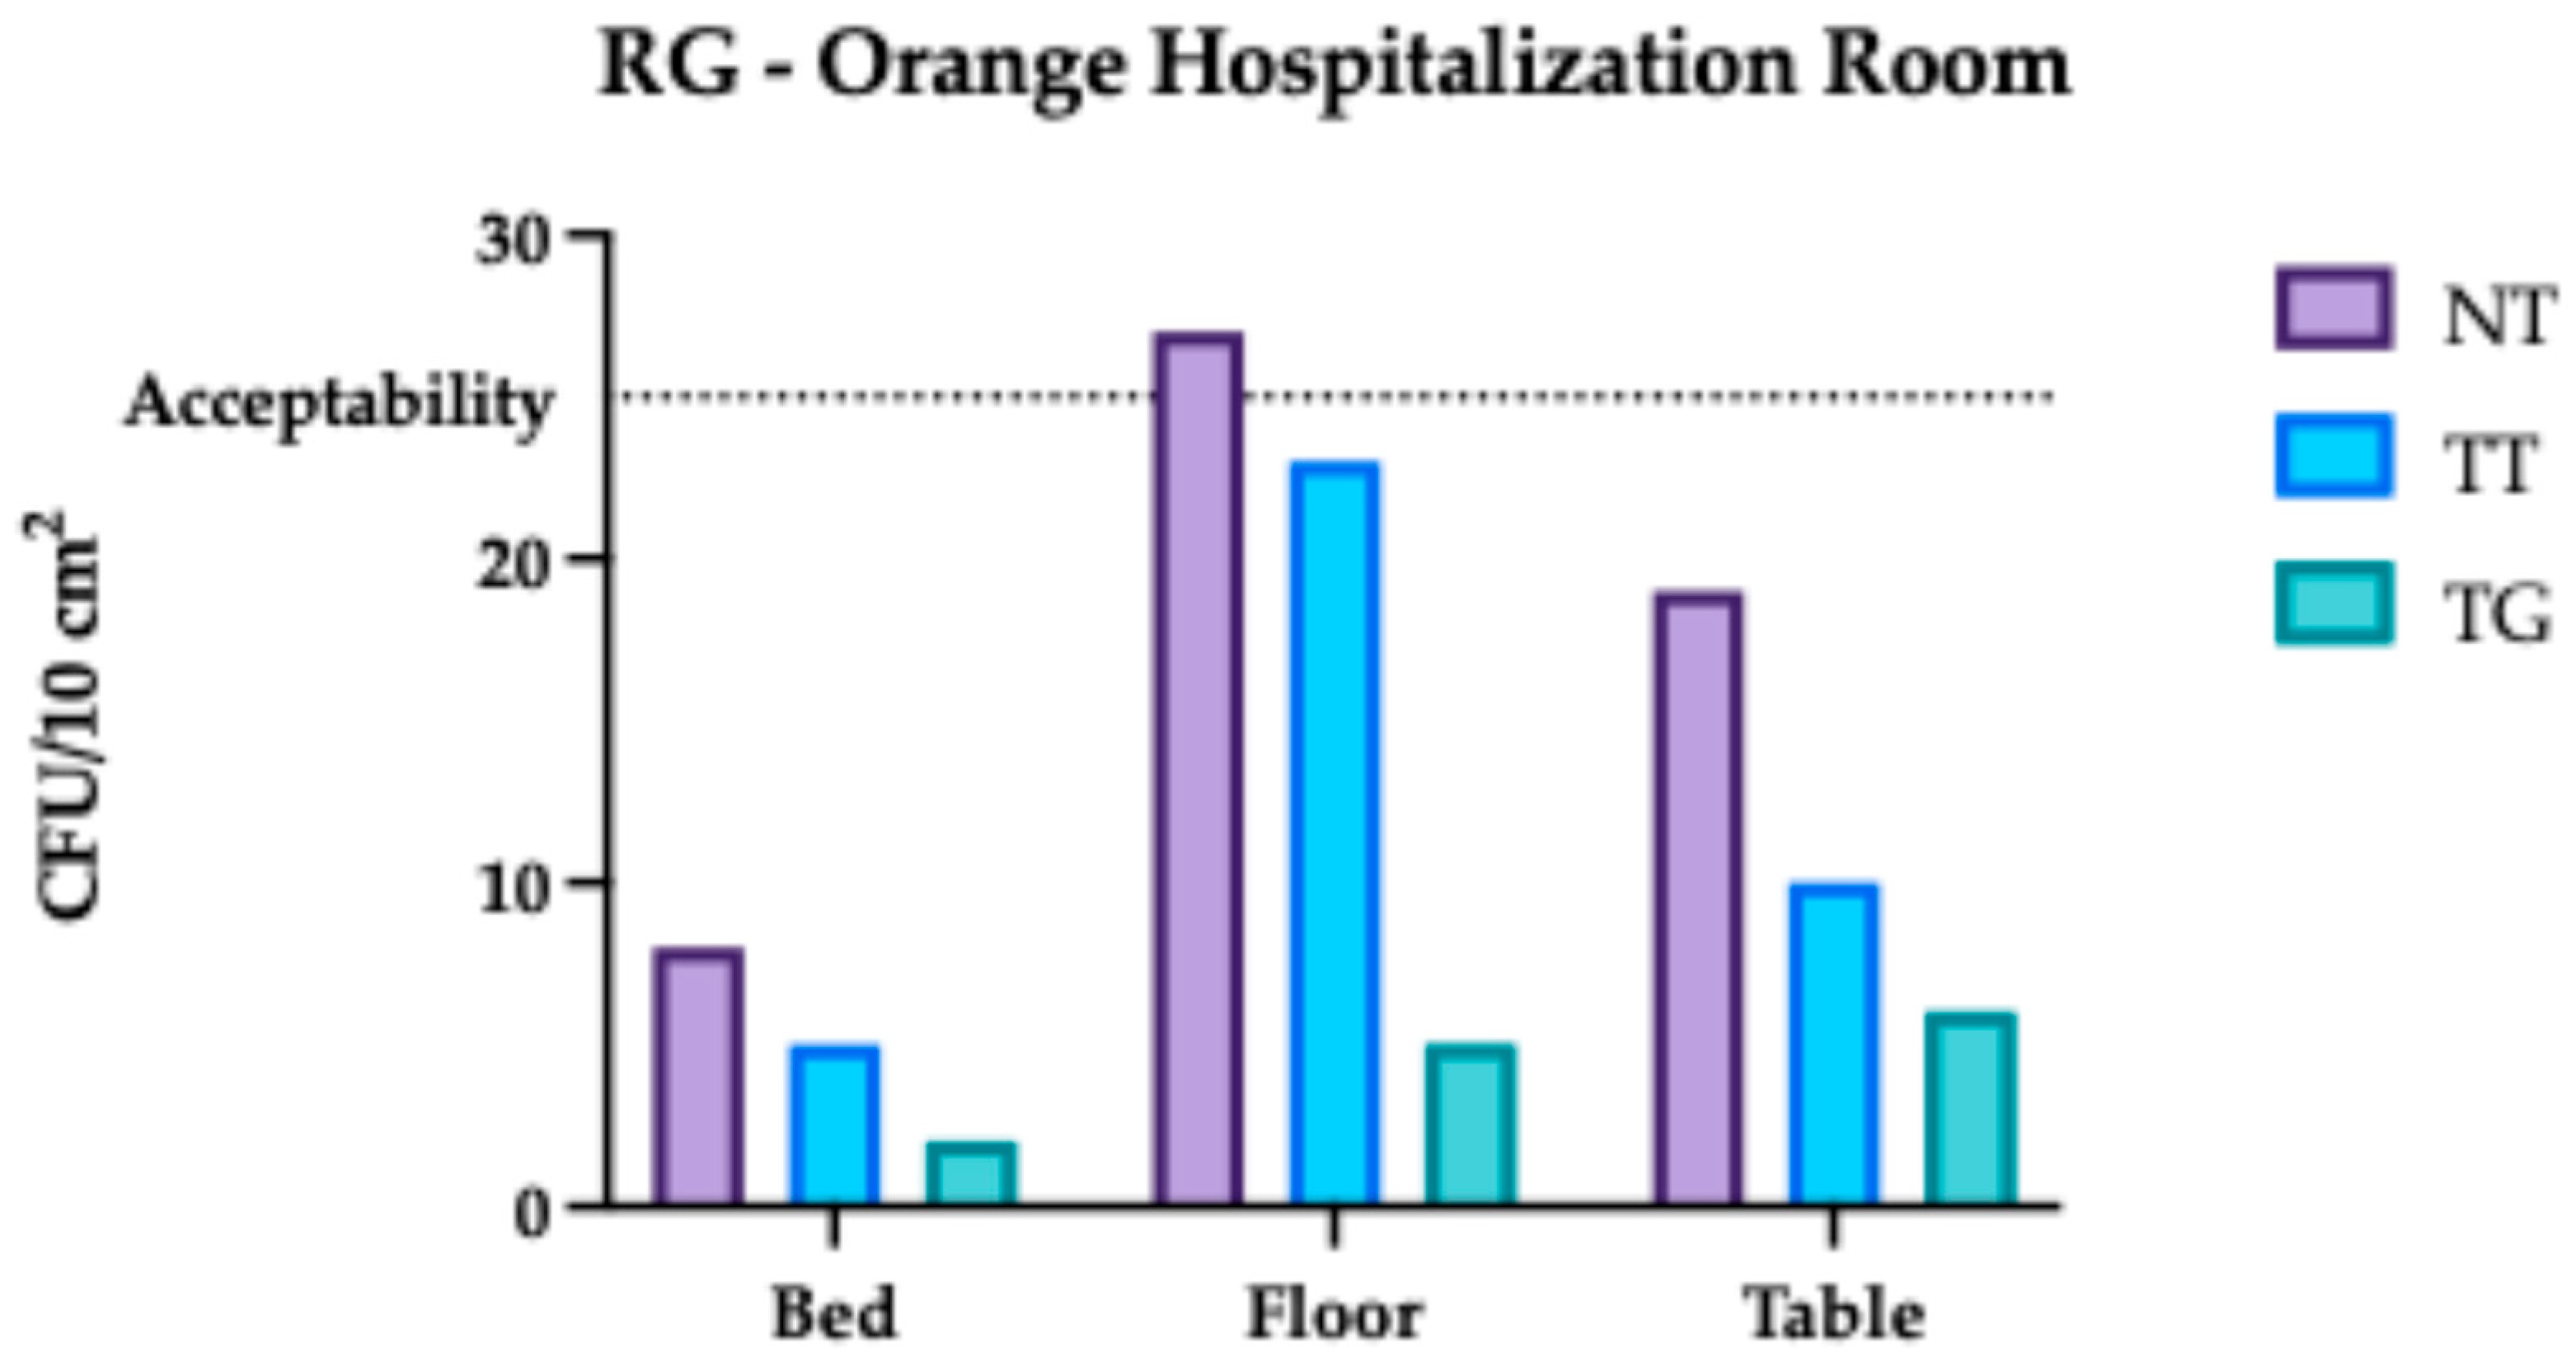
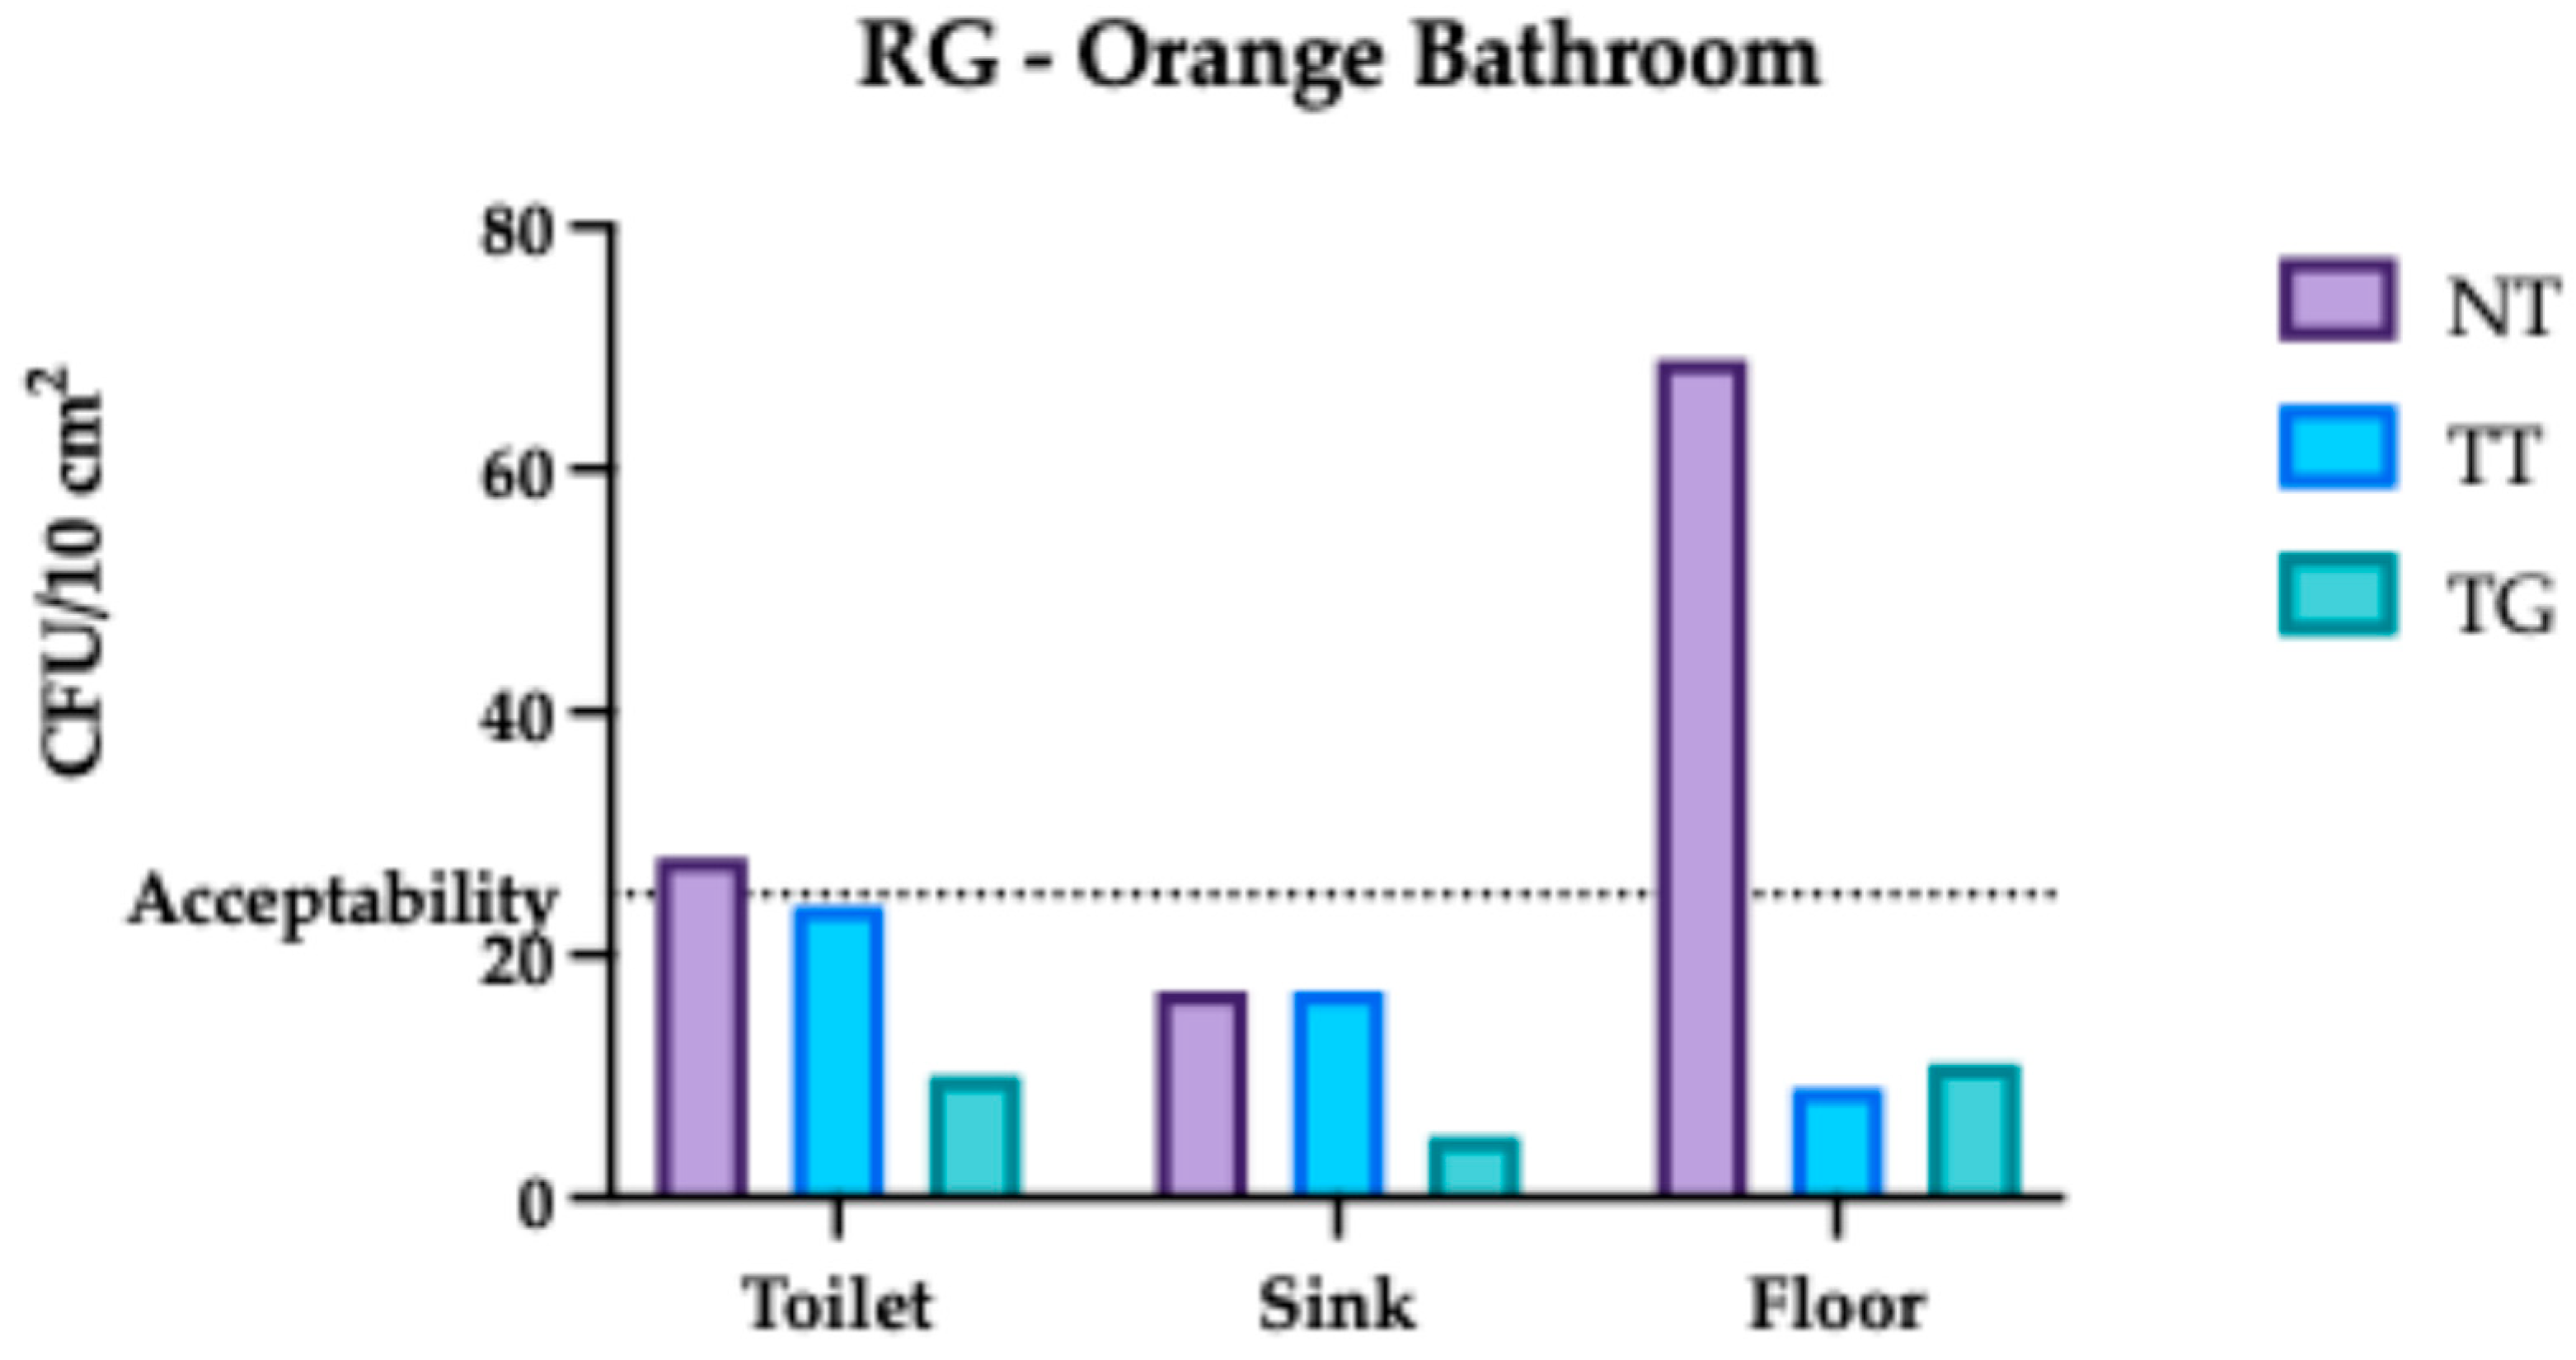
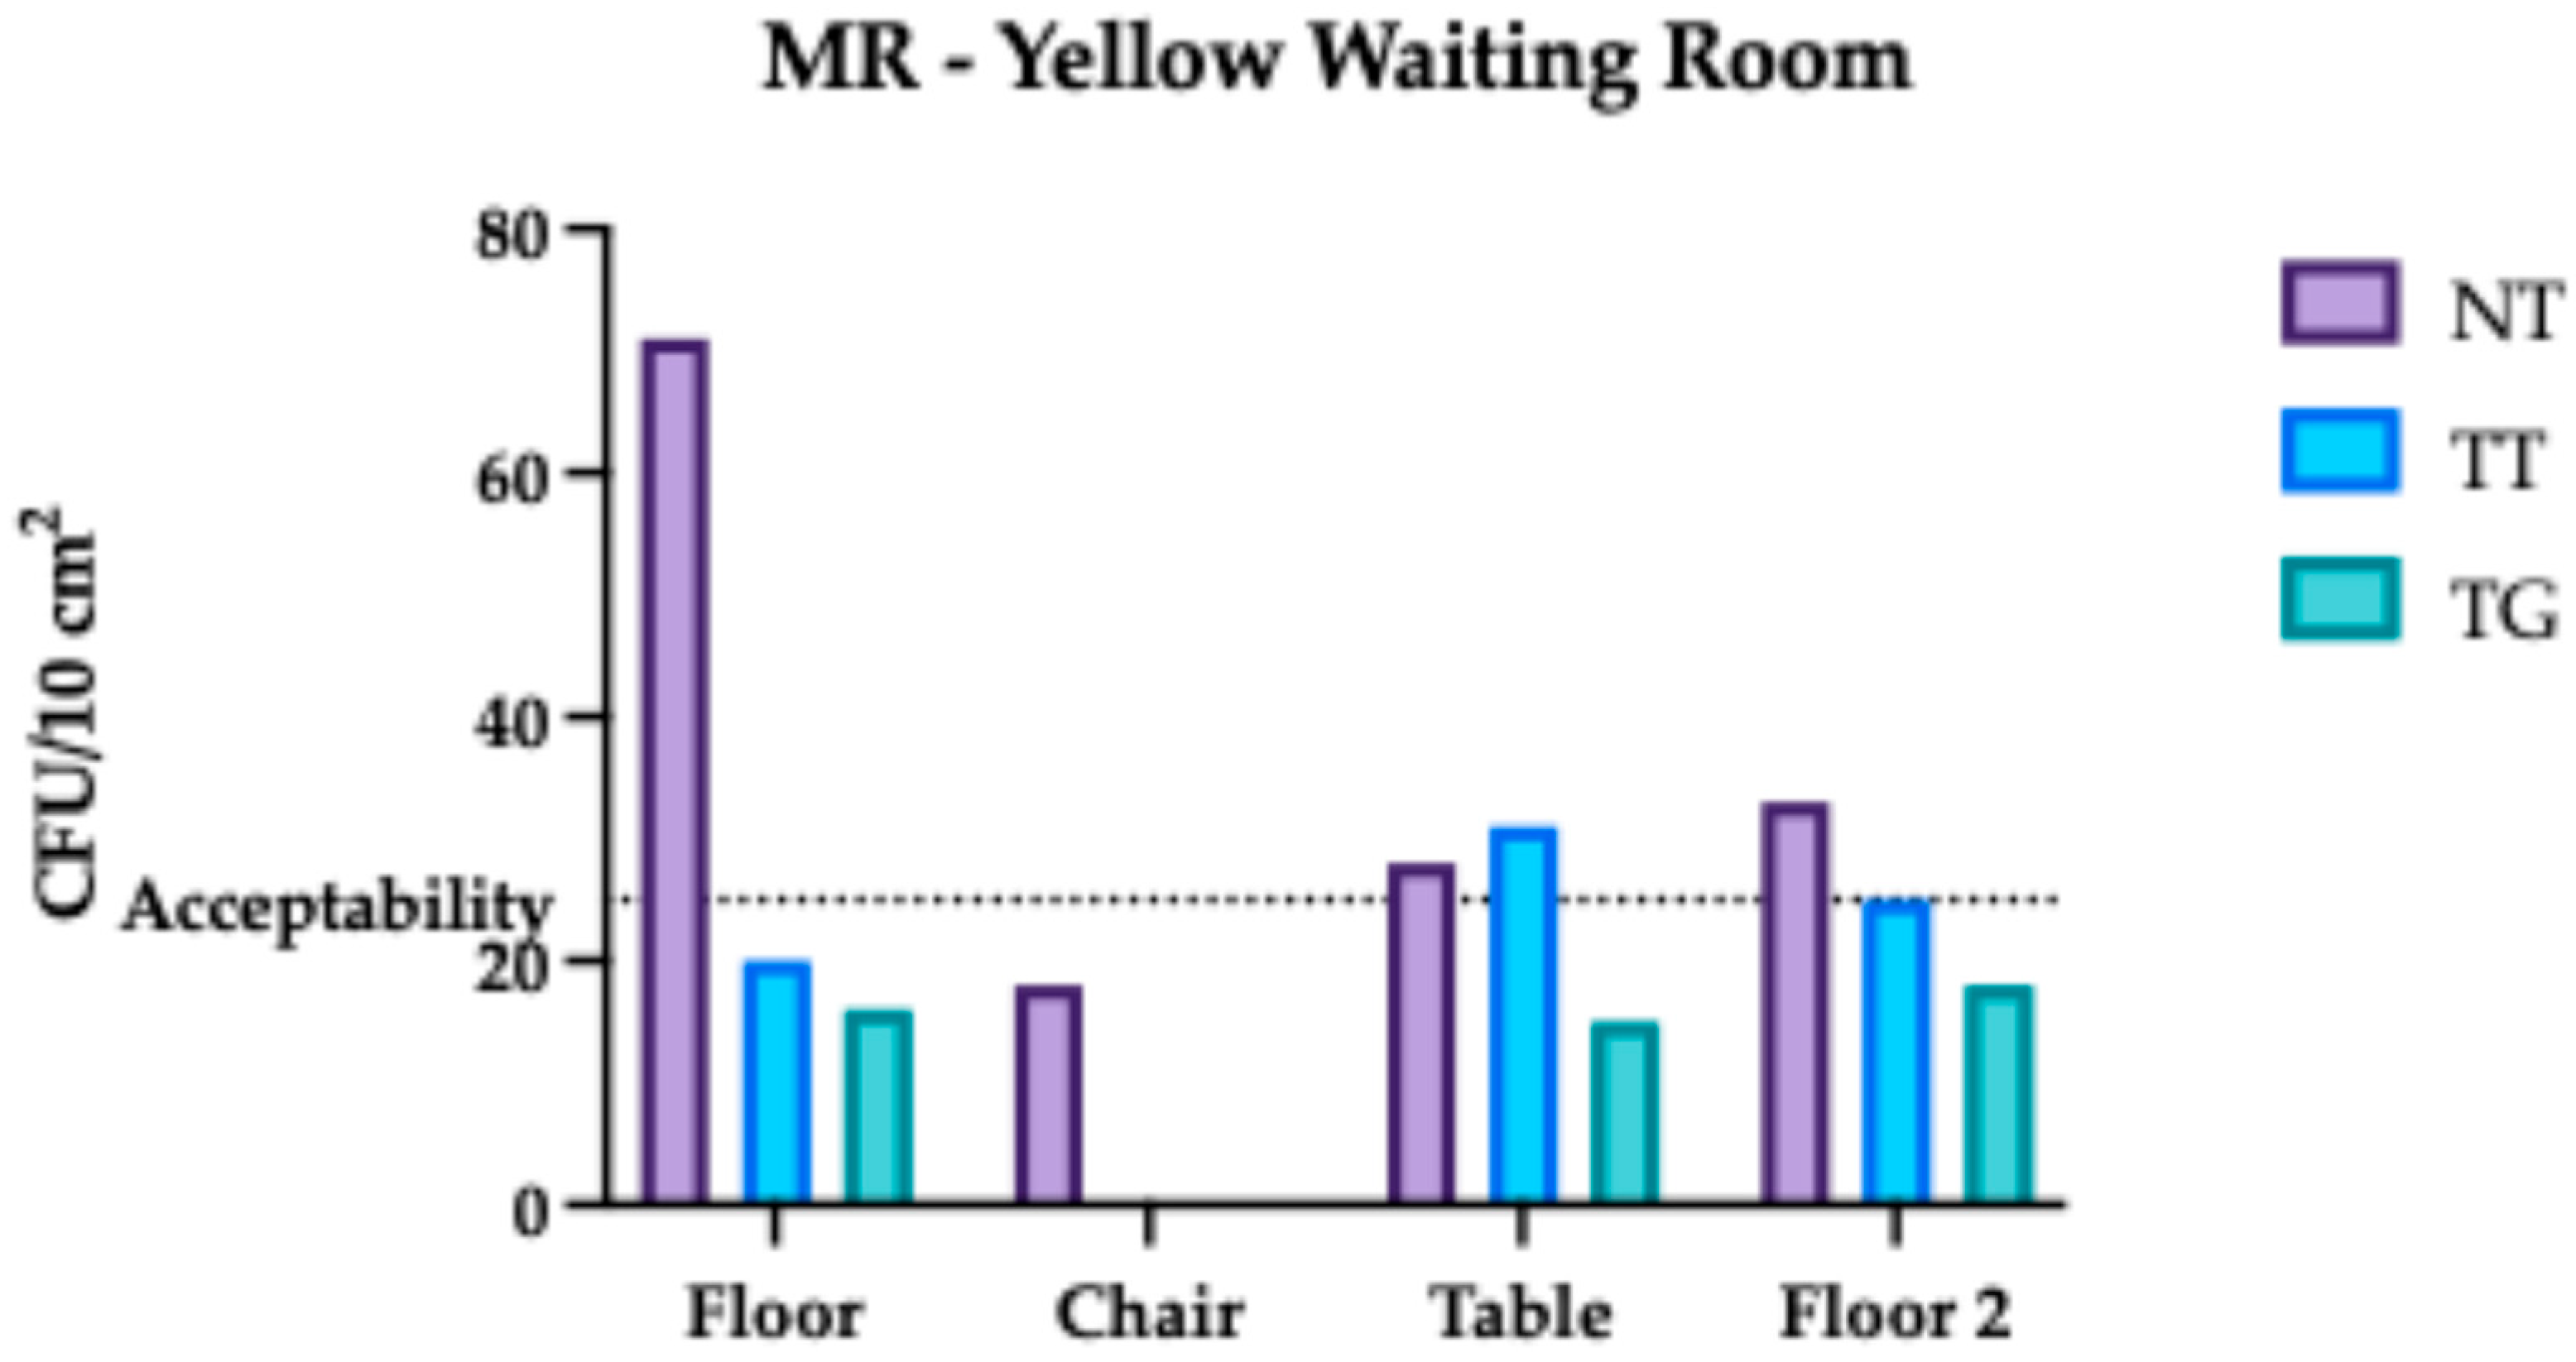
The study compared two cleaning regimes: first, the traditional protocol (TT, traditional treatment) over a four-week period, followed by the green experimental protocol (TG, green treatment) for another four weeks (a total of eight weeks). An untreated surface sampling (NT) served as a control, allowing evaluation within similar-use areas under comparable contamination characteristics.
Cleaning schedules and procedures complied with the ASL Roma 1 service specifications for routine and periodic cleaning. The analytical framework was guided by international Life Cycle Assessment (LCA) principles (ISO 14040/44), involving the identification of critical service steps, followed by detailed field sampling (water, chemicals, textiles, and equipment energy use) to model real-world operations [20,21].
Only cleaning operations that resulted in tangible inputs or outputs—such as resource consumption or detectable environmental consequences—were considered relevant and included in the study. Each protocol was observed over a continuous four-week period, which was judged adequate to reflect the operative rhythms defined by the contractual cleaning schedules, particularly those occurring daily or weekly. Conversely, activities performed at lower frequencies (i.e., less than once per month), along with non-recurring interventions, fell outside the boundaries of this assessment and were therefore excluded from the analysis.
Sampling was conducted at two sites:
Monte Rocchetta
TT: 26 days monitored (19 cleaning events)
TG: 31 days monitored (22 cleaning events)
Nuovo Regina Margherita
TT: 29 days monitored (29 cleaning events)
TG: 29 days monitored (29 cleaning events)
Summary of Key Differences Between Protocols—By Category
  • Cleaning Products:
The main differences between the traditional and green cleaning protocols lie in the concentration and formulation of active ingredients, which directly influence the efficiency and sustainability of the procedures. While both protocols utilize similar classes of surfactants, chelating agents, and solvents, the products used in the green protocol generally contain higher concentrations of active components and are designed for improved performance at lower dosages. For example, one of the descaling agents in the traditional protocol contains 10–12.5% citric acid monohydrate and 7–10% lactic acid, whereas its counterpart in the green protocol relies on a more balanced composition including formic acid, alkyl polyglucoside, quaternary ethoxylated alkylmethylamine, and eco-compatible solvents like 2-propylheptanol ethoxylated-propoxylated, each at 1–3%.
These components are selected for their reduced environmental toxicity, enhanced biodegradability, and compatibility with green chemistry principles. Moreover, green protocol formulations often include higher levels of biodegradable surfactants, such as alkyl polyglucosides and alkyl polyglycol ethers, allowing for effective cleaning with a reduced chemical load, lower water consumption, and minimized impacts on packaging and transport.
  • Textiles (cloths and mops):
Both protocols utilize microfiber textiles, but there are notable differences. The green protocol favors cloths and mops with lower grammage and eco-friendly compositions, which are designed to minimize water and detergent usage. In contrast, the traditional protocol employs heavier, high-performance textiles that emphasize durability and cleaning efficiency.
  • Tools and Equipment:
Both protocols rely on ergonomic, professional-grade equipment. However, the green protocol places greater emphasis on low-impact operation, such as utilizing floor scrubbers in eco mode to minimize energy and water consumption.
  • Sanitary Cleaning and Descaling:
The green protocol employs concentrated formulations in smaller packaging, along with eco-friendly microfiber cloths. The traditional protocol utilizes equivalent products in larger formats, employing cloths designed for optimal performance in professional environments.
  • Textile Reconditioning (washing mops and cloths):
Both protocols utilize the same detergents and industrial washing machines, but they differ in their temperature settings: the green protocol operates at 40 °C, reducing energy consumption, while the traditional protocol uses 60 °C, resulting in increased energy usage.
All cleaning operations followed identical task frequencies and used microfiber cloths across protocols as described in Table 1, Table 2 and Table 3.
Cleaning schedule:
Cleaning protocols were conducted, scheduled according to Table 1, Table 2 and Table 3.
Please note that the frequency for cleaning steel equipment is determined by each healthcare facility, while all other tasks are scheduled to be performed weekly.
Please note that the indicated frequencies are considered minimum and can, therefore, be increased in agreement with the Health Company in areas with high attendance. Frequencies are defined and agreed upon at the start of the Service with each Health Company.

2.5. Methodology for Comparative LCA Analysis

The comparative Life Cycle Assessment (LCA) in this study was structured according to the latest Italian environmental procurement guidelines (CAM, Ministerial Decree of 29 January 2021) and aligned with the technical standards UNI EN ISO 14040:2021 and 14044:2021:
  • UNI EN ISO 14040:2021|Environmental Management—Life Cycle Assessment—Principles and Framework [20];
  • UNI EN ISO 14044:2021|Environmental Management—Life Cycle Assessment—Requirements and Guidelines [21].
Given that the environmental evaluation focused specifically on the carbon footprint (expressed in kg CO2 equivalent), the framework also incorporated elements from the following:
ISO 14067:2018|Greenhouse Gases—Carbon Footprint of Products—Requirements and Guidelines for Quantification [22].
Section 6.2 of ISO 14067 highlights the importance of using relevant Product Category Rules (PCRs) when they are available. In this context, the study referred to PCR 2011:03 version 3.0.1 (published 13 April 2022), which sets sector-specific requirements for professional cleaning services in buildings, including both civil and healthcare facilities, whether they are publicly or privately managed [23].
The PCR offers methodological guidelines for data collection and quality, outlining criteria for relevance, system boundaries, and possible exclusions. All relevant aspects from these guidelines are covered in the following sections of this report.
In line with Section 6.3.3 of ISO 14067, the functional unit adopted for this study—taken directly from the applicable PCR—is defined as follows:
1 m2 of representative surface area maintained in hygienic condition over a one-year period
This definition of surface area considers the diversity of environmental settings across the sampled locations, ensuring representativeness of real-world service application.
System boundaries
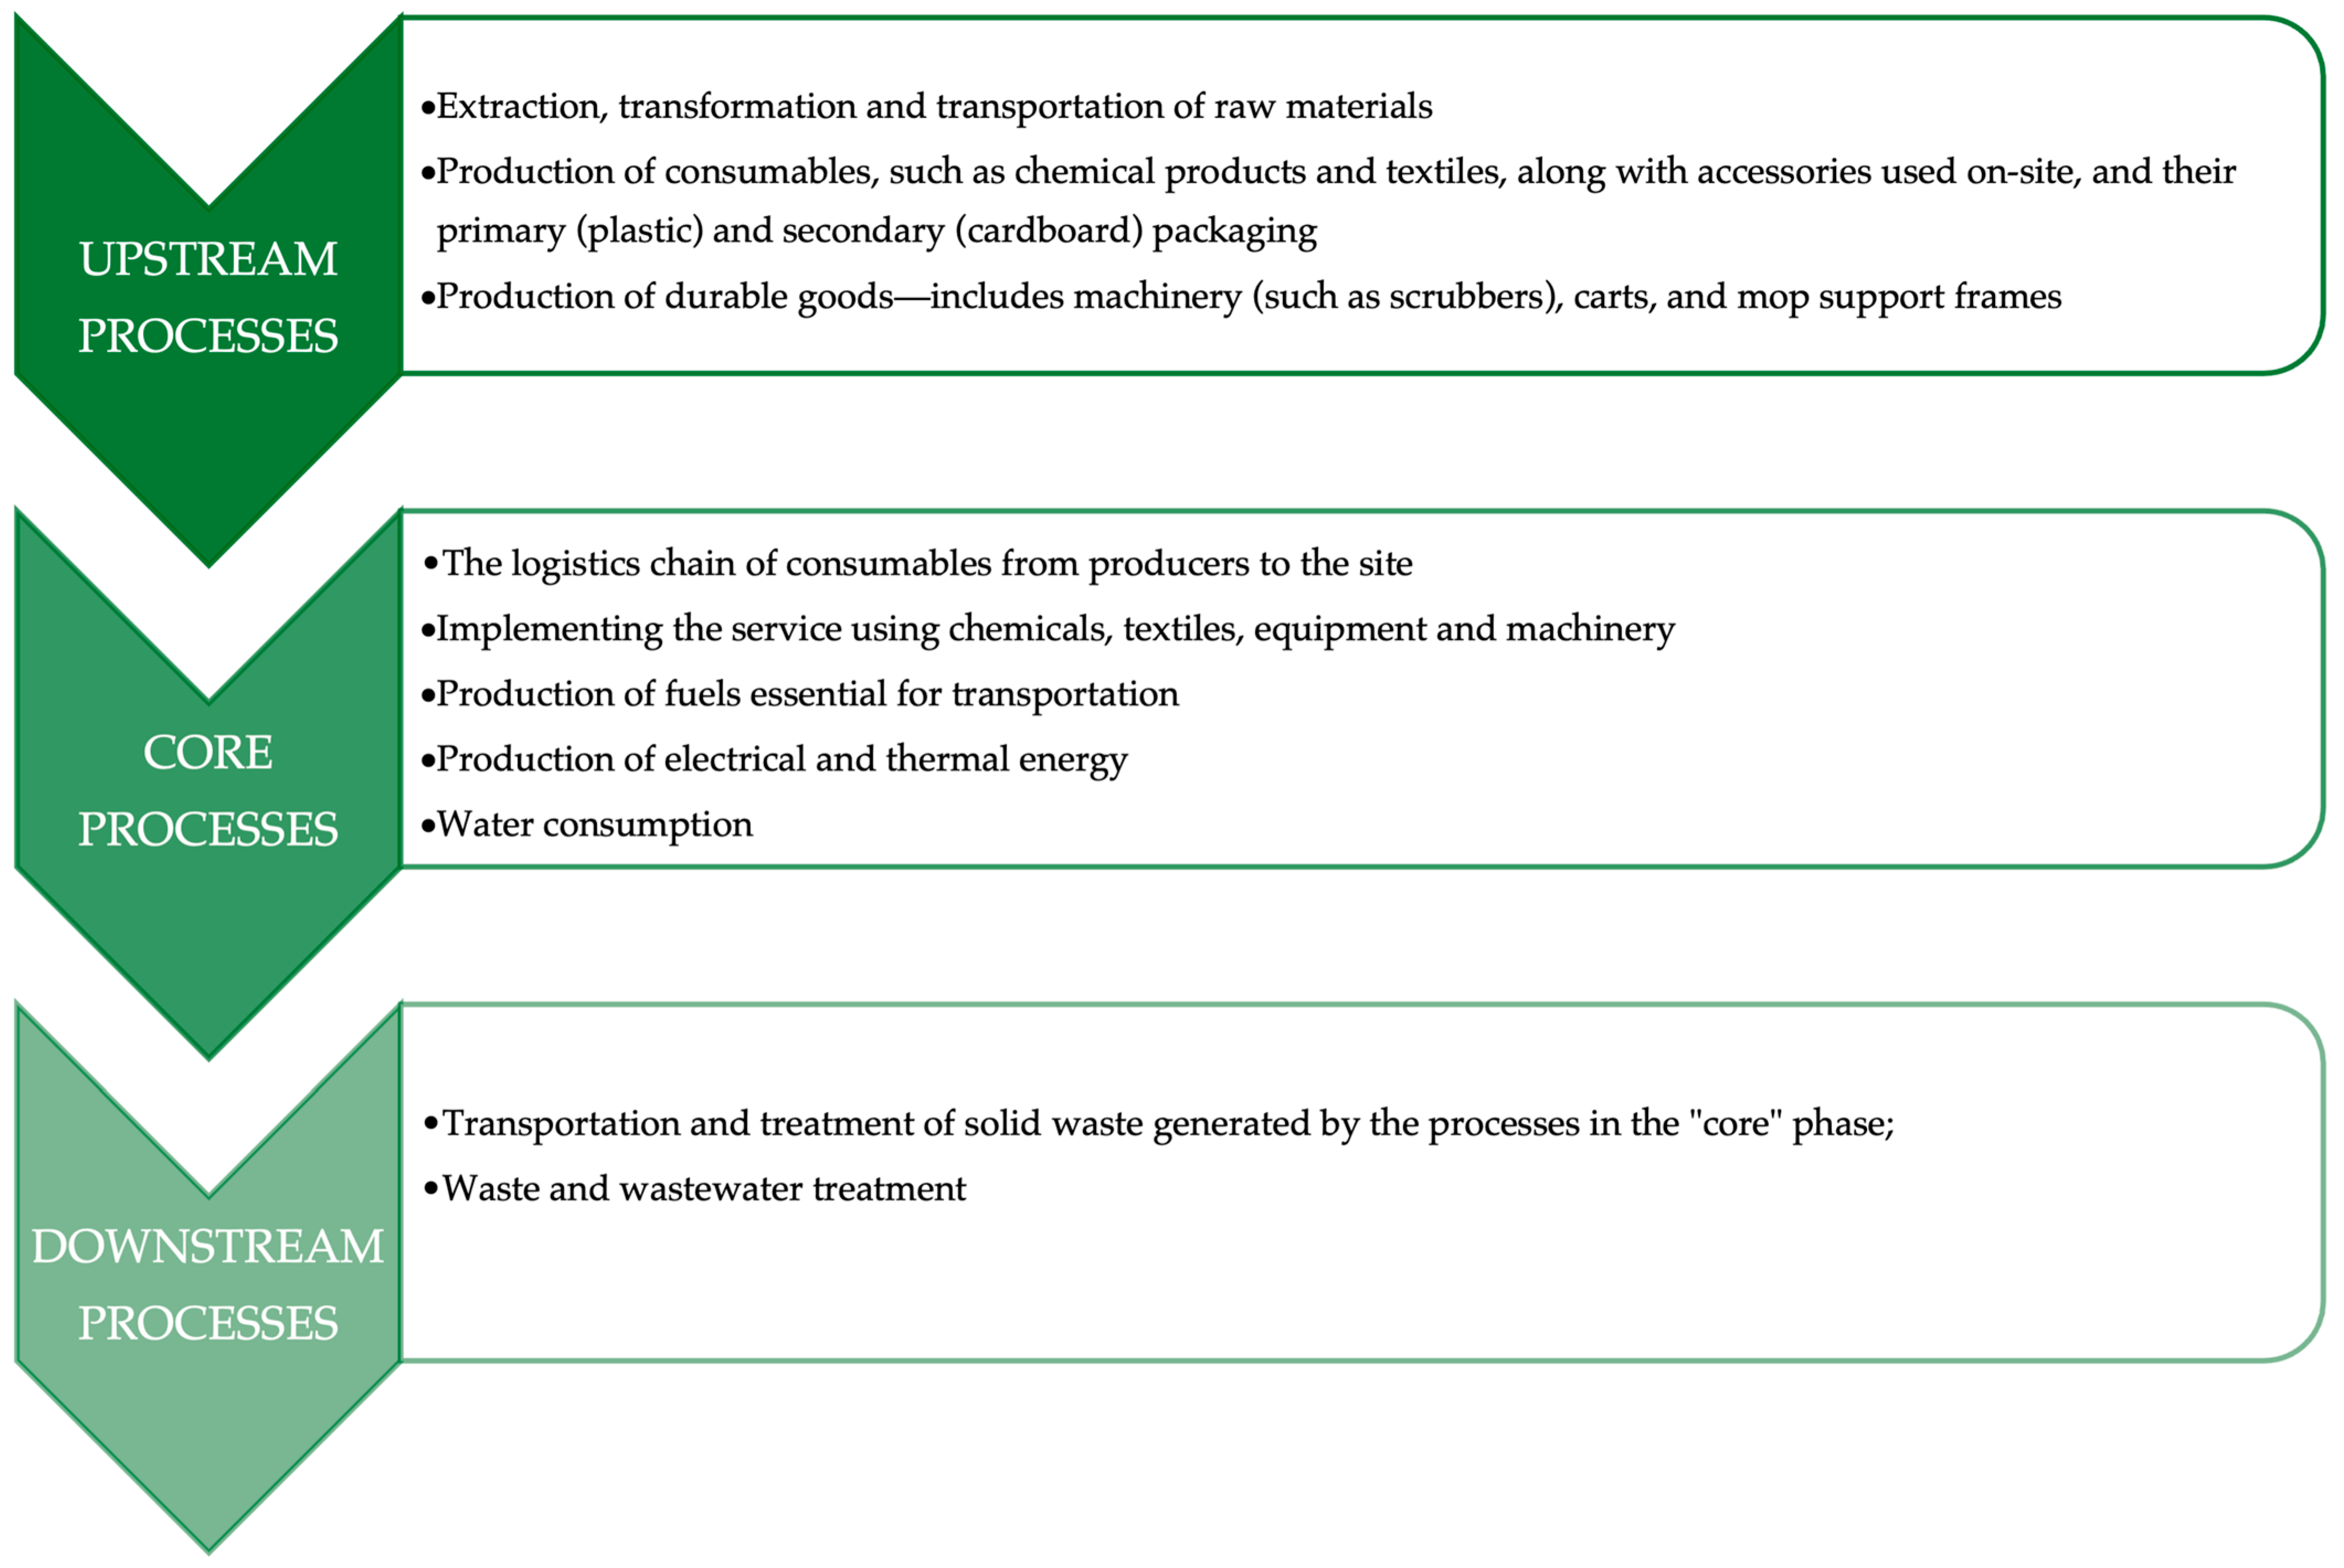
The system boundaries defined for this analysis were established according to a “cradle-to-grave” perspective, consistent with the guidelines provided in PCR 2011:03. As illustrated in Figure 4, the study encompasses all relevant life cycle stages, which are structured into three main categories: “upstream,” “core,” and “downstream,” as outlined in Section 4.3.1 of the reference PCR document. This segmentation allows for a clear attribution of environmental impacts to each stage of the cleaning service’s life cycle, from the extraction and production of raw materials to the final disposal of used resources and waste.

2.5.1. Upstream Phase

This phase encompasses all preliminary processes that occur prior to the core service delivery. Specifically, it includes the following:
  • The extraction and initial processing of raw materials;
  • The transportation of raw materials and semi-finished goods to manufacturing or supply facilities;
  • The production of consumable items—such as cleaning agents (detergents and disinfectants), textile components (e.g., mops, cloths), and ancillary tools—along with their primary (typically plastic) and secondary (e.g., cardboard) packaging;
  • The manufacture of durable equipment, defined as products with a service life exceeding three years. This category includes floor-cleaning machines (e.g., scrubbers), cleaning carts, and mop handle frames.
It is important to note that the production of dosing systems was excluded from the system boundary at this stage and throughout the entire life cycle analysis, in accordance with the cut-off criteria.

2.5.2. Core Phase

The core phase focuses on processes directly associated with the on-site execution of cleaning services. It includes the following:
  • The distribution and delivery of consumable products (e.g., detergents, textiles) from production facilities to the operational site;
  • The actual performance of cleaning activities, involving the use of chemical agents, textile materials, equipment, and mechanized tools;
  • The generation of fuels required for transport related to service implementation;
  • The provision and consumption of electrical and thermal energy on site, necessary for powering cleaning machinery and equipment;
  • The use of water, both for diluting cleaning chemicals and for laundering cleaning textiles.
The movement of personnel and technical staff is not considered in this phase, as it remains unchanged between the two protocols being compared. Likewise, the transport of durable assets—defined as items with a lifespan exceeding three years—is excluded, in alignment with Section 4.3.1.2 of the PCR. Such transport events are limited to initial deployment or exceptional maintenance and do not represent routine service activities.

2.5.3. Downstream Phase

The downstream phase accounts for all end-of-life processes resulting from service operations. Specifically, it includes the following:
  • The collection, transportation, and disposal of solid waste produced during cleaning activities performed in the core phase;
  • The management and treatment of wastewater, originating from operations such as textile laundering and chemical product dilution.
These processes represent the final environmental outputs associated with the system under study, completing the cradle-to-grave assessment framework.

2.6. Methodological Assumptions of the Comparative Study

The comparative evaluation of the two cleaning protocols was conducted following the methodological principles outlined in ISO 14026, ensuring consistency and scientific rigor throughout the life cycle analysis [24]. Both systems were assessed using the same functional unit and under comparable spatial and operational conditions. The areas included in the analysis were identical in environmental features, intended use, level, and type of soiling, furniture occupancy, and flooring types. Cleaning interventions were matched in type and frequency, and the criteria for including input and output flows remained consistent across both protocols. Data quality standards, inventory units, and calculation procedures were harmonized, as were the allocation methods and the chosen impact categories.
Environmental impact was evaluated solely in terms of Global Warming Potential (GWP), using a 100-year time horizon (GWP100), in accordance with the latest recommendations from the Intergovernmental Panel on Climate Change (IPCC). The characterization factors applied were sourced from the Sixth IPCC Assessment Report (AR6), focusing on the contribution of key greenhouse gases—namely carbon dioxide (CO2), methane (CH4), nitrous oxide (N2O), sulfur hexafluoride (SF6), hydrofluorocarbons (HFCs), and perfluorocarbons (PFCs). Each emission was converted into a standard unit (kg CO2 equivalent) using substance-specific characterization factors that account for the radiative forcing effect and the typical atmospheric lifetime of each gas. Carbon dioxide served as the reference substance, with a GWP of 1. The total climate impact of each system was obtained by summing the converted contributions of all relevant substances, thus representing the overall footprint in terms of kilograms of CO2 equivalents.

2.7. Statistical Analysis

All microbiological data were analyzed using GraphPad Prism v10. Normality of distribution was assessed using the Shapiro–Wilk test. Depending on data characteristics, comparisons were made using unpaired Student’s t-tests or one-way ANOVA with Tukey’s post hoc test. Statistical significance was set at p < 0.05.
Differences between the green and traditional protocols were not statistically significant (p > 0.05), although TG consistently showed lower mean CFU values.

3. Results

The microbiological environmental sampling project was conducted at ASL ROMA 1, specifically at Presidio Sanitario Distretto 3, “Monte Rocchetta”, and “Presidio Nuovo Regina Margherita”. The study compared the effectiveness of traditional cleaning protocols with a new “green” cleaning protocol.
The results of the microbiological tests involved sampling in environments previously used by staff and facility users, as well as after the application of traditional and green cleaning treatments.
The results obtained from the “green” protocol revealed promising preliminary data. In nearly all samples, an improvement was noted compared to traditional sanitation results. However, the differences between the treatments were not statistically significant.
According to CAM requirements, the “green” protocol must yield results equal to or better than those of the traditional protocol. The analyses have shown that the experimental “green” system consistently meets this criterion and exhibits better antimicrobial activity than the “traditional” system.
The isolated microorganisms included several bacterial and fungal species. Among the bacteria, the following were identified: Alicyclobacillus spp., Dyadobacter spp., Enterococcus gallinarum, Enterococcus hirae, Lactobacillus spp., Raoultella spp., Sphingomonas spp., and various Staphylococcus species (S. aureus, S. auricularis, S. capitis, S. epidermidis, S. lentus, S. saprophyticus, S. sciuri, and S. xylosus). The fungal isolates included Candida albicans, Candida dattila, Candida famata, and Trichosporon spp. (two phenotypic variants).

3.1. Regina Margherita Microbiological Assessment

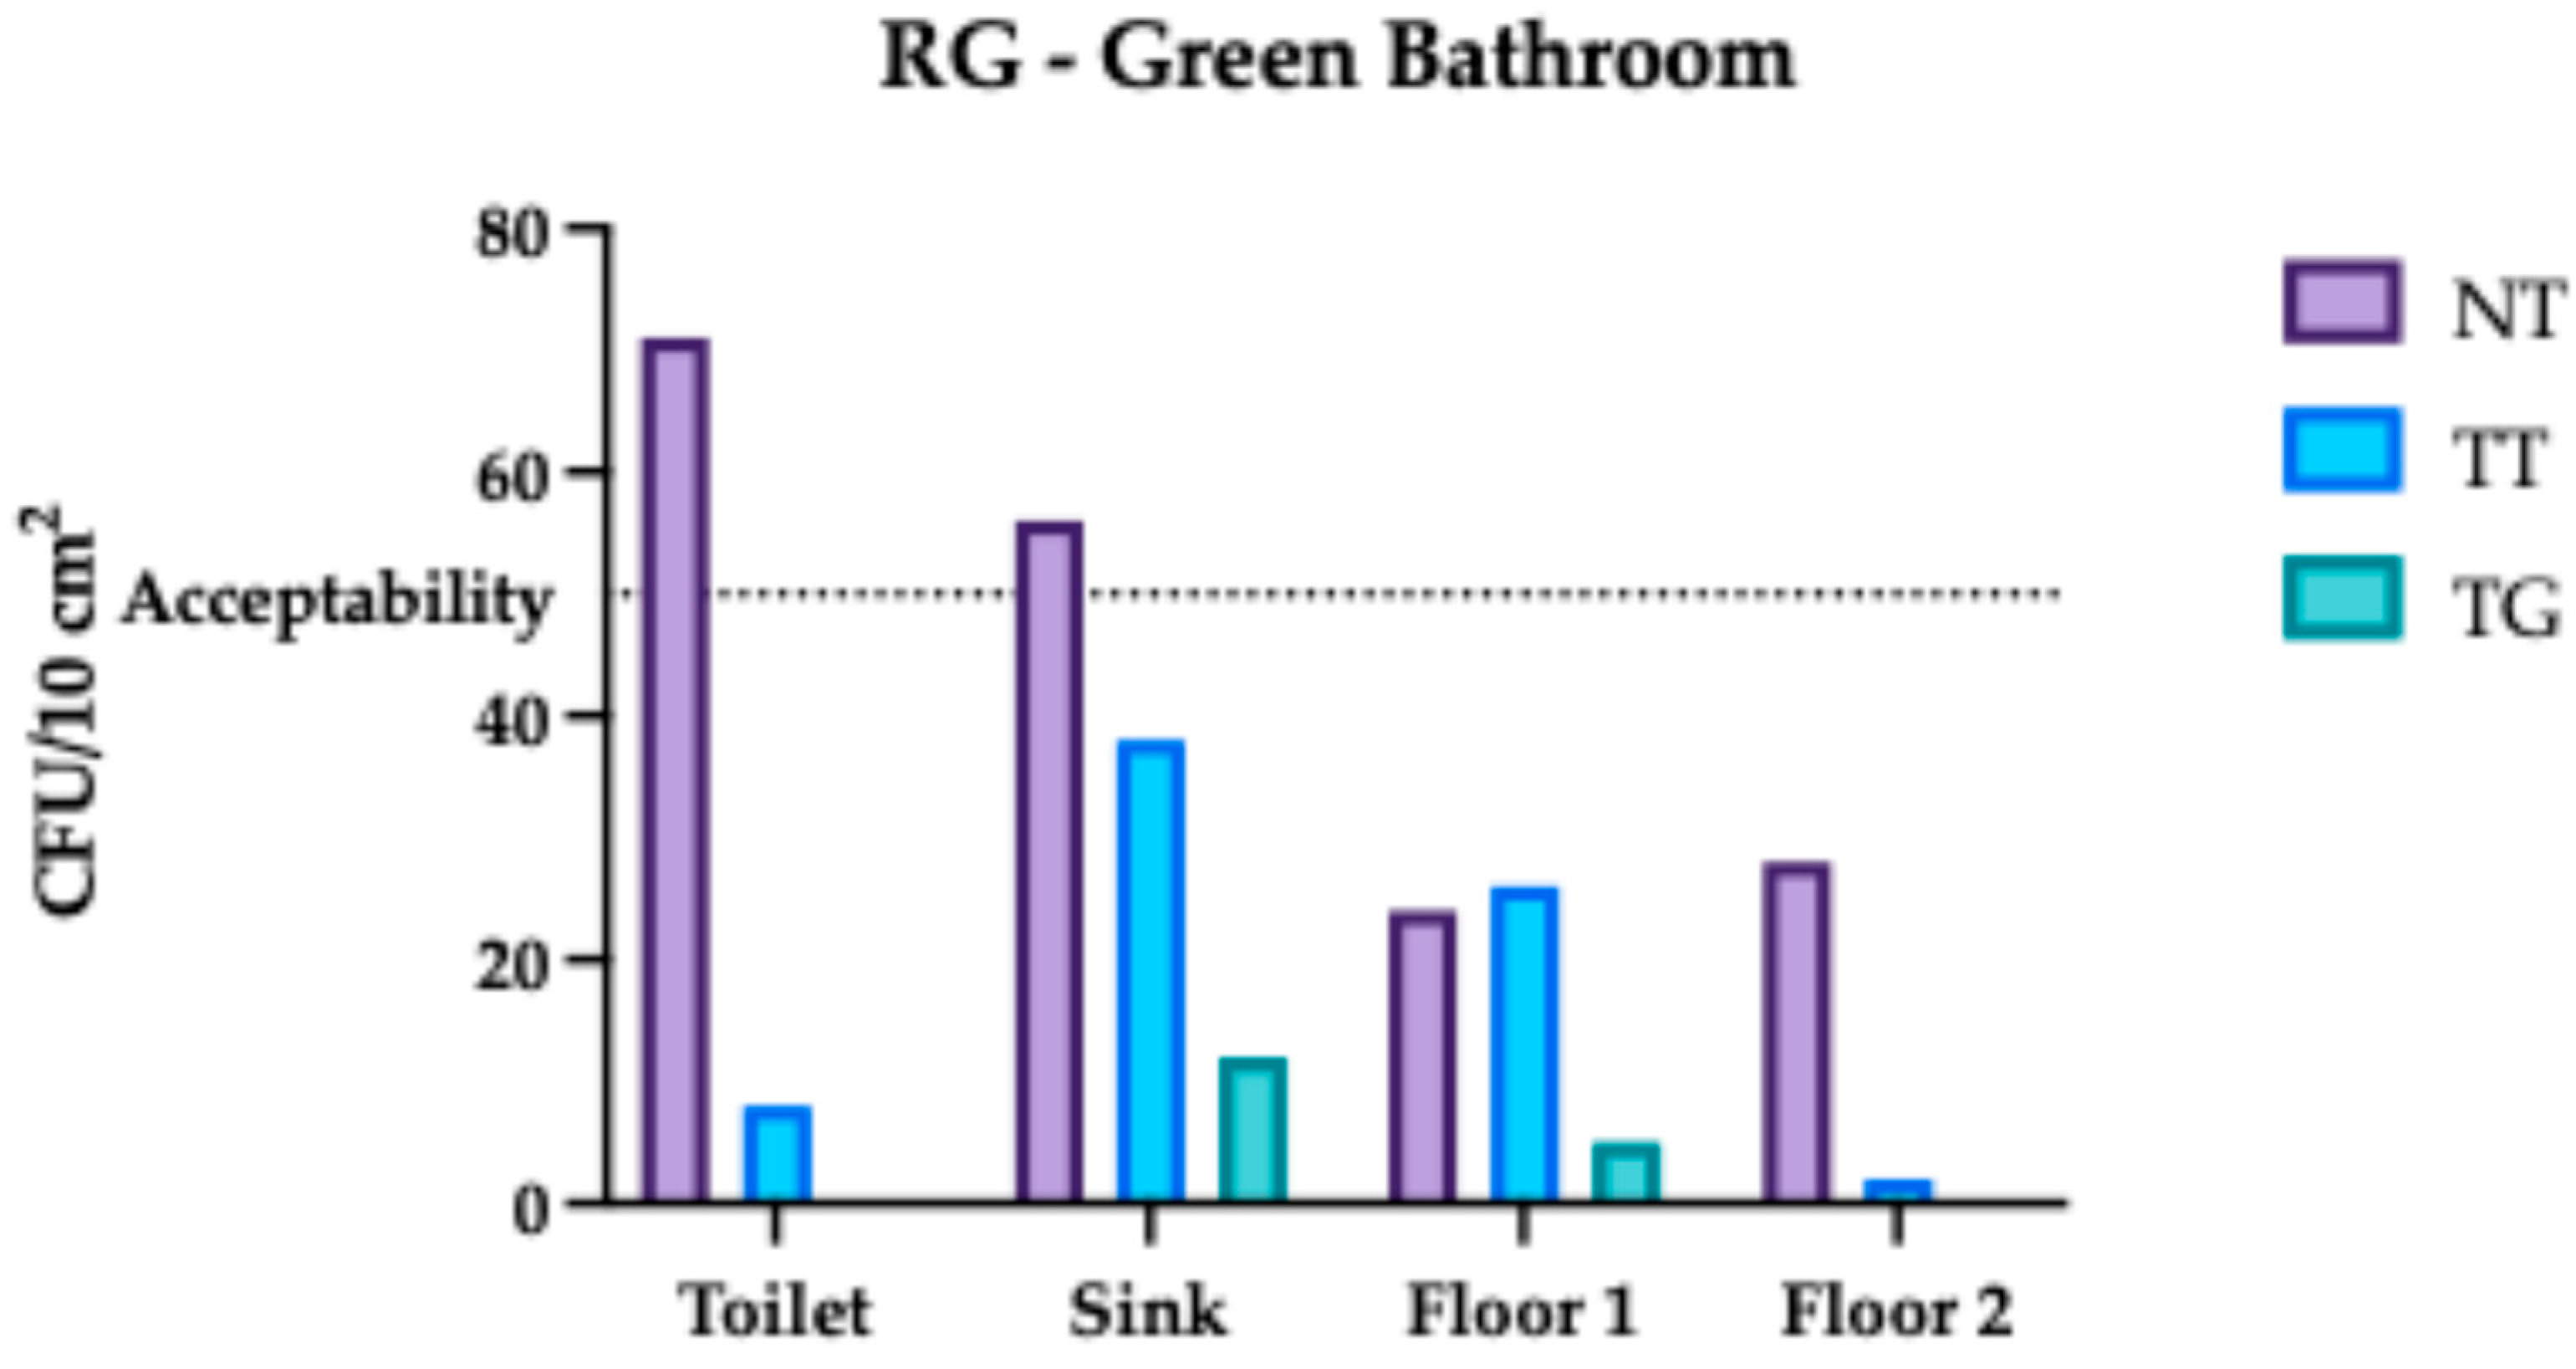
The findings from the study conducted at Regina Margherita Hospital indicate that all the spaces and surfaces examined were cleaned to an “acceptable” standard following the cleaning process. This implies that the bacterial presence was reduced to a level considered safe and acceptable, specifically for green areas, where the benchmark for cleanliness is 5 colony-forming units (CFU) per square centimetre.
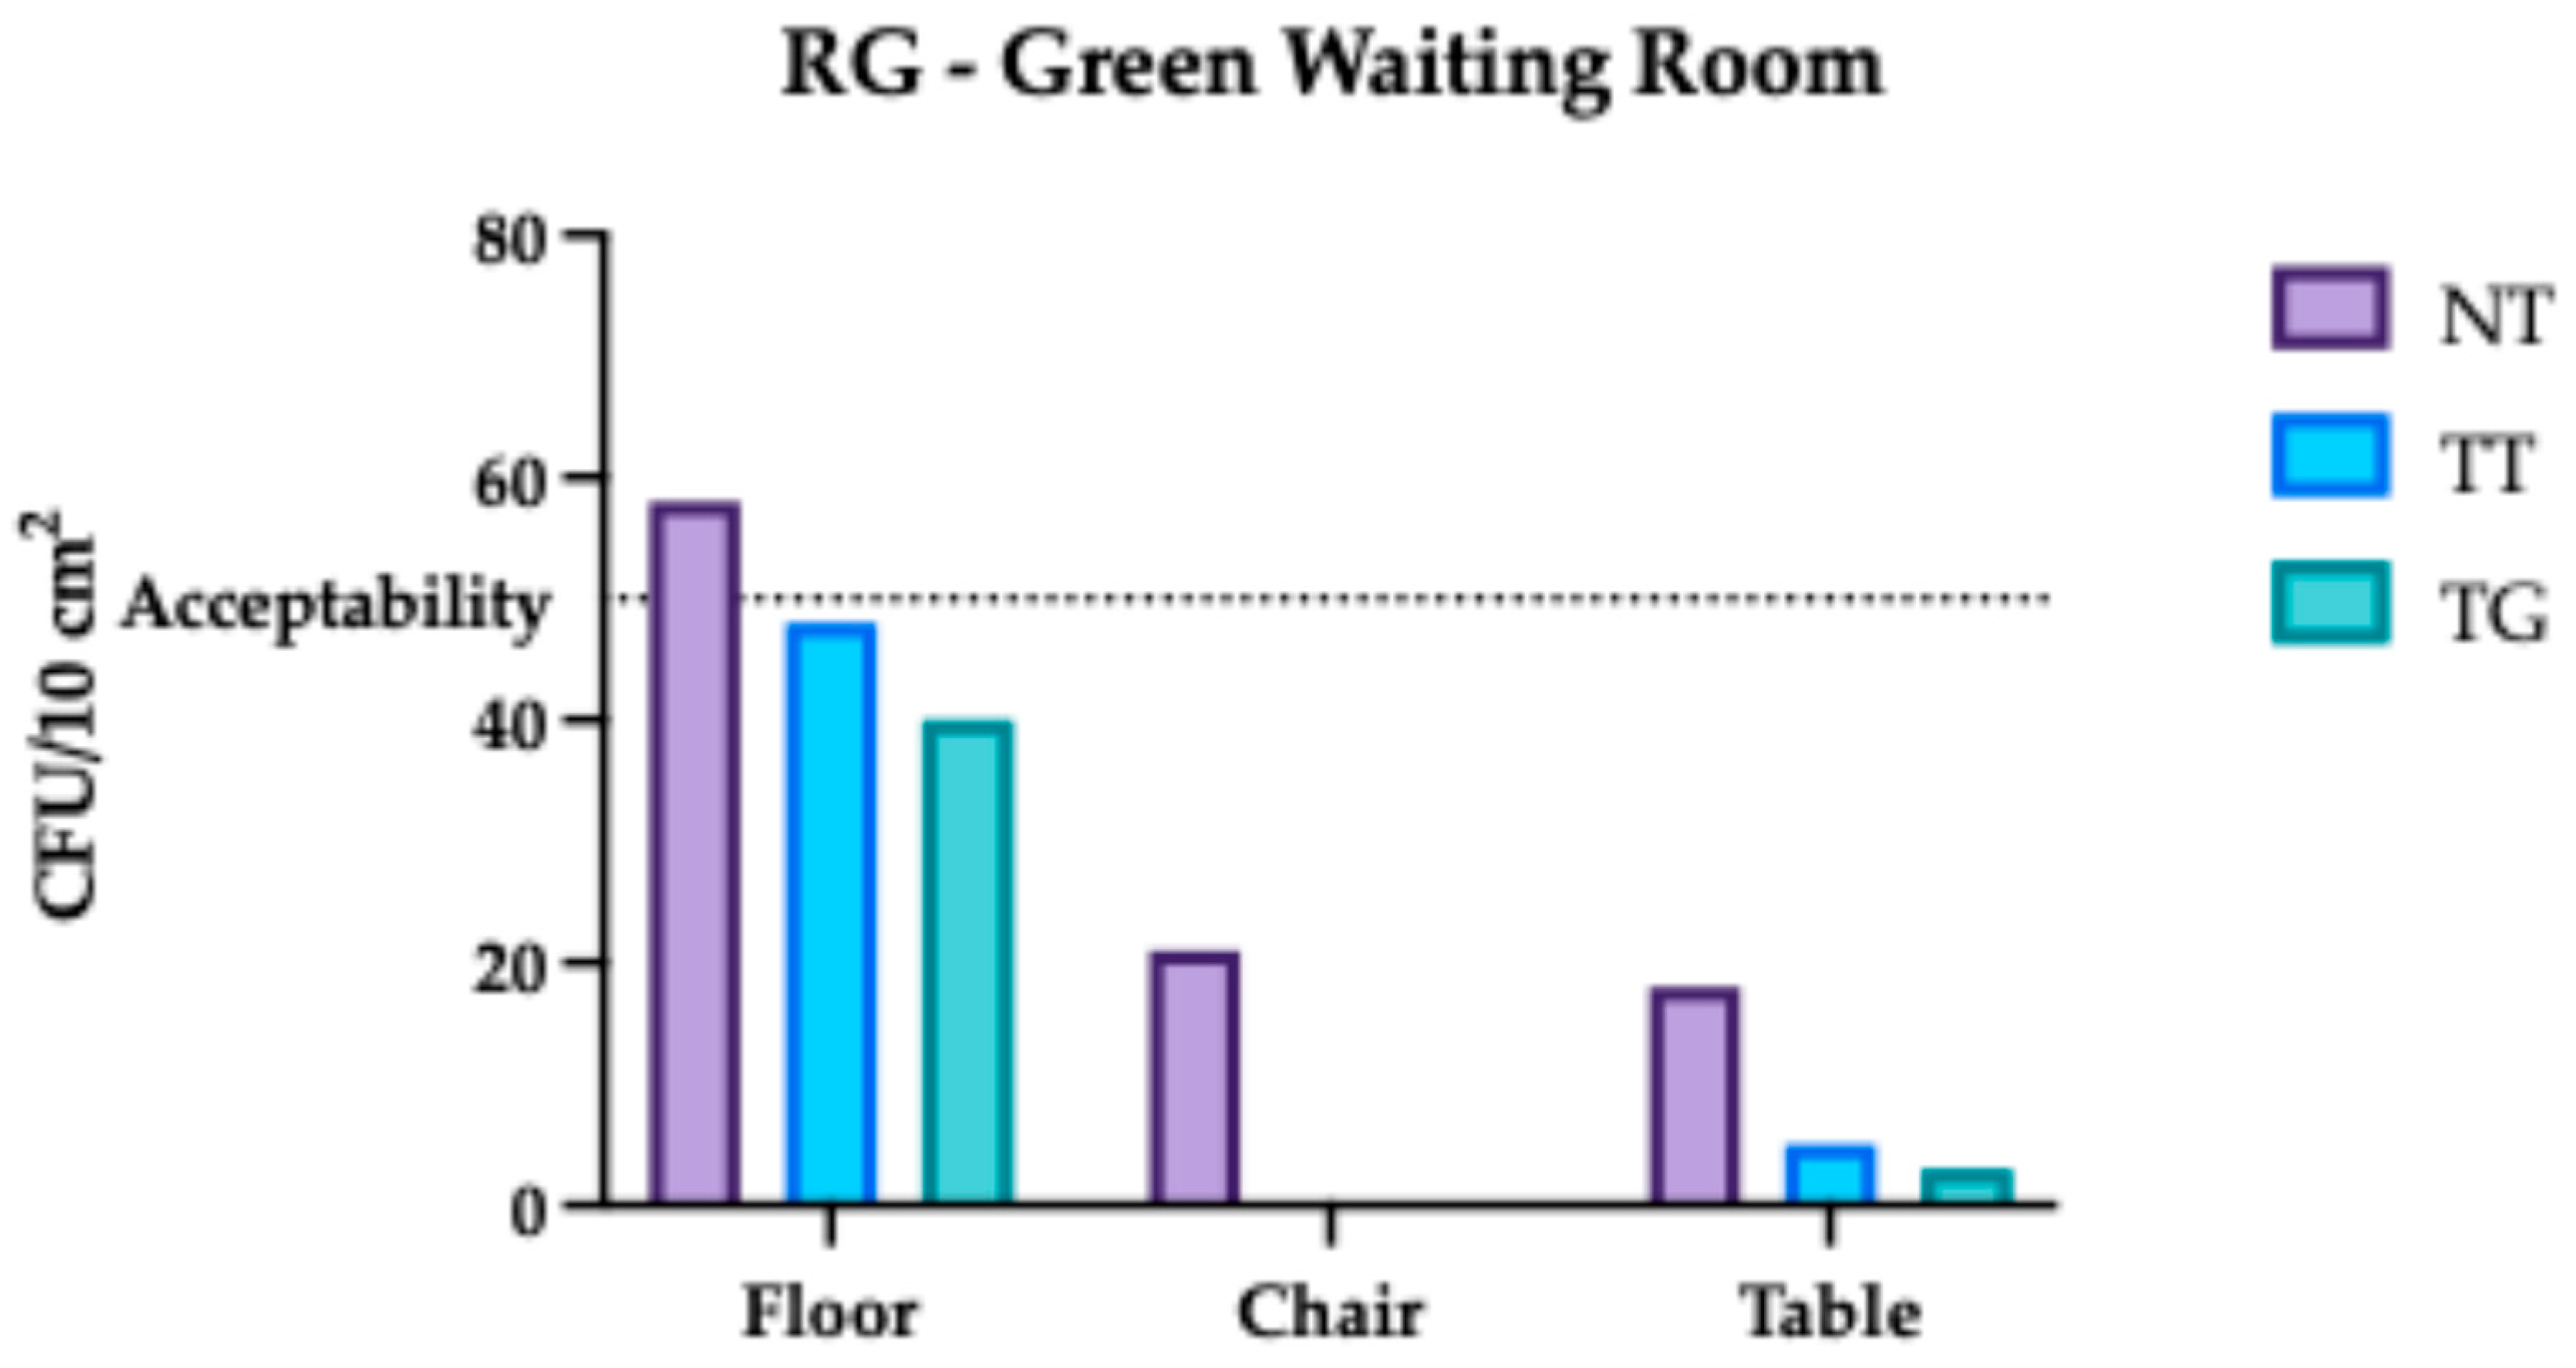
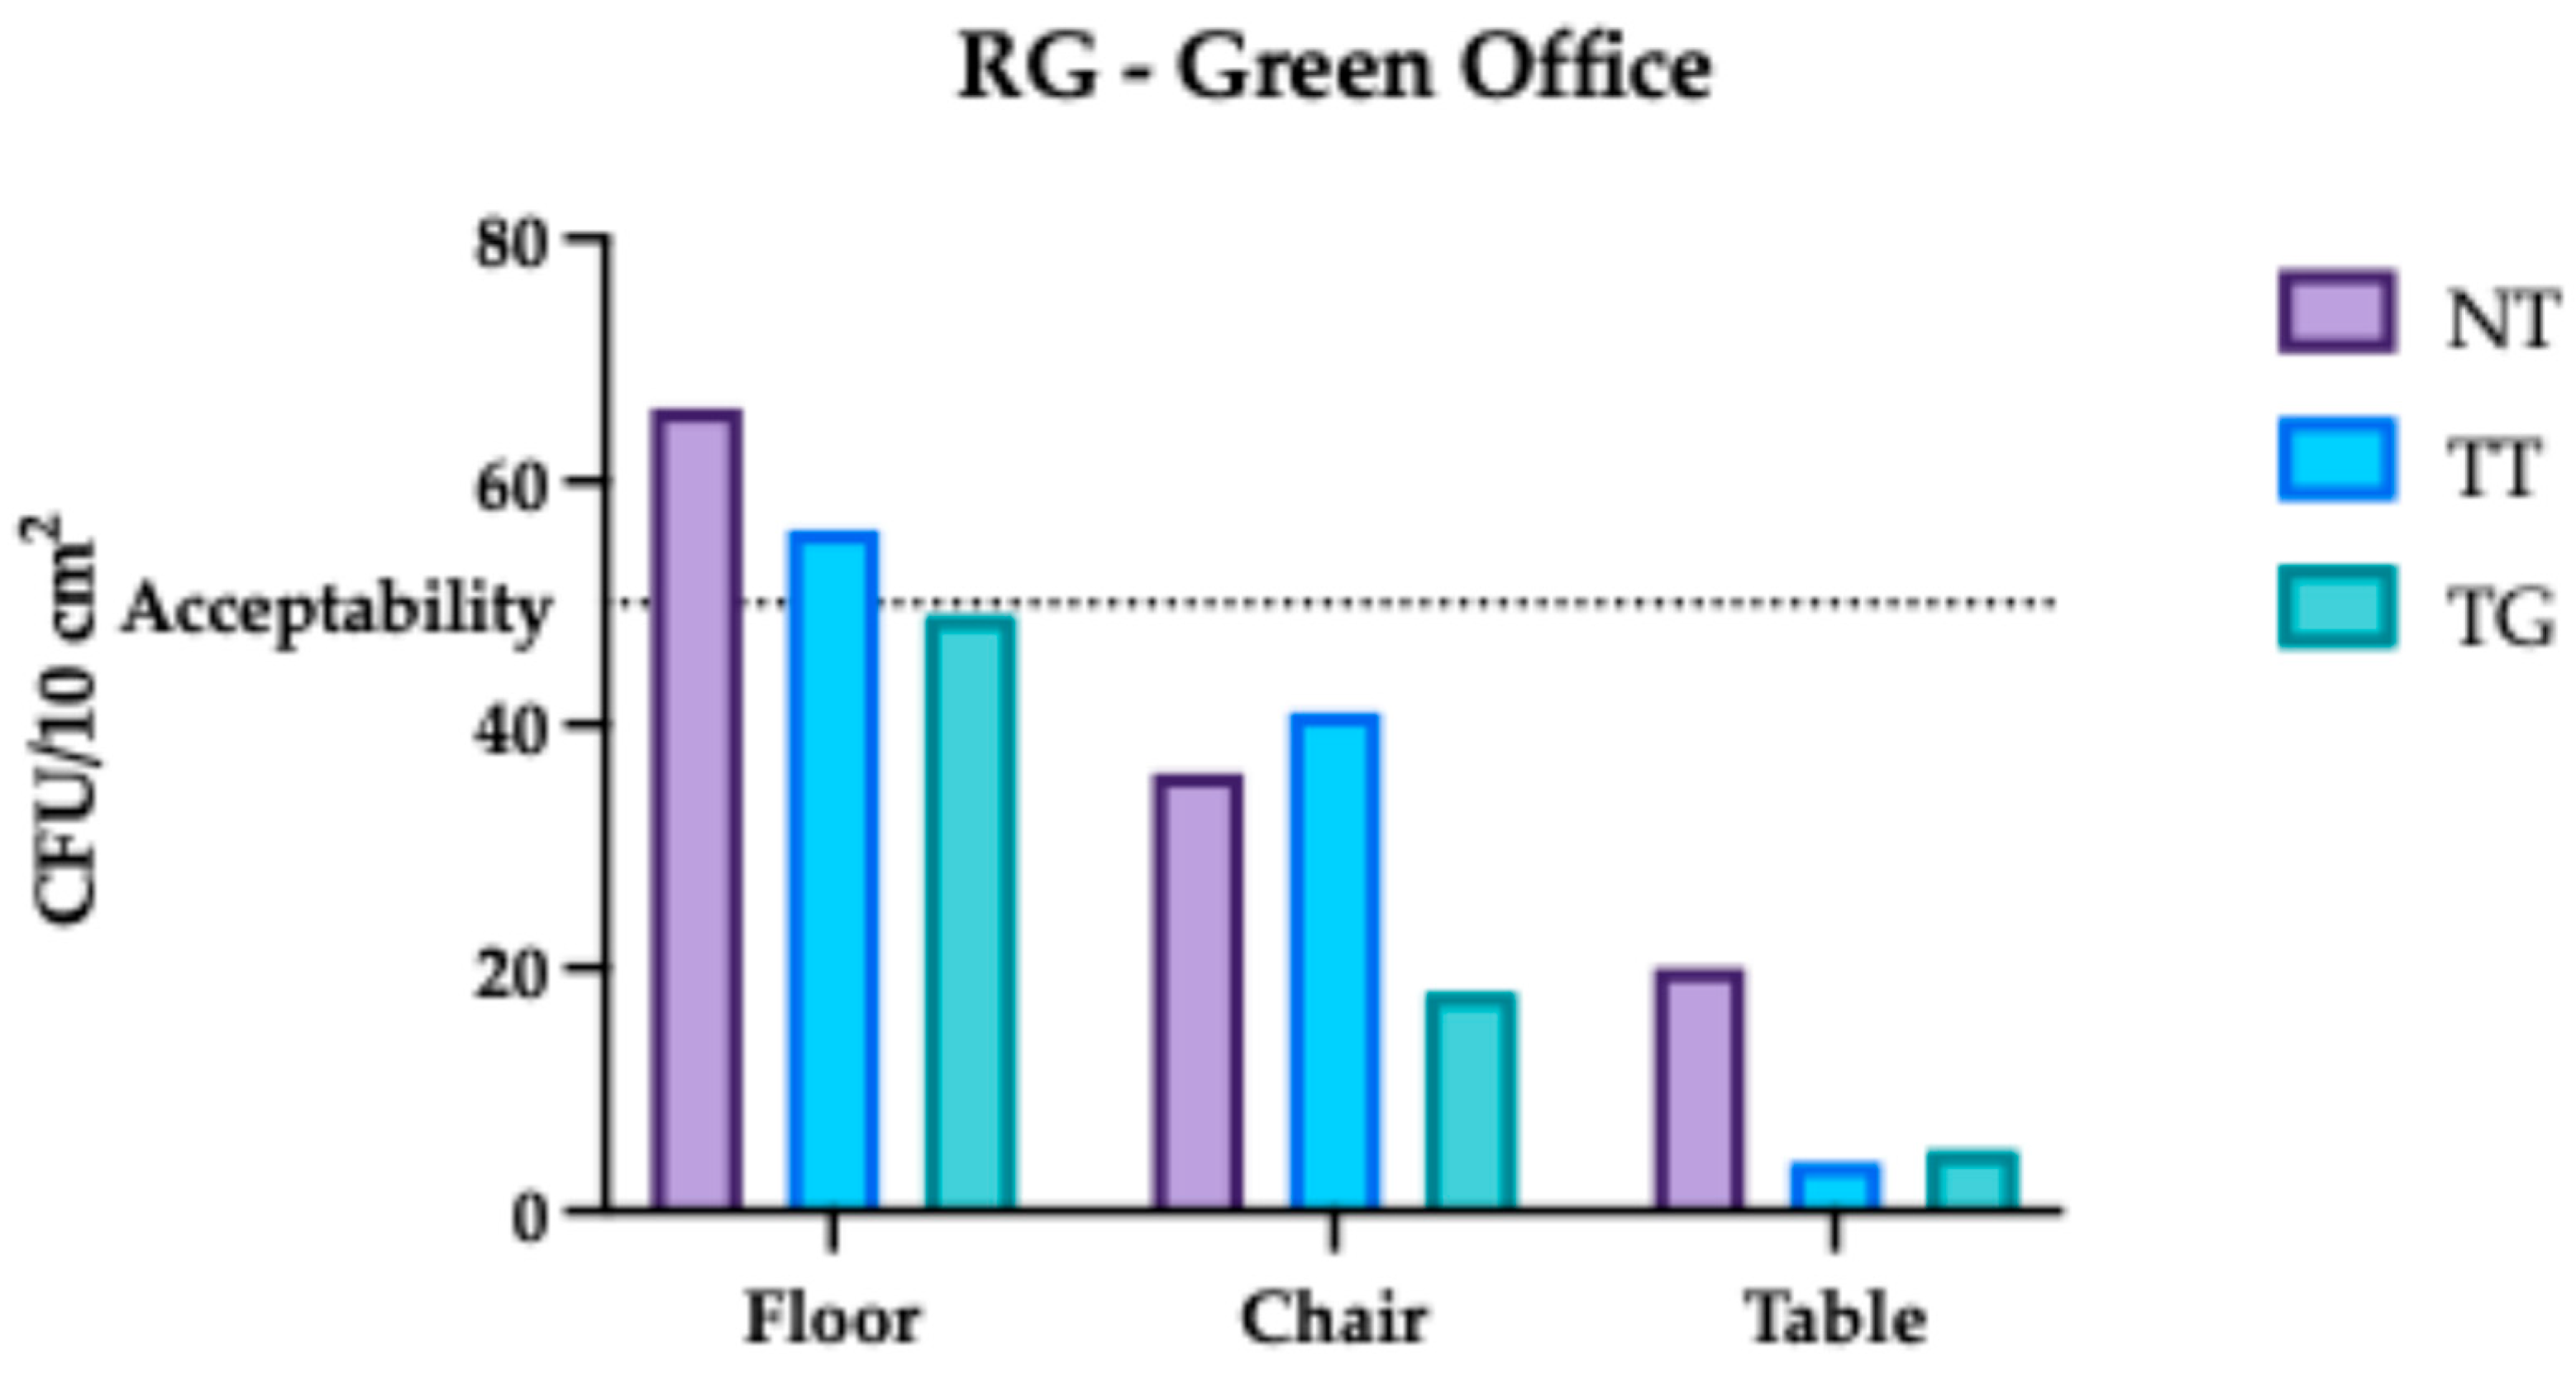
It is noteworthy that the eco-friendly or “green” cleaning protocol demonstrated superior effectiveness in minimizing microbial contamination on hospital surfaces (Figure 5, Figure 6 and Figure 7). This suggests that the green cleaning method aligns with environmental sustainability goals and ensures a higher standard of cleanliness and safety in healthcare settings. The study underscores the potential of green cleaning protocols to enhance hospital hygiene practices, thereby contributing to improved patient safety and health outcomes.
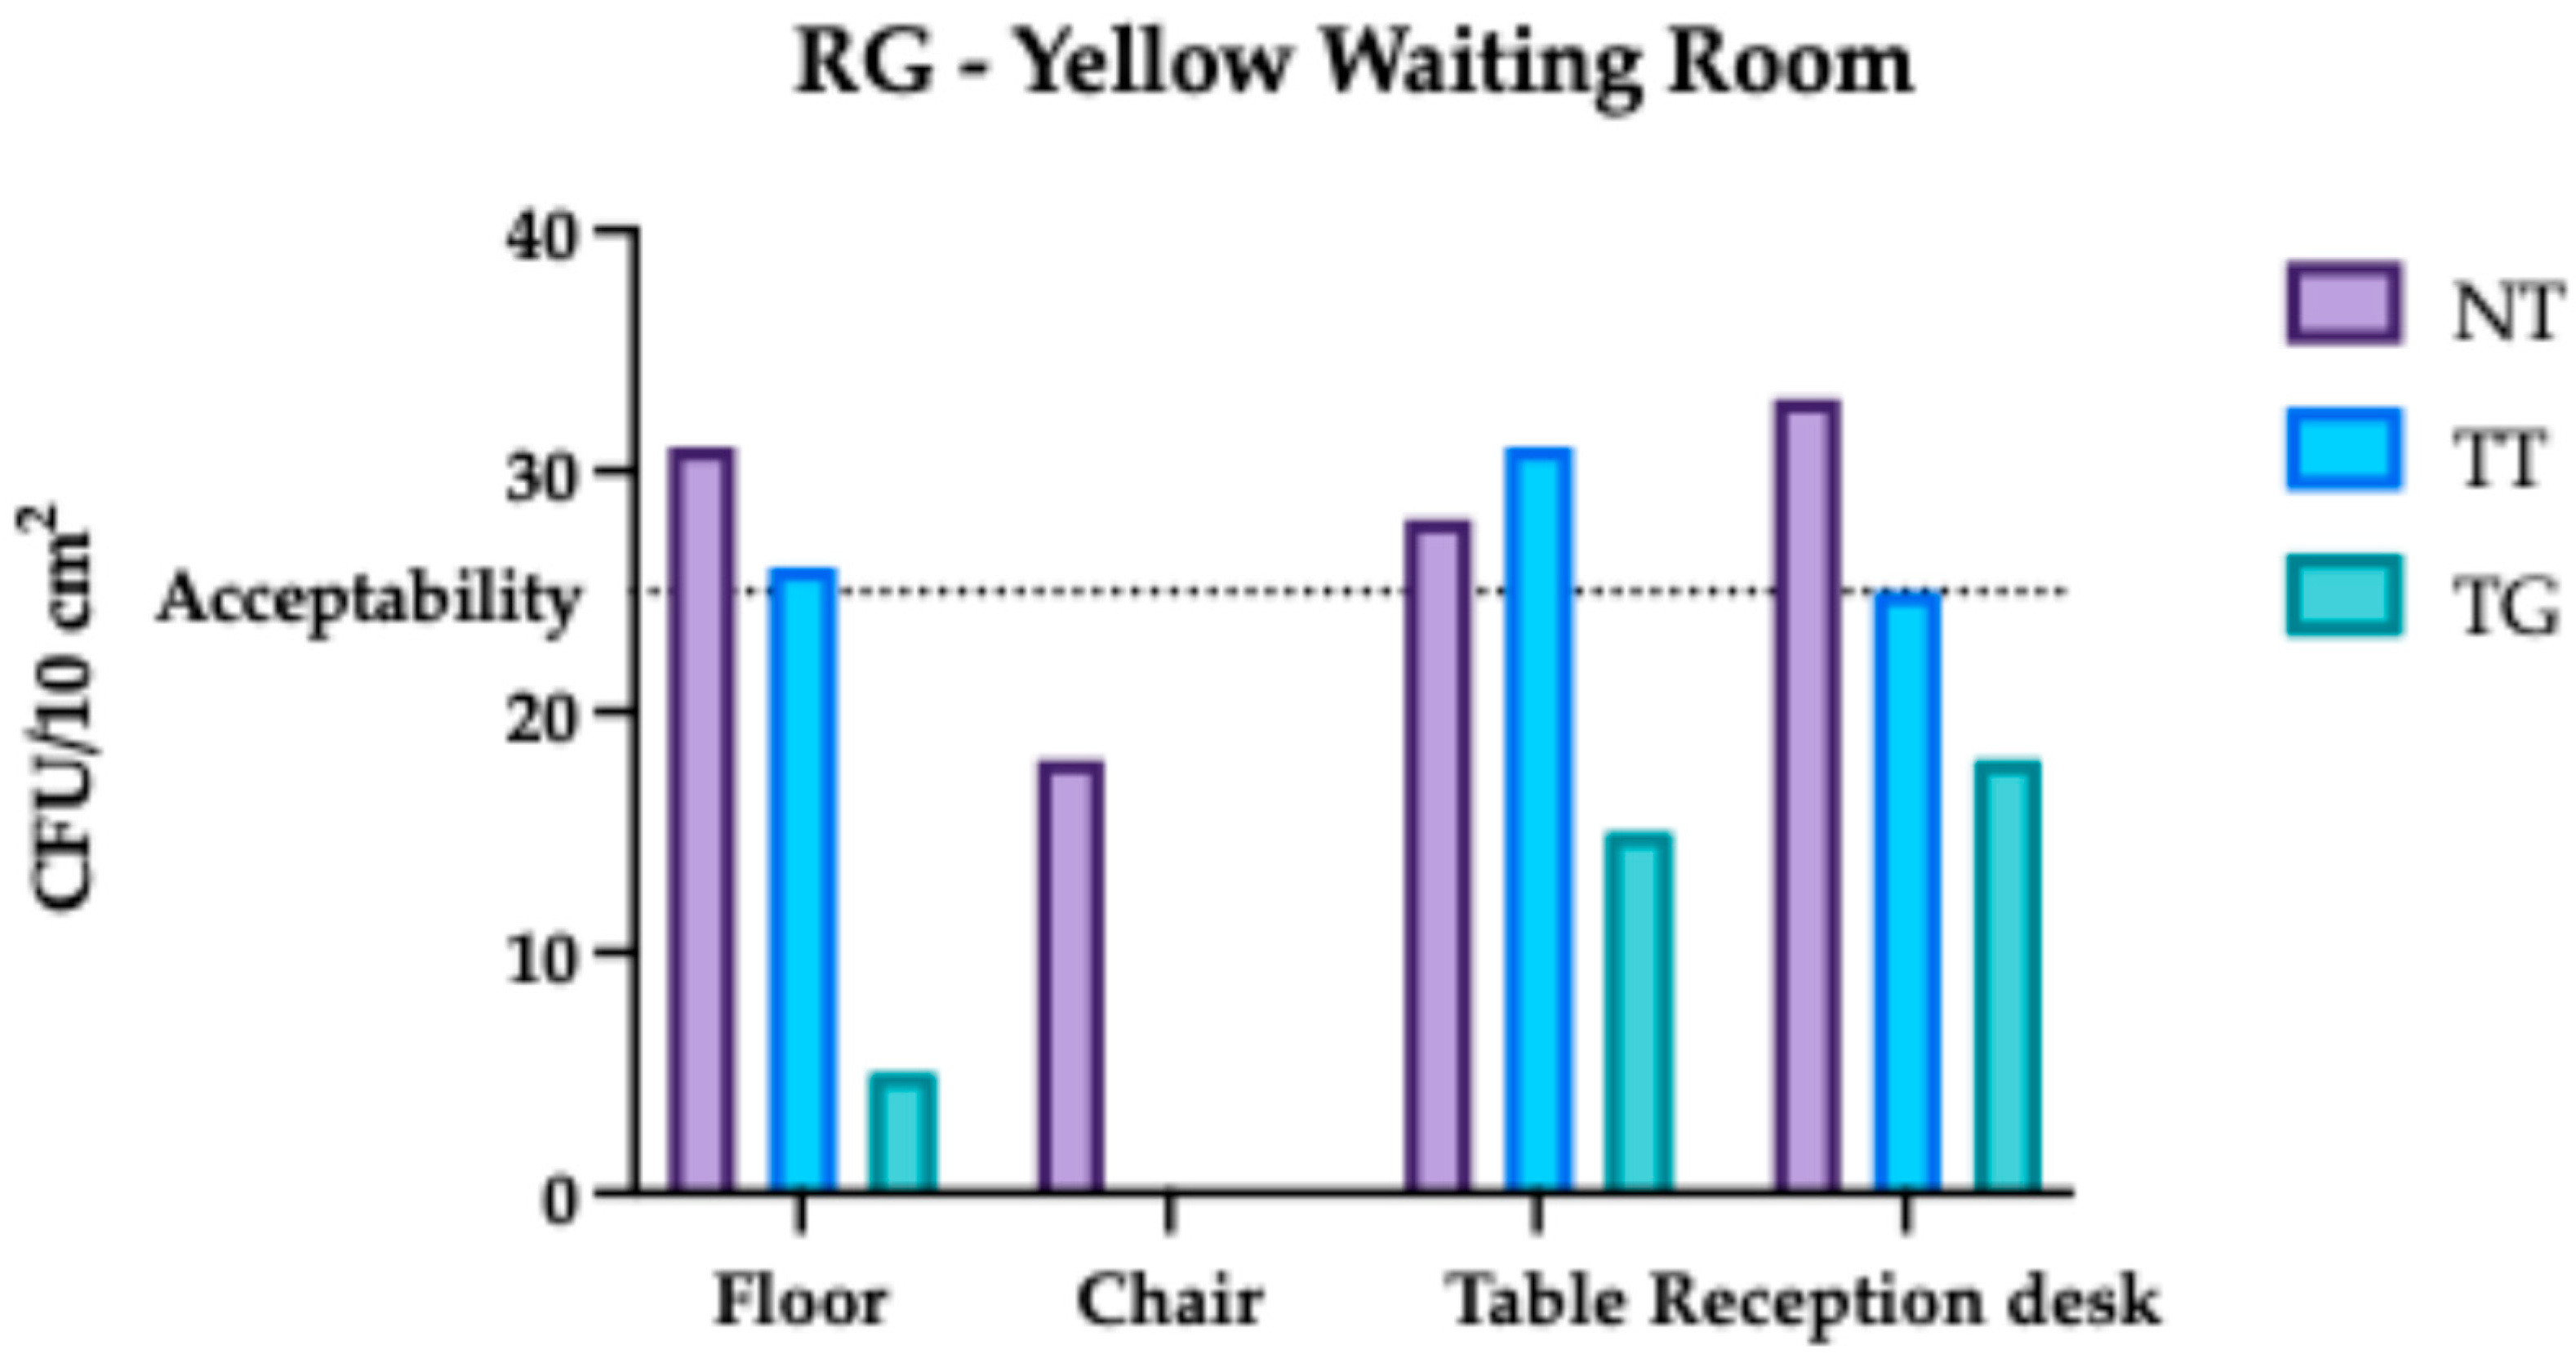
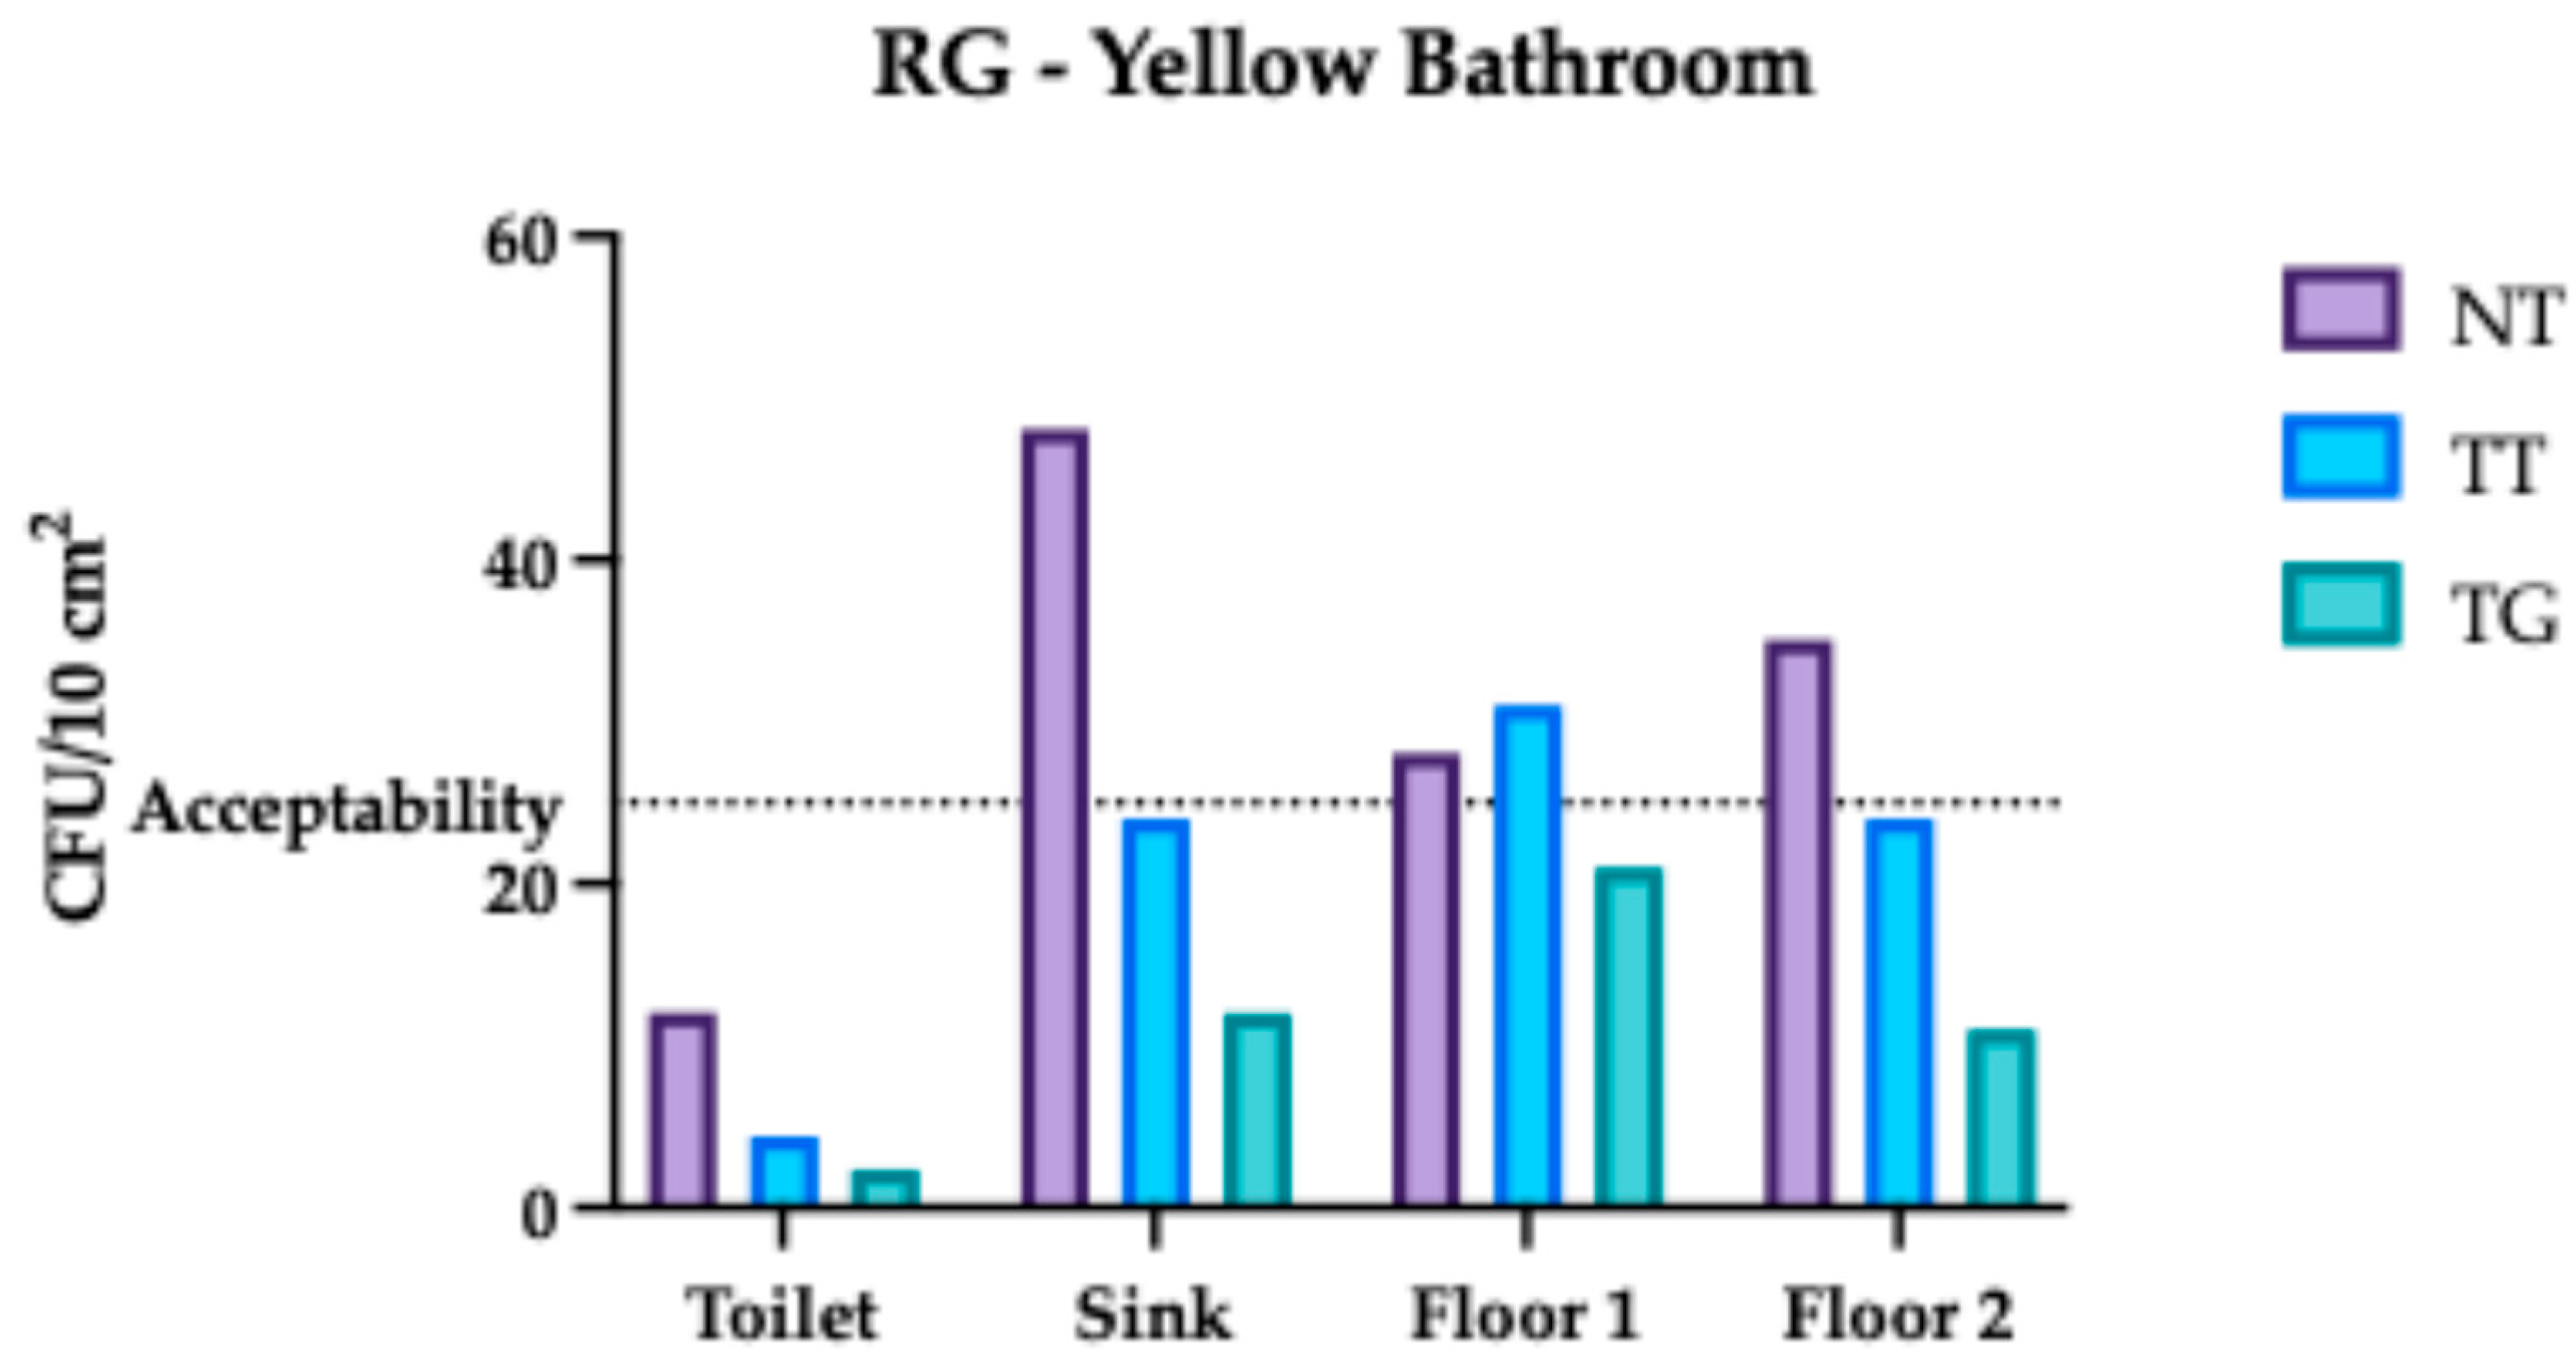
Comparable results were also observed in the yellow areas of the hospital. In these areas, the acceptable limit for bacterial contamination is set at a stricter level of 2.5 colony-forming units (CFU) per square centimeter. This means that the cleaning protocols, whether traditional or green, were expected to reduce the bacterial presence to this lower threshold (Figure 8, Figure 9 and Figure 10).
The study found that, like the green areas, the yellow areas also met the acceptable cleanliness standard after the cleaning process. This demonstrates the effectiveness of the cleaning protocols in maintaining hygiene across different areas of the hospital, even those with more stringent cleanliness benchmarks.
In the orange area of the hospital, the acceptable limit for bacterial contamination is also set at 2.5 colony-forming units (CFU) per square centimeter, similar to the yellow areas. However, there is an additional criterion for this ward: certain indicator microorganisms, such as Staphylococcus aureus, Pseudomonas aeruginosa, and Escherichia coli, must not be present at all. The study found that both the traditional and green cleaning protocols successfully reduced the overall bacterial presence to within the acceptable limit (Figure 11 and Figure 12). More importantly, these cleaning methods effectively eliminated the presence of indicator microorganisms on the surfaces in the orange ward. This is a significant finding, as these microorganisms are known to cause various infections and their absence is crucial for maintaining a safe and healthy hospital environment.
It is essential to note that our results reveal values that exceed the contamination limit in certain areas. Fortunately, these excesses of microorganisms were observed only with the traditional cleaning treatment and not with the green one. This suggests that the green, or eco-friendly, cleaning method may be more effective in keeping microbial contamination levels within acceptable limits.

3.2. Monte Rocchetta Microbiological Assessment

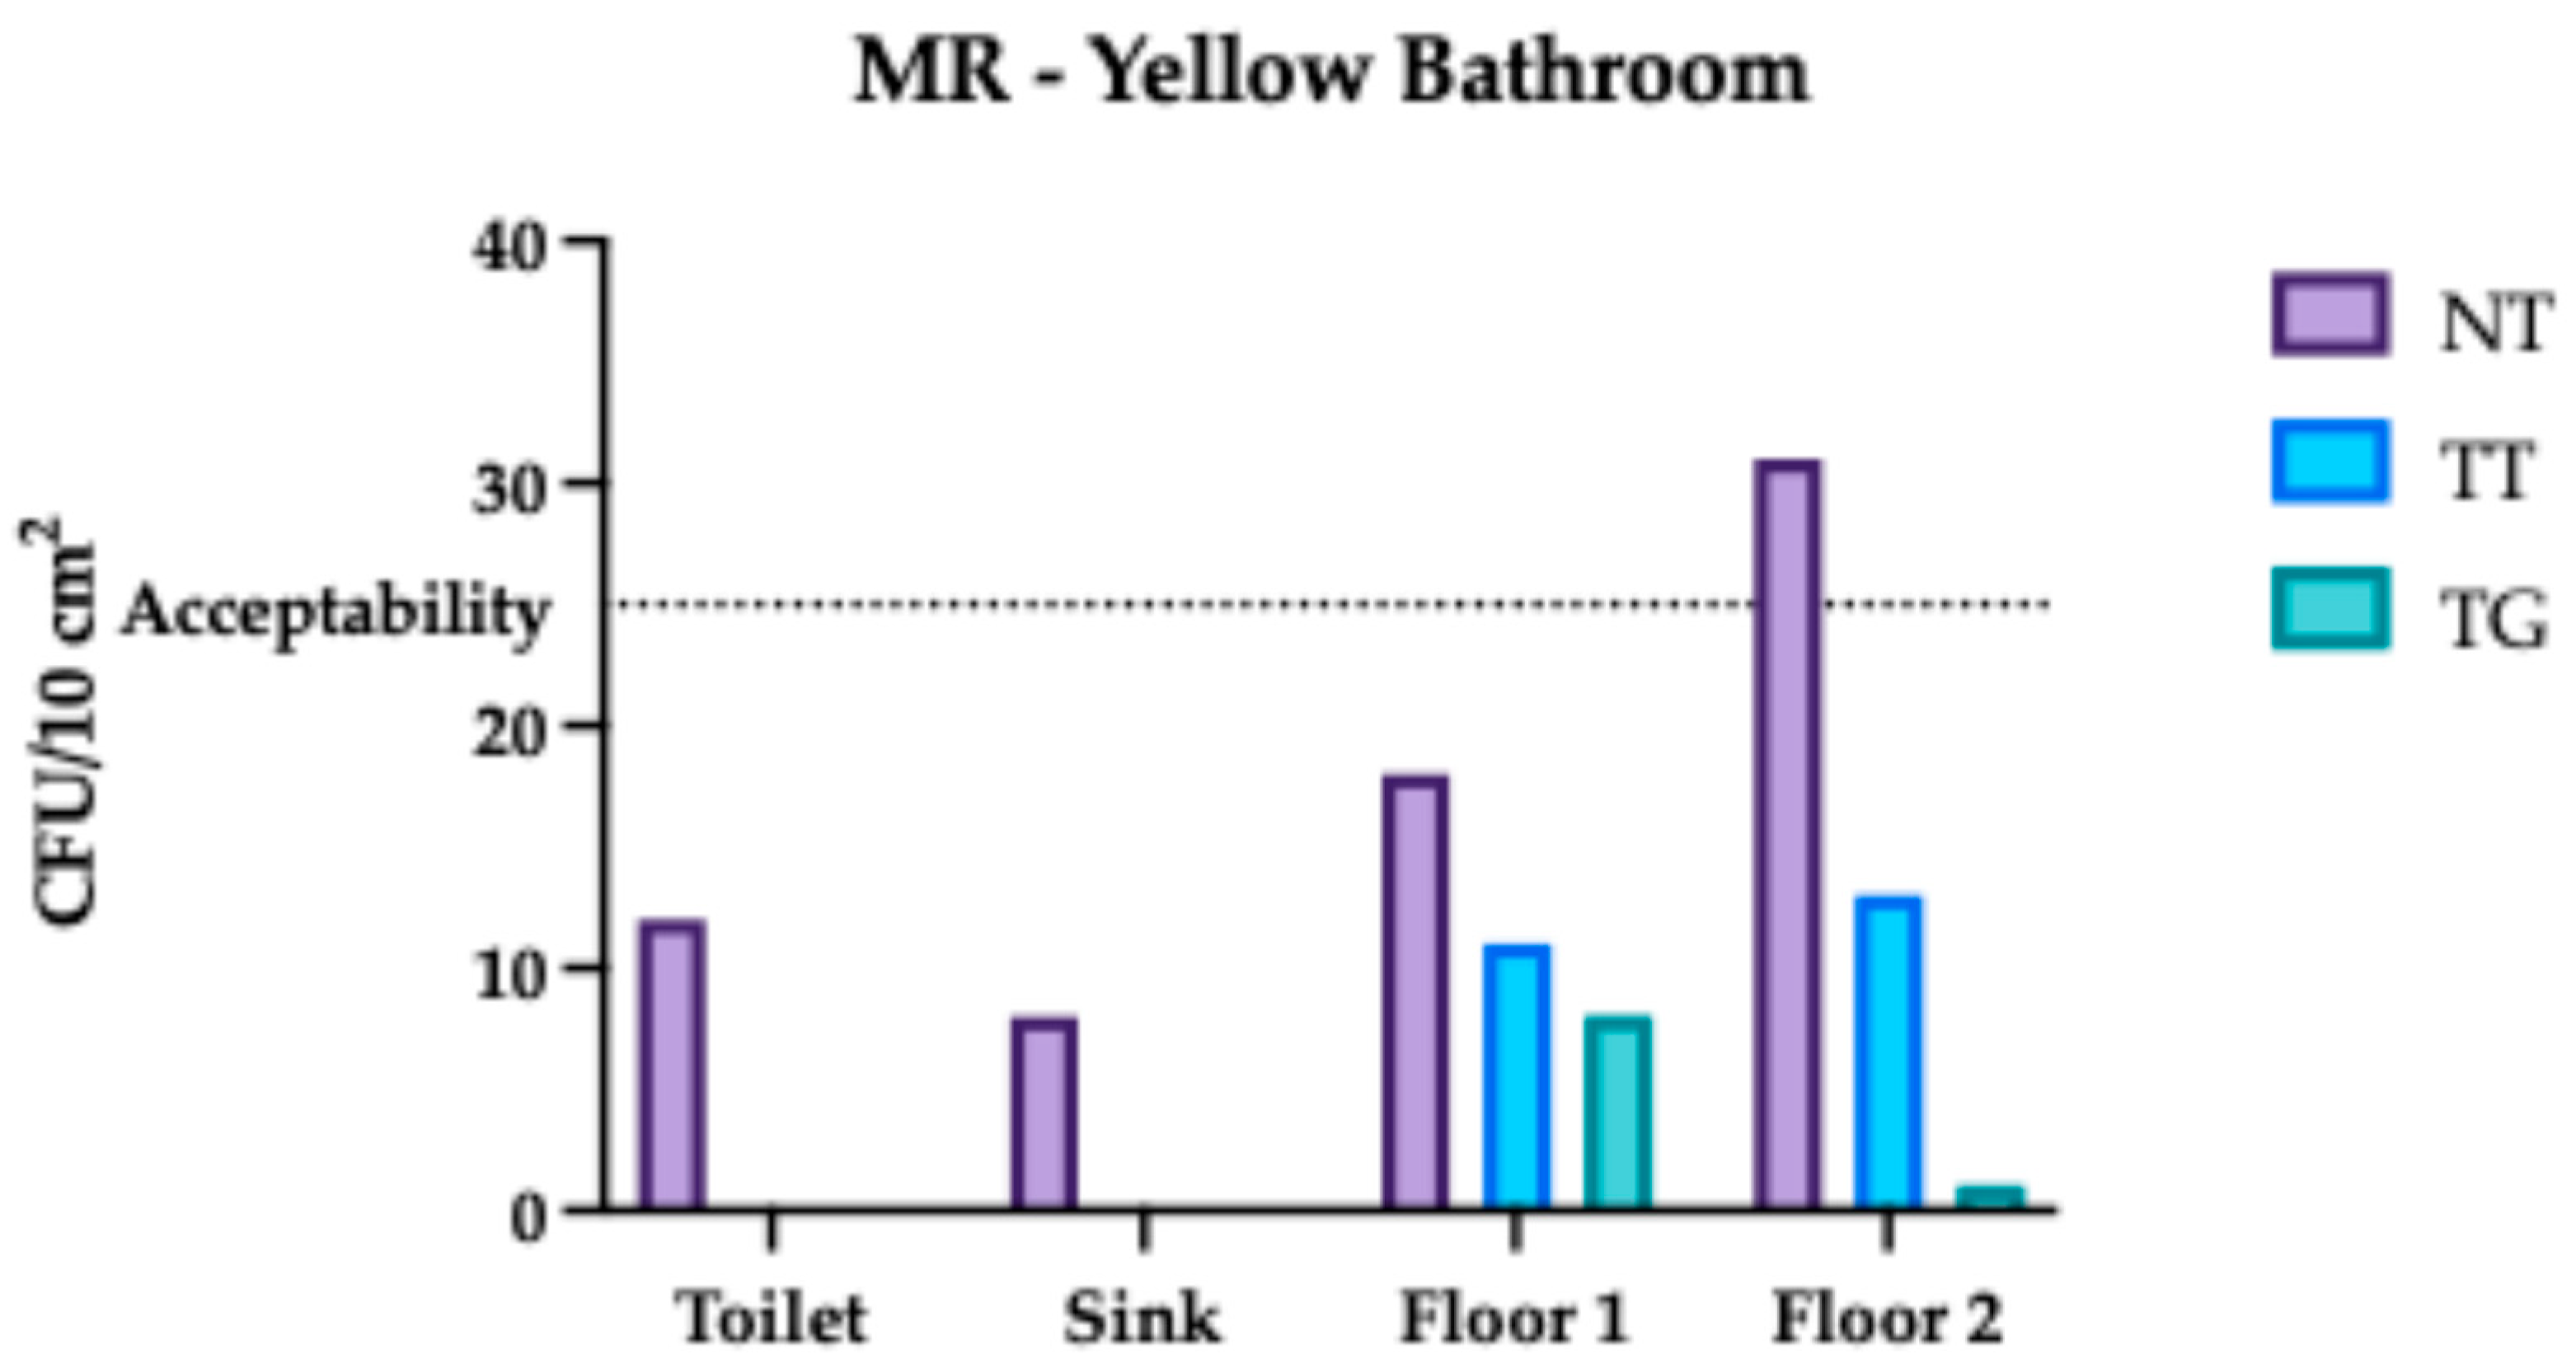
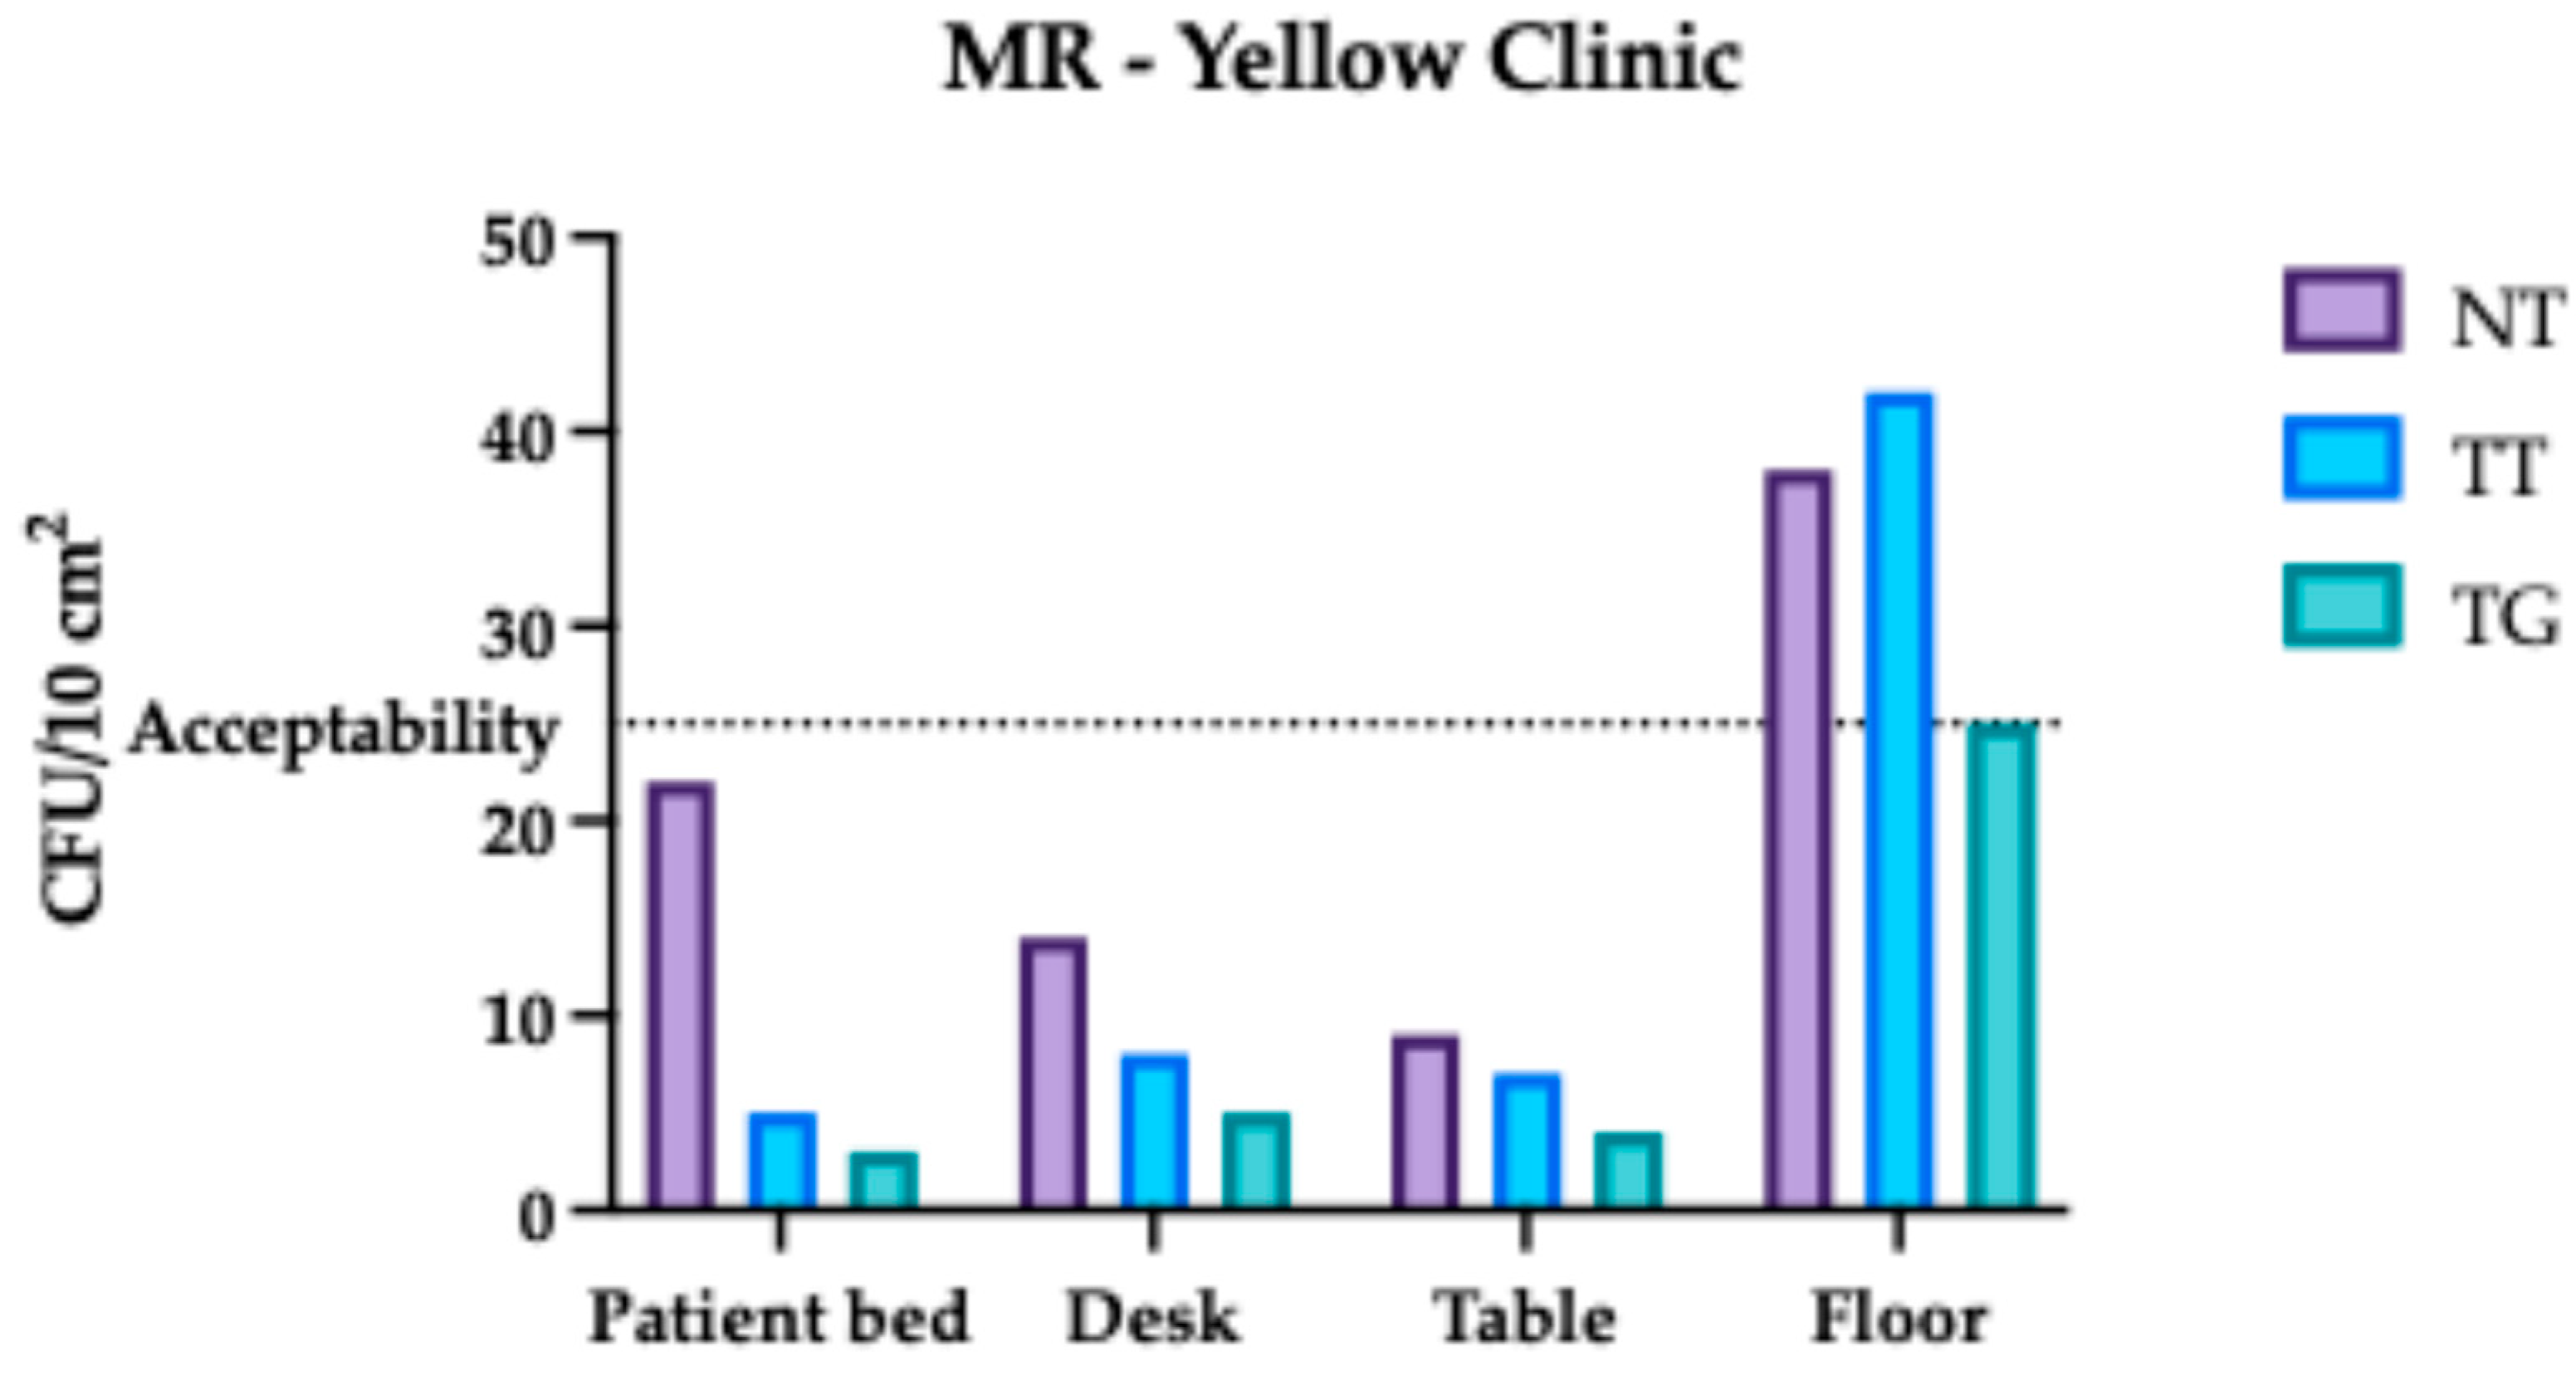
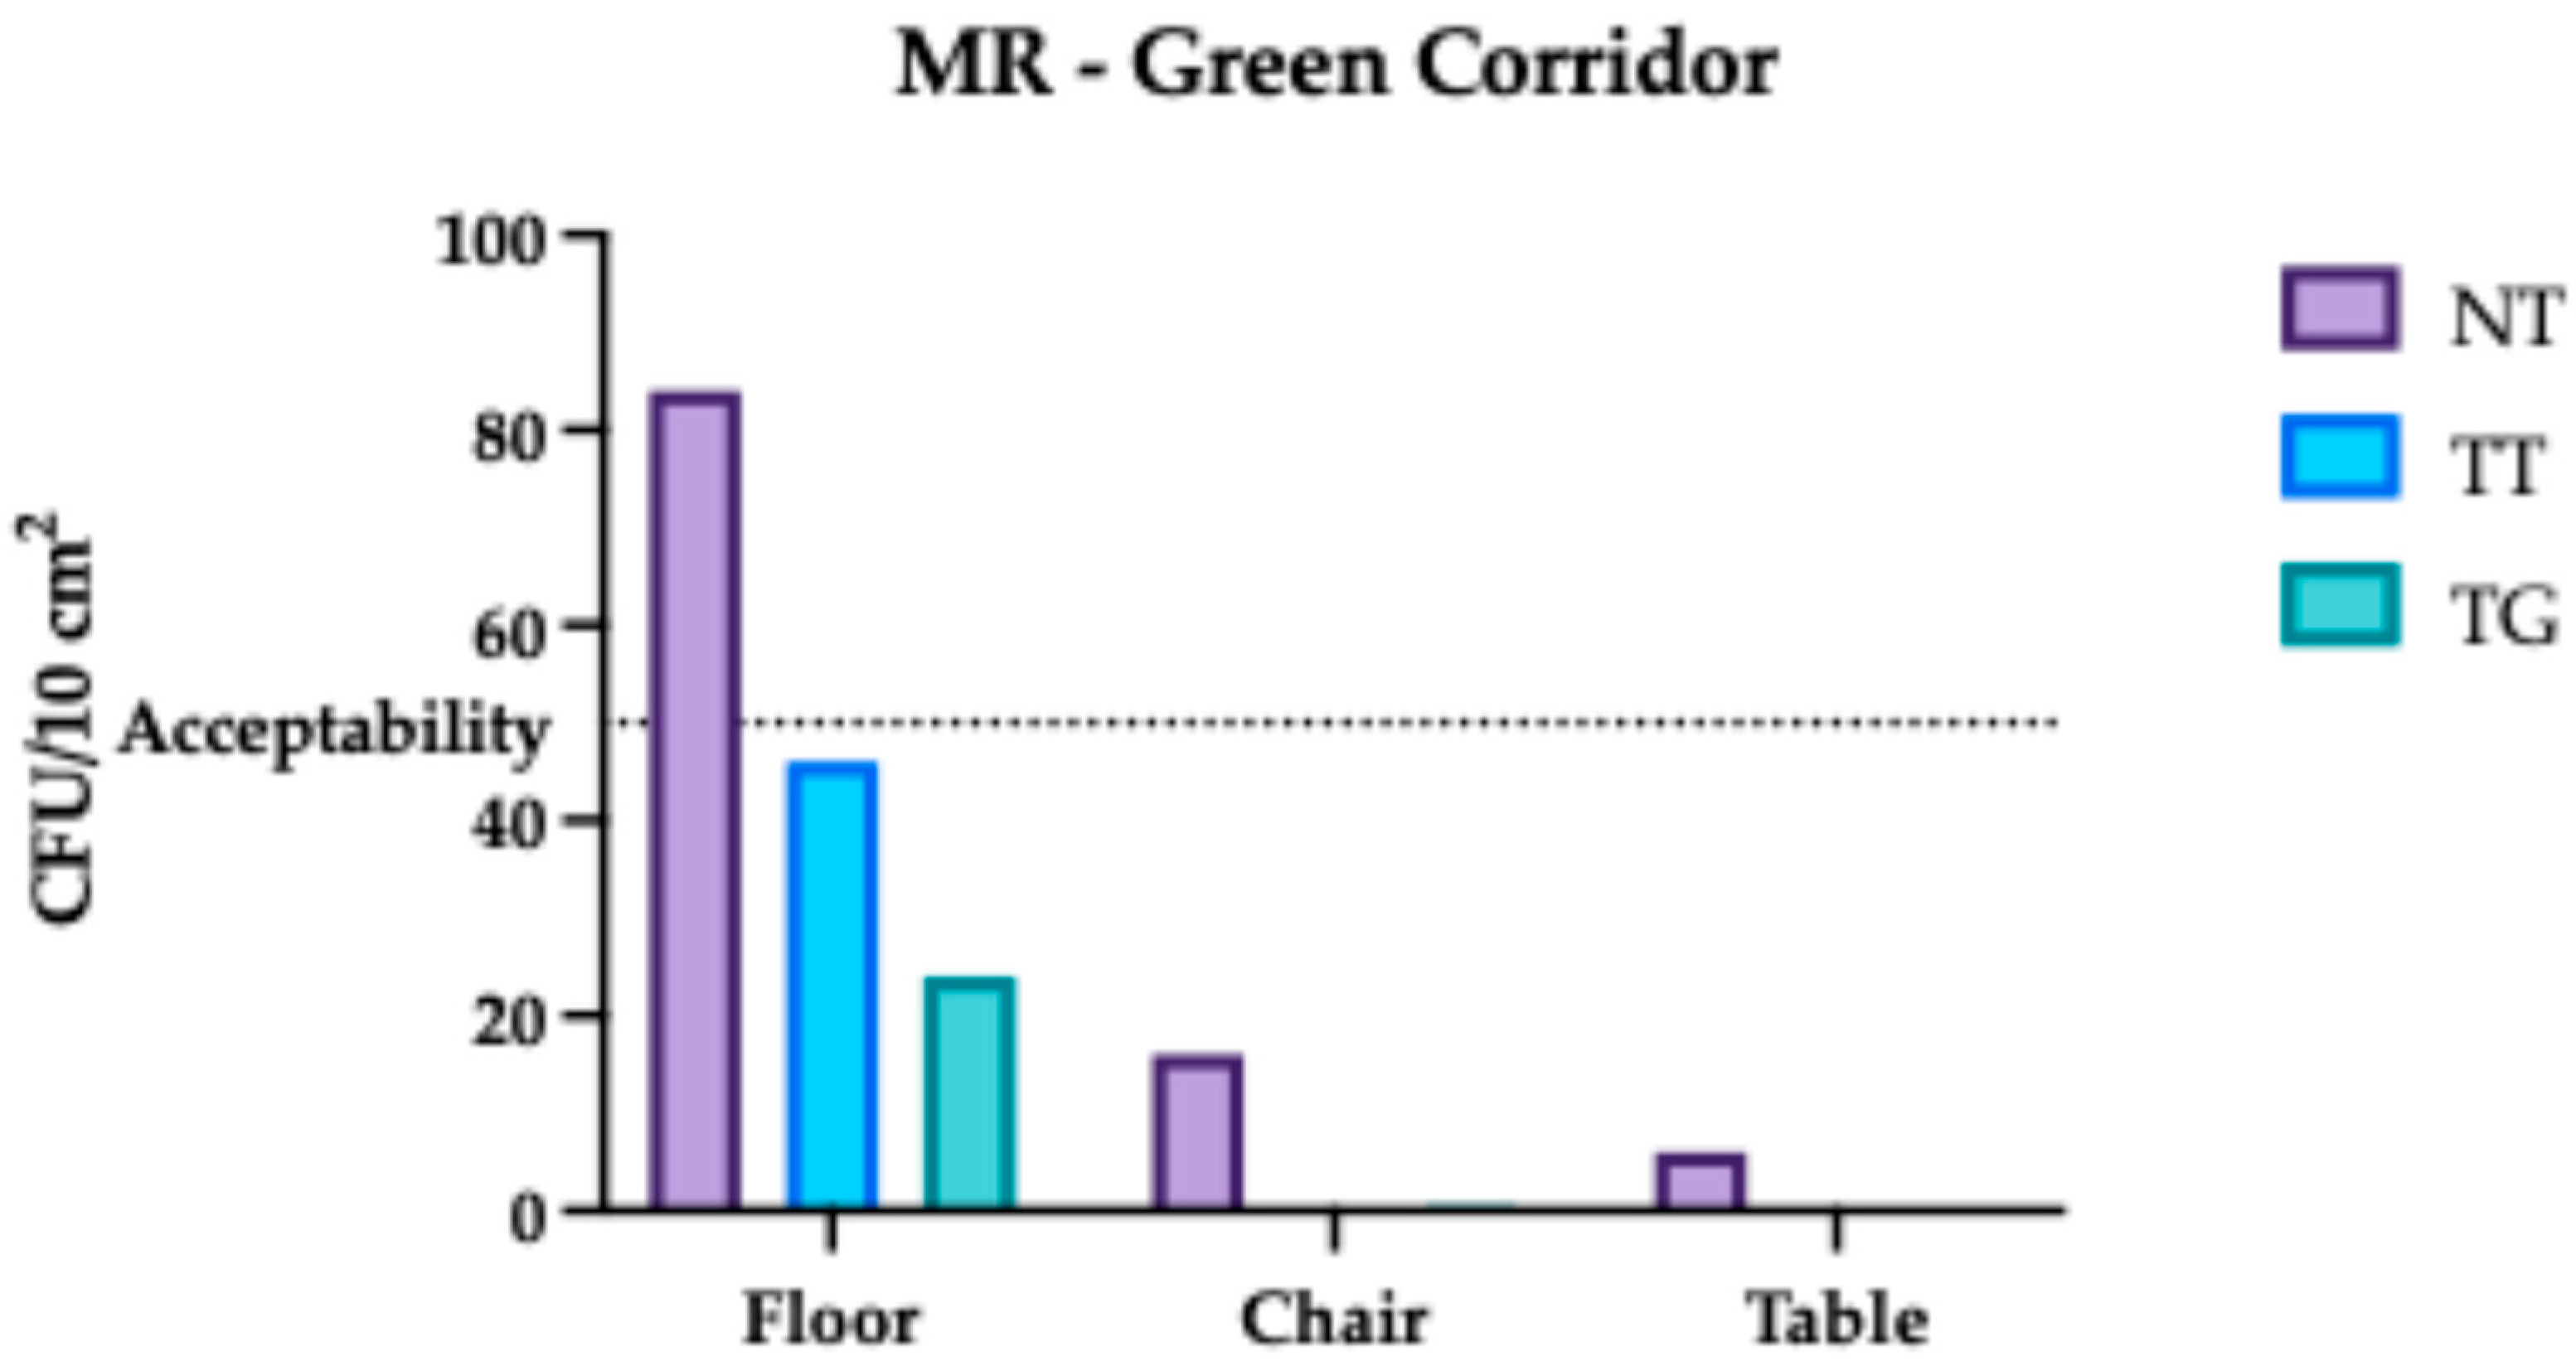
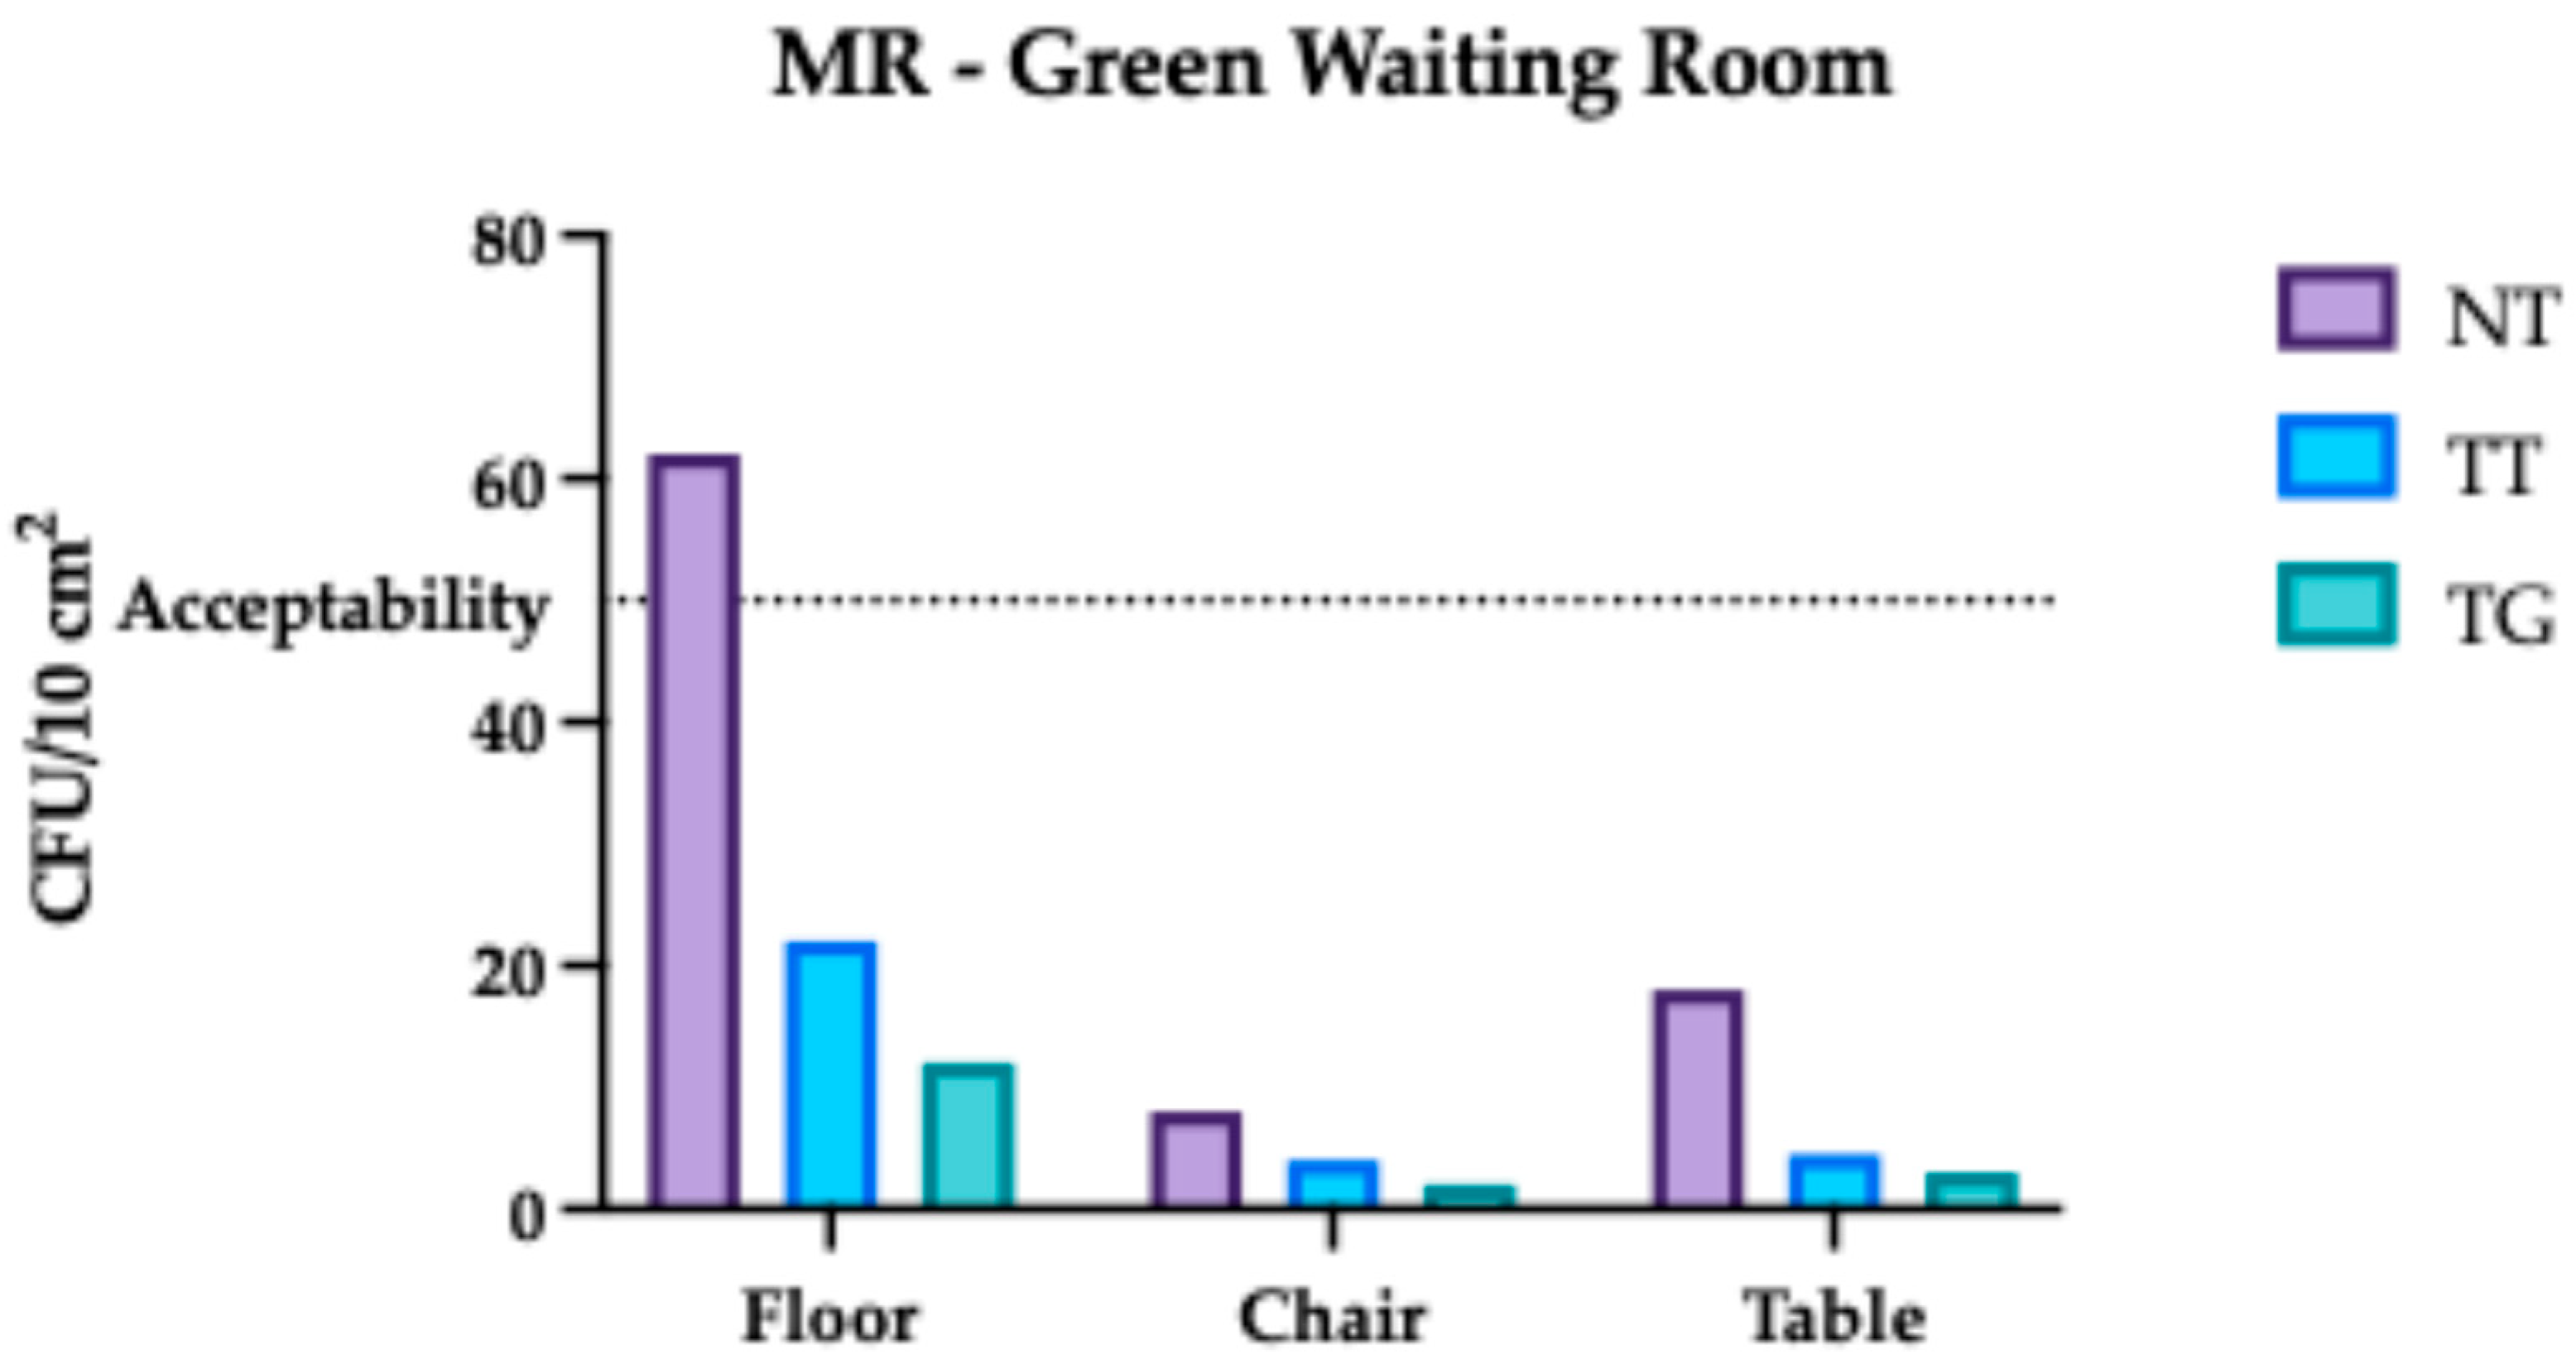
Findings from the study conducted at Monte Rocchetta indicate that all the spaces and surfaces examined were cleaned to acceptable standards following the cleaning process. This implies that the bacterial presence was reduced to a level considered safe and acceptable.
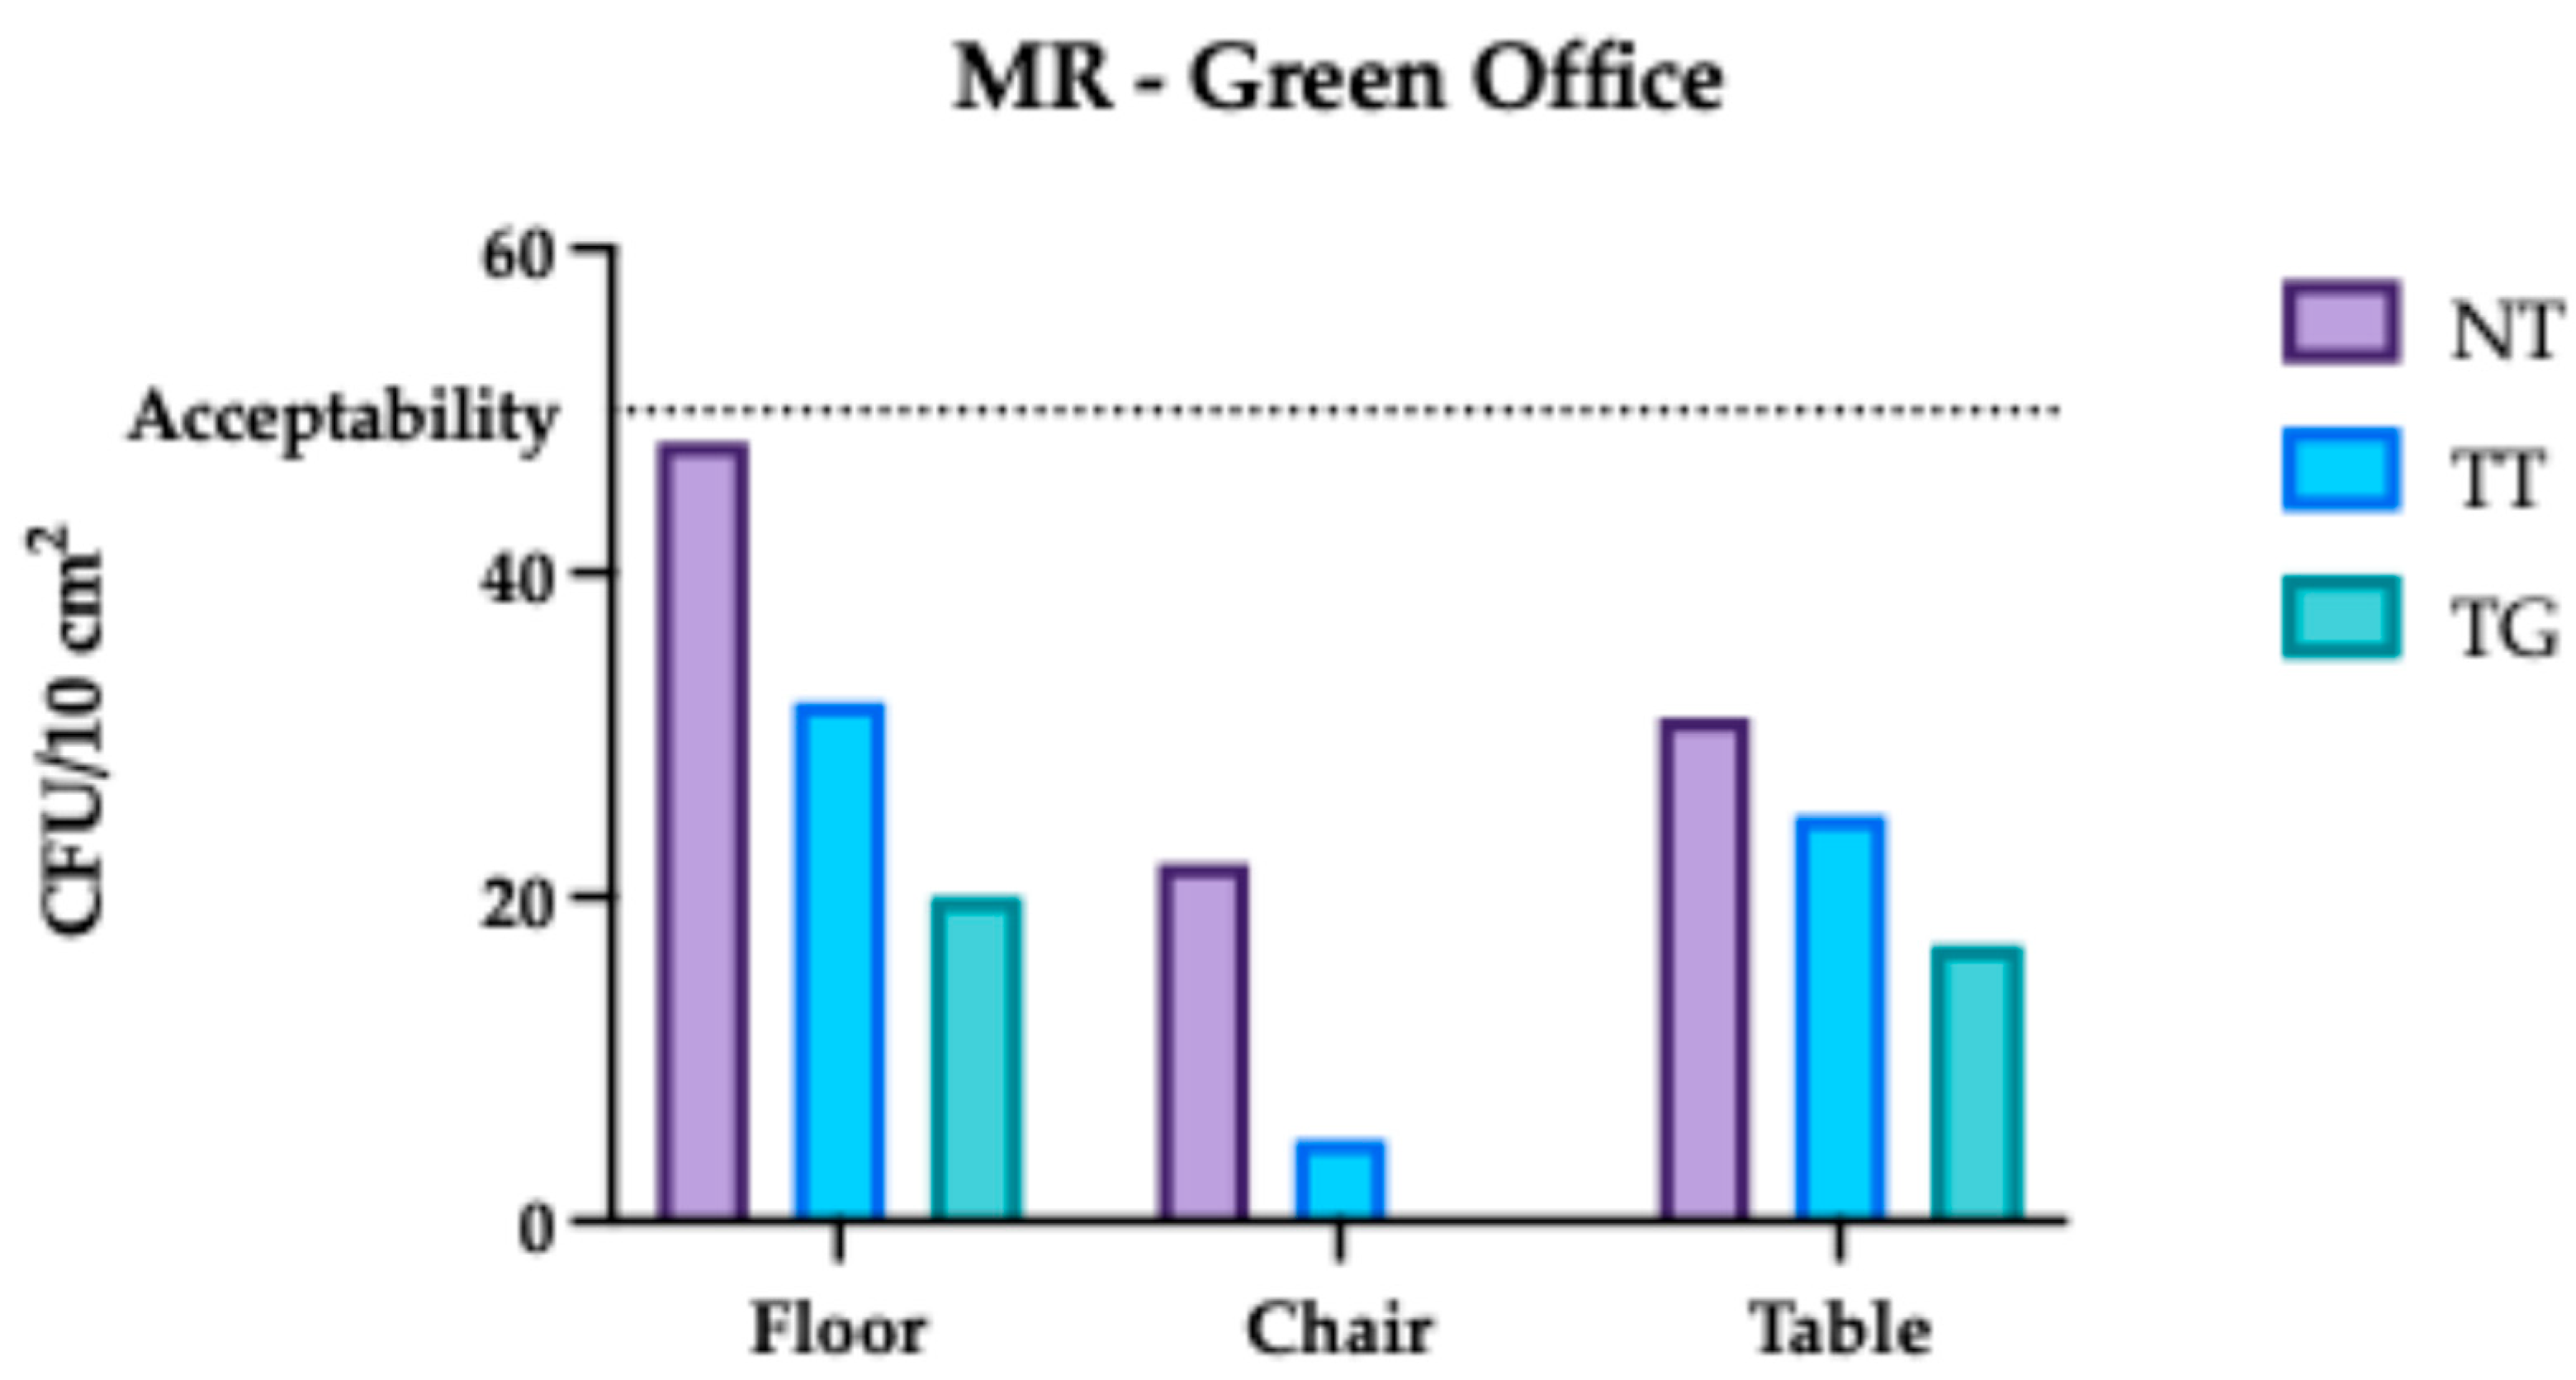
It is noteworthy that the eco-friendly or “green” cleaning protocol demonstrated superior effectiveness in minimizing microbial contamination on hospital surfaces (Figure 13, Figure 14, Figure 15, Figure 16, Figure 17 and Figure 18). This confirms our previous data from the Regina Margherita Hospital and our previous research, which show that the green cleaning method not only aligns with environmental sustainability goals but also ensures a higher standard of cleanliness and safety in healthcare settings.
The results of our study conducted at Monte Rocchetta provide evidence regarding the effectiveness of traditional versus eco-friendly cleaning methods in maintaining hygiene on hospital surfaces. The evaluation showed that all examined areas and surfaces met acceptable cleaning standards, demonstrating a significant reduction in bacterial presence to levels considered safe for healthcare environments. This finding aligns with previous research conducted at Regina Margherita Hospital, reinforcing the idea that effective cleaning protocols are crucial in preventing healthcare-associated infections (HAIs) [11,22,23]. Importantly, our study revealed that the eco-friendly cleaning protocol, which emphasizes the use of environmentally sustainable products and equipment settings, such as “eco” modes on scrubbers and lower washing temperatures, was effective in minimizing microbial contamination on hospital surfaces. This result is consistent with those of Kamaruddin et al., who highlighted the importance of green cleaning initiatives in addressing environmental concerns while maintaining high standards of cleanliness in healthcare settings [24]. Furthermore, the results support the conclusions of earlier work from our laboratory, which noted that both traditional and green cleaning methods can effectively control microbiological contamination; however, the latter often aligns better with sustainability goals [22].
The performance of the green cleaning protocol in our study can be attributed to its comprehensive approach, which not only focuses on immediate microbial reduction but also considers long-term environmental impacts. This is reflected in the work of Niyonzima et al., who identified clean water and effective hand hygiene protocols as enablers for maintaining hygiene in healthcare settings [25]. The integration of eco-friendly practices not only enhances surface cleanliness but also contributes to a healthier indoor environment, emphasizing the role of safer cleaning products in improving indoor air quality and overall health outcomes. Moreover, the implications of our findings extend beyond mere compliance with hygiene standards; they suggest a paradigm shift in how healthcare facilities approach cleaning protocols. As highlighted by Carling, optimizing environmental hygiene is essential for reducing pathogen transmission and ensuring patient safety [26]. The evidence from our study supports the need for hospitals to reevaluate their cleaning practices, not merely as cost-cutting measures but as integral components of patient care and safety [27].

3.3. Comparative Analysis Results of Monte Rocchetta

The comparative LCA analysis conducted at Monte Rocchetta reveals that the green cleaning protocol results in an annual reduction of 159 g of CO2 equivalent per square meter of cleaned surface compared to the traditional protocol.
This environmental advantage becomes even more pronounced when extended to the entire pilot site at the ASL Roma 1 headquarters in District 3, Monte Rocchetta, Rome. Implementing the green protocol across the whole site results in an overall annual reduction of 488 kg of CO2 equivalent emissions.
When comparing the two protocols, the green protocol achieves a 53.3% decrease in the Global Warming Potential (GWP) impact relative to the traditional protocol. In practical terms, this translates to a yearly saving of 159 g of CO2e per square meter cleaned.
The most significant absolute reduction is linked to the lower energy consumption of machinery, particularly washing machines and dryers. This improvement is primarily due to two factors: the use of lower washing temperatures and more efficient dryer operation. These optimizations helped avoid approximately 232 kg of CO2e emissions annually at the pilot site, representing a 50% reduction in energy consumption compared to the machines used in the traditional protocol.
Another key area contributing to emission reductions is the life cycle of cleaning chemicals. The use of more concentrated and environmentally friendly products led to a decrease of 212 kg of CO2e per year (an 83% reduction compared to the chemicals used in the traditional protocol). This choice also brought additional benefits, including reduced plastic and cardboard packaging waste, as well as a lower environmental impact associated with product transportation.
Moreover, the life cycle of textile equipment showed a notable reduction in impact. Thanks to the use of higher-yield and more durable textiles, emissions associated with this category were cut down to 25 kg of CO2e per year, marking a 68% decrease compared to the textiles employed in the traditional protocol.
Concerning the processes with the greatest environmental impacts, the following contributions were identified:
  • For the green protocol, electricity consumption for laundry accounts for 51%, production of laundry chemicals accounts for 12%, trolley manufacturing accounts for 11%, production of cleaning chemicals accounts for 7%, and wastewater treatment from laundry accounts for 6%.
  • In the traditional protocol, electricity consumption for laundry accounts for 48%, production of cleaning chemicals for 23%, production of laundry chemicals for 6%, trolley manufacturing for 5%, and wastewater treatment for 3%.
Regarding the green protocol, the only aspect that seems to have a greater impact than the traditional protocol is the measured water consumption for diluting cleaning chemicals. This result relates to the use of concentrated chemicals, which must be diluted on site when preparing cleaning solutions. Conversely, adopting these products has led to a significant reduction in their consumption, as well as in the transport and production of packaging waste. It is essential to note that the cleaning products of the traditional protocol also consume water for dilution; however, this process occurs during the production stage. In this case, the water used for detergent dilution is handled alongside the product itself, resulting in a greater impact during transportation.

3.4. Comparative Analysis Results of Regina Margherita

The comparative LCA analysis results show that the green cleaning protocol reduces CO2e emissions by 126 g per square meter of cleaned surface annually compared to the traditional protocol. The environmental advantages of the green protocol become even more evident when considering its application across the entire pilot site at the Presidio Nuova Regina Margherita in Rome. This analysis reveals that implementing the green protocol at the pilot site prevents the release of approximately 2008 kg of CO2e each year.
Overall, the green protocol achieves a 49.6% reduction in the Global Warming Potential (GWP) compared to the traditional protocol. The largest absolute decrease is linked to the consumption of cleaning chemicals. By using more concentrated products with a lower environmental impact per unit of cleaning solution, emissions were reduced by 1159 kg of CO2e annually at the pilot site, corresponding to a 67% reduction relative to the chemicals used in the traditional protocol. Additionally, the choice of concentrated products contributes to lower plastic and cardboard packaging waste and reduces transportation-related impacts.
Energy consumption for operating machines such as washing machines and washer-dryers also saw a notable reduction. This was achieved by employing lower washing temperatures and more efficient scrubber operation modes, which together helped avoid approximately 707 kg of CO2e emissions annually, equivalent to a 50% reduction compared to the traditional protocol’s machine energy use.
Finally, a significant reduction in impact was observed throughout the life cycle of textile equipment. The use of textiles with higher durability and greater reconditioning capacity resulted in a 75 kg CO2e decrease in emissions per year at the pilot site, representing a 65% reduction compared to the emissions from textiles used in the traditional protocol.

4. Conclusions

This study provides robust evidence supporting the effectiveness of eco-friendly cleaning protocols in maintaining hygiene standards in healthcare settings while significantly reducing environmental impact. The findings from Nuovo Regina Margherita demonstrate that both traditional and sustainable cleaning methods effectively minimize microbial contamination on hospital surfaces, ensuring compliance with hygiene requirements critical to preventing healthcare-associated infections (HAIs). However, the green cleaning protocol emerges as a superior alternative, not only maintaining comparable microbiological quality but also aligning with environmental sustainability objectives.
From a microbiological perspective, the green protocol exhibited results equivalent to those of traditional methods across all sampled locations. These outcomes align with previous studies, including those conducted at Regina Margherita Hospital, which highlight the importance of effective cleaning strategies in infection control [14,28]. The integration of eco-conscious practices—such as lower washing temperatures, optimized equipment settings, and the use of concentrated cleaning agents—highlights a paradigm shift in healthcare sanitation, promoting both safety and sustainability [25,29].
The comparative Life Cycle Assessment (LCA) analysis underscores the environmental benefits of adopting the green protocol. At Monte Rocchetta, this approach resulted in a 53.3% reduction in global warming potential (GWP) compared to the traditional method, preventing 488 kg of CO2e emissions annually across the pilot site. Similarly, the Regina Margherita site recorded a 49.6% decrease in GWP, with an annual reduction of 2008 kg CO2e emissions. These reductions stem largely from lower energy consumption in laundry operations, more efficient washing and drying cycles, and a decrease in chemical use. The adoption of concentrated products further contributed to an 83% reduction in emissions from cleaning chemicals, with additional benefits such as reduced plastic and cardboard waste.
Despite these positive outcomes, the study also identified areas requiring further optimization. One notable challenge is the increased water consumption associated with diluting concentrated eco-friendly cleaning solutions. While this contributes to higher water usage at the cleaning site, it is offset by reduced emissions from transportation and packaging production. Future research should explore improved dilution techniques or alternative formulations to minimize this trade-off.
This study has some limitations that should be acknowledged. First, although two representative healthcare facilities were included, the findings may not be generalizable to all clinical environments, particularly those with different patient volumes, climate conditions, or infrastructure. Second, due to contractual and confidentiality constraints, the commercial names and complete formulations of the cleaning products could not be disclosed. While the active ingredients and concentrations were reported, a full comparison of formulation performance remains limited. Finally, although microbial contamination levels were assessed, the study did not include an evaluation of potential impacts on patient outcomes, such as infection rates or antimicrobial resistance trends. Future studies should address these aspects through longitudinal and multicenter designs.
Overall, the results of this study support a transition toward more sustainable healthcare cleaning protocols. The findings provide compelling evidence for hospitals to reassess their sanitation strategies, not solely as cost-saving measures but as critical components of patient care and environmental responsibility. As healthcare facilities increasingly prioritize sustainability, the green protocol presents a viable, high-performance solution that meets hygiene requirements while drastically reducing the carbon footprint.

Author Contributions

Conceptualization, P.M. and C.B.; methodology, P.M., M.B., R.F., C.B., L.V. and B.B.; investigation, R.F., M.B., M.P., A.C., C.N., M.F., L.V. and B.B.; data curation, R.F. and L.V.; writing—original draft preparation, R.F. and L.V.; writing—review and editing, P.M. and C.B.; supervision, P.M. and C.B.; project administration, P.M. and C.B.; funding acquisition, P.M. and C.B. All authors have read and agreed to the published version of the manuscript.

Funding

The authors declare that this study was funded by CNS Colaser.

Data Availability Statement

The original contributions presented in this study are included in the article. Further inquiries can be directed to the corresponding author due to relevance.

Acknowledgments

We acknowledge CNS—Luigi Zucchelli, DIRECTOR OF INTEGRATED TECHNICAL AREA AND DEVELOPMENT; CNS—Francesco Mundo, Head of the Certified Systems Office (Quality, Environment, Safety, Energy); CO.LA.SER—Luciano Moretti, PRESIDENT. We acknowledge the master’s thesis students Chiara Bonacina, Noemi Lagreca, Elena Smiderle, and Andrea Sorrentino for the valuable lab work.

Conflicts of Interest

L.V., C.B., and B.B. were employed by Punto 3 Srl S.B. The remaining authors declare that the research was conducted in the absence of any commercial or financial relationships that could be construed as a potential conflict of interest. The authors declare that this study was funded by CNS Colaser. The funder was not involved in the study design, collection, analysis, interpretation of data, the writing of this article, or the decision to submit it for publication. The authors declare that they have no conflicts of interest.

References

  1. Everard, M. Assessment of the sustainable use of chemicals on a level playing field. Integr. Environ. Assess. Manag. 2023, 19, 1131–1146. [Google Scholar] [CrossRef] [PubMed]
  2. Sonnemann, G.; Gemechu, E.D.; Remmen, A.; Frydendal, J.; Jensen, A.A. Life Cycle Management: Implementing Sustainability in Business Practice; Springer: Berlin/Heidelberg, Germany, 2015; pp. 7–21. [Google Scholar] [CrossRef]
  3. Luthin, A.; Traverso, M.; Crawford, R.H. Circular life cycle sustainability assessment: An integrated framework. J. Ind. Ecol. 2024, 28, 41–58. [Google Scholar] [CrossRef]
  4. Zeug, W.; Bezama, A.; Thrän, D. A framework for implementing holistic and integrated life cycle sustainability assessment of regional bioeconomy. Int. J. Life Cycle Assess. 2021, 26, 1998–2023. [Google Scholar] [CrossRef]
  5. Boyce, J.M. Modern technologies for improving cleaning and disinfection of environmental surfaces in hospitals. Antimicrob. Resist. Infect. Control 2016, 5, 1–10. [Google Scholar] [CrossRef] [PubMed]
  6. Nikolić, D.; Jovanović, S.; Skerlić, J.; Šušteršič, J.; Radulović, J. Methodology of Life Cycle Sustainability Assessment. Proc. Eng. Sci. 2019, 1, 793–800. [Google Scholar] [CrossRef]
  7. Khare, T.; Anand, U.; Dey, A.; Assaraf, Y.G.; Chen, Z.-S.; Liu, Z.; Kumar, V. Exploring Phytochemicals for Combating Antibiotic Resistance in Microbial Pathogens. Front. Pharmacol. 2021, 12, 720726. [Google Scholar] [CrossRef]
  8. Muteeb, G.; Rehman, M.T.; Shahwan, M.; Aatif, M. Origin of Antibiotics and Antibiotic Resistance, and Their Impacts on Drug Development: A Narrative Review. Pharmaceuticals 2023, 16, 1615. [Google Scholar] [CrossRef]
  9. Cave, R.; Cole, J.; Mkrtchyan, H.V. Surveillance and prevalence of antimicrobial resistant bacteria from public settings within urban built environments: Challenges and opportunities for hygiene and infection control. Environ. Int. 2021, 157, 106836. [Google Scholar] [CrossRef]
  10. Sharma, S.; Chauhan, A.; Ranjan, A.; Mathkor, D.M.; Haque, S.; Ramniwas, S.; Tuli, H.S.; Jindal, T.; Yadav, V. Emerging challenges in antimicrobial resistance: Implications for pathogenic microorganisms, novel antibiotics, and their impact on sustainability. Front. Microbiol. 2024, 15, 1403168. [Google Scholar] [CrossRef]
  11. Klassert, T.E.; Zubiria-Barrera, C.; Neubert, R.; Stock, M.; Schneegans, A.; López, M.; Driesch, D.; Zakonsky, G.; Gastmeier, P.; Slevogt, H.; et al. Comparative analysis of surface sanitization protocols on the bacterial community structures in the hospital environment. Clin. Microbiol. Infect. 2022, 28, 1105–1112. [Google Scholar] [CrossRef]
  12. Kalita, I.; Kamilaris, A.; Havinga, P.; Reva, I. Assessing the Health Impact of Disinfection Byproducts in Drinking Water. ACS EST Water 2024, 4, 1564–1578. [Google Scholar] [CrossRef] [PubMed]
  13. Alruwaili, R.F.; Alsadaan, N.; Alruwaili, A.N.; Alrumayh, A.G. Unveiling the Symbiosis of Environmental Sustainability and Infection Control in Health Care Settings: A Systematic Review. Sustainability 2023, 15, 15728. [Google Scholar] [CrossRef]
  14. Fontana, R.; Buratto, M.; Marzola, M.; Trioschi, G.; Bandera, B.; Buffone, C.; Vogli, L.; Marconi, P. An Evaluation of Hospital Cleaning Regimes—Microbiological Evaluation and LCA Analysis after Traditional and Sustainable/Green Procedures. Sustainability 2022, 14, 11465. [Google Scholar] [CrossRef]
  15. Dancer, S.J. How do we assess hospital cleaning? A proposal for microbiological standards for surface hygiene in hospitals. J. Hosp. Infect. 2004, 56, 10–15. [Google Scholar] [CrossRef]
  16. Griffith, C.J.; Cooper, R.A.; Gilmore, J.; Davies, C.; Lewis, M. An evaluation of hospital cleaning regimes and standards. J. Hosp. Infect. 2000, 45, 19–28. [Google Scholar] [CrossRef]
  17. La Contaminazione Microbiologica Delle Superfici Negli Ambienti Lavorativi. 2017. Available online: www.inail.it (accessed on 10 August 2022).
  18. Linee Guida Sugli Standard di Sicurezza e di Igiene del Lavoro nel Reparto Operatorio Istituto Superiore per la Prevenzione e la Sicurezza del Lavoro Dipartimento Igiene del Lavoro. Available online: https://www.lisaservizi.it/wp-content/uploads/2024/05/20150820174253-ISPESL-LG-SaleOperatorie.pdf (accessed on 19 August 2025).
  19. O’Hara, C.M.; Rhoden, D.L.; Miller, J.M. Reevaluation of the API 20E identification system versus conventional biochemicals for identification of members of the family Enterobacteriaceae: A new look at an old product. J. Clin. Microbiol. 1992, 30, 123–125. [Google Scholar] [CrossRef]
  20. ISO 14040:2006; Environmental Management—Life Cycle Assessment—Principles and Framework. ISO: Geneva, Switzerland, 2006. Available online: https://www.iso.org/standard/37456.html (accessed on 10 August 2022).
  21. ISO 14044:2006; Environmental Management—Life Cycle Assessment—Requirements and Guidelines. ISO: Geneva, Switzerland, 2006. Available online: https://www.iso.org/standard/38498.html (accessed on 10 August 2022).
  22. ISO 14067:2018; Greenhouse Gases—Carbon Footprint of Products—Requirements and Guidelines for Quantification. ISO: Geneva, Switzerland, 2018. Available online: https://www.iso.org/standard/71206.html (accessed on 10 August 2022).
  23. Product Category Rules–PCR Professional Cleaning Services for Buildings 2011:03, Version 3.1; EPD International: Stockholm, Sweden, 2011.
  24. ISO 14026:2017; Environmental Labels and Declarations—Principles, Requirements and Guidelines for Communication of Footprint Information. ISO: Geneva, Switzerland, 2017.
  25. Niyonzima, V.; Luwaga, R.; Beinempaka, F. Enablers and Barriers to Hand Hygiene among Health Workers at Mbarara Regional Referral Hospital. J. Health Med. Nurs. 2023, 9, 54–63. [Google Scholar] [CrossRef]
  26. Carling, P.C. Health Care Environmental Hygiene. Infect. Dis. Clin. N. Am. 2021, 35, 609–629. [Google Scholar] [CrossRef] [PubMed]
  27. Peters, A.; Otter, J.; Moldovan, A.; Parneix, P.; Voss, A.; Pittet, D. Keeping hospitals clean and safe without breaking the bank; summary of the Healthcare Cleaning Forum 2018. Antimicrob. Resist. Infect. Control 2018, 7, 132. [Google Scholar] [CrossRef]
  28. Doll, M.; Stevens, M.; Bearman, G. Environmental cleaning and disinfection of patient áreas. Int. J. Infect. Dis. 2018, 67, 52–57. [Google Scholar] [CrossRef]
  29. Kamaruddin, A.; Zainol, N.N.; Sulaiman, M.A.; Sukereman, A.S.; Hashim, H.A. Green Cleaning as a Tool in Combating COVID-19: A Content Validity Study for Malaysian Healthcare Facilities. IOP Conf. Ser. Earth Environ. Sci. 2022, 1067, 012081. [Google Scholar] [CrossRef]
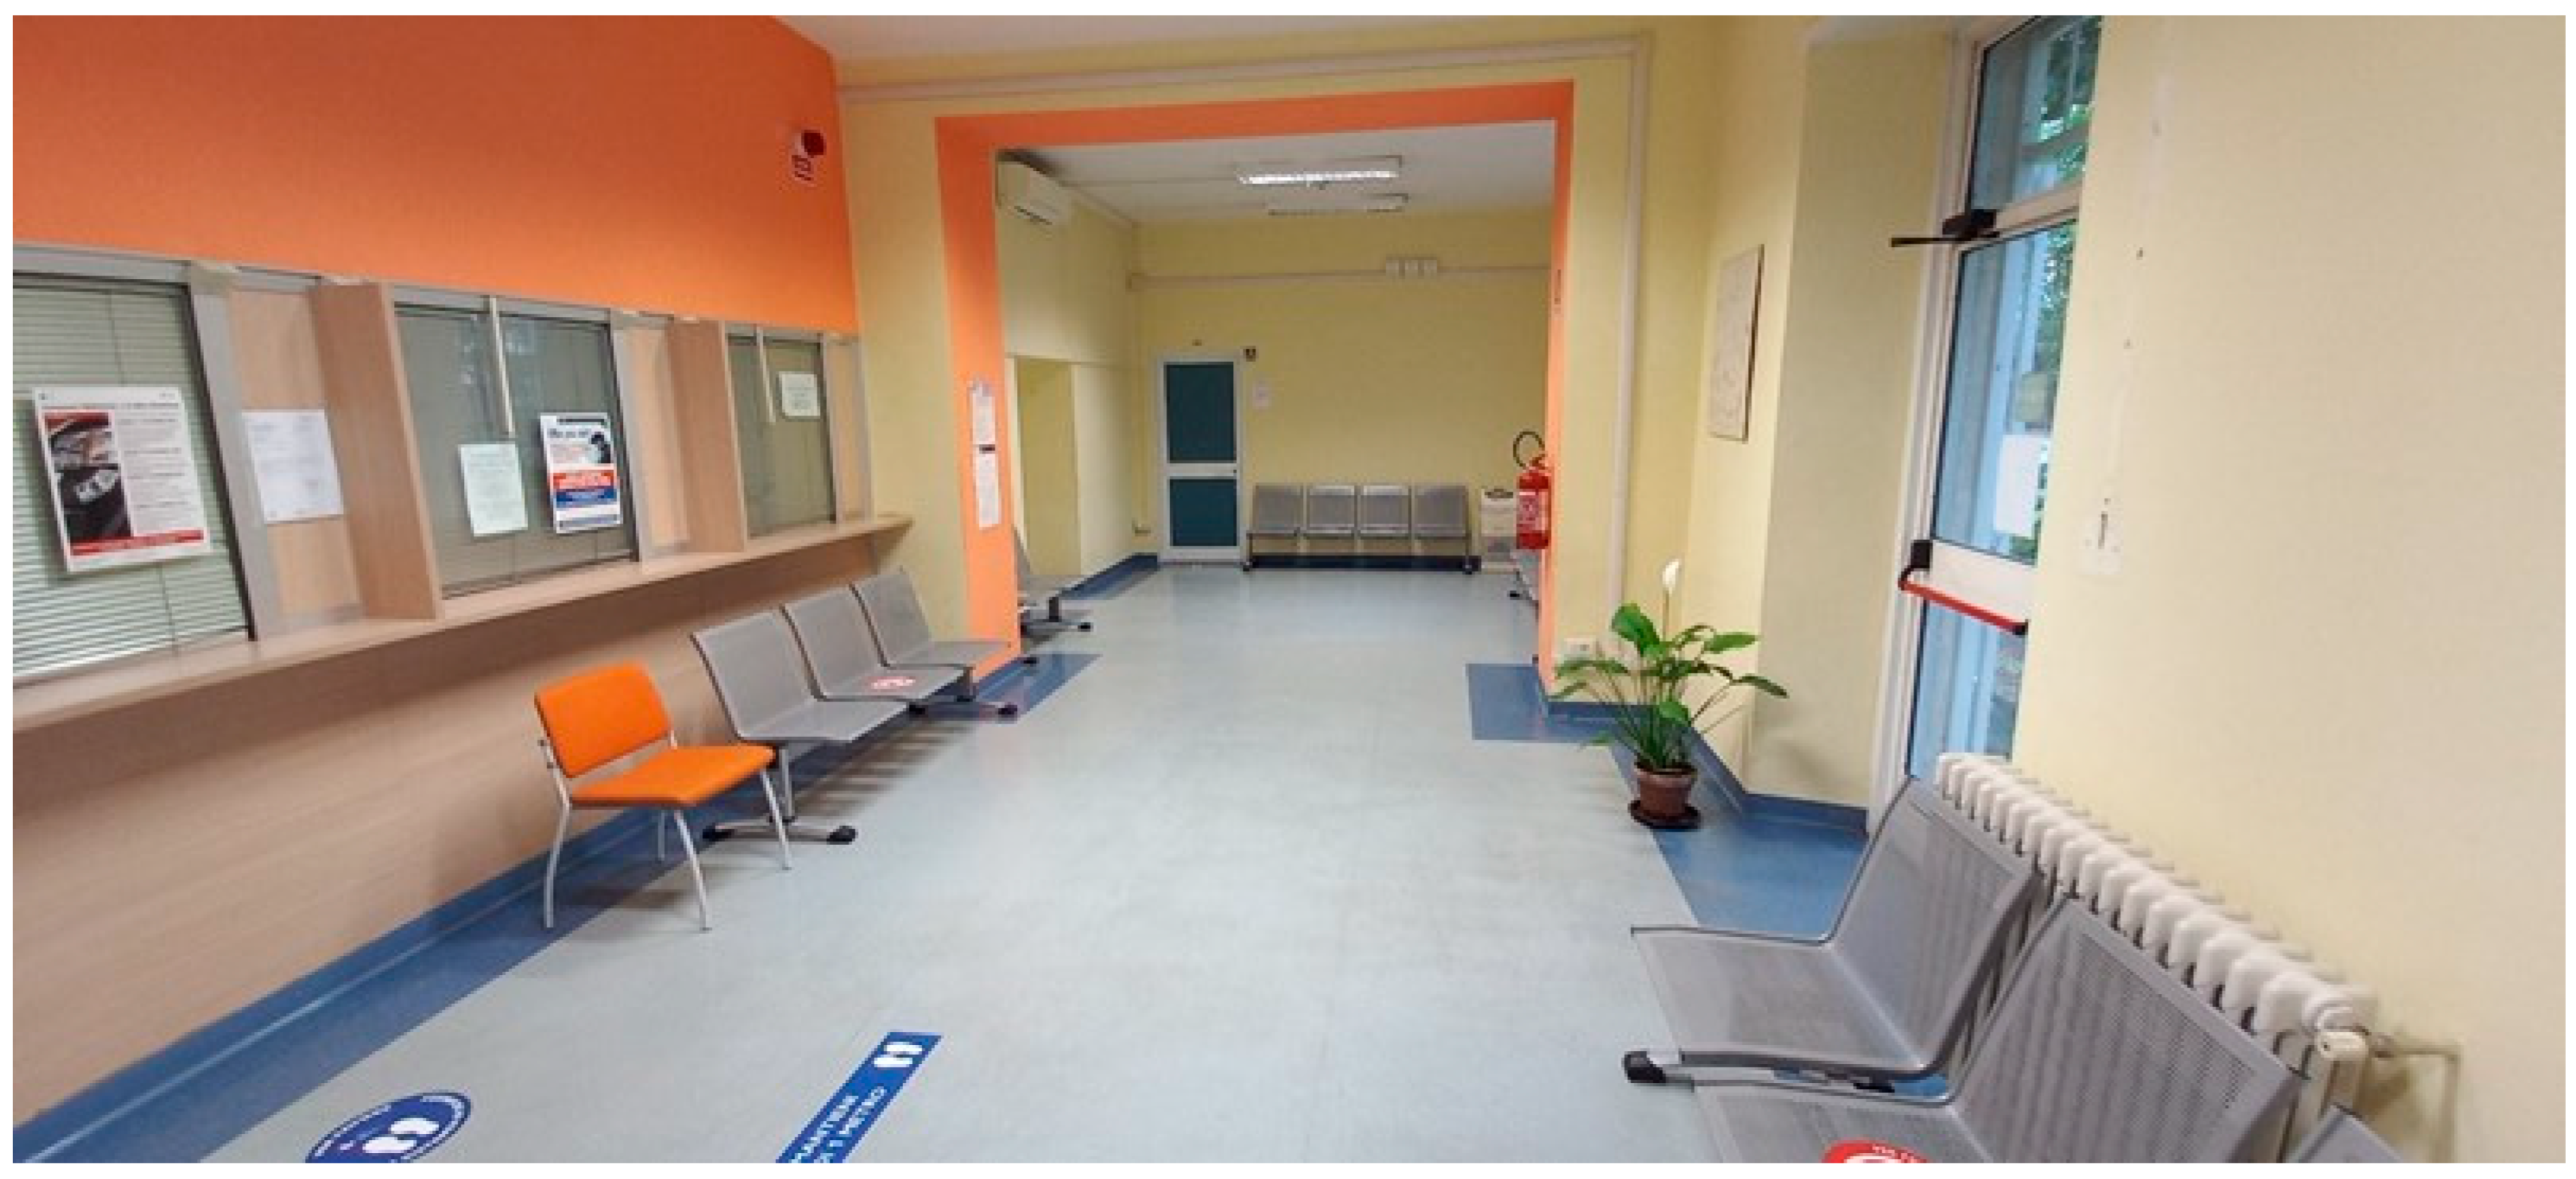
Figure 1. ASL headquarters Rome 1—District 3—Monte Rocchetta. Corridor and waiting room.
Hygiene 05 00037 g001
Figure 2. ASL Rome 1—District 3—Monte Rocchetta building.
Hygiene 05 00037 g002
Figure 3. ASL Rome 1—Presidio Nuovo Regina Margherita. Waiting room.
Hygiene 05 00037 g003
Figure 4. Schematic representation of system boundaries.
Hygiene 05 00037 g004
Figure 5. Microbial presence (CFU/10 cm2) in untreated (NT, in purple) vs. treated samples (TT in blue and TG in green) from bathroom surfaces (green area). Data represent the mean of two independent experiments; each was performed in triplicate.
Hygiene 05 00037 g005
Figure 6. Microbial presence (CFU/10 cm2) in untreated (NT, purple) versus treated samples (TT, blue; TG, green) from the waiting room (green area). Data represent the mean of two independent experiments performed in triplicate.
Hygiene 05 00037 g006
Figure 7. Microbial presence (CFU/10 cm2) in untreated (NT, purple) versus treated samples (TT, blue; TG, green) from the office area (green area). Data represent the mean of two independent experiments performed in triplicate.
Hygiene 05 00037 g007
Figure 8. Microbial presence (CFU/10 cm2) in untreated (NT, purple) versus treated (TT, blue; TG, green) samples from the waiting room (yellow area). Data represent the mean of two independent experiments performed in triplicate.
Hygiene 05 00037 g008
Figure 9. Microbial presence (CFU/10 cm2) in untreated (NT, purple) versus treated (TT, blue; TG, green) samples from the bathroom (yellow area). Data represent the mean of two independent experiments performed in triplicate.
Hygiene 05 00037 g009
Figure 10. Microbial presence (CFU/10 cm2) in untreated (NT, purple) versus treated (TT, blue; TG, green) samples from the clinic (yellow area). Data represent the mean of two independent experiments performed in triplicate.
Hygiene 05 00037 g010
Figure 11. Microbial presence (CFU/10 cm2) in untreated (NT, purple) versus treated (TT, blue; TG, green) samples from the hospitalization room (orange area). Data represent the mean of two independent experiments performed in triplicate.
Hygiene 05 00037 g011
Figure 12. Microbial presence (CFU/10 cm2) in untreated (NT, purple) versus treated (TT, blue; TG, green) samples from the bathroom (orange area). Data represent the mean of two independent experiments performed in triplicate.
Hygiene 05 00037 g012
Figure 13. Microbial presence (CFU/10 cm2) in untreated (NT, purple) versus treated (TT, blue; TG, green) samples from the waiting room (yellow area). Data represent the mean of two independent experiments performed in triplicate.
Hygiene 05 00037 g013
Figure 14. Microbial presence (CFU/10 cm2) in untreated (NT, purple) versus treated (TT, blue; TG, green) samples from the bathroom (yellow area). Data represent the mean of two independent experiments performed in triplicate.
Hygiene 05 00037 g014
Figure 15. Microbial presence (CFU/10 cm2) in untreated (NT, purple) versus treated (TT, blue; TG, green) samples from the clinic (yellow area). Data represent the mean of two independent experiments performed in triplicate.
Hygiene 05 00037 g015
Figure 16. Microbial presence (CFU/10 cm2) in untreated (NT, purple) versus treated (TT, blue; TG, green) samples from the corridor (green area). Data represent the mean of two independent experiments performed in triplicate.
Hygiene 05 00037 g016
Figure 17. Microbial presence (CFU/10 cm2) in untreated (NT, purple) versus treated (TT, blue; TG, green) samples from the waiting room (green area). Data represent the mean of two independent experiments performed in triplicate.
Hygiene 05 00037 g017
Figure 18. Microbial presence (CFU/10 cm2) in untreated (NT, purple) versus treated (TT, blue; TG, green) samples from the office (green area). Data represent the mean of two independent experiments performed in triplicate.
Hygiene 05 00037 g018
Table 1. Cleaning areas, tasks, and frequency of green areas.
Area/Item to CleanTasksFrequency
GREEN 1 Areas (administrative offices, educational areas and classrooms, meeting rooms and reception rooms, library, medical offices, duty doctor rooms, prayer rooms and accommodations for religious personnel, residential centers, day care centers, and family homes)Dusting, wiping to remove fingerprints and stains, and disinfection of all horizontal and vertical surfaces (furniture, equipment, medical supplies, etc.) accessible without the use of ladders.Daily
GREEN 2 Areas (waiting rooms, public and service access stairs, gyms, lounge, relaxation area, kitchenettes, reception, guard posts, internal pharmacy, entrances, ambulance access, elevators, etc.)Same cleaning tasks as GREEN 1 area.Daily
Steel EquipmentCleaning of external parts of steel equipment using approved healthcare facility products.Frequency determined with each healthcare facility
FloorsDust removal, cleaning, and possible scraping of all protected and unprotected floors.Daily
Sanitary FixturesCleaning, descaling, and disinfection of sanitary fixtures, washable walls, showers, accessories, etc.Daily
Table 2. Cleaning areas, tasks, and frequency of yellow areas.
Area/Item to CleanTasksFrequency
YELLOW Areas (laboratories, blood transfusion service, radiodiagnostics, radiotherapy, nuclear medicine, mortuary, pathological anatomy, employee and non-employee changing rooms, storage rooms)Dusting, wiping to remove fingerprints and stains, and disinfection of all horizontal (furniture, equipment, medical supplies, including beds, tables, carts, etc.) and vertical surfaces (furniture, IV poles, both sides of doors, windows, switches, handles, etc.). Accessible areas cleaned without the use of ladders.Once to twice daily (7/7–14/7), as determined by each healthcare facility
Steel EquipmentCleaning of external parts of steel equipment (washing machines, autoclaves, dishwashers, etc.) using approved healthcare facility products.Once every 60 days
FloorsDust removal, cleaning (with disposable gauze if necessary), and disinfection upon request of all protected and unprotected floors.Once to twice daily (7/7–14/7), as determined by each healthcare facility
Deep CleaningThorough cleaning of all areas including moving furniture, cleaning walls, floors, fixtures, radiators, etc. Use of ladders if necessary.Once every 90 days
Sanitary FixturesCleaning, descaling, and disinfection of sanitary fixtures, washable walls, showers, shower stalls, accessories, etc.Weekly
High-Level SurfacesVacuuming, wet dusting, and cleaning of all aerial parts including lighting fixtures, radiators, air conditioning units, internal blinds, ceilings, etc.Frequency determined with each healthcare facility
Table 3. Cleaning areas, tasks, and frequency of orange areas.
Area/Item to CleanTasksFrequency
ORANGE Areas (border areas and access to red zones such as filter zones and changing rooms, possible studies and administrative offices attached to operating rooms, emergency room, non-intensive surgical and medical care area, hospice, clinics, consulting rooms, day hospital, level 3 microbiology laboratories (P3), storage rooms. The internal corridors, stairs, paths and all the toilets related to the aforementioned areas)Dusting, wiping to remove fingerprints and stains, and disinfection of all horizontal (furniture, equipment, medical supplies, including beds, tables, carts, etc.) and vertical surfaces (furniture, IV poles, both sides of doors, windows, switches, handles, etc.). Accessible areas cleaned without the use of ladders.Once to twice daily (7/7–14/7), as determined by each healthcare facility
Steel EquipmentCleaning of external parts of steel equipment (washing machines, autoclaves, dishwashers, etc.) using approved healthcare facility products.Once every 60 days
FloorsDust removal, cleaning (with disposable gauze if necessary), and disinfection upon request of all protected and unprotected floors.Once to twice daily (7/7–14/7), as determined by each Healthcare Facility
Deep CleaningThorough cleaning of all areas including moving furniture, cleaning walls, floors, fixtures, radiators, etc. Use of ladders if necessary.Once every 90 days
Sanitary FixturesCleaning, descaling, and disinfection of sanitary fixtures, washable walls, showers, shower stalls, accessories, etc.Weekly
High-Level SurfacesVacuuming, wet dusting, and cleaning of all aerial parts including lighting fixtures, radiators, air conditioning units, internal blinds, ceilings, etc.Frequency determined with each healthcare facility
Disclaimer/Publisher’s Note: The statements, opinions and data contained in all publications are solely those of the individual author(s) and contributor(s) and not of MDPI and/or the editor(s). MDPI and/or the editor(s) disclaim responsibility for any injury to people or property resulting from any ideas, methods, instructions or products referred to in the content.