1. Introduction
The Netflix series The Man with 1000 Kids presents Jonathan Meijer’s case, offering a modern illustration of the consequences of extreme reproductive behavior. Meijer, a prolific sperm donor, may have fathered up to 3000 children across various countries, circumventing regulations designed to prevent such occurrences. This case showcases how an individual’s disproportionate contribution to the gene pool can impact genetic diversity across entire populations. Another example is billionaire Pavel Durov, the founder of Telegram, who claimed to have fathered over 100 children through sperm donations made over the past 15 years. While uncommon, Meijer and Durov’s behaviors are not unique in human history. A notable parallel can be drawn with Genghis Khan, one of the most prolific men in recorded history. Approximately 8% of men living in a region of Asia may be direct descendants of Genghis Khan (
Zerjal et al., 2003). This corresponds to around 16 million men in modern-day populations. This figure was identified by tracing the Y-chromosome lineage, which is inherited from father to son.
Reproductive inequality likely emerged in the Pleistocene, when a small number of individuals fathered many offspring (
Betzig, 1986;
Foley, 1995). Today, reproductive disparities persist, as shown by recent studies in reproductive epidemiology (
López et al., 2024). We propose that such patterns follow a power-law distribution—what we term the Genghis Khan effect. The Pareto distribution, commonly used to model inequality in the social sciences (
Moral de la Rubia, 2025), effectively captures these dynamics.
Recent sequencing of paternal Y chromosomes (NRY) and maternal mitochondrial DNA (mtDNA) reinforces the persistence of male-biased reproductive inequality.
Lippold et al. (
2014) analyzed high-resolution NRY and mtDNA data from 623 males across 51 globally distributed populations and found that genetic differences among populations are significantly greater for the NRY than for mtDNA, consistent with historically higher female effective population sizes (Nf/Nm ratios). Their model-based simulations suggest that these disparities have persisted throughout human history and have recently intensified due to faster female demographic growth. These findings offer robust genomic evidence—free from previous methodological biases—supporting the conclusion that social and reproductive structures have long favored unequal male reproductive success, reinforcing patterns like those exemplified by the Genghis Khan effect (
Lippold et al., 2014). Furthermore, recent findings suggest that as reproduction increasingly shifts to later stages of life in high-income societies, genetic factors—once overshadowed by social and environmental conditions—are becoming more central to understanding human reproductive behavior and its intergenerational consequences (
Benonisdottir et al., 2024).
Some suggest that the shift to monogamy—encouraged by Christianity and widely adopted by the Middle Ages—likely reduced male competition, lowered crime rates, and increased paternal investment, contributing to more stable social structures and supporting genetic diversity (
Henrich et al., 2012). This change implies that cultural evolution may serve as an important mechanism in counterbalancing the detrimental effects of reproductive inequality. We propose that the one-man-one-woman marriage model can be represented by a normal distribution. Gaussian models have been effectively utilized in population genetics to analyze genetic association mappings, offering a robust framework for understanding genetic variations (
Kumasaka, 2024).
Research in genetics and evolutionary biology clarifies how reproductive inequality impacts genetic diversity and population stability (
Harpending & Rogers, 2000). Additionally, historical bottlenecks—often caused by migration events—can disrupt genetic diversity (
Amos & Hoffman, 2010). Migration, like the out-of-Africa migration that occurred around 60,000 to 70,000 years ago, has played a pivotal role in shaping reproductive inequality and genetic diversity (
Harpending & Rogers, 2000;
Stringer & Andrews, 1988;
Excoffier & Schneider, 1999). Another important migration was the peopling of the Americas, which began approximately 15,000 years ago and reshaped genetic diversity as
Homo sapiens crossed the Beringia land bridge (
Meltzer, 2010;
Cavalli-Sforza et al., 1994;
Excoffier & Schneider, 1999).
Recent studies using ancient DNA have further clarified how population bottlenecks have intensified the loss of genetic diversity. By sequencing the genomes of over 400 individuals from Viking Age archaeological sites,
Margaryan et al. (
2020) provided robust genomic evidence that bottlenecks in historical populations—especially those linked to migration and expansion events—were accompanied by significant reductions in genetic variation. Their analysis not only revealed gene flow from diverse regions into Scandinavia but also demonstrated how the Viking diaspora contributed to complex demographic shifts across Europe, suggesting accelerated diversity loss during episodes of cultural transformation.
Reproductive inequality is a recurring feature not only in human but also in non-human groups. In many species, particularly those with polygynous mating systems, a small number of males monopolize reproductive success, leading to a disproportionate genetic contribution from the elite few (
Clutton-Brock, 1988;
Betzig, 1986). This phenomenon of reproductive skew has been well-documented in species such as elephant seals (
Le Boeuf & Reiter, 1988), lions (
Packer et al., 1988), and primates (
Goodall, 1986).
However, unlike species where reproductive success is largely driven by biological dominance,
Homo sapiens groups are also influenced by cultural dynamics. Early human groups may have even practiced egalitarian hunter-gathering, but with the advent of agriculture, societies became more hierarchical, leading to greater reproductive inequality (
Woodburn, 1982;
Boserup, 1965;
Jethá & Ryan, 2010).
Arguably, the long-term success of
Homo sapiens depends heavily on maintaining genetic diversity, which is key to adaptability and survival. In this sense, reproductive inequality could represent an independent route to extinction, as a lack of genetic diversity would hinder
Homo sapiens’ ability to evolve and adapt, potentially leading to a population crash. This suggests the critical role that balanced reproduction, as seen in monogamous societies, plays in the long-term survival of the species. Populations with high reproductive skew experience faster genetic drift, leading to the loss of heterozygosity and accelerating population crashes due to inbreeding and reduced genetic diversity (
Harpending & Rogers, 2000;
Amos & Hoffman, 2010;
Kimura & Ohta, 1978). (Genetic drift is the random fluctuation in allele frequencies in a population over time, which can lead to a loss of genetic diversity, especially in small populations.) Theoretical models suggest that accumulating deleterious mutations in such populations can trigger a “mutational meltdown,” where declining genetic diversity increases genetic load, reducing fitness and survival (
Lynch & Gabriel, 1990;
Luikart et al., 1998).
Founder events, where a small group from a larger population establishes a new population, carrying only a subset of the genetic diversity of the original group, can also lead to reduced genetic variation (
Amos & Hoffman, 2010). Some models, such as the stepping-stone model (
Ramachandran et al., 2005), propose a sequence of founder events that progressively reduced genetic diversity, while others emphasize the two major bottlenecks previously mentioned: one during the out-of-Africa migration and another near the Bering Strait during the colonization of the Americas (
Amos & Hoffman, 2010;
Hellenthal et al., 2008). Furthermore, microsatellite data provide insights into such bottleneck events, with the stepwise mutation model explaining shifts in allele frequencies during changes in population size (
Kimura & Ohta, 1978) and identifying imbalances in heterozygosity (
Luikart et al., 1998;
Amos & Clarke, 2008). Therefore, the interaction between reproductive inequality and bottleneck events further accelerates genetic diversity loss.
Thus, this study employs a Pareto distribution to simulate conditions where a few individuals dominate reproduction. This approach aims to reveal if, and when, reproductive inequality might lead to a collapse of Homo sapiens, driven by genetic diversity loss and increased strain on environmental resources. Our research hypothesis is as follows:
Hypothesis 1. The Genghis Khan effect predicts that Paretian reproductive inequality accelerates genetic bottlenecks, increasing the likelihood of a Homo sapiens collapse.
We propose a mathematical model and run simulations to evaluate whether a collapse could occur under these conditions, and, if so, when it might take place. Specifically, the simulation tests whether genetic diversity, measured by heterozygosity and allele frequencies, declines more rapidly under reproductive inequality than under equal reproductive conditions.
Genetic diversity is just one of many factors shaping Homo sapiens population dynamics. Reproductive success, a cornerstone of fitness, allows individuals to pass on their genes, but higher reproductive rates can strain resources and affect sustainability. In species like Homo sapiens, where parental investment is significant, raising numerous offspring may reduce the care and resources each child receives, potentially lowering survival rates. Kin selection, where relatives help raise offspring, can support larger family sizes but often limits family size depending on environmental and social conditions. Cultural factors also impact reproductive behavior; norms around family size, inheritance, and the economic role of children evolve alongside biological pressures. Other key factors include carrying capacity and population ecology. Carrying capacity is the maximum population an environment can sustain indefinitely, based on available resources such as food, water, and shelter. Population growth is also influenced by density-dependent factors like food availability, predation, and disease, which become increasingly restrictive as populations grow. Nevertheless, despite the influence of such factors, our analysis centers on genetic diversity and long-term survival, with a particular focus on genetic bottlenecks.
Homo sapiens emerged approximately 300,000 years ago during the Pleistocene. To estimate the number of generations since then, we consider a typical generation length in pre-modern times to be around 25 years. Using an average of 25 years per generation, we can calculate the number of generations by dividing 300,000 years by 25, which results in 12,000 generations. This figure represents the entire period of Homo sapiens’ existence up to the present day.
Moreover, this study concentrates on the dynamics of sexual selection in evolution rather than natural selection. One justification for this focus is that the two processes operate through distinct mechanisms and follow separate evolutionary paths (
Da Silva, 2024). Sexual selection, driven by reproductive success and mate competition, directly influences reproductive inequality and genetic diversity, making it central to the hypotheses tested in this research. However, we acknowledge that natural selection—which is shaped by survival and environmental fitness—can interact with and modify sexual selection dynamics. While this study primarily explores the consequences of sexual selection, we recognize that the interplay between these two evolutionary forces may influence the overall population dynamics.
The role of reproductive inequality in human evolution has been widely debated among evolutionary biologists. Some argue that reproductive inequality accelerates evolutionary change by intensifying sexual selection; when a few individuals dominate reproduction, they pass on advantageous traits more rapidly, potentially enhancing population adaptability in the short term. Studies on primates and early human societies support this hypothesis (
Shultz et al., 2011), indicating that reproductive skew promoted strong selection pressures and aligns with the power law model, where certain individuals exert a significant influence on the gene pool. However, others contend that reproductive inequality endangers long-term genetic diversity (
Henrich et al., 2012). High reproductive skew can lead to genetic bottlenecks, compromising sustainability. Our study reconciles both hypotheses, suggesting that while reproductive inequality may have historically been adaptive, it accelerates genetic diversity loss and increases the risk of population collapse over time. Through a power law model, we show how disproportionate genetic contributions lead to rapid genetic drift, ultimately threatening population viability.
Frankham (
2005) reviewed evidence on how genetic factors, particularly inbreeding depression, loss of genetic diversity, and mutation accumulation, contribute to extinction risk. His analysis shows that in laboratory populations of naturally outbreeding species, both inbreeding depression and reduced genetic diversity increase the likelihood of extinction. Similar trends have been observed in wild populations, with case studies and computer simulations reinforcing the important role of genetic factors in driving extinction. Importantly, Frankham argued that most species live long enough for genetic factors to affect their survival, noting that mutation accumulation plays a smaller role due to the long time needed for its effects to emerge. He concluded that overlooking genetic factors results in underestimating extinction risk and developing potentially ineffective recovery strategies.
Recent insights from population genomics challenge the conventional reliance on neutral genetic diversity as a predictor of extinction risk.
Teixeira and Huber (
2021) argue that there is no simple relationship between neutral diversity and long-term population viability, emphasizing instead the need to account for functional genetic variation, ecological context, and demographic history. Their findings suggest that conservation strategies should prioritize understanding the genetic architecture underlying fitness and adaptation, rather than assuming that genome-wide diversity alone ensures resilience.
Genomic meta-analyses further emphasize the urgent need for genetically informed conservation efforts.
Shaw et al. (
2025) conducted a comprehensive global analysis across 628 species and revealed a statistically significant, ongoing loss of within-population genetic diversity over recent decades. Their findings indicate that such loss is not restricted to rare species but also affects common taxa, with birds and mammals showing particularly steep declines. Importantly, the study suggests that certain conservation actions—especially those improving habitat quality and restoring connectivity—can mitigate or even reverse genetic erosion, emphasizing the importance of integrating genomic data into conservation policy and practice.
The remainder of this paper is structured as follows:
Section 2 outlines the materials and methods, followed by the presentation of the simulation results in
Section 3.
Section 4 provides a discussion of the results, and
Section 5 concludes the paper.
2. Materials and Methods
2.1. Population Model
We model the human population with an initial size of 8 billion individuals, reflecting the current global population. The population is structured with genetic diversity based on a simplified two-allele model for a given gene (alleles A and a), representing a small, theoretical set of genetic markers to track across generations. The initial allele distribution in the population is set to: 25% homozygous dominant (AA); 50% heterozygous (Aa); 25% homozygous recessive (aa).
The population is simulated over 12,000 generations, representing the entire period of Homo sapiens’ existence up to the present. Assuming a 25-year generation span, this covers approximately 300,000 years.
To simplify, our model resets genotype frequencies each generation to fixed proportions (25% AA, 50% Aa, 25% aa), approximating Hardy-Weinberg equilibrium with equal allele frequencies. While this setup echoes Mendelian expectations, it does not simulate inheritance from parent genotypes. Instead, we abstract over individual-level transmission to focus on the population-level impact of reproductive skew on heterozygosity decay. This approach supports computational scalability to global population sizes (e.g., N = 8 × 10⁹) and isolates the impact of reproductive inequality on genetic erosion.
2.2. Reproduction Dynamics
To simulate the unequal reproductive success observed in certain individuals, we employ a Pareto distribution to model reproductive output, as observed. The Pareto distribution or power law distribution is characterized by a long tail. In a power law, the likelihood of a value decreases as that value increases, following an inverse relationship raised to a specific exponent. This means that when one quantity changes, the other adjusts by a consistent ratio, regardless of the initial magnitude. On a log-log plot, a power law appears as a straight line, with the slope of the line—known as the Pareto exponent
—measuring the strength of this relationship (
Clauset et al., 2009). Distributions rarely follow a power law across their entire range, typically adhering to it only between certain minimum and maximum values, which creates a “power law tail” (
Newman, 2005). The Pareto exponent is crucial in this context, as it determines the “thickness” of the distribution’s right tail. The thickness reflects the frequency of higher values: a lower Pareto exponent results in a thicker tail, indicating a greater prevalence of large values (
Jenkins, 2016).
In the simulation, we use two reproductive models: the Pareto model, representing unequal reproduction, and the Gaussian model, representing equal reproduction. For the Pareto model, the shape parameter α is set between 1.1 and 1.5 to reflect high reproductive inequality observed in certain species and historical human societies, with a lower α value corresponding to a thicker tail and thus higher inequality. The scale parameter is set at 1, ensuring that each individual produces at least one offspring while allowing for a few individuals to have disproportionately high reproductive success. In the Gaussian model, the mean reproductive output is set to the population replacement level, with variance adjusted to create minimal reproductive skew.
This reproductive model is implemented for each generation, allowing us to simulate how reproductive skew impacts genetic diversity over time.
2.3. Genetic Inheritance
Each offspring inherits genetic traits based on Mendelian inheritance: each parent passes one allele (either A or a) to the offspring, resulting in combinations of AA, Aa, or aa.
If both parents are heterozygous (Aa), offspring have a 25% chance of being homozygous dominant (AA), 50% chance of being heterozygous (Aa), and 25% chance of being homozygous recessive (aa).
The distribution of alleles is tracked across generations to evaluate the change in allele frequencies and heterozygosity in the population.
The model for Mendelian inheritance is based on well-established principles of genetic transmission, where offspring inherit one allele from each parent (
Griffiths et al., 2007). Recent research underscores that preserving genome-wide genetic variation remains the most reliable strategy for preventing inbreeding depression and sustaining adaptive potential.
Kardos et al. (
2021) show that genome-wide diversity is a strong predictor of population viability, outperforming gene-targeted conservation approaches. Their simulations and empirical data suggest that populations with reduced variation face increased drift load and diminished evolutionary potential, even if purging of deleterious alleles occurs. These findings reinforce the importance of measuring and maintaining heterozygosity as a proxy for genetic health in conservation efforts.
2.4. Carrying Capacity and Survival
We introduce a global carrying capacity of 10 billion individuals, reflecting the Earth’s current limits on resources (food, water, space). This concept of carrying capacity follows the classical ecological framework (
Cohen, 1996). If the simulated population exceeds 90% of the carrying capacity, survival constraints are imposed to limit growth. This models real-world pressures that constrain population growth when resources are scarce.
Cohen (
1996) examines various estimates of Earth’s carrying capacity, emphasizing the resource constraints posed by food, water, and space. He observes that estimates can vary significantly depending on technological, social, and ecological factors, but they generally fall between 8 billion and 12 billion people, based on current patterns of resource consumption and distribution. These calculations underpin our assumption that Earth’s carrying capacity is approximately 10 billion people.
2.5. Population Crash Criteria
The simulation monitors key indicators to predict whether and when the population might collapse due to genetic diversity loss or surpassing environmental limits. The criteria for a population crash are: (1) Genetic bottleneck: a crash is predicted if heterozygosity drops below 10%, indicating a severe reduction in genetic diversity, which can lead to inbreeding depression and reduced adaptability. (2) Exceeding carrying capacity: a crash is also considered if the population consistently exceeds 90% of the carrying capacity over multiple generations, leading to resource depletion and increased mortality.
2.6. Data Collection and Analysis
For each generation, we record the following metrics: (1) Population size: tracked to monitor overall growth and the effects of environmental constraints. (2) Heterozygosity: the proportion of heterozygous individuals (Aa) is calculated for each generation as an indicator of genetic diversity. (3) Allele frequencies: the frequency of each allele (A and a) is tracked to monitor changes in the genetic structure of the population.
2.7. Modeling and Calibration
We calculate the timing of Homo sapiens population crashes by comparing the Pareto model, which represents unequal reproduction, with the Gaussian model, representing equal reproduction. This should be regarded as a calibration exercise rather than a prediction.
We set the parameters as follows: initial population size = 8 × 10⁹; carrying capacity = 1 × 10¹⁰; reproductive time span = 12,000 generations, representing the total span of Homo sapiens’ existence; critical heterozygosity threshold = 10% of original heterozygosity, which, when reached, leads to a population crash due to genetic bottlenecks and inbreeding; and the rate of genetic drift is dependent on the type of reproductive distribution.
For the power law reproduction model (Pareto distribution), the key dynamics are as follows.
Loss of heterozygosity is modeled as:
where
is the shape parameter (Pareto exponent). We assume
= 1.2, indicating high reproductive inequality. For example, starting with an initial heterozygosity
= 1 and assuming the critical heterozygosity threshold
= 0.10, the simulation shows that heterozygosity declines quickly due to the unequal reproductive contributions of a small portion of the population.
In the Pareto model, genetic diversity is depleted more rapidly, and the population reaches the critical heterozygosity threshold after generations. Given the extreme reproductive skew, a crash may occur earlier in the 12,000-generation timespan.
In the normal distribution model, loss of heterozygosity is modeled as:
where
is a constant based on population size and reproductive dynamics. For example, starting with the same initial heterozygosity
= 1 and critical threshold
= 0.10, the normal distribution model predicts a more gradual loss of genetic diversity.
After running the simulation for generations, the population reaches the heterozygosity threshold much later than in the Pareto model. As a result, the population crash occurs after generations, with . This model finds a longer survival time for Homo sapiens due to the slower depletion of genetic diversity.
Thus, the shared parameters for both models are: initial population size = 8 billion; carrying capacity = 10 billion; initial heterozygosity = 1 (normalized initial genetic diversity); critical heterozygosity threshold = 0.10 (10% of initial heterozygosity); generations = 12,000. In the Pareto model, we simulate the decline of heterozygosity generation by generation using the Equation (1) for . We identify the crash point by tracking the generations until heterozygosity reaches = 0.10. A similar process is followed for the Gaussian model, where we use the Equation (2) for to model the decline of heterozygosity over time.
Table 1 outlines the key steps involved in simulating reproductive dynamics and genetic diversity over generations using either the Pareto or Gaussian distribution. Each step is crucial for tracking population size and heterozygosity until a population crash or the simulation concludes.
3. Results
We find that, under the Pareto model, a population crash is expected after approximately 3000 to 5000 generations, whereas, for the Gaussian model, the crash occurs after 8000 to 10,000 generations. Assuming an average generation length of 25 years, the Pareto model predicts a crash after 75,000 to 125,000 years, while the Gaussian model predicts a crash after 200,000 to 250,000 years. This corresponds to approximately the year 77,024 to 127,024 AD for the Pareto scenario and year 202,024 to 252,024 AD for the Gaussian scenario. These estimates illustrate how reproductive inequality accelerates the loss of genetic diversity, leading to a faster population crash in the Pareto model compared to the Gaussian model. Again, these values should not be interpreted as exact predictions; rather, they serve to illustrate the fact that Y > X.
Even with a normal distribution of reproduction, a population crash can still occur as genetic diversity inevitably declines over time due to genetic drift and external pressures. In the Gaussian model, reproduction is more balanced, slowing the loss of heterozygosity compared to the Pareto model. However, as generations pass, fluctuations in allele frequencies and finite population size gradually reduce genetic diversity. Environmental stresses, such as disease, resource limitations, and climate changes, further strain the population. Over time, these combined factors can erode genetic diversity and lead to a population crash once adaptability is compromised.
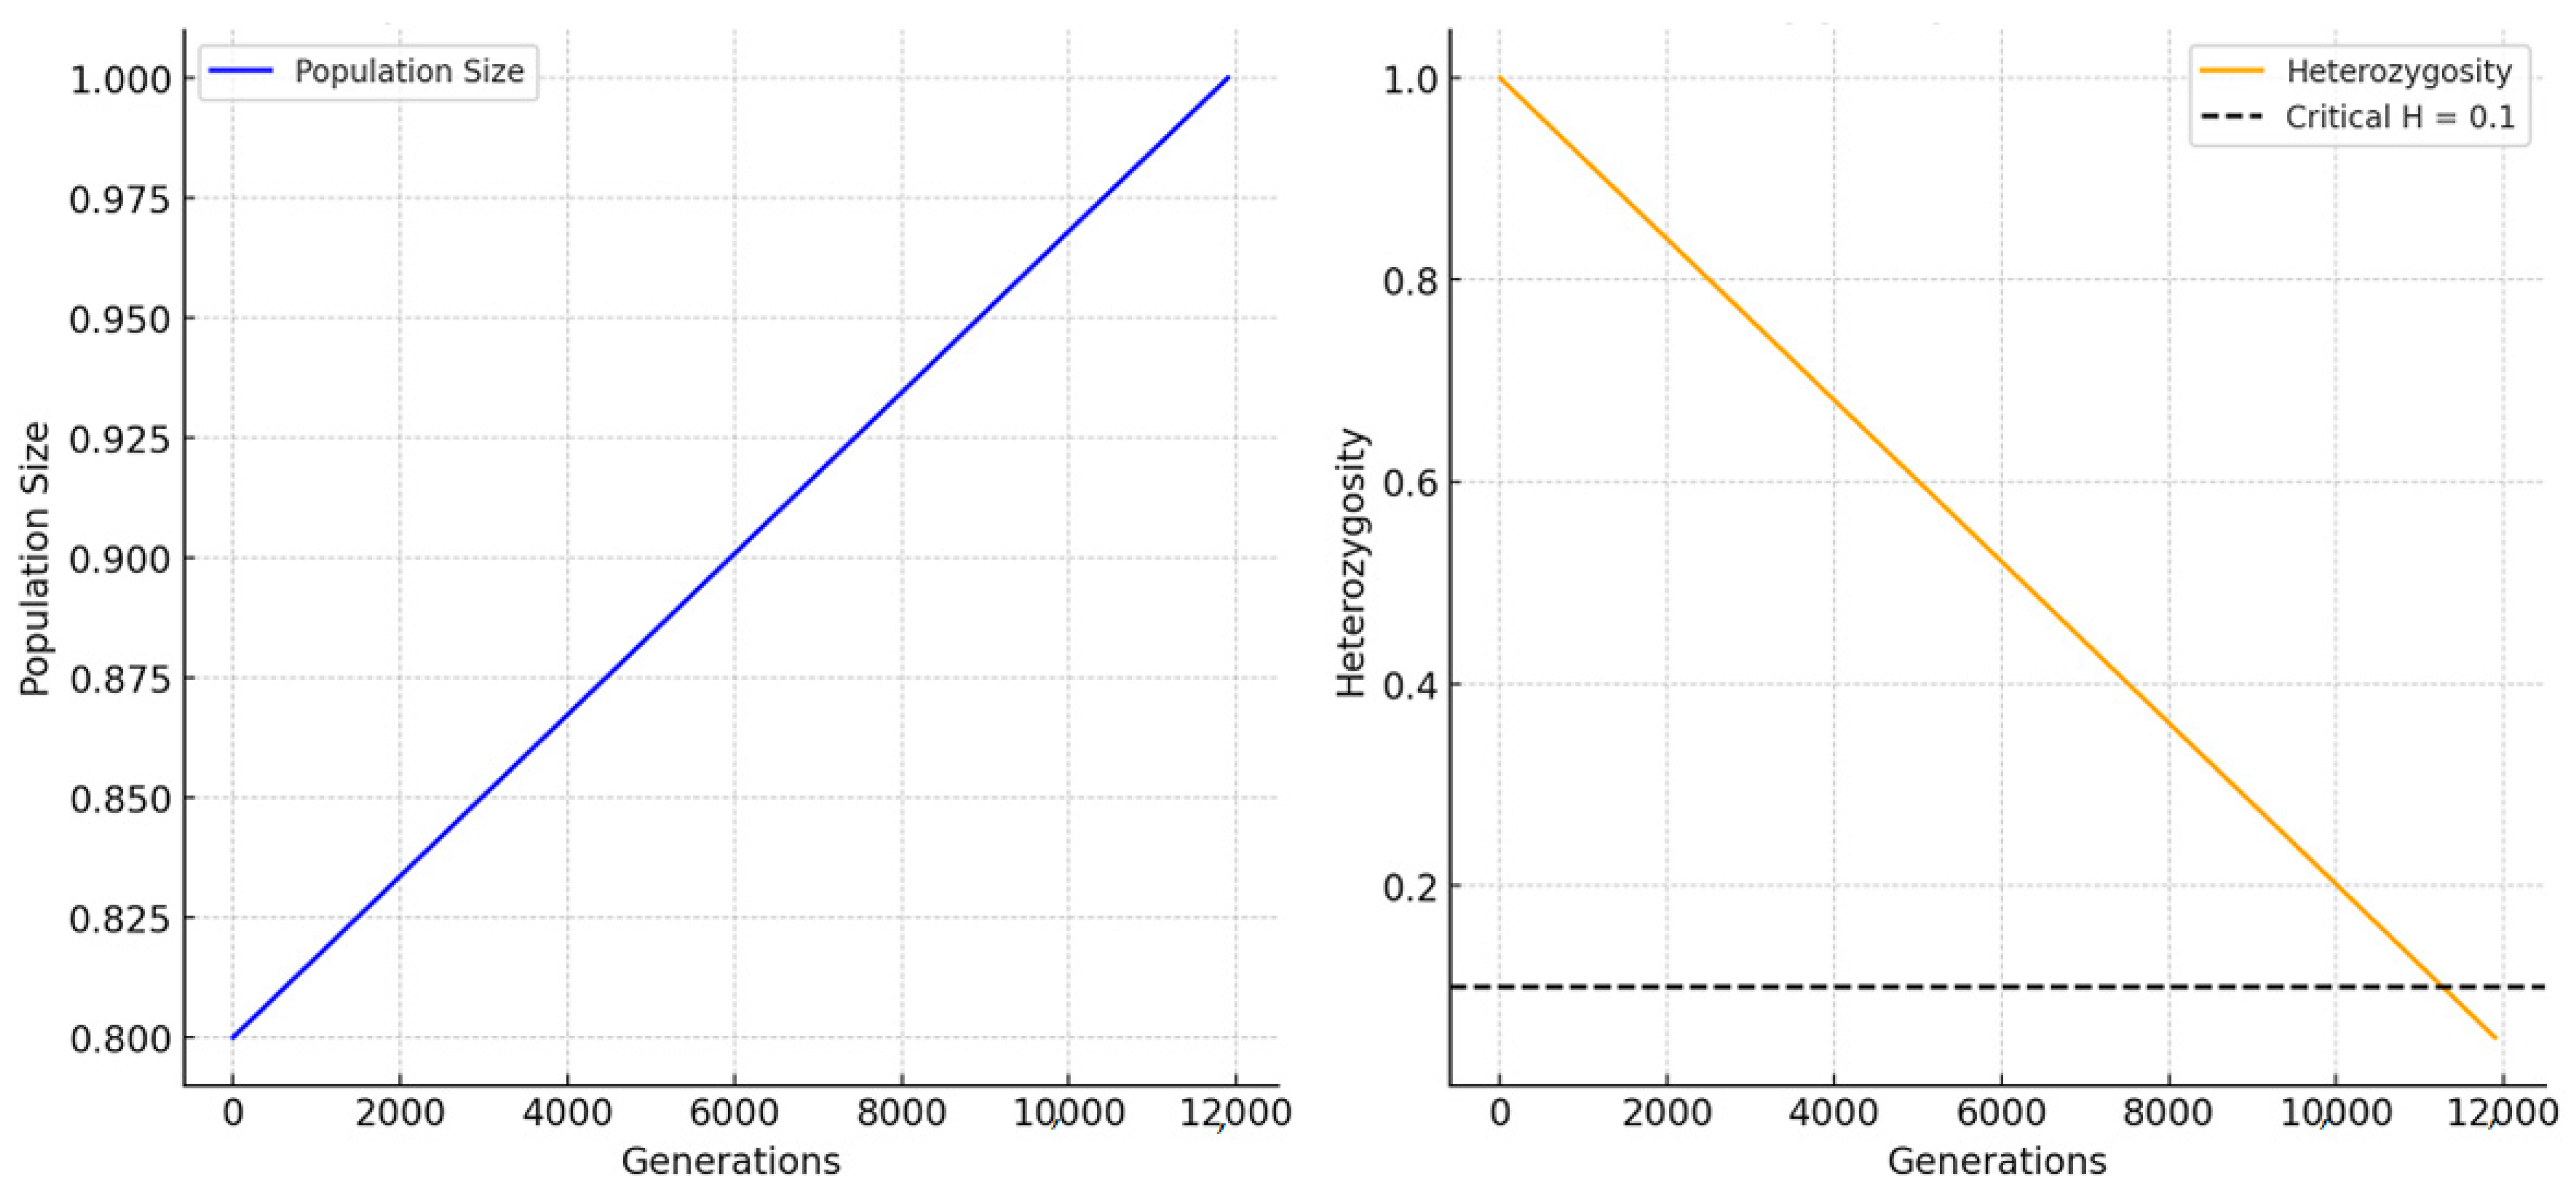
Figure 1 illustrates how population size evolves over 500 generations. The spike observed in the Pareto distribution is a result of its dynamics. This unequal reproductive success creates bursts of high offspring production in certain generations. A spike can occur when a few highly reproductive individuals produce an unusually large number of offspring, temporarily increasing population size. Additionally, while the population is constrained by the carrying capacity, if reproduction surges but remains below this limit, the population can briefly expand. Once the population reaches carrying capacity or external factors (such as heterozygosity loss) take effect, growth stabilizes or declines. In stochastic simulations like this, genetic drift and random fluctuations in reproduction can lead to noticeable spikes.
Figure 2 illustrates the abrupt decline in heterozygosity at the beginning of the simulation in the Pareto model, followed by a period of relative stability. This pattern can be attributed to several factors related to the genetic model’s initial conditions and dynamics. At the start of the simulation, the population experiences genetic drift, where random fluctuations in allele frequencies occur due to the small population size, causing a rapid loss of heterozygosity. This early loss mirrors a founder effect, where a small, isolated population quickly loses genetic diversity. In the Pareto model, unequal reproductive success leads a few individuals to dominate the gene pool in early generations, further accelerating the decline in heterozygosity. As the population progresses, genetic diversity stabilizes once most individuals share a similar genetic makeup (fewer heterozygotes), and changes in heterozygosity slow down. This is because, at this point, further genetic drift or reproduction has a diminished impact on allele frequencies. Additionally, as the population nears its carrying capacity, allele frequencies stabilize, and significant shifts in genetic diversity become less likely. Early bottlenecks may have caused rapid diversity loss, but once these effects stabilize, the population retains its remaining diversity, resulting in relatively constant heterozygosity. In summary, the initial rapid decline in heterozygosity is driven by early genetic drift and the disproportionate reproductive success modeled by the Pareto distribution. After this loss, heterozygosity stabilizes as allele frequencies reach equilibrium, where genetic changes occur at a much slower pace. This behavior is typical of population genetics models with unequal reproduction, where rapid early changes give way to slower genetic shifts over time.
The results in
Figure 1 and
Figure 2 align with the established population genetics literature, particularly on reproductive inequality, genetic drift, and carrying capacity. These findings will be further discussed in the following section. Fluctuations in population size, including the observed spike, reflect models of unequal reproductive success, where a few individuals contribute disproportionately to the gene pool, causing periods of rapid reproduction followed by stabilization. The general stabilization of population size supports models incorporating carrying capacity, where growth slows as environmental constraints limit expansion.
The initial rapid decrease in heterozygosity is consistent with genetic drift effects in small or highly unequal populations, similar to the founder effect where genetic diversity quickly drops. This rapid loss of diversity stabilizes over time as the population reaches a lower equilibrium, becoming more genetically homogenous, a pattern seen in bottlenecked populations.
Populations with unequal reproduction are especially vulnerable to heterozygosity declines, exacerbating genetic drift. Studies on carrying capacity and population dynamics confirm that, as populations near their environmental limits, growth slows, and fluctuations decrease. Overall, these results support established theories in population genetics regarding genetic drift, reproductive inequality, and environmental limits on population dynamics (
Wright, 1931;
Nei et al., 1975).
4. Discussion
Our approach can receive support from the literature on population dynamics, reproductive inequality, genetic drift, and heterozygosity.
Wright (
1931) explains how genetic drift in small populations leads to rapid genetic diversity loss, as seen in the founder effect (
Figure 2).
Nei et al. (
1975) expand on bottleneck effects and the decline in heterozygosity, which eventually stabilizes, similar to our simulation results (
Figure 2).
Charlesworth and Charlesworth (
2010) and
Crow and Kimura (
1970) examine how reproductive inequality accelerates genetic drift and early heterozygosity loss, consistent with the Pareto model.
Verhulst (
1838) introduced the logistic growth model, showing population stabilization near carrying capacity, while
May (
1976) explored how carrying capacity affects population fluctuations. Studies by
Luikart et al. (
1998) and
Harpending and Rogers (
2000) describe bottlenecks causing rapid genetic diversity loss before stabilization (
Figure 2).
Bateman (
1948) and
Wade and Shuster (
2004) highlight reproductive skew, where unequal reproductive success accelerates genetic diversity loss and potential population crashes, reinforcing the dynamics of our Pareto model.
The simulations do not account for several factors mentioned in the Introduction that could alter the calibration outcomes. For instance, migration could introduce new genetic diversity, affecting genetic drift and heterozygosity loss. Technological and medical advancements may enhance the population’s ability to adapt to environmental pressures, reducing the likelihood of a crash. Assisted reproductive technologies (ART) have increasingly influenced patterns of reproductive variance in modern societies, especially through their impact on fertility treatment outcomes. A recent meta-analysis (
Almasi-Hashiani et al., 2019) finds that ART use is significantly associated with a 1.71-fold increased risk of preeclampsia in pregnant individuals compared to spontaneous conception. This showcases not only the medical implications of ART but also its potential demographic effects, particularly in skewing reproductive success through medical intervention and extending reproductive opportunities in previously infertile populations (
Almasi-Hashiani et al., 2019). Moreover, conservation biology implications are significant for species with high reproductive skew, like marine mammals and large carnivores. Minimizing skew may help maintain genetic diversity and reduce crash risks. Furthermore, cultural shifts in human societies, such as equal reproductive contributions, sustain diversity over time. Monogamy and societal norms also stabilize genetic diversity through balanced reproduction. Policies promoting genetic diversity could further mitigate the effects of reproductive inequality. Additionally, natural selection could favor individuals with higher genetic diversity, preserving it and extending population survival. If incorporated, these factors could significantly influence the predicted timeline for a population crash. Future research should consider gene flow, mutation rates, and genetic drift to improve crash predictions under the framework of the Pareto model.
While this study focuses on sexual selection, natural selection may also favor individuals with greater genetic diversity, counteracting some effects of reproductive inequality. Darwin’s principles of sexual selection have been instrumental in understanding reproductive dynamics across species. Research on Drosophila shows that sexual selection often leads to intra-sexual competition, where males compete for mates, creating reproductive inequality as some males contribute disproportionately to the gene pool (
Bateman, 1948). This dynamic, central to the Genghis Khan effect, provides insight into similar processes in human societies and the long-term genetic consequences of reproductive inequality. Experiments on Drosophila show that males exhibit greater variance in reproductive success than females—a pattern reflected in humans, where males with higher mating success heavily influence future generations, paralleling the reproductive dynamics in hierarchical human societies (
Jethá & Ryan, 2010). These findings illustrate how intra-sexual selection intensifies reproductive inequality, potentially accelerating population declines, as seen in our Pareto model.
The Bateman principle (
Bateman, 1948) has long provided a foundation for understanding why reproductive inequality is common in sexually reproducing species. Bateman’s principle posits that in many species, females invest more heavily in offspring (e.g., through gestation or parental care), while males maximize their fitness by mating with as many females as possible. This leads to sexual selection, where certain males achieve high reproductive success while others are left out, contributing to reproductive inequality.
Sexual selection can outweigh natural selection when the variance in male reproductive success becomes the dominant factor in fitness (
Wade & Shuster, 2004). We suggest that the Genghis Khan effect, driven by sexual selection, is a widespread feature across species with significant implications for genetic diversity and population survival. Contrary to
Zerjal et al. (
2003), this effect is not a unique form of social selection arising from human behavior; rather, it is an inherent outcome of sexual selection itself. Sexual selection creates sharp disparities in reproductive success, with males competing for mates and females making selective choices. In many species, males invest little beyond sperm, leading to pronounced reproductive inequality. This dynamic, common across species, stems from differences in parental investment (
Trivers, 1972). Where male investment in offspring is low, competition for mates intensifies, allowing a few males to dominate reproduction while others are excluded, thereby accelerating the loss of genetic diversity. Male reproductive success often varies more widely than female success, heightening the reproductive skew observed in our model. Over time, such skewed reproduction further depletes genetic diversity, especially in populations with high reproductive inequality.
Finally, randomness in evolutionary success complicates the predictions of the Pareto model. While extreme reproductive inequality accelerates genetic diversity loss, chance events also play a role in shaping population dynamics. In scenarios where natural and sexual selection are in tension, survival can depend on luck rather than fitness (
Da Silva, 2024), adding unpredictability to population crash timelines. This shows the importance of considering stochastic factors in human evolution models, especially under extreme reproductive inequality. Chance and selection interact to influence genetic diversity and, thus, random events may alter the outcomes predicted by the Pareto distribution.
For instance, all current haplogroups can be traced back to specific individuals who successfully transmitted their Y-chromosomes or mitochondrial DNA through continuous lineages to the present. These individuals were evolutionarily successful, as their lineages endured while many others died out, leaving no descendants. Throughout human history, events such as population bottlenecks (drastic reductions in population size) and genetic drift (random changes in allele frequencies) have significantly influenced genetic diversity. During bottleneck events, many lineages became extinct due to the decreased population size, while only a few managed to survive and expand. This greatly reduced the genetic variation passed down to future generations. Population geneticists use models based on coalescent theory to estimate how many lineages have gone extinct over time (
Wakeley, 2008). Coalescent theory traces lineages backward in time, helping to infer how many lineages were needed to produce the haplogroups observed today. The theory accounts for factors such as mutations, population size, and migration patterns. According to these models, most ancient lineages likely did not survive. Estimates suggest that over 90%, and possibly as much as 95%, of male lineages have gone extinct in the past tens of thousands of years, leaving only a small fraction that persists in today’s Y-DNA haplogroups (
Karmin et al., 2015). Given that success often results from a combination of talent and luck—and extreme success requires substantial luck—one could argue that the survival of a minority of haplogroups indicates that human evolution has been more about “the survival of the luckiest” rather than strictly “the survival of the fittest” (
Da Silva, 2024). Since extreme success leans heavily on luck, Genghis Khan’s descendants owe their survival to chance rather than fitness—making efforts to curb reproductive inequality not just justified, but essential.
Our model assumes a fixed carrying capacity and applies it deterministically, with the population size capped once the threshold is reached. While this simplification allows for analytical tractability and highlights the isolated effect of reproductive inequality on genetic erosion, it does not capture potential demographic fluctuations such as environmental shocks, episodic mortality, or resource-driven population oscillations. These stochastic effects can substantially impact small populations through mechanisms like demographic stochasticity and random drift. However, in the large population sizes considered in our simulations (
N ≈ 10
9), such random fluctuations are buffered by sheer population scale and have limited impact on overall heterozygosity dynamics (
Kliman et al., 2008). Nevertheless, extending the model to include temporally variable or stochastic carrying capacities would improve biological realism, particularly for applications to smaller, structured, or endangered populations.
While our simulations abstract away from many real-world evolutionary forces—including selective pressures, mutation processes, and environmental mortality factors—this simplification was intentional. Our aim was to isolate the effects of reproductive inequality on heterozygosity loss and population viability under a neutral model. By modeling a panmictic population without bottlenecks or selection, we establish a conceptual baseline that reveals how skewed reproductive success alone can lead to accelerated genetic erosion. Future extensions could incorporate additional mechanisms such as beneficial mutations, structured populations, and sex-specific reproductive variance to explore their interactions with the Genghis Khan effect more comprehensively.
Our model simplifies genetic inheritance by reinitializing genotype frequencies at each generation using fixed proportions (25% AA, 50% Aa, 25% aa), rather than simulating full Mendelian transmission from parents to offspring. While this setup loosely reflects Mendelian expectations, it does not track genotypes across generations. This abstraction was chosen to enable computational scalability to global population sizes (N = 8 × 10⁹) and to isolate the population-level consequences of reproductive skew on heterozygosity decay. Although this approach omits biological complexities such as recombination, mutation, and multilocus dynamics, it serves as a conceptual baseline to illustrate the fundamental effects of reproductive inequality on genetic drift.
5. Conclusions
This study provides key insights into the long-term impact of reproductive inequality on the survival of Homo sapiens, contrasting a Pareto model of unequal reproduction with a Gaussian model of equal reproduction. Our simulations reveal that extreme reproductive inequality, referred to here as the Genghis Khan effect, accelerates the loss of genetic diversity and increases the likelihood of a population crash. These findings align with existing theories in population genetics, particularly those concerning the effects of genetic drift and bottlenecks in small, isolated populations.
The Genghis Khan effect shows how reproductive inequality can rapidly deplete genetic diversity, making populations more vulnerable to environmental pressures, resource depletion, and genetic drift. Even in the Gaussian model, which features more balanced reproduction, genetic diversity is still lost over time, although at a slower rate. This shows the critical role of maintaining genetic diversity to delay the demise of Homo sapiens.
However, the broader context of human evolution suggests that other factors, such as migration, cultural shifts, and technological advancements, may mitigate these outcomes. Future research should focus on incorporating these factors into the Pareto model to provide a more comprehensive view of human population dynamics and sustainability. Historical examples of population bottlenecks, such as those experienced by early humans during the out-of-Africa migration, show that migration can interfere with genetic diversity and the rate of heterozygosity loss. In modern times, cultural shifts toward monogamy and technological advancements in medicine and genetics may further alleviate the pressures caused by reproductive inequality. For instance, medical technologies like assisted reproductive technologies and genetic screening could help maintain genetic diversity even in populations facing strong reproductive inequality. In addition, this study focuses solely on sexual selection, overlooking its interaction with natural selection, which could potentially offset the effects of reproductive inequality. Finally, policy interventions could also help reduce reproductive inequality. Nonetheless, assuming these factors remain constant, our findings suggest the risks of unchecked reproductive inequality, stressing its role in accelerating population crashes and hastening the demise of Homo sapiens—a phenomenon we refer to as the Genghis Khan effect.


