Abstract
The present study collected a larger set of three-dimensional data on human crania from the Kofun period (as well as from previous periods, i.e., the Jomon and Yayoi periods) in the Japanese archipelago (AD 250 to around 700) than previous studies. Three-dimensional geometric morphometrics were employed to investigate human migration patterns in finer-grained phases. These results are consistent with those of previous studies, although some new patterns were discovered. These patterns were interpreted in terms of demic diffusion, archaeological findings, and historical evidence. In particular, the present results suggest the presence of a gradual geological cline throughout the Kofun period, although the middle period did not display such a cline. This discrepancy might reflect social changes in the middle Kofun period, such as the construction of keyhole-shaped mounds in the peripheral regions. The present study implies that a broader investigation with a larger sample of human crania is essential to elucidating macro-level cultural evolutionary processes.
1. Introduction
Humans are incredibly adaptable and versatile. Various theories have emphasized human plasticity in behavior, cognition, and learning abilities [1,2,3]. Morphologies can also respond to diverse environments and can be modified during ontogeny, resulting in individual differences despite having the same genetic background. Despite these considerations, it has been argued that physical traits provide insight into biological trajectories to a certain extent [4,5,6,7,8]. Furthermore, morphometric research offers unique advantages compared to DNA studies: it is easier to obtain larger and less biased samples, especially in the context of Japanese prehistory. Therefore, anthropologists continue to investigate human morphological traits to glean clues regarding human evolutionary pathways [4,5,6,7,8,9,10,11,12].
The present research relies on a significantly larger sample of three-dimensional (3D) data from ancient human crania in the Kofun period of the Japanese archipelago to infer human macro-scale population patterns than previous relevant research. While the collection of 3D data is becoming increasingly popular in various disciplines, smaller samples have often been employed in biological anthropology owing to technological challenges (i.e., time, effort, and costs associated with obtaining precise 3D data reconstruction) [5,7]. Three-dimensional models offer richer information than traditional 2D data, although adequate information for estimating macro-scale patterns may not be obtained from restricted samples. Furthermore, 3D models are gaining traction in many disciplines, including biology, archaeology, and anthropology, while quantitative analyses remain relatively rare, primarily because of limited sample sizes.
The Kofun period, the focus of this research, represents a state formation or early state period that followed the Yayoi period (800 BC–AD 250) [13,14]. Archaeological and anthropological evidence suggests that during the Yayoi period, agriculture spread across the Japanese archipelago, social hierarchies became clearer than in the Jomon period (13,000 BC–800 BC), and warfare began [15,16,17]. In the subsequent Kofun period, social hierarchies were further strengthened, and a central political organization was established, particularly around the Kinki region (Figure 1), resulting in increased stability within Japan [13,14]. In the early phase (mid AD 250–375), larger Kofuns, typically the zenpou-kouen fun or keyhole-shaped mounds, were mainly constructed around the Kinki region. Subsequently, in the middle phase (375–500), larger Kofuns were also built in peripheral regions, including the Sanyo, Kyushu, Kanto, and Tohoku regions. In the late phase (500–600) and the final phase (after 600 to around 700), a few large keyhole-shaped mounds were observed. Instead, clustered circle or square mounds, as well as tunnel tombs, were constructed in many regions. Given their sizes and the presence of richer grave goods, many agree that these larger mounds served as burials for individuals of power during that period [13,14,18]. This Kofun period is of significant importance in unraveling the processes through which states and civilizations were established in the ancient Japanese archipelago.
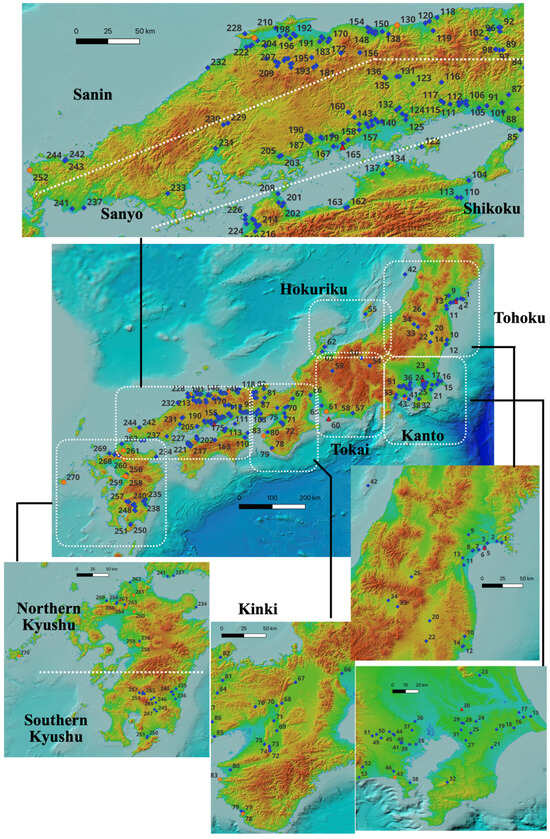
Figure 1.
Sites investigated in the present research: Red triangles represent Jomon sites, orange circles represent Yayoi sites, and blue rhombi represent Kofun sites. See the below table for the site name and phase. The map is based on the color altitude map published by the Geospatial Information Authority of Japan with information of the sea area from the Hydrographic and Oceanographic Department, Japan Coast Guard, and modified by HN using QGIS (3.20.3).
Previous research compared traditionally measured biodistances from the Kofun period from different regions of the Japanese archipelago to infer regional populational interactions. Possible explanations for the several geographic disparities discovered were examined. For instance, it has been claimed that a geographical cline in the biodistances between Northern Kyushu and eastern areas during the Kofun era may be explained by the migration of people from the Korean peninsula, who then had an impact on people in the Japanese archipelago [19,20,21,22,23,24,25].
However, some concerns have persisted. First, earlier studies did not examine finer or more precise time periods, such as early, middle, late, and final. We should investigate cranial differences in finer sub-periods since the Kofun period spanned over 400 years [25]. In this study, the Kofun period was divided into three sub-periods: early, middle, and late (including final). Second, additional archaeological evidence must be coupled with anthropological data to fully understand the underlying cultural evolutionary processes. Although previous studies did not mention spatiotemporal changes in archaeological remains such as pottery or burial patterns and historical records, because such evidence is also critical for inferring and understanding demic and relevant cultural diffusion, synthetic perspectives are required. Third, as previously indicated, when 3D models are employed, the sample sizes are often small. The current study interprets substantially larger samples of anthropological data by referring to archaeological information to estimate the cultural macro-scale evolutionary processes in the Japanese archipelago during the Kofun period.
2. Materials and Methods
We collected 3D data on human crania from the Kofun period, spanning the Tohoku to Southern Kyushu regions (Figure 1 and Table 1). The total number of samples was 693, including individuals over fifteen years old because it is more difficult to estimate sexes under fifteen-year-old individuals [26,27]: 264 females, 421 males, and 8 of unknown sex (Table 2). This dataset also incorporates samples from the previous Jomon period (14,000 BC to 800 BC) and the Yayoi period. The inclusion of samples from the Jomon and Yayoi periods allowed for the investigation of continuous or discontinuous changes from these earlier periods (see Table 1 and Supplementary Table S1 for more detailed information). Notably, samples from the Northern Kyushu region are relatively limited because certain institutions do not grant permission to examine crania. However, the samples collected in this study were sufficient to achieve the intended objectives. It is important to note that the samples from the Kofun period were generally excavated from various types of kofuns (with the exception of samples from the Nashikibata site in the Tohoku region), suggesting that they likely held relatively higher social ranks.

Table 1.
Summary of archaeological sites used in this study.
Table 2.
The number of the samples.
Three types of laser scanners (i.e., AMETEK Creaform HandySCAN BLACK, HandySCAN BLACK™ | Elite (Berwyn, PA, USA), and Shining 3D Einscan Pro HD (Hangzhou, China)) and SfM/MVS, based on two-dimensional photos, were used to collect 3D data. Previous research has confirmed that 3D models reconstructed using these methods do not exhibit significant differences and maintain fidelity to the original crania [28,29,30]. Given that the original 3D models consist of numerous meshes, making subsequent analyses challenging, we reduced the number of meshes to 1% to 10% of the original using Meshlab [31]. The reduction rates were determined based on the original mesh sizes, which varied depending on the method used. Additionally, it has been demonstrated that the reduced models generated using Meshlab remain highly similar to the original ones [32].
Landmark-based geometric morphometrics (GM) and principal component analysis (PCA) were used to examine the reduced 3D models. For the analysis, we used R (version 4.2.1) and R studio (2022.07.0 + 548) as well as the geomorph package (version 4.0.4) in R [33,34,35]. Representative and/or less confusing thirty-one points were selected as landmarks from the traditional craniometric points [36], and were located on the 3D models (see Figure 2 and Table 3 for the selected landmarks). The geometric configurations of the landmarks were analyzed using GM and PCA.
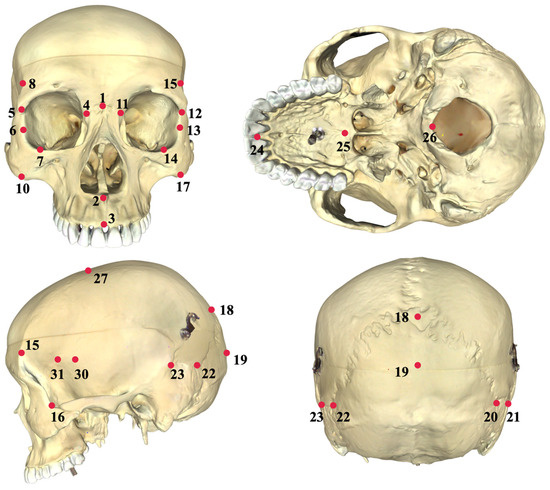
Figure 2.
Landmark locations. The 3D model is based on the SH-7 model by KYOTO KAGAKU. The numbers correspond to those in Table 3.
Table 3.
The selected Landmarks. 9, 28, and 29 are not depicted in Figure 2.
PCA was used to examine the geometric arrangement of the identified landmarks. We attempted to compensate for missing parts in the 3D models by inverting the reserved parts along the median line via the nasion, prosthion, and bregma, following previous relevant research [29,37,38]. If missing pieces could not be rebuilt using the methods described above, we used the geomorph package’s estimate.missing function, based on the thin-plate-spline method [33].
Sexes and ages of samples are mainly based on published excavation reports. When no information was given, we determined them by examining the pelves and crania (including post-cranial features and sizes of the zygomatic arch and mastoid process) for sexes [39], the facies symphysialis [40], and the cranial suture for ages [41,42] because they are standard ways of estimating the sexes and ages of the Japanese human skeletal remains [27].
We analyzed the 3D data in two main steps. In Study 1, 3D data encompassing the Jomon to Kofun periods were included to investigate diachronic morphological changes during the prehistoric and ancient periods in Japan. In Study 2, we specifically examined the 3D data using the Yayoi and Kofun periods (see Supplementary Table S2 for the details), narrowing our focus to the spatiotemporal morphological changes observed during the Kofun period.
3. Results
3.1. Study 1
The results of the PCA showed that the cumulative contribution rates exceeded 75% by the Principal Component (PC) 20 (Table 4). To conserve space, we focused on PCs 1–6 that accounted for >5% each. PC1 was primarily related to vertical facial and occipital height, temporal length, and width. PC2 encompasses facial oblique height and width, occipital height, and length. PC3 primarily correlates with the anterior–posterior position of the teeth and occipital height, while PC4 is related to facial oblique height. PC5 was mainly related to occipital height, while PC6 was linked to facial width and occipital length (Figure 3). Notably, individuals in the Jomon period tended to have wider and lower faces and longer occipital and temporal regions.
Table 4.
Contribution rates of the PCA results in each Study.
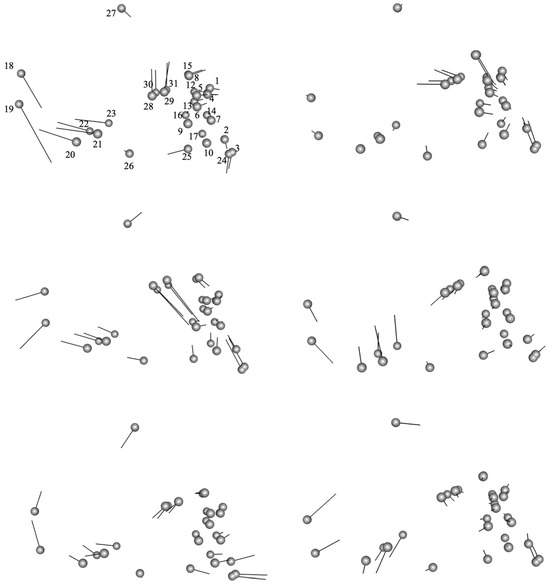
Figure 3.
Configurational changes in landmarks captured by each PC in Study 1. From top to bottom: PC1 to PC3 in the left column, and PC 4 to PC6 in the right columns. Each screenshot captures the right side of the crania. The numbers in PC1 correspond to the ones in Table 3. The bars from the points indicate the degree of change according to each PC.
Temporal variations were clearly observed between the Jomon people and the Yayoi or Kofun people in PC1 (Figure 4). Noteworthy, no significant differences between the sexes were observed (Supplementary Figure S1).
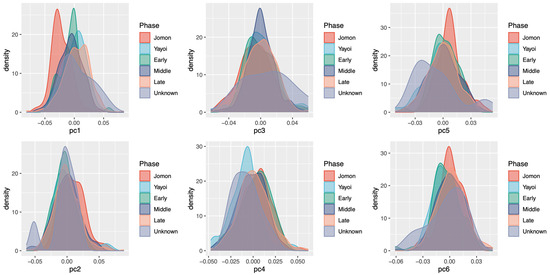
Figure 4.
The kernel density estimates of PC Scores (temporal variations) in Study 1.
3.2. Study 2
The PCA results revealed that the cumulative contribution rates exceeded 75% by PC 19 (Table 4). For the sake of space, more than 5% of the PCs were also focused on here. PC1 primarily encompasses the occipital width and length and the height of the lambda and opisthokranion. PC2 refers to the facial height and occipital length. The anterior–posterior length is also reflected in PC3, and as PC3 is larger, the foretooth is more anteriorly positioned. PC4 captures facial length and height. When PC5 was larger, the post-cranial parts were lower, and the foretooth was more anteriorly positioned. Finally, PC6 captures the facial width and occipital overall size (Figure 5).
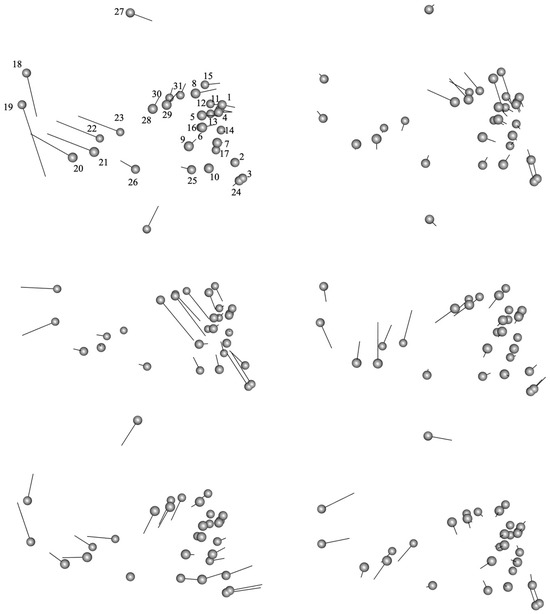
Figure 5.
Configurational changes in landmarks captured by each PC in Study 2. From top to bottom: PC1 to PC3 in the left column, and PC 4 to PC6 in the right columns. The numbers in PC1 correspond to the ones in Table 3.
Temporal differences are unclear, although an exception could be PC4, where samples from the Yayoi period are relatively different from those from the Kofun period. Note that we did not find any significant variations among the samples among Kofun subperiods (Figure 6).
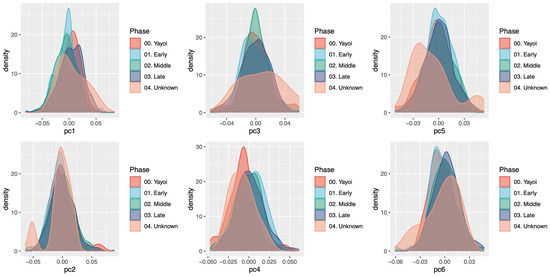
Figure 6.
The kernel density estimates of PC Scores (temporal variations) in Study 2.
Figure 7 shows the relatively clear spatial variations in PC1 (Figure 7). When all the data from the Yayoi and Kofun periods are plotted, a gradual geographical cline is found in PC1. The cline was found in both sexes (Supplementary Figure S1). The early and late Kofun periods also showed a geographical cline in the PC1, and sexual variations were not found (Supplementary Figure S1), although it is noteworthy that samples in the eastern regions are temporally biased.
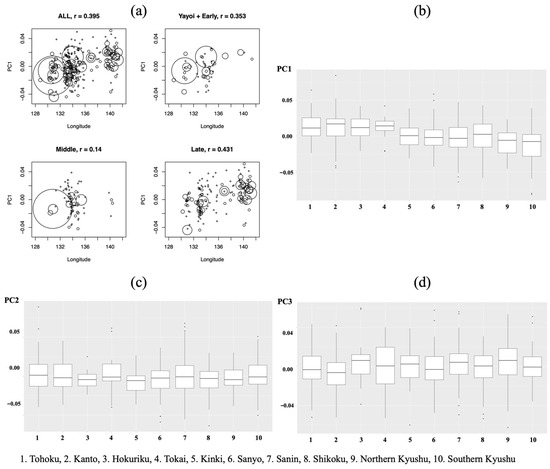
Figure 7.
(a) The mean PC1 scores for each site plotted against longitude in the whole, early (including the Yayoi), middle, and late Kofun periods and boxplots of (b) PC1, (c) PC2, and (d) PC3 scores in each region. The size of a circle is proportional to the number of samples at the focal site. The correlation coefficients are calculated between PC1 scores attributed to individuals, not the average scores attributed to sites, and longitude.
4. Discussion
Using 3D data and landmark-based geometric morphometrics, the present study quantified spatio-temporal variation in the morphology of skulls in the Kofun periods with those in the Jomon and Yayoi periods as a reference for comparison. Our study is consistent with previous studies in various aspects. First, the most prominent trend between the eastern and western parts of the Japanese archipelago during the Kofun period was observed in PC1 (Figure 7). PC1 scores were higher in the eastern part (indicating longer occipital length and higher positions of lambda and opisthokranion) than in the western part. This aligns with the traditional claim that individuals in the western regions are more strongly influenced by those who migrated from the Korean peninsula, resulting in a shorter anterior–posterior length [25]. Our results are consistent with this previous observation. Similarly, although samples from the Northern Kyushu region during the Kofun period are limited, their overall distribution patterns fall between those observed in Southern Kyushu and those in more eastern areas [19].
Second, during the middle and late subperiods, the Southern Kyushu region displayed the most negative scores in PC1, indicating the shortest anterior-posterior length. This aligns with the findings of several studies (e.g., [43]). Additionally, many archaeological studies argue that during the middle and late periods, the Southern Kyushu region had relatively unique cultures, as evidenced by unique pottery styles (Narikawa-type pottery) and burial customs (i.e., underground tunnel tombs [44,45]). These distinctive cultural elements are plausibly reflected in or associated with observed patterns in morphological variation.
Third, a previous study suggested that the eastern and western parts of the Sanin region are relatively closer to the Sanyo and Northern Kyushu regions, respectively [22]. The PC1 scores from the late Kofun period support this previous claim, although the pattern was not as clear in other periods (Supplementary Figure S2).
New patterns were also found with evolutionary or archaeologically meaningful implications. First, the results of Study 1 (especially PC1) suggest that the Jomon people were rather different from the Yayoi and Kofun people in the facial height and the anterior–posterior length (Figure 4), which is consistent with the results of Study 2 indicating that temporal differences are not significant among the Yayoi and Kofun periods (Figure 6), with a potential exception of PC4 relevant to face shape. There has been a debate about the ancestry of the Yayoi and Kofun people. A major issue is the relative importance of interbreeding between the Yayoi people and immigrants from continental East Asia. A naïve interpretation of our results is that continuity between the Yayoi and Kofun people existed, although it is still unclear how skull morphology can be influenced by genetic components. However, the ancestry of the Yayoi people is also important in the interpretation. It has been discussed to what extent interbreeding between the Jomon people and immigrants from continental East Asia played a role in the formation of the Yayoi people. A relevant study suggested that the Jomon people and people from continental East Asia might not regularly interbreed [38]. If so, it can be hard to distinguish the contribution of the Yayoi people or immigrants from continental East Asia to the Kofun people. Although the mechanism is still unclear, the large overlap in morphological variation between the Yayoi and Kofun people could be an important step in further research.
Second, we subdivided the entire Kofun period into three sub-periods (i.e., early, including the Yayoi for ensuring adequate samples, middle, and late). The results indicate that similar geological clines were present in the overall, early (including the Yayoi), and late Kofun periods. We examined the correlation between the PC1 and the longitude of each site, which supports the geological cline (early: r = 0.3534, p < 0.01, middle: r = 0.1404, p = 0.08, late: r = 0.4309, p < 0.01). A comparable geological cline was highlighted in a previous study on the Kofun period [19]. The present study substantiates this finding with 3D models with larger sample sizes than those in previous studies. Notably, the cline was not evident in the middle of the Kofun period. Although this could be due to the few samples in the eastern regions, another interpretation might be possible. The middle period witnessed relatively profound social changes within the Kofun period: although larger keyhole-shaped mounds were constructed mainly in the Kinki region during the early period, they were also built in other regions such as the Sanyo, Tohoku, Kyushu, and Kanto regions in the middle period, when power was relatively decentralized and people likely moved or migrated more extensively [13,46]. These social changes are in line with the outcomes of the present study, suggesting that demic diffusion was broader and more intricate during the middle period.
Third, PC1 and PC2, in particular, exhibited highly similar patterns in the Tokai, Kanto, and Tohoku regions during the late Kofun period. Furthermore, the latter two regions showed significant similarity in PC3 (Figure 7). This similarity strongly suggests that human migrations or interactions were notably more frequent, especially during the late period. This pattern aligns with extensive archaeological research, which argues that specific populations continuously immigrated from the Tokai and Kanto regions to Tohoku based on pottery distribution patterns. Historical writings also support this, suggesting that immigration during the late period was part of national policy [47,48,49].
Fourth, previous studies have claimed that significant intergroup conflicts did not occur during the Kofun period based on, for example, a smaller number of injured skeletal remains compared with the preceding Yayoi period [13,18]. Our results showed no clear geographical variation in PCs except for PC1 in the Kofun period. This is more plausible to be interpreted as a result of large-scale interaction, including trade and migration, than large-scale warfare or conflicts.
Some limitations and issues need to be acknowledged. First, as previously mentioned, the individuals buried during the Kofun period generally held higher social ranks. Even if the present study could accurately reflect migration patterns in the Kofun period, these patterns might be limited to individuals with higher social standing. It is important to note, however, that the present results align closely with relevant archaeological arguments based on material culture, including pottery inferred to be used by commoners [47,48,49].
Relatedly, the present study included larger samples than previous studies, although the samples might be spatially and/or temporally biased, especially in the Early Kofun period. Using PCA, in general, groups with small sample sizes tend to be evaluated as variations of groups with large sample sizes. Well-preserved skeletal remains, however, are rarely excavated. Developments both in analytical methods and archaeological understanding of spatiotemporal variation in burial systems are required.
Second, although the present study divided the Kofun period into three subperiods, archaeological remains may offer much finer temporal resolutions, potentially rendering the temporal divisions in the present study insufficient. This temporal challenge can be addressed through radiocarbon dating, necessitating further research.
Third, although physical traits are expected to reflect or be related to their genetic background to some extent, as highlighted in the Introduction, genetic data can provide a precise population history of the Jomon, Yayoi, and Kofun people. However, due to the challenging conditions of studying human skeletal remains in the Japanese archipelago, including acidic soil conditions, it takes time to analyze genomic data at a level of spatial and temporal resolution similar to the present study. Again, it should be noted that our results are consistent with previous genetic studies, suggesting a relatively minor genetic contribution of the Jomon people to the Yayoi people. A recent notable example is the Aoyakamijichi site of the late Yayoi period in Tottori prefecture [38,50].
5. Conclusions
The present research employed a considerably large sample of human crania from prehistoric and ancient periods, namely, the Jomon, Yayoi, and Kofun periods, in the Japanese archipelago. The goal was to investigate and interpret physical and demographic patterns, with particular focus on the Kofun period. While the current findings and previous research are in broad agreement, some critical patterns were newly identified and interpreted using various data sources. Although physical patterns should be thoroughly examined in conjunction with other relevant data, the present research shows that a larger sample of 3D data could offer finer results than traditional 2D biodistances and still substantially contribute to understanding human evolutionary pathways.
Supplementary Materials
The following supporting information can be downloaded at: https://www.mdpi.com/article/10.3390/humans4020008/s1. Table S1: Metadata and data analyzed in Study 1; Table S2: Metadata and data analyzed in Study 2; Figure S1: Sexual differences of Study 1 and Study 2; Figure S2: Regional differences in Study 2.
Author Contributions
All designed the research. H.N., T.N., K.T. and A.K. gathered the 3D data. H.N. and K.T. analyzed the data, and H.N. wrote the original draft. All authors have read and agreed to the published version of the manuscript.
Funding
This study was supported by JSPS KAKENHI (No. 20K00019, 19H05738, 20K22029, and 21K12590).
Institutional Review Board Statement
Ethical approval was not required for the present study according to the local legislation and institutional requirements (i.e., Japanese laws regulating archaeological human remains in Japan). Owners of all samples are described in Supplementary File Table S1.
Informed Consent Statement
Informed consent was not required for the present study because this study examined human skeletal remains. The human skeletal remains examined in the study have been checked by local boards, and they do not have verifiable living descendants.
Data Availability Statement
The data presented in this study are available on request from the corresponding author due to ethical reasons on human skeletal remains.
Acknowledgments
We thank the following cultural property or archaeological centers, institutions, museums, and universities (see the detailed information for the Supplementary Materials Tables S1 and S2). Ishinomaki City museum, The Tohoku University Museum, Tohoku History Museum, The Historical Museum of Jomon Village Okumatsushima, Department of Medicine, Niigata University, Oyasuba Historic Park, Iwaki City Archaeological Centre, Institute of Physical Anthropology, Niigata University of Health and Welfare, Fukushima Cultural Property Centre, Shirakawa Branch (Mahoron), Yonezawa City Board of Education, Chido Museum, Himi City Museum, The Kyoto University Museum, Department of Science, Kyoto University, National Museum of Nature and Science, Yachiyo City Board of Education, Shibayama Kofun and Haniwa Museum, Chiba Prefecture Board of Education, Yokosuka City Board of Education, Department of Dentistry, Tsurumi University, Isehara City Board of Education, Shizuoka Prefectural Archaeological Center, Ogaki City Historical Museum, Takayama Fudoki no Oka Learning Center, Shiga Prefectural Archaeological Center, Department of Medicine, Osaka Metropolitan University, Tanabe City Historical Museum, Tottori Prefectural Archaeological Center, Hokuei Town Board of Education, Kurayoshi City Museum, Hoki Town Board of Education, Yonago City Archaeological Center, Department of Medicine, Shinshu University, Nagano Prefectural Archaeological Center, Okayama University of Science, Okayama University, Tatsuno City Archaeological Center, Toyooka City Historical Museum, Hyogo Prefectural Museum of Archaeology, Kobe City Archaeological Center, Miki City Historical Museum, Hiroshima Prefectural Museum of History, Hiroshima Prefectural Archaeological Center, Fuchu City Board of Education, Okayama Prefectural Ancient Kibi Cultural Properties Center, Okayama City Archaeological Center, Izumo Yayoinomori Museum, Shimane Prefectural Archaeological Center, Matsue City Board of Education, Okuizumo Town Board of Education, Unnan City Board of Education, Archaeological Museum of Matsuyama City, Shikoku Chuo City Historical and Achaeological Museum (Kogen Museum), Tonosho Town Board of Education, Fukuoka City Archaeological Center, Saitobaru Archaeological Museum of Miyazaki Prefecture, Kagoshima Prefectural Archaeological Center, Kawasaki City Board of Education, Doigahama Site Anthropological Museum, Ube City Learning Center Kusunoki, Nagato City Historical Museum, Chikushino City Historical Museum, Izuka City Historical Museum, Kanenokuma Site Kamekan Exhibition Hall, Tottori Yayoi Kingdom, Nishio City Museum, Kamakura City Board of Education, Tahara City Museum, Toride City Board of Education, and Kyushu University Museum. We also appreciate the following researchers for their highly valuable suggestions, comments, information, and cooperation: Takayuki Matsushita (Doigahama Anthropological Museum), Kazuhiro Sakaue (National Museum of Science), Atsushi Fujisawa (The Tohoku University Museum), Takafumi Nara (Niigata University of Medicine and Welfare), Mikiko Abe, Masatake Kai (Osaka Metropolitan University), Ayumi Tanabe (Kurayoshi City Museum), Naoto Tomioka (Okayama University of Science), Junko Hishida (Hyogo Prefectural Museum of Archaeology), Toyoharu Sakamoto (Izumo Yayoinomori Museum), Takeyuki Imashioya (Saitobaru Archaeological Museum of Miyazaki Prefecture), and Ai Takeuchi (Nanzan University).
Conflicts of Interest
The authors declare no conflicts of interest associated with this manuscript.
References
- Bateson, P.; Gluckman, P. Plasticity, Robustness, Development and Evolution; Cambridge University Press: New York, NY, USA, 2011. [Google Scholar]
- Richerson, P.; Boyd, R. Not by Genes Alone: How Culture Transformed Human Evolution; The University of Chicago Press: Chicago, IL, USA, 2004. [Google Scholar]
- West-Eberhard, M.J. Developmental Plasticity and Evolution; Oxford University Press: New York, NY, USA, 2003. [Google Scholar]
- Howells, W.W. Cranial Variation in Man: A Study by Multivariate Analysis of Patterns of Difference among Recent Human Populations; Papers of the Peabody Museum 67; Peabody Museum, Harvard University: Cambridge, MA, USA, 1973. [Google Scholar]
- Kuzminsky, S.C.; Reyes Báez, O.; Arriaza, B.; Méndez, C.; Standen, V.G.; San Román, M.; Muñoz, I.; Durán Herrera, Á.; Hubbe, M. Investigating cranial morphological variation of early human skeletal remains from Chile: A 3D geometric morphometric approach. Am. J. Phys. Anthropol. 2018, 165, 223–237. [Google Scholar] [CrossRef] [PubMed]
- Lahr, M.M. The Evolution of Modern Human Diversity: A Study of Cranial Variation; Cambridge University Press: New York, NY, USA, 1996. [Google Scholar]
- O’Higgns, P.; Fitton, L.C.; Godinho, R.M. Geometric morphometrics and finite elements analysis: Assessing the functional implications of differences in craniofacial form in the hominin fossil record. J. Archaeol. Sci. 2019, 101, 159–168. [Google Scholar] [CrossRef]
- Pietrusewsky, M. Biological distance in bioarchaeology and human osteology. In Encyclopedia of Global Archaeology; Smith, C., Ed.; Springer: Berlin/Heidelberg, Germany, 2014; pp. 1–17. [Google Scholar]
- Smith, H.L.; Kuzminsky, S.C.; Linderholm, A. Discerning dispersals along the pacific and interior corridors: Contributions of geometric morphometrics to the peopling of the Americas. PaleoAmerica 2020, 6, 109–130. [Google Scholar] [CrossRef]
- Sparks, C.S.; Jantz, R.L. A reassessment of human cranial plasticity: Boas revisited. Proc. Natl. Acad. Sci. USA 2002, 99, 14636–14639. [Google Scholar] [CrossRef] [PubMed]
- Syutkina, T.; Pérez, M.J.G.; Hernández Godoy, S.T.; Antúnez, C.A.; Rivero, A.R. Intragroup variation in the Pre-Columbian Cuba population: A perspective from cranial morphology. Anthropol. Rev. 2021, 84, 233–255. [Google Scholar] [CrossRef]
- Winburn, A.P.; Yim, A.-D.; Stock, M. Recentering forensic anthropology within a multifaceted body of evolutionary theory: Strengthening method by making theory explicit. Am. J. Biol. Anthropol. 2022, 179, 535–551. [Google Scholar] [CrossRef]
- Habuta, Y. Kofun; Yoshikawa-kobunkan: Tokyo, Japan, 2011. (In Japanese) [Google Scholar]
- Knopf, T.; Steihaus, W.; Fukunaga, S. (Eds.) Burial Mounds in Europe and Japan: Comparative and Contextual Perspectives; Archaeopress: London, UK, 2018. [Google Scholar]
- Mizoguchi, K. The Archaeology of Japan: From the Earliest Rice Farming Villages to the Rise of the State; Cambridge University Press: New York, NY, USA, 2013. [Google Scholar]
- Nakagawa, T.; Nakao, H.; Tamura, K.; Arimatsu, Y.; Matsumoto, N.; Matsugi, T. Violence and warfare in the prehistoric Japan. Lett. Evol. Behav. Sci. 2017, 8, 8–11. [Google Scholar] [CrossRef][Green Version]
- Nakagawa, T.; Tamura, K.; Yamaguchi, Y.; Matsumoto, N.; Matsugi, T.; Nakao, H. Population pressure and prehistoric violence in the Yayoi period of Japan. J. Archaeol. Sci. 2021, 132, 105420. [Google Scholar] [CrossRef]
- Matsugi, T. What Is Kofun? Kadokawa: Tokyo, Japan, 2013. (In Japanese) [Google Scholar]
- Doi, N.; Tanaka, Y. A geographical cline in metrical characteristics of Kofun skulls from western Japan. J. Anthropol. Soc. Nippon 1987, 95, 325–343. [Google Scholar] [CrossRef][Green Version]
- Jo, I. Anthropological studies on the human skeletal remains in the Kofun period. Jinruigaku Shuho 1938, 1, 1–324. (In Japanese) [Google Scholar]
- Ikeda, J. The Kofun people. In Studies on the Kofun Period I; Ishino, H., Iwasaki, T., Kawakami, K., Shiraishi, T., Eds.; Yuzankaku: Tokyo, Japan, 1993; pp. 27–95. (In Japanese) [Google Scholar]
- Ikeda, J. The Kofun people in the Sanin area based on measurements of craniums. Stud. Anc. Cult. 2001, 9, 1–12. (In Japanese) [Google Scholar]
- Kawakubo, T.; Sawada, J.; Dodo, Y. In search for Ainu’s signs in the Tohoku region, Japan: Cranial metric and nonmetric analyzes of unearthed human skeletal remains. Anthropol. Sci. (Jpn. Ser.) 2009, 117, 65–87. [Google Scholar] [CrossRef][Green Version]
- Morisawa, S. Regional variations of human skeletal remains in the Kofun period. Niigata Med. J. 1974, 90, 32–47. (In Japanese) [Google Scholar]
- Terakado, Y. Human skeletal remains in the Kofun period. In Lectures on Anthropology 5: Japanese People 1; Editorial committee of lectures on anthropology, Ed.; Yuzankaku: Tokyo, Japan, 1981; pp. 27–95. (In Japanese) [Google Scholar]
- Schutkowski, H. Sex determination of infant and juvenile skeletons: 1. Mophological features. Am. J. Phys. Anthropol. 1993, 90, 199–205. [Google Scholar] [CrossRef]
- Tanihata, M.; Suzuki, T. A Manual for Archaeologists to Examine Human Skeletal Remains; Gakusei Sha: Tokyo, Japan, 2004. (In Japanese) [Google Scholar]
- Kaneda, A.; Noshita, K.; Tamura, T.; Nakagawa, T.; Nakao, H. A proposal of a new automated method for SfM/MVS 3D reconstruction through comparisons of 3D data by SfM/MVS and handheld laser scanners. PLoS ONE 2022, 17, e0270660. [Google Scholar] [CrossRef]
- Nakagawa, T.; Kaneda, A.; Tamura, K.; Nakao, H. A comparative study of measurement methods digitizing human skeletal remains: SfM and laser scanning. Nabunken Ronso 2022, 3, 39–64. (In Japanese) [Google Scholar]
- Nakao, H.; Nakagawa, T.; Yoshida, M. 3D data of human skeletal remains acquired by two kinds of laser scanners: Einscan Pro HD and Creafrom HandySCAN BLACK™|Elite. J. Nanzan Acad. Soc. Humanit. Nat. Sci. 2022, 24, 309–314. [Google Scholar]
- Cignoni, P.; Callieri, M.; Corsini, M.; Dellepiane, M.; Ganovelli, F.; Ranzuglia, G. MeshLab: An open-source mesh processing tool. In 6th Eurographics Italian Chapter Conference 2008; Scarano, V., de Chiara, R., Erra, U., Eds.; The Eurographics Association: Genova, Italy, 2008; pp. 129–136. Available online: https://www.meshlab.net/ (accessed on 15 January 2023).
- Noshita, K.; Kaneda, A.; Tamura, K.; Nakagawa, T.; Nakao, H. A mathematical study on outline morphologies of yayoi pottery: A case study focusing on the Ongagawa-style pottery from the Yamura, Yano, and Ayaragi-go sites. Nabunken Ronso 2022, 3, 65–82. (In Japanese) [Google Scholar]
- Adams, D.C.; Collyer, M.L.; Kaliontzopoulou, A.; Baken, E.K. Geomorph: Software for Geometric Morphometric Analyses. R Package Version 4.0.4. 2022. Available online: https://cran.r-project.org/package=geomorph (accessed on 15 January 2023).
- R Core Team. R: A Language and Environment for Statistical Computing; R Foundation for Statistical Computing: Vienna, Austria, 2020; Available online: https://www.R-project.org/ (accessed on 15 January 2023).
- RStudio Team. RStudio: Integrated Development for R; RStudio, PBC: Boston, MA, USA, 2020; Available online: http://www.rstudio.com/ (accessed on 15 January 2023).
- Martin, R. Lehrbuch der Anthropologie in Systematischer Darstellung, 2nd ed.; Gustav Fischer: Jena, Germany, 1928. [Google Scholar]
- Fantini, M.; de Crescenzio, F.F.; Persiani, F.; Benazzi, S.; Gruppioni, G. 3D restitution, restoration and prototyping of a medieval damaged skull. Rapid Prototyp. J. 2008, 14, 318–324. [Google Scholar] [CrossRef]
- Nakao, H.; Nakagawa, T.; Kaneda, A.; Noshita, K.; Tamura, K. Demic diffusion of the Yayoi people in the Japanese archipelago. Lett. Evol. Behav. Sci. 2023, 14, 58–64. [Google Scholar] [CrossRef]
- Buikstra, J.E.; Ubelaker, D. Standards for Data Collection from Human Skeletal Remains: Proceedings of a Seminar at the Field Museum of Natural History; Arkansas Archeological Survey: Fayetteville, AR, USA, 1994. [Google Scholar]
- Brooks, S.; Suchey, J.M. Skeletal age determination based on the os pubis: A comparison of the Acsádi-Nemeskéri and Suchey-Brooks methods. Hum. Evol. 1990, 5, 227–238. [Google Scholar] [CrossRef]
- Meindl, R.S.; Lovejoy, C.O. Ectocranial suture closure: A revised method for the determination of skeletal age at death based on the lateral-anterior sutures. Am. J. Phys. Anthropol. 1985, 68, 57–66. [Google Scholar] [CrossRef] [PubMed]
- Sakaue, K. A Bayesian approach to age estimation from cranial suture closure in Japanese people. Bull. Natl. Mus. Nat. Sci. Ser. D 2015, 41, 1–11. [Google Scholar]
- Matsushita, T. Anthropological study on the human skeletal remains of the Kofun period in the southern Kyushu area. Nagasaki Med. J. 1990, 65, 781–804. (In Japanese) [Google Scholar]
- Hongo, Y. The Identity of Kumaso and Hayato; Yoshikawa-kobunkan: Tokyo, Japan, 1994. [Google Scholar]
- Kurafuji, H.; Hashimoto, T. The Kyushu area. In Japanese Archaeology Lectures 7: The Kofun Period; Hirose, K., Wada, S., Eds.; Aoki-shoten: Tokyo, Japan, 2011; pp. 103–146. (In Japanese) [Google Scholar]
- Wakasa, T. Rural Management of the Eastern Japan in the Kofun Period; Yoshikawa-kobunkan: Tokyo, Japan, 2021. (In Japanese) [Google Scholar]
- Fujisawa, A. (Ed.) Formation of Japan and the Tohoku Area; Yoshikawa-kobunkan: Tokyo, Japan, 2015. (In Japanese) [Google Scholar]
- Imaizumi, T. Rural Management by the Ancient State in Japan and the Tohoku Area; Yoshikawa-kobunkan: Tokyo, Japan, 2017. (In Japanese) [Google Scholar]
- Kumagai, K. The Era of the Emishi and Castle Defenses; Yoshikawa-kobunkan: Tokyo, Japan, 2015. (In Japanese) [Google Scholar]
- Kanzawa, H.; Kakuda, T.; Adachi, N.; Shinoda, K. Nuclear DNA analysis of human bones of the late Yayoi period excavated at Aoya-Kamijichi site, Tottori-shi, Tottori Pref. Bull. Natl. Mus. Jpn. Hist. 2021, 228, 295–307. (In Japanese) [Google Scholar]


Disclaimer/Publisher’s Note: The statements, opinions and data contained in all publications are solely those of the individual author(s) and contributor(s) and not of MDPI and/or the editor(s). MDPI and/or the editor(s) disclaim responsibility for any injury to people or property resulting from any ideas, methods, instructions or products referred to in the content. |
© 2024 by the authors. Licensee MDPI, Basel, Switzerland. This article is an open access article distributed under the terms and conditions of the Creative Commons Attribution (CC BY) license (https://creativecommons.org/licenses/by/4.0/).