Article

Nutrient Accessibility Influences Stalk Formation in the Benthic Diatom Achnanthidium minutissimum

1
Plant Ecophysiology, Department of Biology, Universität Konstanz, 78457 Konstanz, Germany
2
Chemical Ecology, Department of Biology, Universität Konstanz, 78457 Konstanz, Germany
*
Author to whom correspondence should be addressed.
Phycology 2025, 5(2), 13; https://doi.org/10.3390/phycology5020013
Submission received: 18 February 2025 / Revised: 20 March 2025 / Accepted: 23 March 2025 / Published: 1 April 2025

Abstract

:
Achnanthidium minutissimum is a widely distributed benthic freshwater diatom. The alga can produce stalks that stick the cell to the surface and subsequently extracellular capsules developing into biofilms. Extracts of the diatom-associated bacterium Dyadobacter sp. 32 have been shown previously to induce stalk and capsule formation by the diatom. Here, we studied the impact of macronutrients on the generation of stalks induced by bacterial extracts with respect to the frequency of stalk generation and stalk lengths, using axenic cultures to avoid any additional impact of bacteria on the nutrient availability. We found that nitrate deprivation inhibited cell division of A. minutissimum within four days, but it did not initially affect stalk production or elongation. Silica limitation instead inhibited both stalk production and elongation. Similarly, sulfate was required for stalk formation, which was supported by the energy-dispersive X-ray spectroscopy of A. minutissimum cells showing that sulfur was abundant in the stalks.

1. Introduction

Diatoms are unicellular algae and are often the dominant eukaryotic members of phototrophic biofilms. Diatoms are among the first to colonize natural and artificial substrata [1]. They can produce large amounts of extracellular polymeric substances, forming different structures such as capsules, apical pads, tubes, or stalks [2]. These structures, consisting mostly of polysaccharides, have important functions, allowing the cells to stick together or to surfaces permanently or temporarily, or to develop biofilms as habitats [3]. Stalk production has been observed in many marine and freshwater diatom species [3]. Diatom stalks are mainly composed of carbohydrates and proteins [4,5]. Sulfonated poly-saccharides are essential for stalk production [4,5,6]. Stalks may provide several advantages to diatoms, supporting their growth and survival in different environments. By elevating the cells above the substrata, stalks may improve access to sunlight and nutrients, thereby enhancing diatom growth. Stalk formation may also be of advantage to avoid toxic conditions, such as antifouling-treated surfaces [7,8]. On the other hand, stalks can be of disadvantage, increasing the chance to be ingested by grazers [9,10].
Generating and maintaining stalks located outside of the cells requires the activity of extracellular enzymes. Studies on the diatom Didymosphenia geminata have revealed a high activity of phosphomonoesterases and phosphodiesterases in the stalk, enabling the release of inorganic phosphate from organic phosphate compounds, which can subsequently be utilized by diatom cells [11,12]. This capacity might explain the biological success of D. geminata, particularly in an environment where organic phosphate dominates phosphate resources [13]. Although the mechanism by which the phosphate released from stalks reaches the diatom cells remains unclear, the existence of tube-like structures within the stalk indicate a potential of the cells to take up phosphate from the stalk actively [11].
The attachment of benthic diatoms to substrata via stalks or biofilm layers has ecological and economic consequences. For example, blooms of D. geminata in the Rocky Mountains may alter the density and biomass of invertebrate taxa, which may affect even species higher up the food chain [14]. In particular, stalk-forming diatoms may cause biofouling. For example, diatom biofilms on ship hulls lead to increased fuel consumption, and increased costs [15]. Stalk-forming diatoms constitute early colonizers on ship hulls [16,17]. Furthermore, they can be present in the hydro canals of hydropower plants, reducing the efficiency significantly [18].
But stalk-producing diatoms can also be beneficial: the polysaccharide-based stalks of D. geminata exhibit exceptional sorption capacity for Pb2+ ions and a high sorption capacity for Cd2+ and Ni2+ ions; therefore, they could be used as potential biological adsorbent in wastewater treatment [19]. Moreover, the unexpected discovery of lignin-like structures in diatom stalks may expand their fields of application, including environmentally friendly corrosion inhibitors and protective coatings, as well as the replacement of some petroleum-derived materials [6,20].
Stalk formation itself, as well as stalk lengths, are influenced by multiple factors; light intensity appears to be crucial because stalks are mainly composed of carbohydrates that are generated by photosynthesis. Exposure to high light intensities together with nutrient-limited cell division often leads to increased stalk lengths, possibly as a response to photosynthetic overflow [21,22]. Very high light intensities though may inhibit stalk elongation, possibly as a photoprotective mechanism to avoid further increased light exposition [23]. The frequency of dividing cells (FDC) [24] is an important factor for stalk lengths. Under nutrient-rich conditions, a high FDC results in short stalks, whereas under nutrient-limited conditions, a lower FDC leads to long stalks, especially under phosphorous limited conditions [22].
The diatom studied in this work, Achnanthidium minutissimum, is a widely distributed monoraphid benthic freshwater diatom [5,25,26,27]. This species produces non-dividing stalks on one edge of the valve that possesses the raphe. Achnanthidium species are widely distributed in various freshwater habitats around the world and can be important indicators of environmental conditions [28]. The diatom has high potential in serving as a model species for studying the relationship between stalk production and environmental factors because its stalk production can be controlled by addition of bacterial compounds. The knowledge about A. minutissimum’ s stalk structure, composition, as well as conditions for stalk formation is very limited so far. Here, we therefore describe how nutrient availability influences stalk production in axenic A. minutissimum. Understanding the relationship between nutrient conditions and stalk production may provide insights into how diatom stalks are produced, as well as how and why the cells respond to environmental changes by stalk production.

2. Materials and Methods

2.1. Strains

The fresh water diatom A. minutissimum strain MW1 was isolated from photoautotrophic, epilithic biofilms in the littoral zone of Lake Constance [27]. Dyadobacter sp. 32 cells were originally co-isolated from biofilms described above and cultivated on LB plates with 1.5% agar.

2.2. Cultivation Conditions

Axenic diatom cultures were cultivated in Achnanthidium medium (AM) [29] under standard conditions with a light intensity of 43 μmol m−2 s−1 without shaking at 16 °C in a 16: 8 day: night cycle.

2.3. Extraction of the Stalk-Inducing Signal Molecule

For extraction of the stalk-inducing signal, Dyadobacter sp. 32 was cultivated in liquid LB medium at 20 °C with shaking at 130 rpm until the bacteria reached the stationary phase (OD600: 1.25). Dyadobacter sp. 32 cells then were pelleted by centrifugation (9000 rpm, 10 min) using a Sigma 12500-H rotor in a Sigma 6–16k centrifuge (Sigma GmbH, Osterode, Germany). The cell pellets were dissolved in a mixture of methanol and dichloromethane (1:2 v/v, 300 mL). Then, 0.2 volumes of double-distilled water were added to the mixture, and organic compounds were extracted by mixing the solvents for 60 min. The water/methanol phase was collected and concentrated in a rotary evaporator. A 50 mg aliquot of the lyophilized bacterial extract (total yield: 136.3 mg) was precisely weighed and dissolved in 1.5 mL dimethyl sulfoxide (DMSO), yielding a stock solution with a nominal concentration of 33.3 mg/mL. This primary stock was subsequently subjected to serial decadal dilutions with anhydrous DMSO to prepare working solutions at 3.3 mg/mL (10× dilution) and 0.33 mg/mL (100× dilution); all solutions were stored at −20 °C.

2.4. Cultivation of Axenic A. minutissimum Under Nutrient Limitation

For cultivation of the A. minutissimum under nitrogen and phosphate limitation, specific nutrient resources in the AM medium [29] were replaced individually by the corresponding chloride salts at the same molarity with one exception: the Co(NO3)2 in the micronutrient mixture was not replaced in the nitrogen limited medium because its concentration (3.44 × 10⁻⁸ mol/L) was too low to affect the experiment. For sulfur limitation, all salts containing sulfate ions were replaced by their chloride forms at the same molarity. In silica limitation experiments, we omitted silica salts.

2.5. Stalk Induction Bioassay for A. minutissimum

All biological assays were performed in biological triplicates. Aliquots of bacterial DMSO extract (3 μL) were transferred to axenic A. minutissimum cultures in 24-well cell culture plates containing 1 mL A.M medium and mixed with diatom cells by careful pipetting. As a negative control, only DMSO was added to A. minutissimum cultures. The plates were cultivated under standard culture conditions without shaking. After induction, non-attached A. minutissimum cells were washed off, together with the culture broth, by pipetting gently. Cell densities were measured using a Beckman Coulter Multisizer 4e Coulter Counter (Beckman Coulter, Brea, CA, USA). Cells that were still attached after this procedure were stained with 0.01% crystal violet, followed by microscopical observation and documentation using a Zeiss AXIO Observer.A1 Inverted Fluorescence Microscope and a ZEISS Axiocam 305 color camera (Carl Zeiss Microscopy GmbH, Oberkochen, Germany). Typically, 5 images per well were taken to assess cell counts, and the images were checked for the presence of stalks as well as used for cell counting. Cells in each image were counted manually with Zen 3.2 (blue edition) software (Carl Zeiss Microscopy GmbH, Oberkochen, Germany) except for those with very high densities (i.e., >400 cells per image). In case of very high numbers of attached cells, one image was selected randomly among 5 images for cell counting. The percentage of cells with a stalk was calculated using the following formula:
C e l l   d e n c i t y c e l l m L - 1 = A B C D
A refers to the number of cells counted in the image; B, C, and D refer to the size of the whole growth area; C refers to the size of the area in the image; and D refers to the volume of medium in the growth area (mL), respectively.

2.6. Scanning Electron Microscopy (SEM) and Energy-Dispersive X-Ray Spectroscopic Analysis (EDX)

Thermanox substrates were aseptically excised from 6-well culture plates utilizing ethanol-sterilized forceps and rinsed thoroughly with fresh artificial seawater medium (AM). Subsequently, specimens were aseptically transferred to sterile 6-well plates, immersed in 1 mL AM, and processed through a standardized protocol for biofilm fixation, dehydration, and conductive coating. Cells were chemically fixed by immersion in 1 mL of ice-cold primary fixative solution containing 4% (w/v) glutaraldehyde, 20 mM CaCl2, and 20 mM MgCl2 in 0.2 M Na-HEPES buffer (pH 7.0) for 10 min. Following supernatant removal, secondary fixation was performed with 2 mL of 2% (w/v) glutaraldehyde, 10 mM CaCl2, and 10 mM MgCl2 in 0.1 M Na-HEPES buffer (pH 7.0) under ice-cooled conditions for 20 min. Residual fixative was decanted, and substrates underwent two sequential 10 min washes with 10 mM CaCl2 and 10 mM MgCl2 in 0.1 M Na-HEPES buffer (pH 7.0) on ice. A graded ethanol dehydration series was implemented as follows: 30% ethanol (v/v), ice-cooled, 7 min; 50% ethanol (v/v), ice-cooled, 15 min; 70% ethanol (v/v), 4 °C, overnight incubation; 80%, 90%, and 96% ethanol (v/v), room temperature (RT), 20 min per step; two final rinses in 100% ethanol (v/v), RT, 20 min each. Critical point drying was conducted using a liquid CO2 as the transition medium (Balzers CPD030; Oerlikon Balzers, Balzers, Liechtenstein) to preserve ultrastructural integrity. Samples were subsequently sputter-coated with a 5 nm amorphous carbon layer (Balzers SCD030; Oerlikon Balzers, Balzers, Liechtenstein) to enhance surface conductivity. After fixation, dehydration and C-sputtering, the Thermanox disks were imaged and analyzed with a Zeiss “AURIGA” scanning electron microscope equipped with an X-Max 20 mm2 EDX-detector (Oxford Instruments, Abingdon, UK).

2.7. Statistical Analysis

For analysis of the stalk length changes, length data were compared by Welch’s analysis of variance (Welch’s ANOVA), and a post hoc test was conducted by Games Howell Test with the rstatix package [30]. Statistics and graphs were conducted with R software (version 4.42) [31] and ggplot2 (version 3.5.1) [32].

3. Results

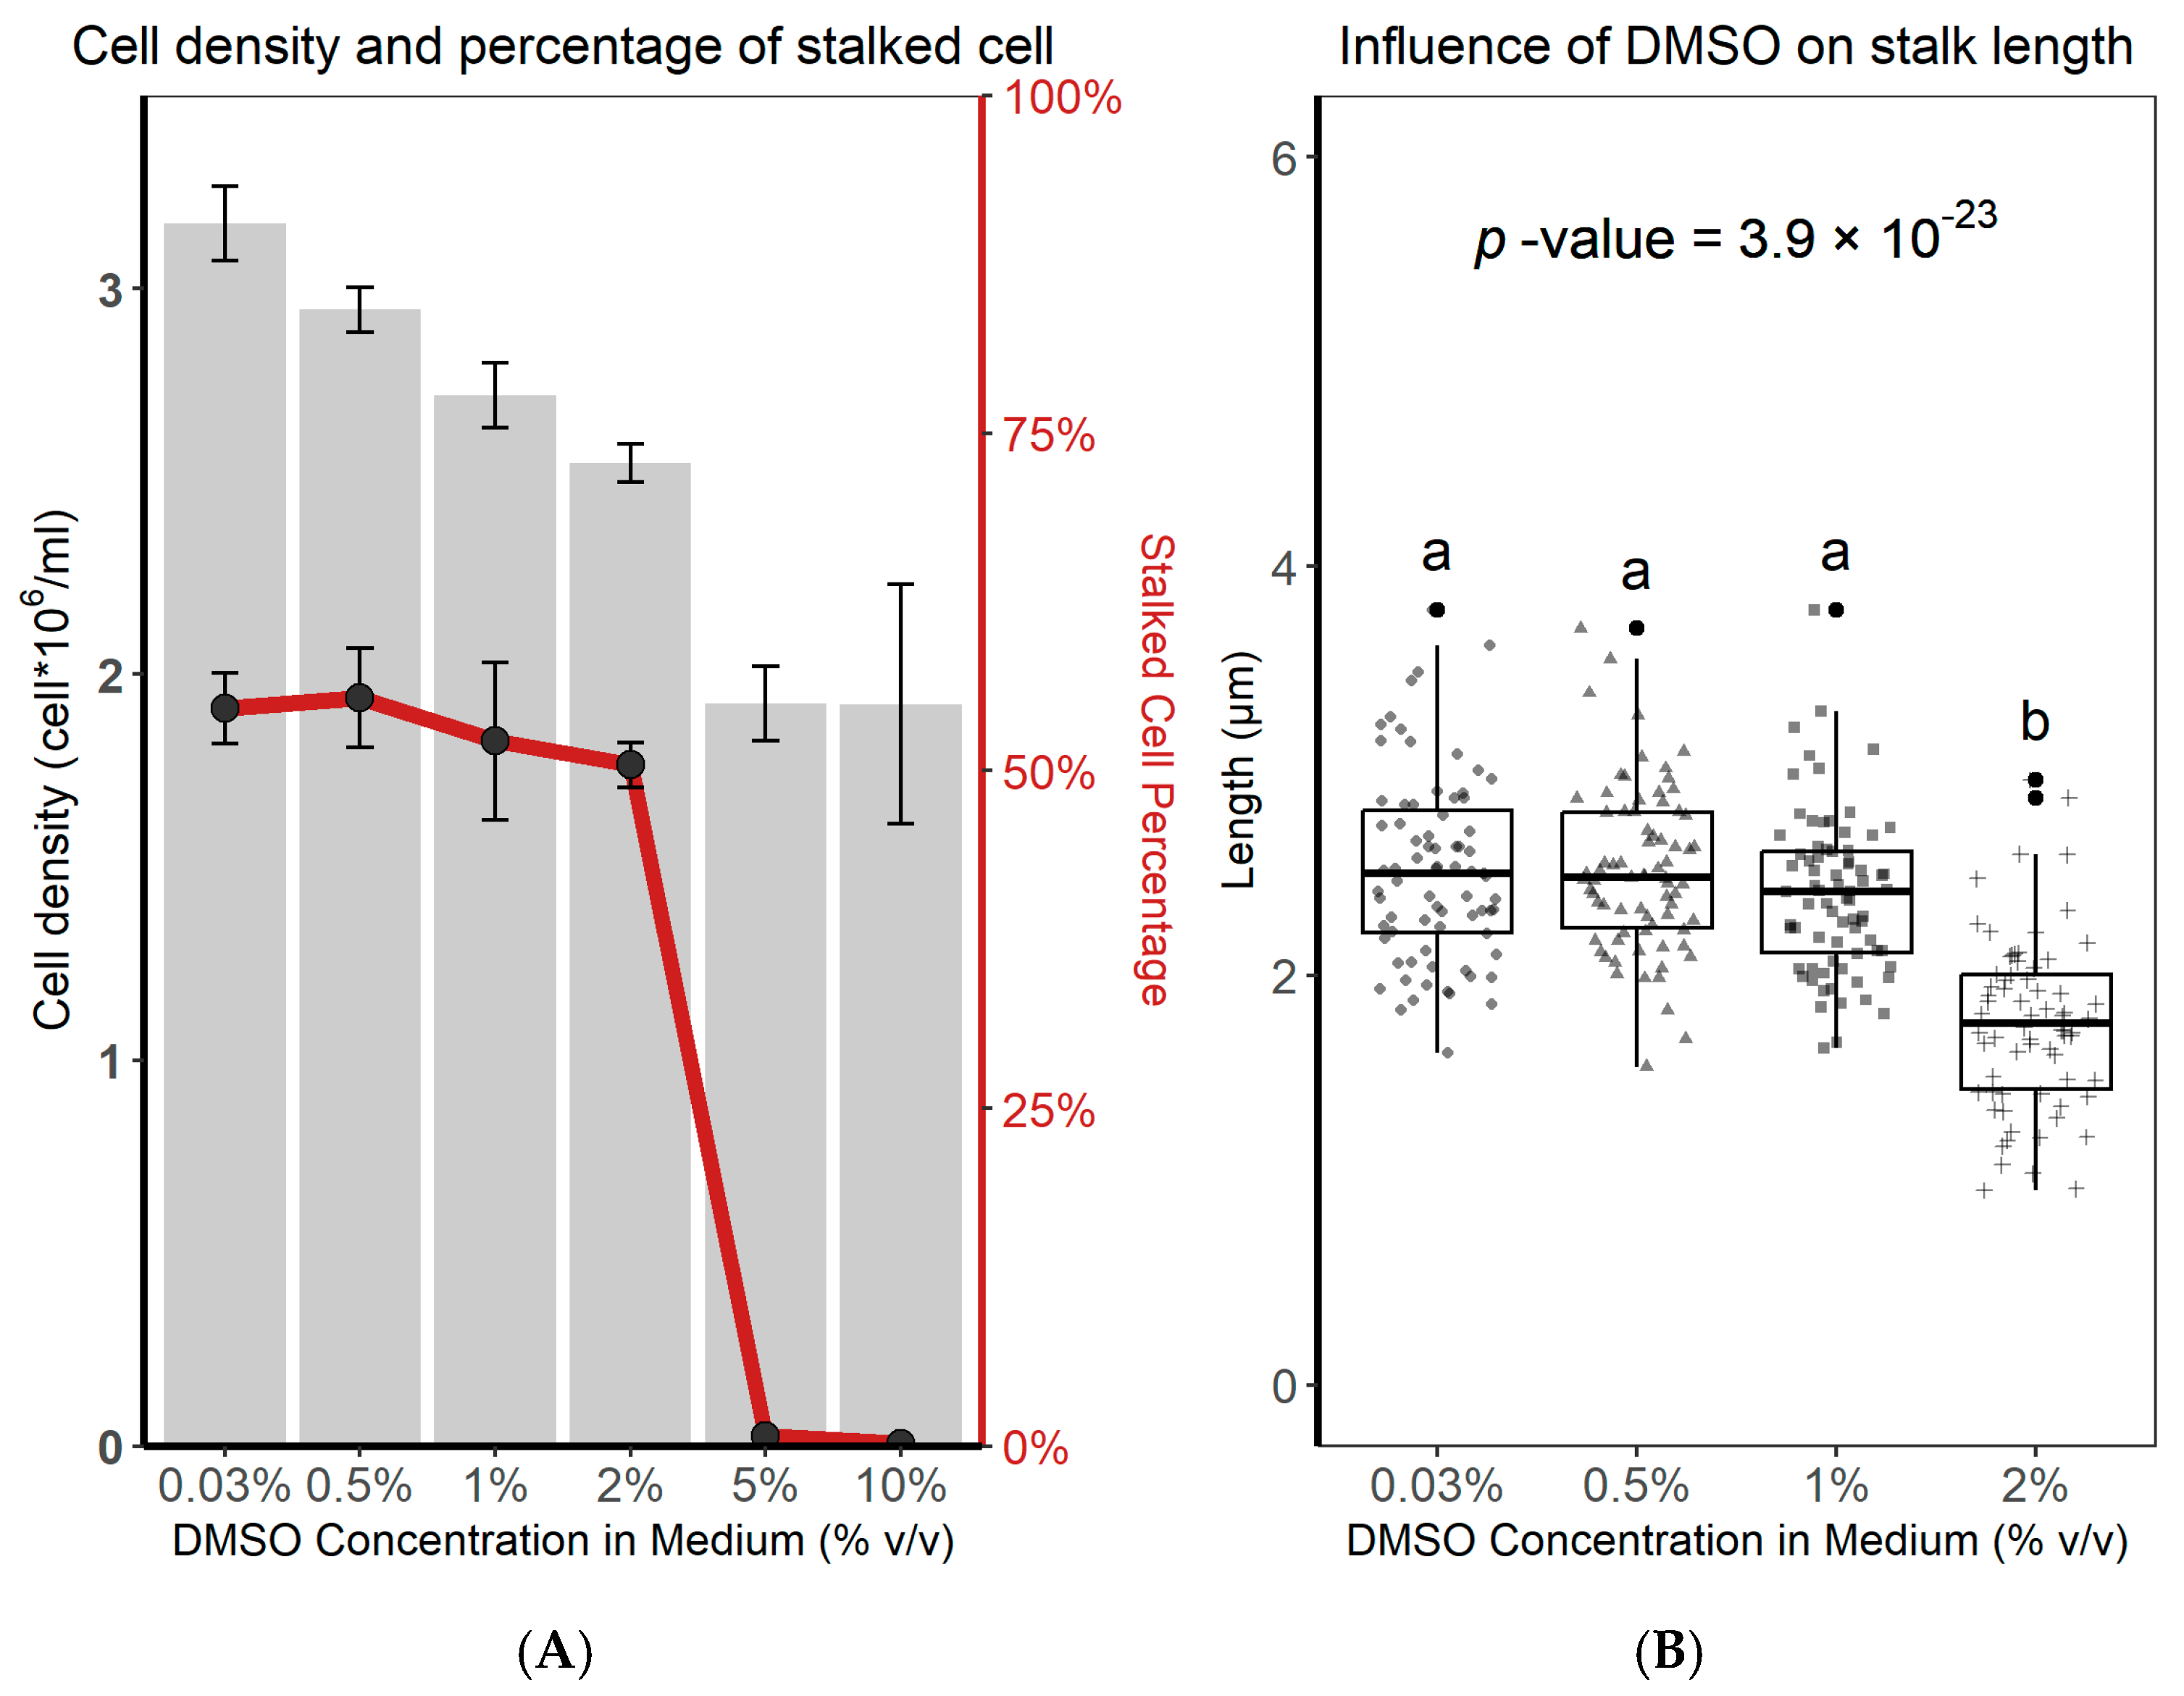
3.1. Induction of Stalk Formation in A. minutissimum by Dyadobacter sp. S32 Extracts

Compounds secreted by the bacterium Dyadobacter sp. S32 induce capsule/biofilm formation by the diatom A. minutissimum [33]. This strain has been co-isolated benthic with diatoms from Lake Constance. Dyadobacter species are known to interact with algae [34] or with plant roots [35]. Stalk formation, which precedes the capsule formation of A. minutissimum, is induced as well by Dyadobacter sp. S32 extracts. Stalks occur within 2 d (Figure 1). The stalks together with the cells can be labelled with crystal violet, and their growth can be followed by microscopy. Figure 1B,C shows the effect of presence or absence (Figure 1A,D) of bacterial extract, including (Figure 1A,B) or excluding DMSO (Figure 1C,D). As shown in Figure 1, the diatoms stuck to the surface after the addition of the bacterial compound and could not be removed by washing. Light microscopy demonstrated that A. minutissimum cells produced visible stalks 2 d after induction.
Stalk formation was induced by bacterial extracts, for which DMSO turned out to be the superior solvent, avoiding precipitations. Therefore, the following experiments were performed with the bacterial compound being dissolved in DMSO. In order to exclude the possible artificial effects of DMSO itself, we tested A. minutissimum cultures with 1.0 × 10⁶ cells/mL by adding the same amount of extracted compound in different concentrations of DMSO, by observing cell densities and stalk formation. Increasing amounts of DMSO resulted in a reduced cell division; however, only a slight decrease of cell density was observed at DMSO concentrations in the range from 0.03% to 2%. The percentage of A. minutissimum cells forming stalks, as well as the stalk lengths, were not affected by DMSO (0.03% to 2%) (Figure 2). We therefore decided to pursue further experiments with DMSO concentrations of 0.3% to minimize its impact on A. minutissimum cells.

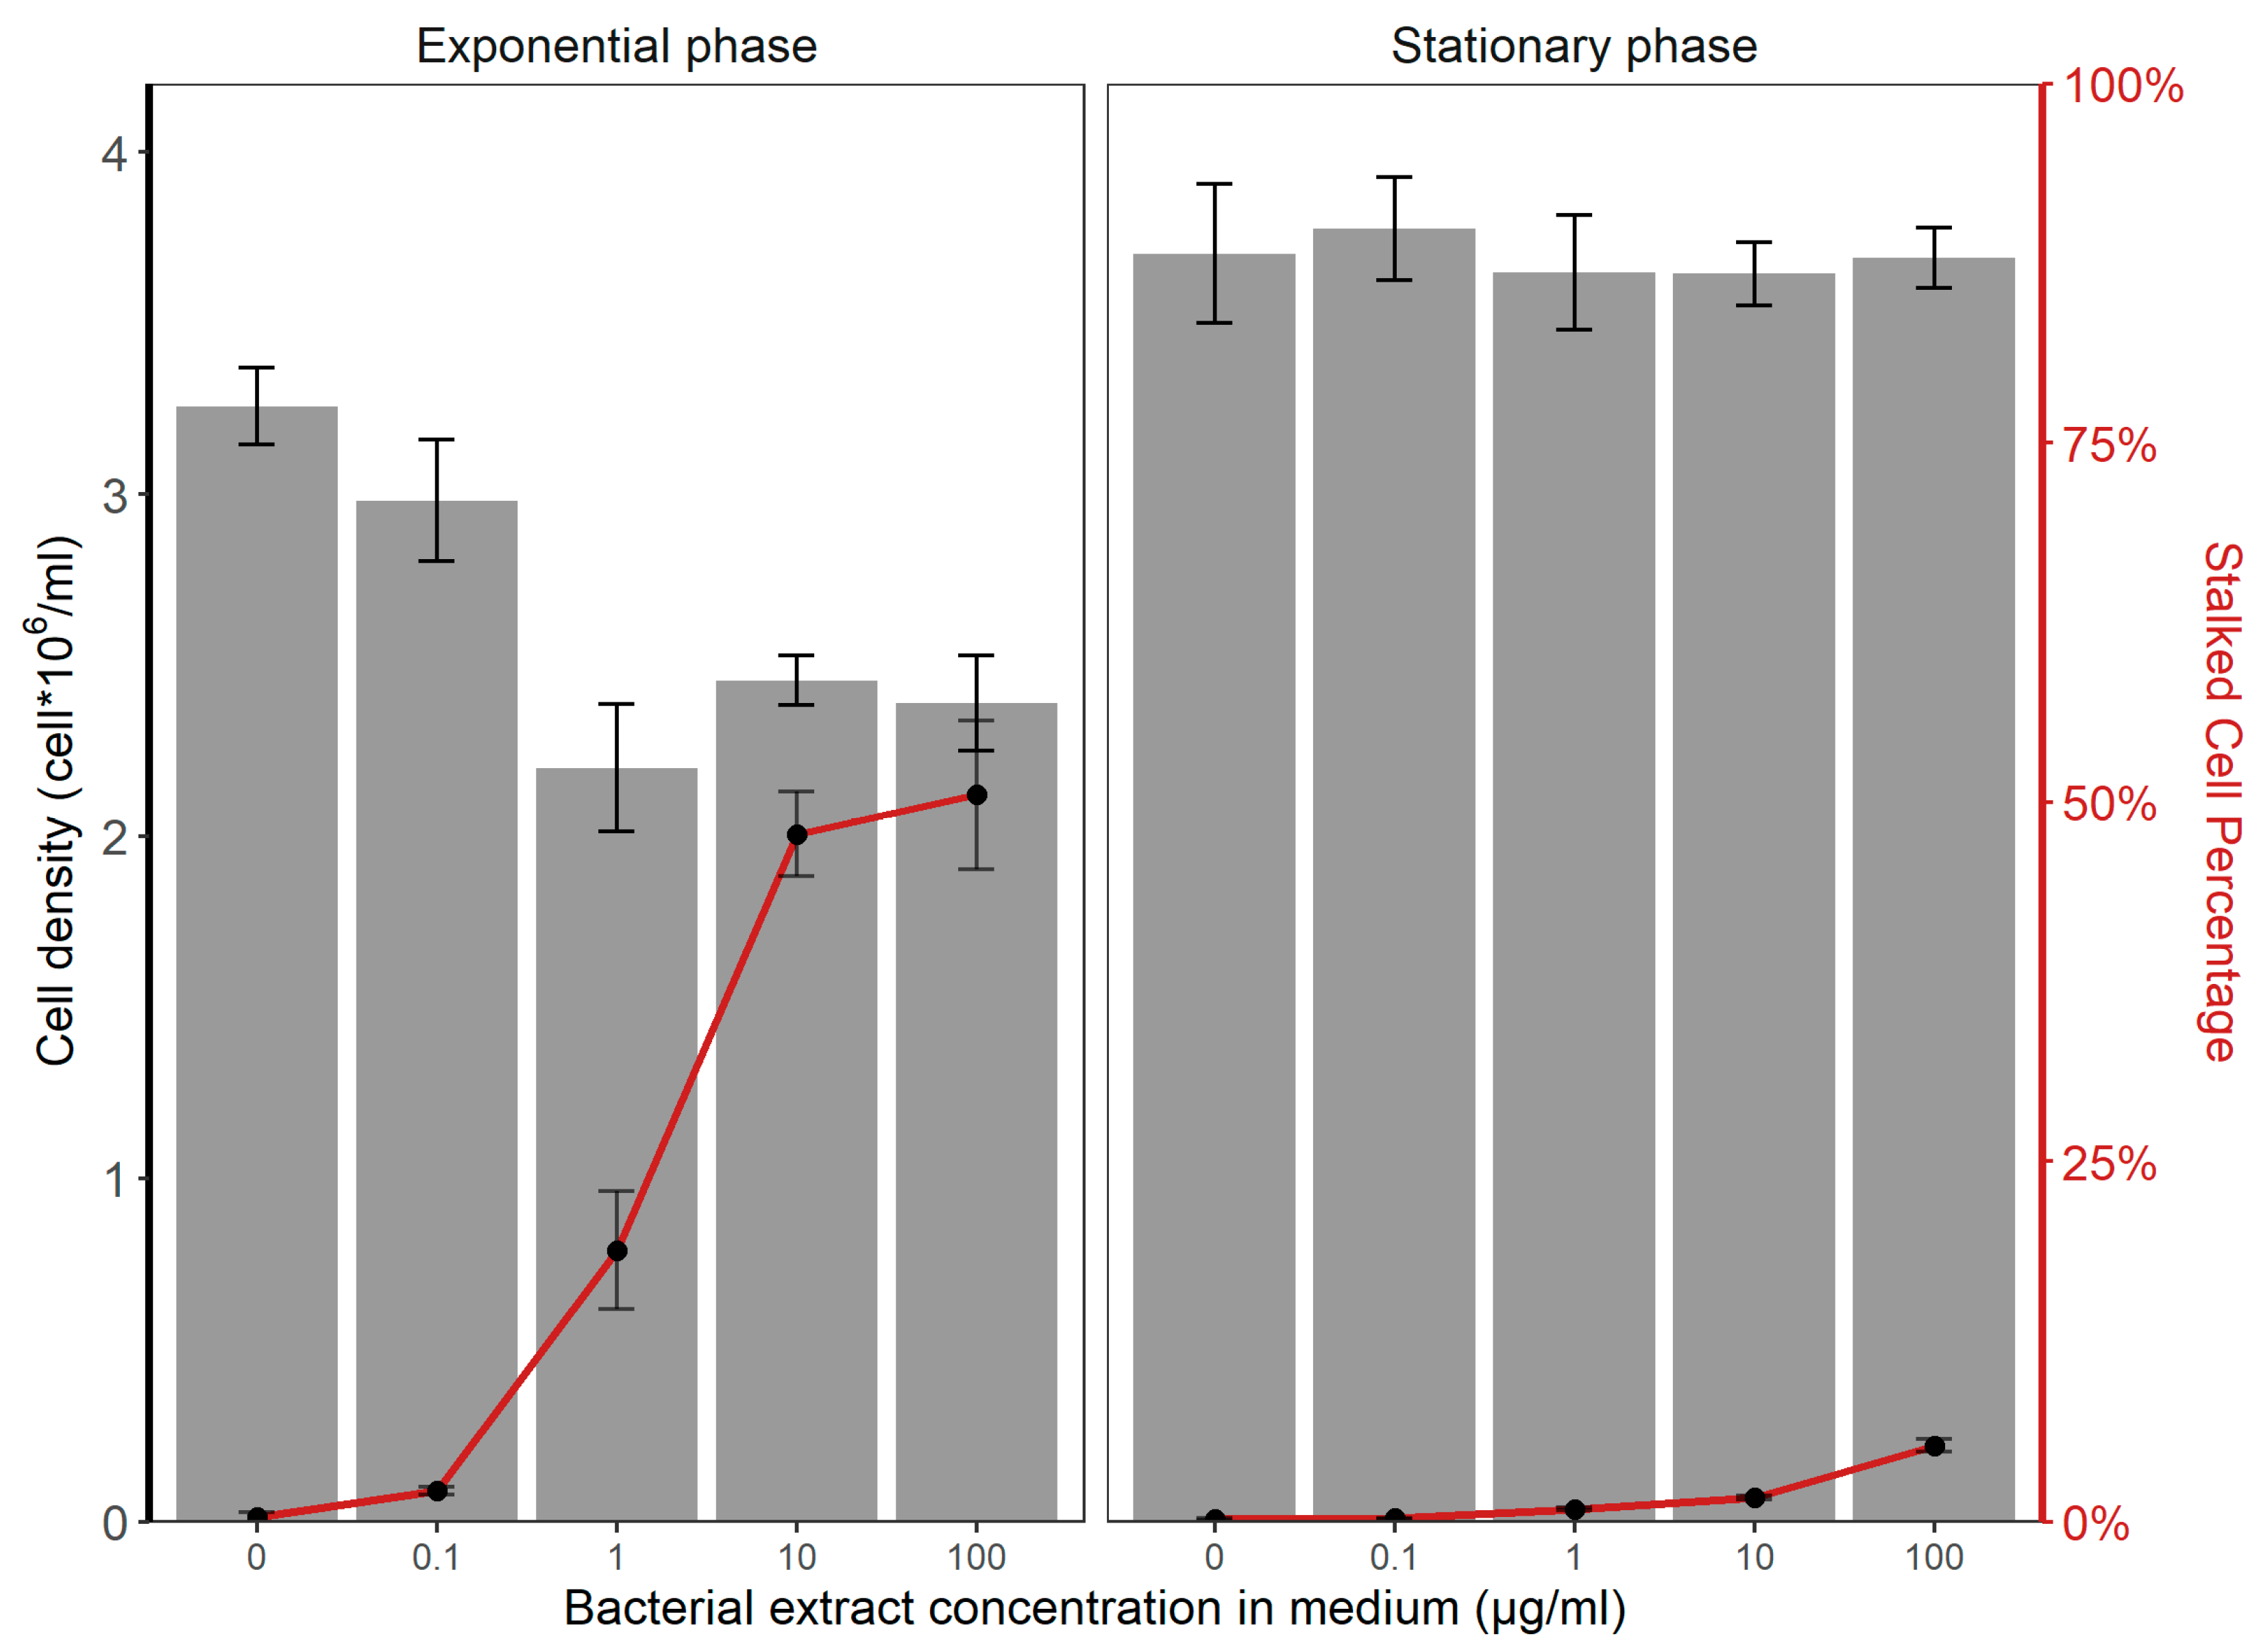
3.2. Differential Stalk Formation in Exponential and Stationary Cells

As stalk formation may depend on the physiological state of the cells, we studied whether cells in exponential or stationary phase could be induced to form stalks. Figure 3 shows that an increase of the final concentration of bacterial extract in diatom cultures from 0.1 μg/mL to 100 μg/mL slightly inhibited the cell density in the exponential phase, while the cell density in the stationary phase was hardly affected. There was a dramatic difference in stalk formation between cells in the exponential and stationary phase, respectively. Exponentially growing cells exhibited a very strong increase of stalk formation with increasing amounts of added stalk inducing bacterial extract, while the impact on stationary diatom cells was hardly detectable.

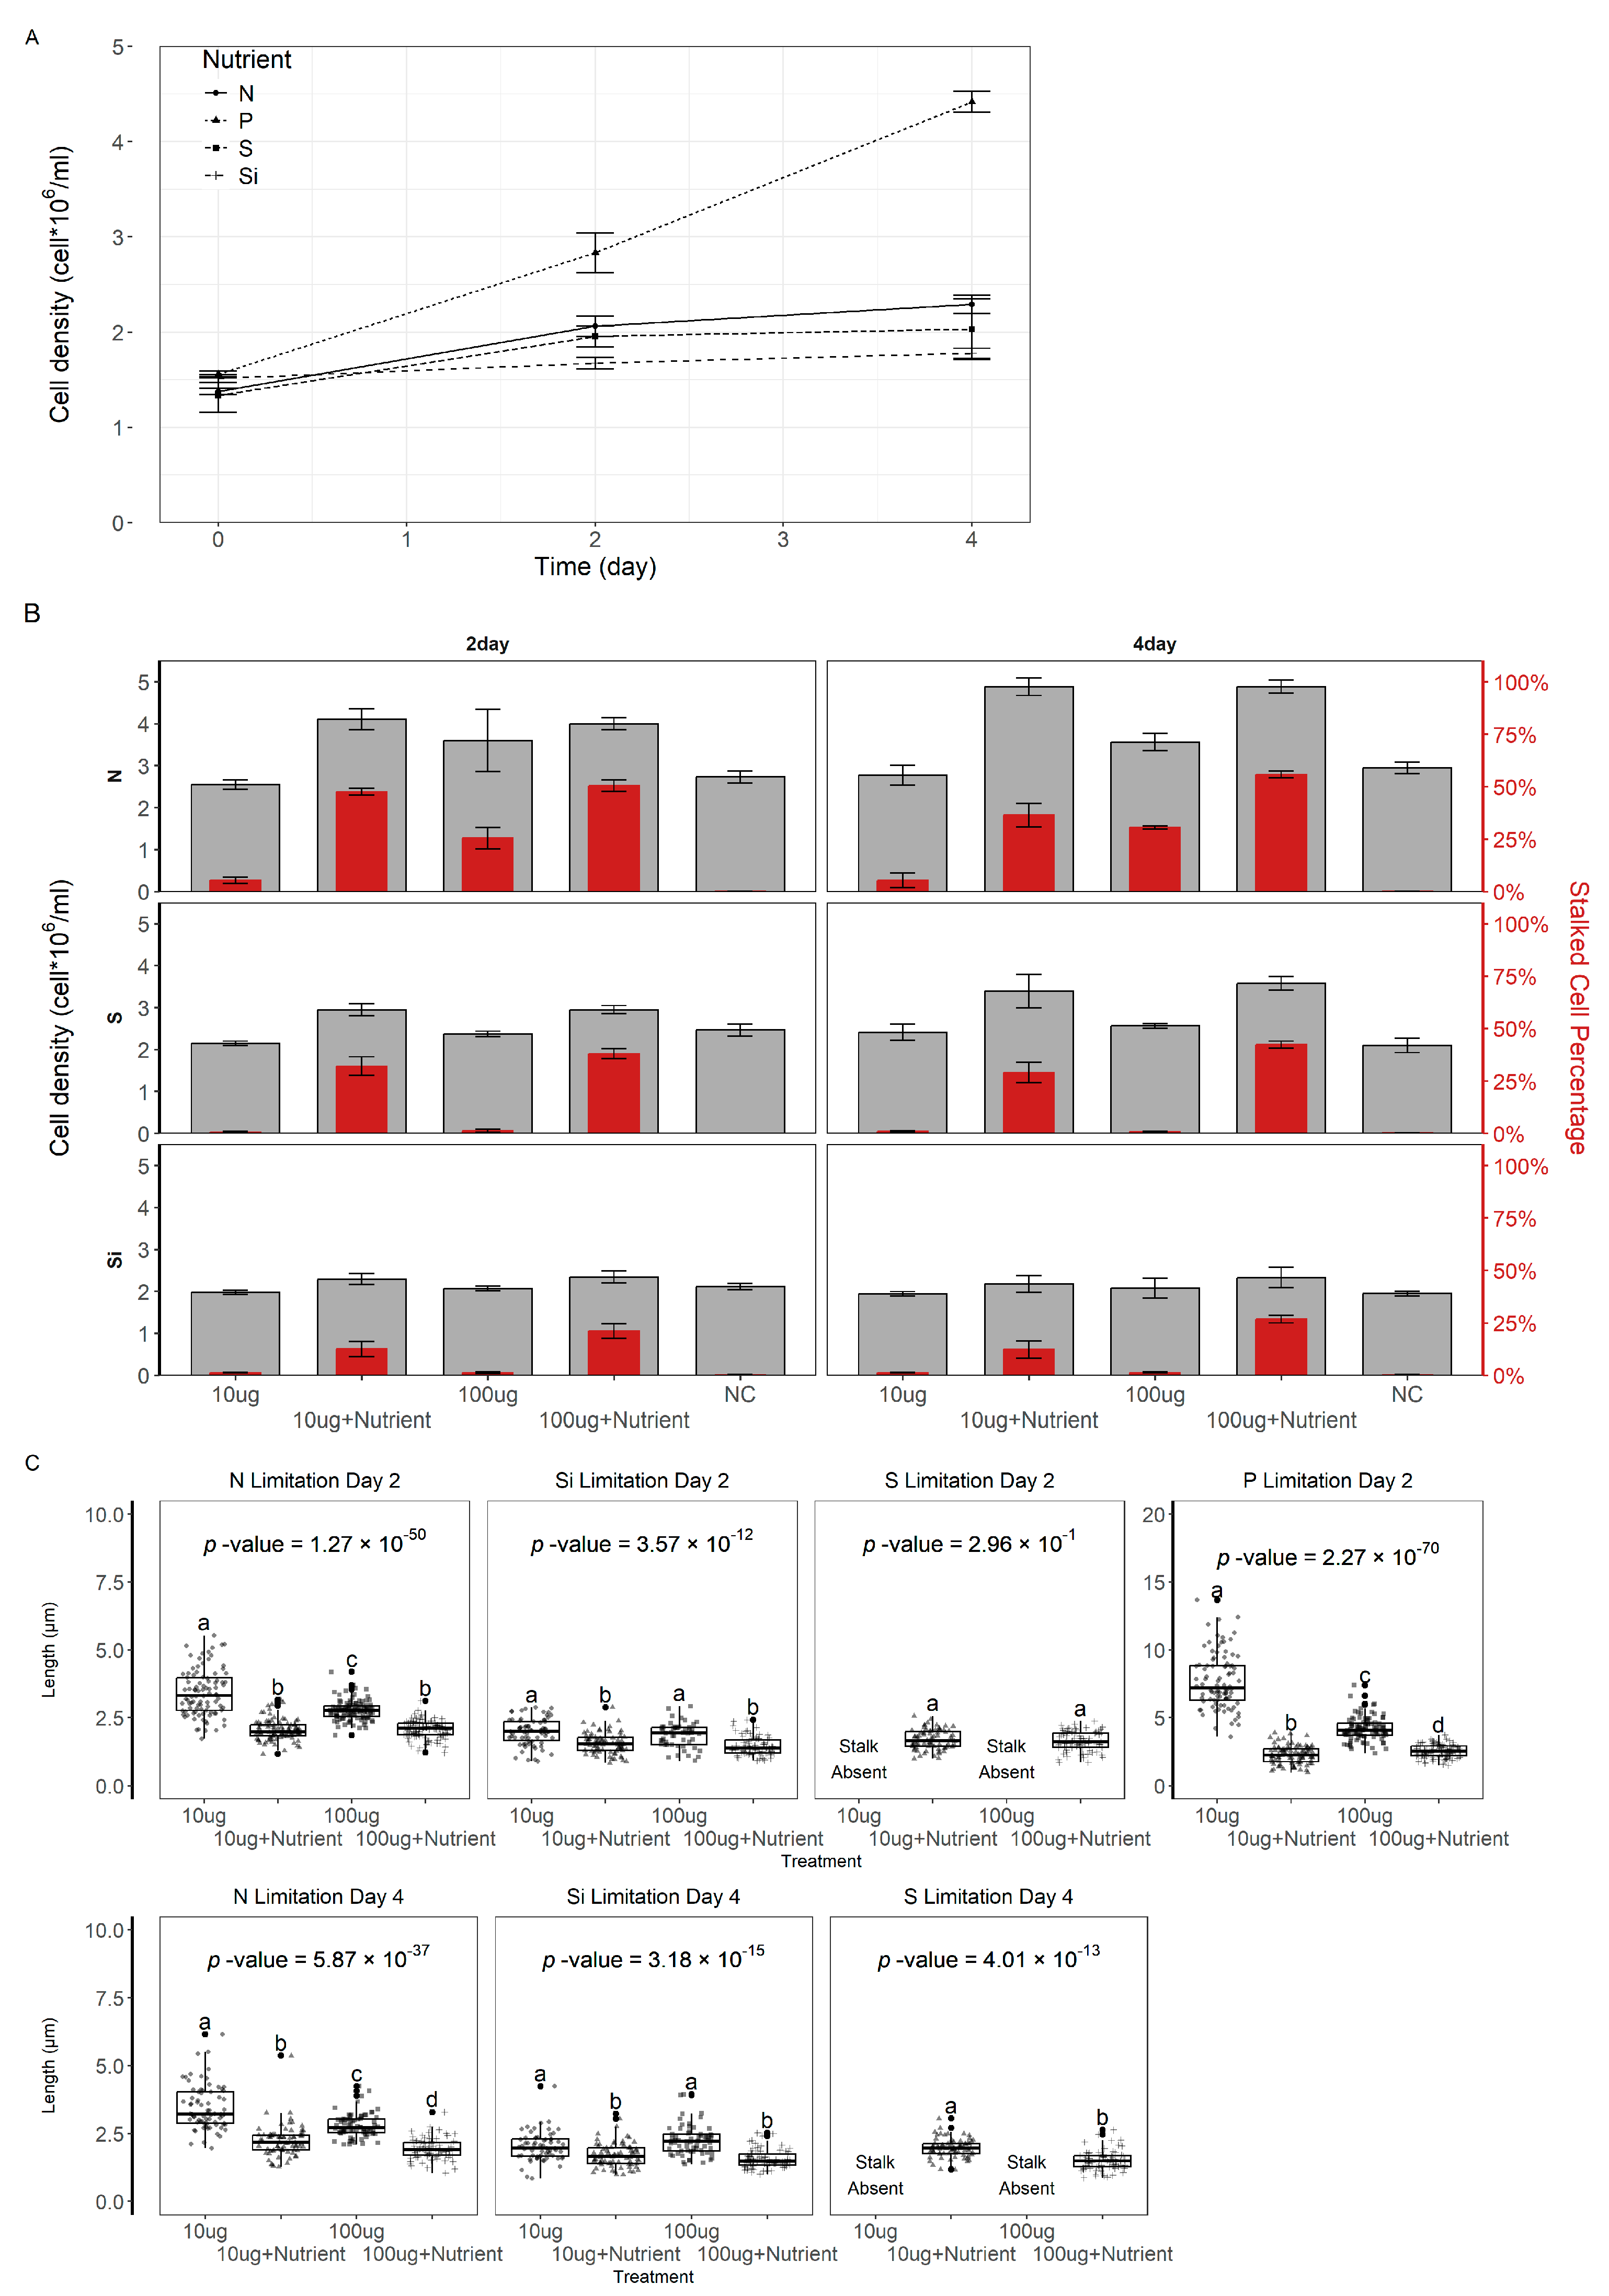
3.3. The Effect of Nutrient Limitation on Stalk Production

One explanation for the low stalk formation of cells in the stationary phase could be nutrient limitation; therefore, we added individual macronutrients like nitrate, sulfate, phosphate, and silicate to the diatoms in the stationary phase and followed stalk generation for 2 or 4 days after induction by the bacterial compound (Figure 4). The cell density after 2 days did not show larger fluctuations, nor did the percentage of cells with a stalk. A certain increase of stalked cell numbers was observed after the addition of silicate. The measured stalk lengths showed that the addition of nitrate reduced the stalk length, while the cells after supplementation with sulfate showed significantly increased stalk lengths.

3.4. Nutrient Limitation Inhibits Stalk Production

As some of the different macronutrients affect stalk formation or length, they either may be supporting stalk formation or could be part of the generated stalks. We therefore again induced stalk formation by addition of bacterial extracts but incubated the cells beforehand in culture media that either lacked or had strongly reduced amounts of one of these nutrients. We then added this specific nutrient and compared the responses to those cultures with no addition.
Figure 5A shows that a lack of nitrate, sulfate, or silicate strongly limited cellular growth, while the absence of phosphate affected cell division weakly. We followed growth and stalk formation for silica, sulfate, and nitrate (Figure 5B). While cell density did not change strongly in all conditions tested, we found that even after 4 days, no stalks were made when silica and sulfate were lacking, while stalks were made (up to 30% of the cells) despite a lack of nitrate. Replenishment of all the nutrients led to stalk formation, with sulfate addition leading to the strongest increase (up to 50% of the cells) when compared to an absence of the respective nutrients. Measurements of stalk lengths at the same conditions as for A and B (Figure 5C) indicate that the addition of a missing nutrient led to shorter stalks with the single exception of sulfate deprivation, where no stalks were detectable, while the addition of sulfate resulted in stalk elongation. Phosphate limitation resulted in exceptionally long stalks within 2 days when treated with 10 ug/mL of bacterial extracts, with stalk lengths reaching up to 7.7 ± 2 μm.

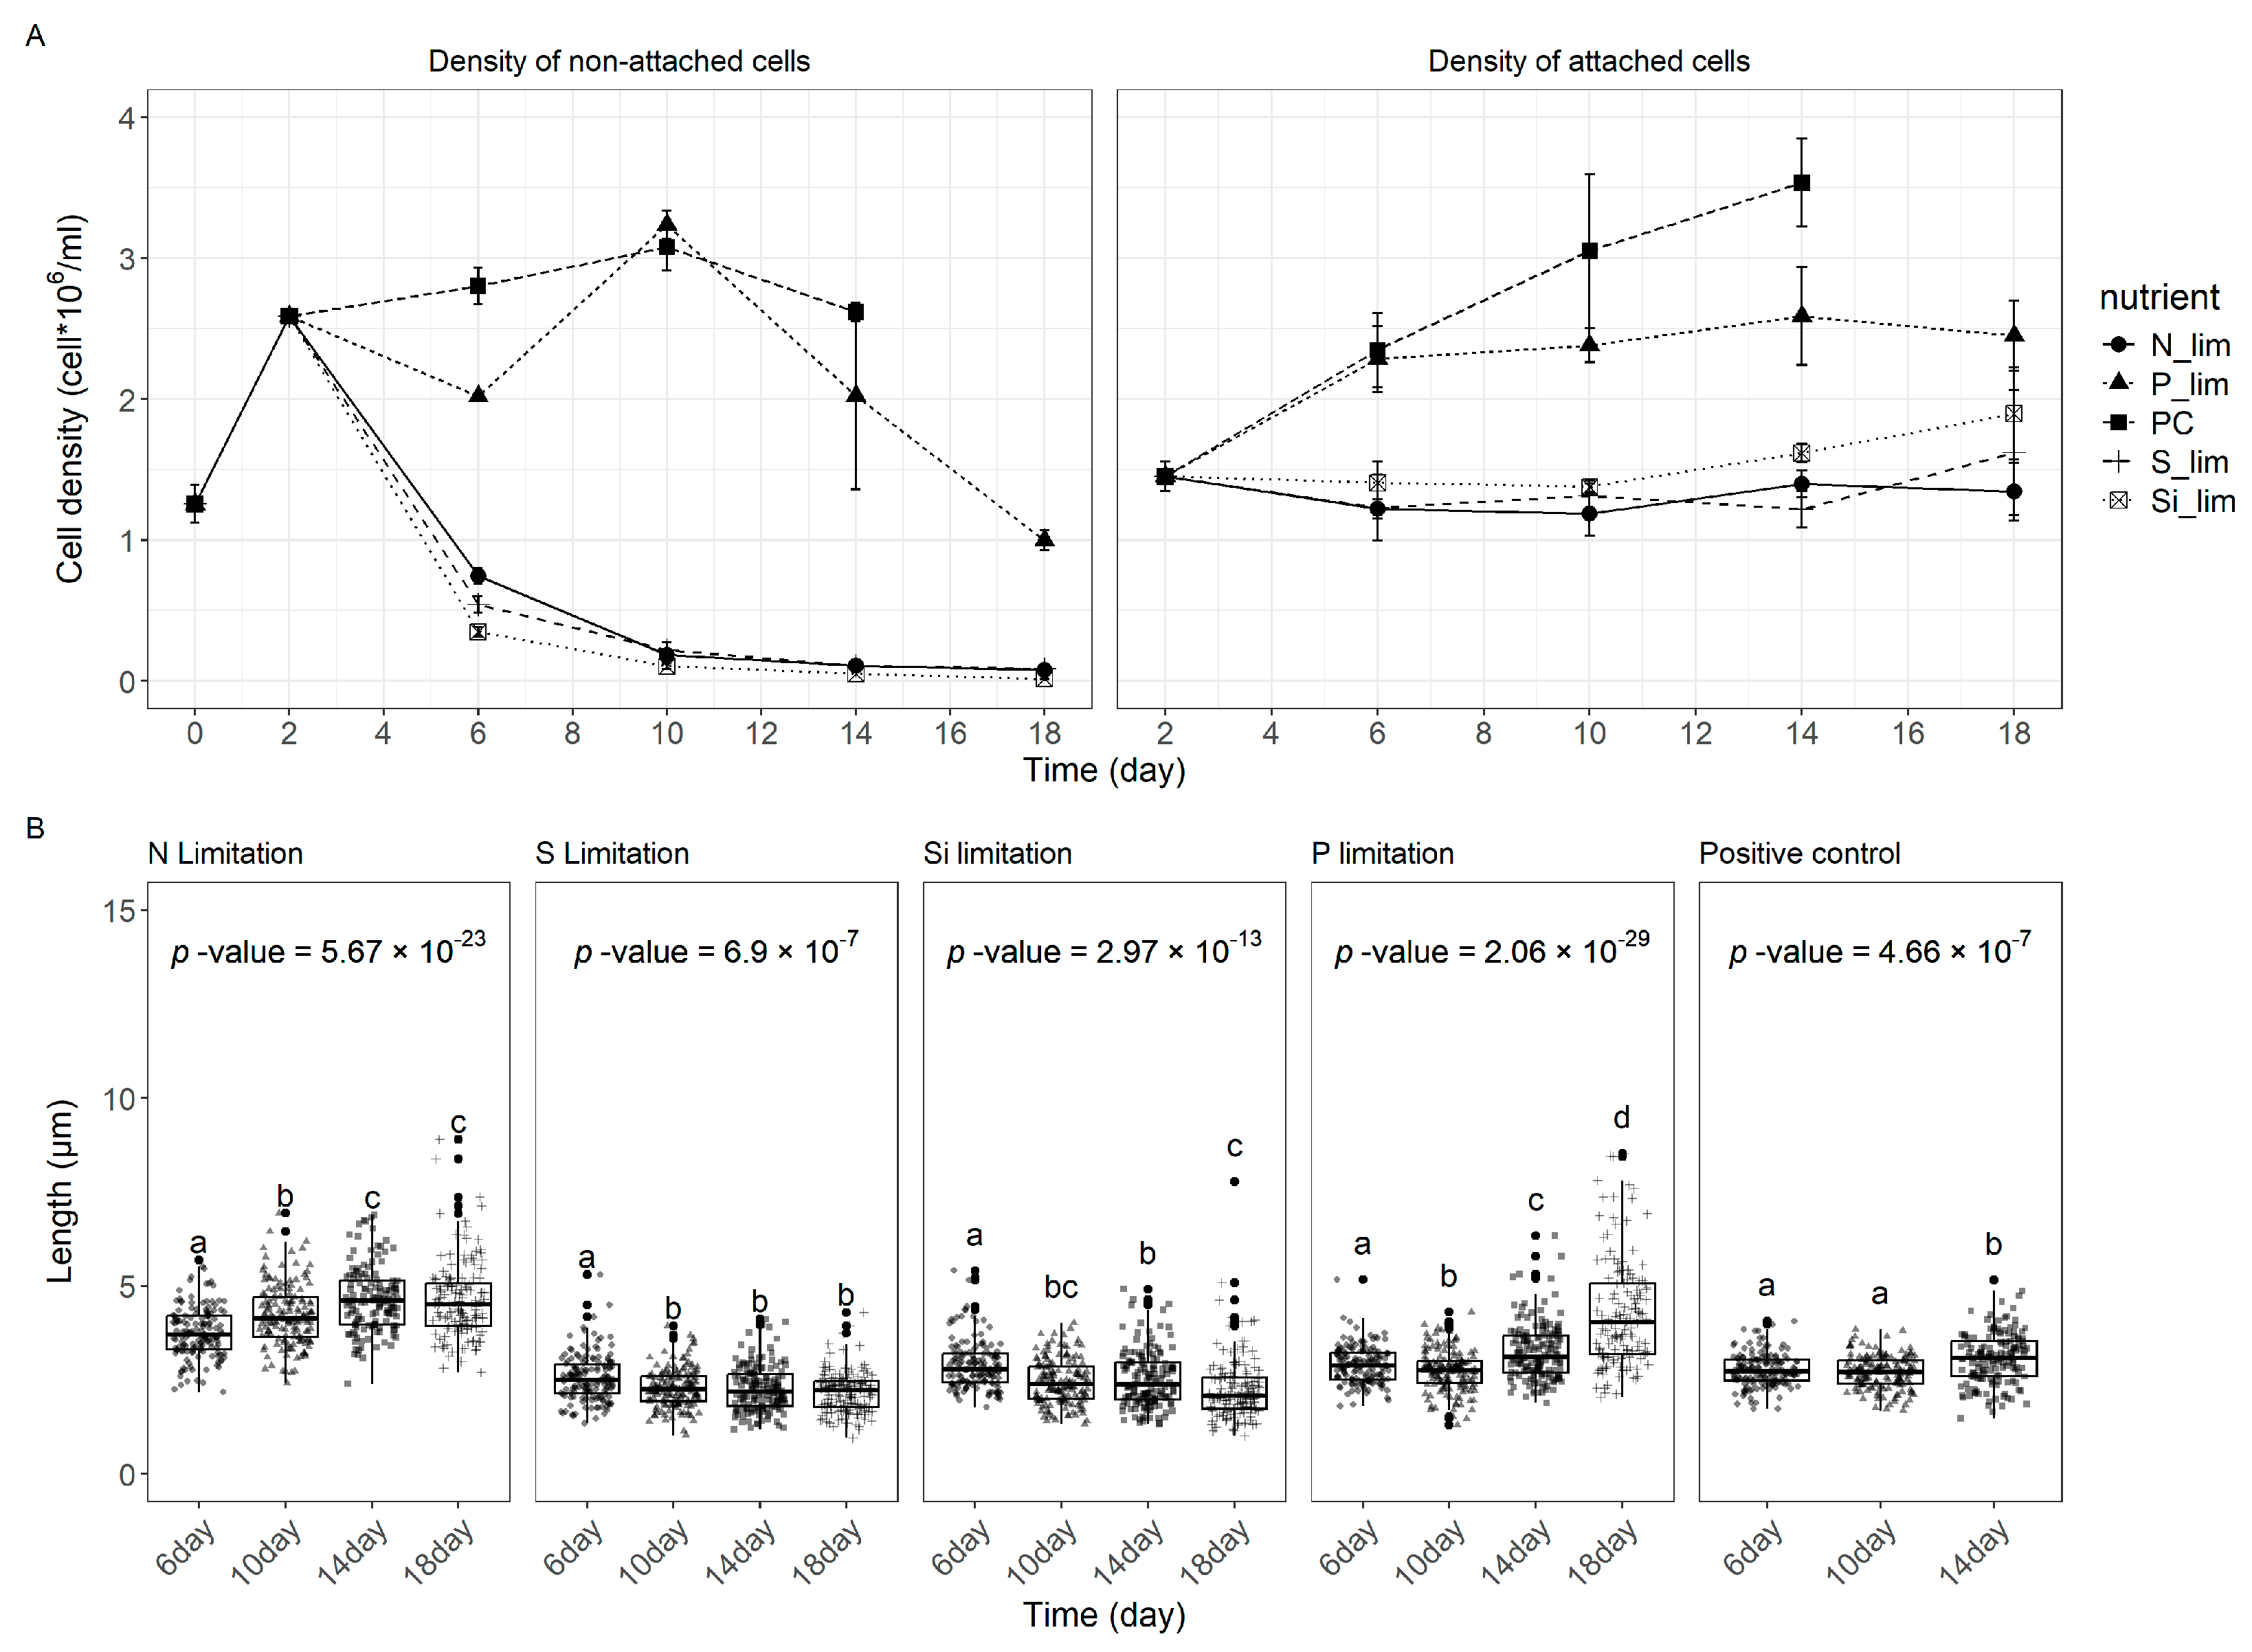
3.5. Nutrient Limitation on Stalked Cells

We furthermore tested the attachment of the cells to surfaces via the stalks in order to understand the nutrient requirements of attached and non-attached cells. First, we induced the formation of stalked cells with exponential phase cells and bacterial extracts (day 0). We first treated axenic exponentially growing cells with bacterial extracts for 2 days in order to allow the cells to settle and attach to the surface via stalks. We then poured off the supernatant and the non-attached cells in order to count them, and we added new media limited in specific nutrients (N, S, Si, P). This was repeated every 4 days, and cell counts and stalk lengths were recorded (Figure 6).
The cell densities of non-attached cells decreased significantly under N, S, and Si limitated conditions, with only a small population detectable after 10 days. In P-limited cultures, the non-attached cell density remained comparable to the positive control within the first 10 days but declined noticeably after 14 days. The density of the attached cells did not increase significantly over time in N- and S-limited groups, whereas a slight increase was observed in Si-limited cultures. In contrast, P-limited cultures showed a significant increase in attached cell numbers only within the first 6 days. In the positive control, the density of attached cells continued to rise throughout the experiment, accompanied by a stable yet significant population of non-attached cells.
Nitrate limitation led to a certain increase of stalk lengths from day 6 to day 14, with no further changes observed between day 14 and day 18. Under S- and Si-limiting conditions, no significant variation in stalk length was detected, but rather a slight decrease. In P-limited cultures, stalk length remained unchanged from day 6 to day 10 but exhibited a slight increase on day 14 and a significant increase by day 18.

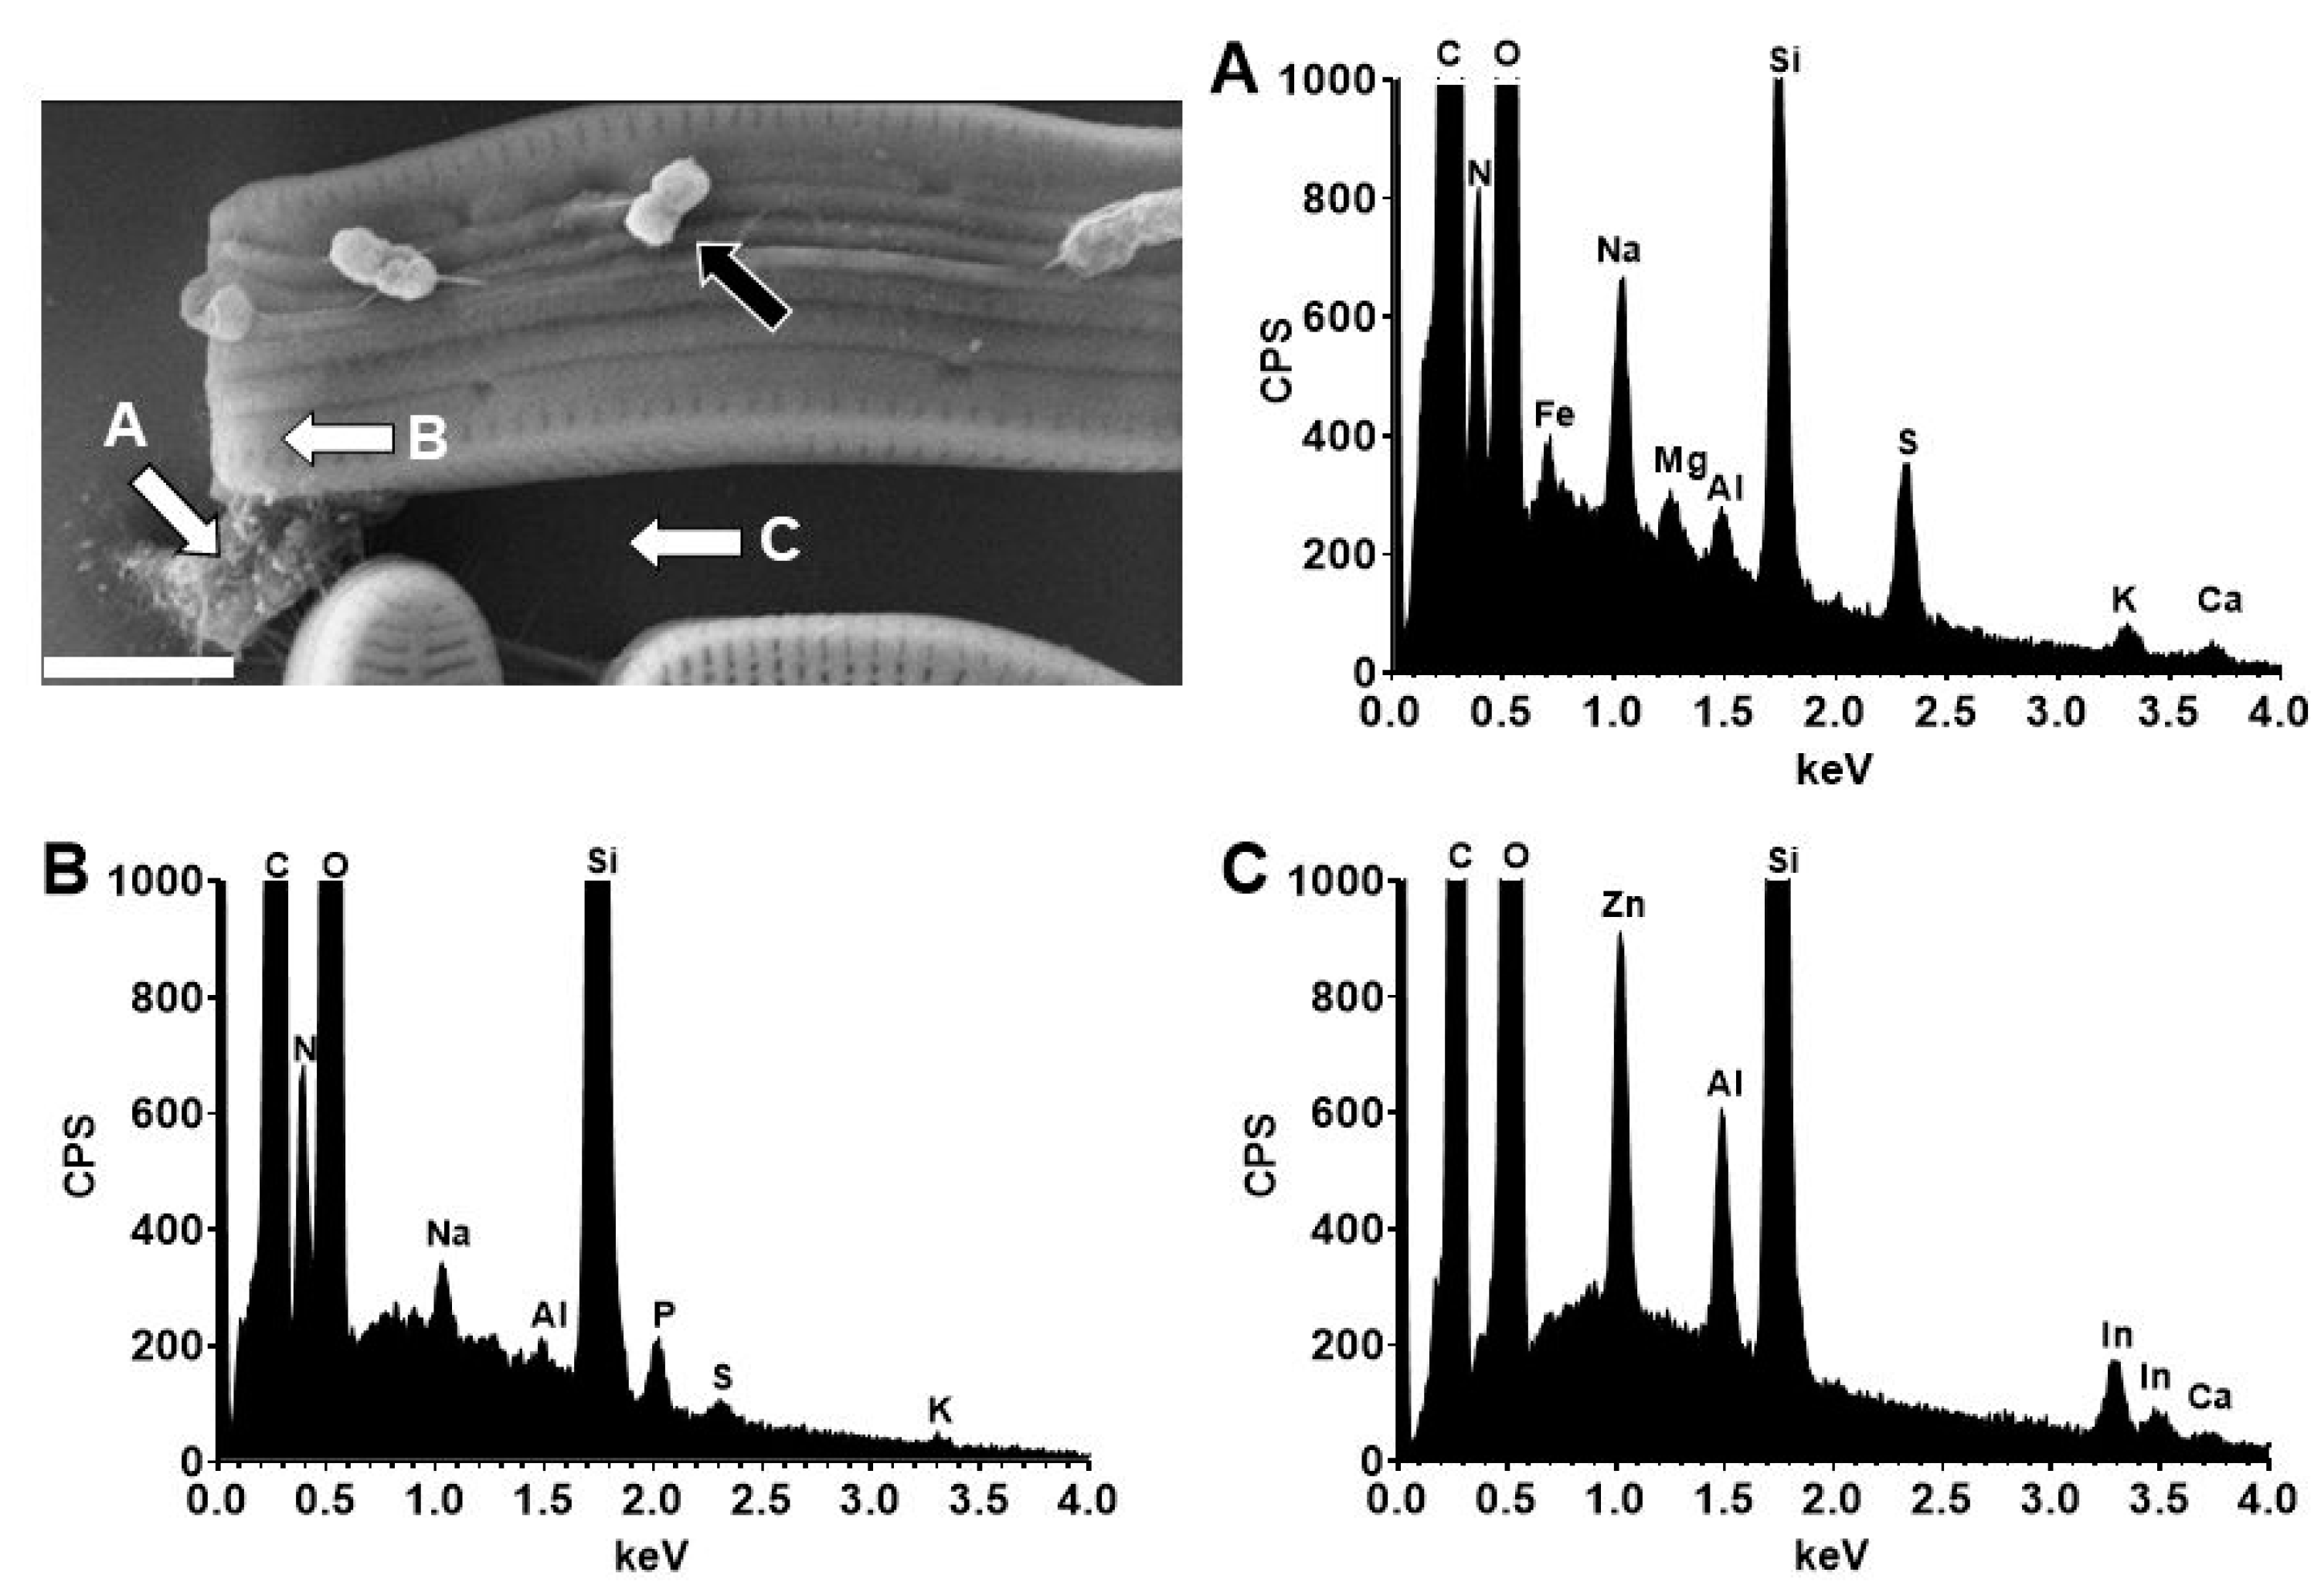
3.6. Identification of Sulfur in the Stalks of A. minutissimum

The experiments described above clearly demonstrate the importance of sulfur for stalk production. We therefore used scanning electron microscopy coupled to energy-dispersive X-ray spectroscopy (EDX) in order to investigate the molecular composition of the stalks in situ (Figure 7). The EDX analysis revealed the presence of sulfur (400 counts per second), when focusing on the stalk as well as a much smaller sulfur peak in the cell wall, while no sulfur was detected on the Thermanox matrix used for mounting the cells. The data clearly indicated that sulfur-containing compounds were abundant in the stalks of A. minutissimum.

4. Discussion

Attachment and colonization of surfaces require mechanisms to stick the cells to substrata. Diatoms are often early colonizers of newly available surfaces by forming adhesive stalks and capsules. There is evidence that the formation of a capsule may foster the attachment of bacteria [36]. The composition of the bacterial community also may play a role in the binding to capsules [37]. Producing capsules and stalks consumes a considerable amount of carbohydrates generated by photosynthesis [22]. Stalks are composed of organic EPS that comprise a larger number of compounds, while the main components are polysaccharides (mostly polymers of differently linked galactose and xylose [38]). Recent, more detailed analyses have indicated not only the presence of lipids, condensed aromatics, and heteroaromatic compounds, but also lignin to be present in EPS [6]. Different diatoms use stalks to stick to substrata and sometimes become nuisance species because of strong biofilm formation [39]. Understanding how stalk formation works and how it is regulated is important to understand their biological and ecological role.
The generation of stalks has been, in particular, studied in the diatom D. geminata under natural conditions, because the alga produces long-branched stalks in the light under nutrient-limited conditions (N or P) [22]. One reason for stalk elongation under nutrient limitation could be lifting the cells up to regions with higher water flow, as well as to avoid being washed away in the water stream [40]. It also has been discussed that carbohydrates are secreted under high-light conditions and/or nutrient limitation, when cell division is stalled, in order to eliminate excess light energy [22,33]. We here have studied stalk formation by the benthic diatom A. minutissimum under different nutrient conditions focusing on two main aspects: (i) the frequency of stalk formation among all cells, and (ii) the length of the stalks. The unbranched stalks of this species are much shorter than those of D. geminata; however, as stalk formation has been found to be induced by bacterial compounds [33], this offers us two major experimental advantages: We can follow the process of stalk formation directly after induction by bacterial compounds, and, as this allows working with axenic diatoms, the potential role of bacterial consumption or release of nutrients can be neglected. Under well-defined laboratory conditions, in contrast to field experiments, it is possible to reveal the direct effects on stalk formation caused by either the limitation or addition of individual nutrients.
As the main task of A. minutissimum stalks is to fix the cells to a (preferably optimal) surface, it suggests that the diatom strives for nutrient-rich conditions. However, when nutrient conditions change, it may be necessary to move to a different place by gliding, as A. minutissimum has been described as weakly motile or to uncouple from the stalk [41]. Nutrients play a crucial role for cell attachment, as evidenced by a varying response in stalk production under different nutrient limitations [22]. We found that nitrate limitation inhibited A. minutissimum cell division within four days, but it did not initially affect stalk production or elongation, which continued for at least for two weeks. However, the stagnation of stalk elongation after day 14 suggests that prolonged nitrate limitation ultimately impairs stalk production, possibly due to the depletion of stalk-related enzymes or by cell death. Nitrate supplementation significantly reduced stalk length, but the underlying mechanism for this effect remains unclear. One possibility could be that the addition of nutrients could revive stalled cell division during deprivation. As nutrient deprivation may inhibit cell division, increasing light intensities may also result in the necessity to dissipate excess energy [22]. A possible energy valve is the secretion of energy-rich carbohydrates in the form of EPS. Indeed, it was shown that stationary A. minutissimum cells increased the secretion of soluble carbohydrates [33].
A. minutissimum showed a peculiar behavior regarding phosphate limitations in contrast to other nutrient deprivations. The cells resumed growth even when phosphate was lacking in the medium and furthermore produced longer stalks. The reason for this, most likely, is the ability of the cells to store phosphates as osmotically inactive polyphosphates in organelles called acidocalcisomes [40]. This allows them to continue growth even when no external phosphate is available and to extend the stalks in order to be lifted to regions with higher water currents and possibly higher nutrient levels. It is likely that phosphorus is not a major structural component of stalks or at least does not play a significant role in their production. Instead, under P depletion, photosynthetic overflow may be channeled into stalk synthesis, resulting in unusually long stalks. Sulfur limitation showed a strong impact on stalk generation and elongation, being completely inhibited under sulfate-deprived conditions, while sulfate supplementation led to an increase in stalk length. The absence of stalks under sulfur limitation indicates that sulfur deficiency impairs the production of EPS, suggesting a fundamental dependency of these structures on sulfate. Indeed, sulfur-containing functionalities were determined by chemical analysis and by infrared (IR) and nuclear magnetic resonance (NMR) spectroscopy [6,42], fitting well to the observation of sulfur in A. minutissimum stalks by SEM–EDX.
Whereas the observed strong dependence of stalk formation on sulfur availability clearly results from the need of sulfur for sulfo-sugar building blocks for stalk formation [43], the inhibition of both stalk production and elongation under silica limitation was unexpected. It demonstrates that silica is crucial for stalk formation. This observation leads to three hypotheses: (1) Silica may be a structural component of stalk. Although with elaborate techniques, lignin has also been detected in stalks of D. geminata [6], there is no evidence yet for silica or silicified structures. (2) Silica may be essential for the spatial organization of polysaccharide structures. Because of the firmness of the frustules, the extrusion of polymers is necessarily limited to openings in the frustule [4]. We observed that A. minutissimum cells attaching to substrata usually turned the raphe-containing frustule to the surface, and the stalk forming EPS was secreted via the pores in the terminal raphe area, but not in the raphe itself. Silica limitation may potentially cause disorders in the frustule, potentially causing secretion from multiple diatom pores instead of being localized to one side of the raphe. (3) As silica limitation leads to the inhibition of cell division in diatoms [44], the cells enter a stationary phase in which possibly stalk formation is inhibited.

5. Conclusions

The biological function(s) of stalks for diatoms remains largely unsolved. Obviously, stalks support the attachment of diatom cells to surfaces and provide the basis for colonization of substrata. However, stalks may also help to move the cells out of nutrient-limited regions in biofilms [45] and to avoid being drifted away before the cells settle within a biofilm [45]. Although stalks also are regarded as photosynthetically driven EPS production as one way to eliminate excess light energy [22], in light of the requirement of potentially scarce nutrients such as sulfur and the possibility to secrete soluble carbohydrates [29], this function appears questionable and needs further investigation. Our results indicate that nutrients play an important role in stalk formation and, thus, in attachment of the cells to substrata. Regarding biofouling, stalked cells might be more prone to grazing as well as to shear forces, indicating that higher nutrient concentrations in aquatic systems may also increase the presence of nuisance species. Moreover, in addition to the availability of nutrients, A. minutissimum requires bacterial signals to initiate stalk formation. Therefore, future experiments are needed to study the interactions between diatoms and their microbial symbionts considering the influence of changing environmental conditions to shed further light into stalk formation.

Author Contributions

Conceptualization, P.G.K., P.J. and D.S.; methodology, P.J. and A.L.; formal analysis, P.J.; investigation, P.J., A.L. and K.H.; resources, P.G.K. and D.S.; data curation, P.J.; writing—original draft preparation, P.J.; writing—review and editing, P.G.K. and D.S.; visualization, P.J.; supervision, P.G.K.; project administration, P.G.K.; funding acquisition, P.J.K. and D.S. All authors have read and agreed to the published version of the manuscript.

Funding

This research received funding as part of the Excellence Strategy of the German Federal and State Governments, being part of a Research Initiative (“Chemical and physical biology approaches elucidating key molecular processes in cellular adaptation”) as well as the University of Konstanz.

Informed Consent Statement

Not applicable.

Data Availability Statement

Data are contained within the article.

Acknowledgments

The authors would like to thank Angelika Eckert and Annette Ramsperger for their excellent lab support, as well as Paavo Bergman and Michael Laumann at the Electron Microscopy Centre of the University of Konstanz.

Conflicts of Interest

The authors declare no conflicts of interest.

Abbreviations

The following abbreviations are used in this manuscript:
AMAchnanthidium medium
FDCFrequency of dividing cells
SEMScanning electron microscope
EDXEnergy dispersive X- ray analyses
DMSO Dimethyl sulfoxide

References

  1. Bruckner, C.G.; Kroth, P.G. Protocols for the Removal of Bacteria from Freshwater Benthic Diatom Cultures. J. Phycol. 2009, 45, 981–986. [Google Scholar] [CrossRef] [PubMed]
  2. Bahulikar, R.A.; Kroth, P.G. Localization of EPS components secreted by freshwater diatoms using differential staining with fluorophore-conjugated lectins and other fluorochromes. Eur. J. Phycol. 2007, 42, 199–208. [Google Scholar] [CrossRef]
  3. Hoagland, K.D.; Rosowski, J.R.; Gretz, M.R.; Roemer, S.C. Diatom extracellular polymeric substances: Function, fine structure, chemistry, and physiology. J. Phycol. 1993, 29, 537–566. [Google Scholar]
  4. Wustman, B.A.; Gretz, M.R.; Hoagland, K.D. Extracellular matrix assembly in diatoms (Bacillariophyceae) (I. A model of adhesives based on chemical characterization and localization of polysaccharides from the marine diatom Achnanthes longipes and other diatoms). Plant Physiol. 1997, 113, 1059–1069. [Google Scholar] [PubMed]
  5. Bahulikar, R.A.; Kroth, P.G. The Complex Extracellular Polysaccharides of Mainly Chain-Forming Freshwater Diatom Species from Epilithic Biofilms. J. Phycol. 2008, 44, 1465–1475. [Google Scholar] [CrossRef]
  6. Dütsch, L.; Brendler, E.; Zuber, J.; Viehweger, C.; Ehrlich, H.; Jesionowski, T.; Vogt, C. Structural characterization of the extracellular stalk material of the diatom Didymosphenia geminata. Anal. Bioanal. Chem. 2024, 416, 4341–4352. [Google Scholar] [CrossRef] [PubMed]
  7. Blunn, G.; Evans, L. Microscopical observations on Achnanthes subsessilis, with particular reference to stalk formation. Bot. Mar. 1981, 24, 193–199. [Google Scholar]
  8. Molino, P.J.; Wetherbee, R. The biology of biofouling diatoms and their role in the development of microbial slimes. Biofouling 2008, 24, 365–379. [Google Scholar] [CrossRef]
  9. Kawamura, T.; Roberts, R.D.; Nicholson, C.M. Factors affecting the food value of diatom strains for post-larval abalone Haliotis iris. Aquaculture 1998, 160, 81–88. [Google Scholar]
  10. Karouna, N.K.; Fuller, R.L. Influence of four grazers on periphyton communities associated with clay tiles and leaves. Hydrobiologia 1992, 245, 53–64. [Google Scholar] [CrossRef]
  11. Ellwood, N.; Whitton, B. Importance of organic phosphate hydrolyzed in stalks of the lotic diatom Didymosphenia geminata and the possible impact of atmospheric and climatic changes. Hydrobiologia 2007, 592, 121–133. [Google Scholar] [CrossRef]
  12. Aboal, M.; Marco, S.; Chaves, E.; Mulero, I.; García-Ayala, A. Ultrastructure and function of stalks of the diatom Didymosphenia geminata. Hydrobiologia 2012, 695, 17–24. [Google Scholar] [CrossRef]
  13. Bray, J.; O’Brien, J.; Harding, J.S. Production of phosphatase and extracellular stalks as adaptations to phosphorus limitation in Didymosphenia geminata (Bacillariophyceae). Hydrobiologia 2017, 784, 51–63. [Google Scholar] [CrossRef]
  14. Brogan, M.S.; Peckarsky, B.L.; Resasco, J. Consequences of nuisance algal blooms of Didymosphenia geminata on invertebrate communities in Rocky Mountain streams. Freshw. Sci. 2024, 43, 52–64. [Google Scholar] [CrossRef]
  15. Schultz, M.P.; Bendick, J.; Holm, E.; Hertel, W. Economic impact of biofouling on a naval surface ship. Biofouling 2011, 27, 87–98. [Google Scholar] [CrossRef] [PubMed]
  16. Woods, D.; Fletcher, R.; Jones, E. Diatom fouling of in-service shipping with particular reference to the influence of hydrodynamic forces. In Proceedings of the Ninth International Diatom Symposium, Bristol, UK, 24–30 August 1986; Biopress: Bristol, UK, 1986; pp. 49–59. [Google Scholar]
  17. Zargiel, K.A.; Swain, G.W. Static vs dynamic settlement and adhesion of diatoms to ship hull coatings. Biofouling 2014, 30, 115–129. [Google Scholar] [CrossRef]
  18. Perkins, K.; Sargison, J.; Hallegraeff, G. Diatom Fouling Problems in a Tasmanian Hydro Canal, Including the Description of Gomphomena tarraleahae sp. nov. Diatom Res. 2009, 24, 377–391. [Google Scholar] [CrossRef]
  19. Wysokowski, M.; Bartczak, P.; Żółtowska-Aksamitowska, S.; Chudzińska, A.; Piasecki, A.; Langer, E.; Bazhenov, V.V.; Petrenko, I.; Noga, T.; Stelling, A.L. Adhesive stalks of diatom Didymosphenia geminata as a novel biological adsorbent for hazardous metals removal. CLEAN–Soil Air Water 2017, 45, 1600678. [Google Scholar] [CrossRef]
  20. Jędrzejczak, P.; Collins, M.N.; Jesionowski, T.; Klapiszewski, Ł. The role of lignin and lignin-based materials in sustainable construction–a comprehensive review. Int. J. Biol. Macromol. 2021, 187, 624–650. [Google Scholar] [CrossRef]
  21. Smith, D.J.; Underwood, G.J. The production of extracellular carbohydrates by estuarine benthic diatoms: The effects of growth phase and light and dark treatment. J. Phycol. 2000, 36, 321–333. [Google Scholar]
  22. Kilroy, C.; Bothwell, M. Environmental Control of Stalk Length in the Bloom-Forming, Freshwater Benthic Diatom Didymosphenia geminata (Bacillariophyceae). J. Phycol. 2011, 47, 981–989. [Google Scholar] [CrossRef] [PubMed]
  23. Kilroy, C.; Bothwell, M.L. Attachment and short-term stalk development of Didymosphenia geminata: Effects of light, temperature and nutrients. Diatom Res. 2014, 29, 237–248. [Google Scholar] [CrossRef]
  24. Hagström; Larsson, U.; Hörstedt, P.; Normark, S. Frequency of dividing cells, a new approach to the determination of bacterial growth rates in aquatic environments. Appl. Environ. Microbiol. 1979, 37, 805–812. [Google Scholar]
  25. Cantonati, M.; Angeli, N.; Virtanen, L.; Wojtal, A.Z.; Gabrieli, J.; Falasco, E.; Lavoie, I.; Morin, S.; Marchetto, A.; Fortin, C. Achnanthidium minutissimum (Bacillariophyta) valve deformities as indicators of metal enrichment in diverse widely-distributed freshwater habitats. Sci. Total Environ. 2014, 475, 201–215. [Google Scholar] [CrossRef]
  26. Hlúbiková, D.; Ector, L.; Hoffmann, L. Examination of the type material of some diatom species related to Achnanthidium minutissimum (Kütz.) Czarn.(Bacillariophyceae). Algol. Stud. 2011, 136, 19. [Google Scholar] [CrossRef]
  27. Windler, M.; Gruber, A.; Kroth, P.G. Purification of benthic diatoms from associated bacteria using the antibiotic imipenem. J. Endocytobiosis Cell Res. 2012, 22, 62–65. [Google Scholar]
  28. Ponader, K.C.; Potapova, M.G. Diatoms from the genus Achnanthidium in flowing waters of the Appalachian Mountains (North America): Ecology, distribution and taxonomic notes. Limnologica 2007, 37, 227–241. [Google Scholar] [CrossRef]
  29. Windler, M. Bacterial Influence on Diatoms from Photoautotrophic Freshwater Biofilms. Dissertation. 2014. Available online: http://nbn-resolving.de/urn:nbn:de:bsz:352-0-287999 (accessed on 1 March 2025).
  30. Kassambara, A. rstatix: Pipe-Friendly Framework for Basic Statistical Tests. 2023. Available online: https://cran.r-project.org/web/packages/rstatix/index.html (accessed on 1 March 2025).
  31. R Core Team. R: A Language and Environment for Statistical Computing; R Foundation for Statistical Computing: Vienna, Austria, 2024; Available online: https://www.r-project.org/ (accessed on 1 March 2025).
  32. Wickham, H. ggplot2: Elegant Graphics for Data Analysis; Springer: New York, NY, USA, 2016. [Google Scholar] [CrossRef]
  33. Windler, M.; Leinweber, K.; Bartulos, C.R.; Philipp, B.; Kroth, P.G. Biofilm and capsule formation of the diatom Achnanthidium minutissimum are affected by a bacterium. J. Phycol. 2015, 51, 343–355. [Google Scholar] [CrossRef]
  34. Astafyeva, Y.; Gurschke, M.; Streit, W.R.; Krohn, I. Interplay between the microalgae Micrasterias radians and its symbiont Dyadobacter sp. HH091. Front. Microbiol. 2022, 13, 1006609. [Google Scholar] [CrossRef]
  35. Gao, J.-l.; Sun, P.; Wang, X.-M.; Qiu, T.-L.; Lv, F.-Y.; Yuan, M.; Yang, M.-M.; Sun, J.-G. Dyadobacter endophyticus sp. nov., an endophytic bacterium isolated from maize root. Int. J. Syst. Evol. Microbiol. 2016, 66, 4022–4026. [Google Scholar] [CrossRef]
  36. Leinweber, K.; Kroth, P.G. Capsules of the diatom Achnanthidium minutissimum arise from fibrillar precursors and foster attachment of bacteria. PeerJ 2015, 3, e858. [Google Scholar] [CrossRef]
  37. Koedooder, C.; Stock, W.; Willems, A.; Mangelinckx, S.; De Troch, M.; Vyverman, W.; Sabbe, K. Diatom-bacteria interactions modulate the composition and productivity of benthic diatom biofilms. Front. Microbiol. 2019, 10, 1255. [Google Scholar] [CrossRef]
  38. Figueroa, F.A.; Abdala-Díaz, R.; Hernández, V.; Pedreros, P.; Aranda, M.; Cabrera-Pardo, J.R.; Pérez, C.; Becerra, J.; Urrutia, R. Invasive diatom Didymosphenia geminata as a source of polysaccharides with antioxidant and immunomodulatory effects on macrophage cell lines. J. Appl. Phycol. 2020, 32, 93–102. [Google Scholar] [CrossRef]
  39. Bishop, I.W.; Spaulding, S.A. Life cycle size dynamics in Didymosphenia geminata (Bacillariophyceae). J. Phycol. 2017, 53, 652–663. [Google Scholar] [CrossRef]
  40. Lapointe, A.; Kocademir, M.; Bergman, P.; Ragupathy, I.C.; Laumann, M.; Underwood, G.J.; Zumbusch, A.; Spiteller, D.; Kroth, P.G. Characterization of polyphosphate dynamics in the widespread freshwater diatom Achnanthidium minutissimum under varying phosphorus supplies. J. Phycol. 2024, 60, 624–638. [Google Scholar] [CrossRef]
  41. Jüttner, I.; Hamilton, P.B.; Wetzel, C.E.; Van De Vijver, B.; King, L.; Kelly, M.G.; Williams, D.M.; Ector, L. A study of the morphology and distribution of four Achnanthidium Kütz. species (Bacillariophyta), implications for ecological status assessment, and description of two new European species. Cryptogam. Algol. 2022, 43, 147–176. [Google Scholar] [CrossRef]
  42. Wang, Y.; Lu, J.; Mollet, J.-C.; Gretz, M.R.; Hoagland, K.D. Extracellular matrix assembly in diatoms (Bacillariophyceae) (II. 2, 6-Dichlorobenzonitrile inhibition of motility and stalk production in the marine diatom Achnanthes longipes). Plant Physiol. 1997, 113, 1071–1080. [Google Scholar]
  43. Abdullahi, A.S.; Underwood, G.J.; Gretz, M.R. Extracellular matrix assembly in diatoms (bacillariophyceae). v. environmental effects on polysaccharide synthesis in the model diatom, Phaeodactylum tricornutum. J. Phycol. 2006, 42, 363–378. [Google Scholar]
  44. Brzezinski, M.A.; Olson, R.J.; Chisholm, S.W. Silicon availability and cell-cycle progression in marine diatoms. Mar. Ecol. Prog. Ser. 1990, 67, 83–96. [Google Scholar]
  45. Lapointe, A. Strategies of the Ubiquitous Freshwater Diatom Achnanthidium minutissimum in Response to Phosphate Limitation. Dissertation University of Konstanz. 2022. Available online: http://nbn-resolving.de/urn:nbn:de:bsz:352-2-15l1qqyc8r6w98 (accessed on 1 March 2025).
Figure 1. Morphological responses of A. minutissimum to experimental treatments 2 days after stalk induction. (A) Control: addition of 0.3% DMSO (v/v) to A. minutissimum, (B) addition of 0.3% DMSO + 10 µg/mL bacterial extract, (C) addition of 10 µg/mL bacterial extract (DMSO-free), (D) negative control (untreated medium). Light microscopy images (lower panels, AD) depict crystal violet-stained A. minutissimum cells 48 h post induction. Arrows point to stalks. Scale bar: 10 μm.
Phycology 05 00013 g001
Figure 2. Responses of A. minutissimum cells to the addition of identical amounts of bacterial extract dissolved in different DMSO concentrations after 2 days of incubation. (A) Cell densities and measured stalk lengths after incubation in different DMSO concentrations. The bar plot shows the cell density measured 2 days after addition of the bacterial extracts, which declined with increasing DMSO concentrations. The red line indicates the percentage of cells producing a stalk. (B) The box plot shows the induced stalk lengths observed at four different DMSO concentrations. Error bars indicate the standard deviation (SD) of each group, the p-value of Welch’s ANOVA is displayed in the figure. Groups with different letters (a, b) indicate significant differences based on the Games-Howell post hoc test (p < 0.05), whereas group with same letters shows no significant difference.
Phycology 05 00013 g002
Figure 3. Responses of A. minutissimum cells either in the exponential or in the stationary growth phase to the addition of different concentrations of bacterial extracts after 2 and 4 days. The bar plots indicate the cell densities of A. minutissimum at different concentrations of the bacterial stack-inducing compound (logarithmic scale). Line plots: Percentage of cells producing a stalk under these conditions. Error bars indicate the standard deviation (SD) of each group.
Phycology 05 00013 g003
Figure 4. Responses of A. minutissimum cells to nutrient supplementation 2 and 4 days after induction with bacterial compound being in a stationary phase. (A) The gray bar plot represents cell densities of A. minutissimum after supplementation with individual nutrients (same concentrations as in the original culture medium). N: nitrate; S, sulfate, P: phosphate, Si: silicate, PC: positive control (addition of bacterial extract); NC: negative control (no bacterial compound added). The smaller red bars indicate the percentage of cells producing a stalk. 10u2D/10u4D: 10 µg compound added, measured after 2 and 4 days; 100u2D/100u4D: 100 µg compound added, measured after 2 and 4 days. (B) The box plot below shows the distribution of stalk length in A. minutissimum cells after different supplementations. ANOVA values as well as significance are shown. Error bars indicate the standard deviation (SD) of each group. Groups with different letters (a, b, c, d) indicate significant differences based on the Games-Howell post hoc test (p < 0.05), whereas group with same letters shows no significant difference.
Phycology 05 00013 g004
Figure 5. Response of A. minutissimum cells to nutrient limitation. Cells were pre-cultivated in the absence of N, S, or Si for 4 days, for P limitation for 18 days. At t = 0, bacterial compound was added, and the cells were cultivated for 2 and 4 days with or without the indicated nutrient. (A) Growth curves of A. minutissimum under different nutrient deprivation. (B) Cell densities (bar plot) and percentage of cells with stalks (red bar plot) under deprivation of the respective nutrient after 2 and 4 days. 10/100 µg: amount of compound added to 1 mL of culture. NC: no bacterial compound, no added nutrient. (C) Distribution of stalk lengths in A. minutissimum cells at the same conditions as described for (B). Error bars indicate the standard deviation (SD) of each group. Groups with different letters (a, b, c, d) indicate significant differences based on the Games-Howell post hoc test (p < 0.05) whereas group with same letters shows no significant difference.
Phycology 05 00013 g005
Figure 6. Dynamics of A. minutissimum cell growth under different nutrient limitation. After 2 days of induction with bacterial compound, the non-attached cells were removed every four days together with the culture medium and counted, while new media (lacking either N, S, Si, or P) were added to the attached cells. (A) The line plot shows the changes of cell densities of attached and non-attached populations over time at the respective conditions. PC: positive control containing all nutrients. (B) Box plots indicate the distribution of stalk lengths of the attached cells at different time points. Error bars indicate the standard deviation (SD) of each group. Groups with different letters (a, b, c, d) indicate significant differences based on the Games-Howell post hoc test (p < 0.05) whereas group with same letters shows no significant difference.
Phycology 05 00013 g006
Figure 7. (Upper left): SEM micrograph of A. minutissimum co-cultivated with Dyadobacter sp. 32. The white arrows indicate the spots for the shown EDX spectra (A, B, C). The black arrow indicates a bacterium attached to the frustule of A. minutissimum. Scale bar: 1 µm. (AC): EDX spectra of the respective spots. (A) Stalk (spectra peaks 0.70, 1.25, and 2.46 keV corresponding to iron (Fe), magnesium (Mg), and sulfur (S), respectively). (B) Frustule (spectra peaks at 2.01 and 2.46 keV indicate phosphorous (P) and sulfur (S) signals). (C) Thermanox matrix covered with carbon (C).
Phycology 05 00013 g007
Disclaimer/Publisher’s Note: The statements, opinions and data contained in all publications are solely those of the individual author(s) and contributor(s) and not of MDPI and/or the editor(s). MDPI and/or the editor(s) disclaim responsibility for any injury to people or property resulting from any ideas, methods, instructions or products referred to in the content.

