Article

Application of Airfoil Arrays on Building Façades as a Passive Design Strategy to Improve Indoor Ventilation

Faculty of Architecture and Art, University of Guilan, Rasht 41996-13776, Iran
*
Author to whom correspondence should be addressed.
Architecture 2025, 5(3), 64; https://doi.org/10.3390/architecture5030064
Submission received: 28 June 2025 / Revised: 25 July 2025 / Accepted: 7 August 2025 / Published: 18 August 2025

Abstract

Natural ventilation could be established as an effective passive design strategy for increasing air changes per hour in a built environment. Modern air conditioning systems often fail to provide sufficient fresh air, potentially causing health issues for occupants. In contrast, natural ventilation offers an effective alternative for maintaining sufficient indoor air quality in buildings. This study explores the application of grouped airfoil arrays on building façades as an innovative passive design to enhance the air change rate. Numerical simulations were conducted to analyze various airfoil configurations, determining the most effective design for building a façade. Three groups, including symmetrical, semi-symmetrical, and flat-bottomed grouped airfoils, were selected according to their aerodynamic properties and potential impacts on airflow dynamics. For this purpose, a typical high-rise residential building was selected as a case study for field measurement and CFD simulation. The results indicated that symmetrical airfoil arrays could increase the air changes per hour (ACH) up to 23 times per hour with a wind velocity of 0.37 m/s at 10 m above ground, whereas their bidirectional performance ensured stable airflow regardless of wind direction. Although semi-symmetrical airfoil arrays maximize air capture and induce beneficial turbulence, the ACH within a residential unit was boosted up to 16 times per hour under the same outdoor wind velocity conditions. The ACH was 14 times per hour for the flat-bottom airfoils, serving as a comparative baseline and providing insights into the performance advantages of more complex designs.

1. Introduction

The building sector accounts for about 36% of total primary energy consumption and 39% of CO2 emissions [1]. Residential and commercial buildings are significant contributors to climate change, whereas HVAC systems account for 38% of energy use in homes [2] and 40–50% of electricity consumption in commercial spaces [3], underscoring the urgent need for enhanced standards and retrofitting measures. The percentage of energy dedicated to heating or cooling ranges from 18% to 73% of total building energy consumption [4]. This range is influenced by several factors, including the type of building (residential versus commercial), climate, and whether the region is classified as developing or developed country [5].
Improved indoor air quality through natural ventilation is essential for reducing indoor pollutants such as CO2, volatile organic compounds (VOCs), and odors by introducing fresh outdoor air [5,6], effectively lowering harmful substance concentrations indoors. This approach not only enhances energy efficiency by reducing reliance on mechanical ventilation systems [6] and cutting operational costs, it also contributes to occupant health and comfort by mitigating issues such as sick building syndrome and promoting well-being and productivity [7].
Ventilation requirements in buildings are influenced by several key factors. One of the most significant is occupancy density; higher densities necessitate increased ventilation to effectively manage carbon dioxide (CO2) levels and pollutants generated by occupants [8]. Different areas within a building, such as kitchens and bathrooms compared to living rooms and bedrooms, have distinct ventilation requirements based on their specific activities. Certain sources of pollutants, such as volatile organic compounds (VOCs) emitted from building materials or equipment, may require increased ventilation rates to ensure optimal air quality [9]. Additionally, climate and outdoor air quality are critical factors that influence the feasibility and effectiveness of natural ventilation strategies.
Research indicates that increasing initial ventilation rates by 10 cfm (4.7 L/s) per person can enhance work performance by approximately 0.8% [10]. Standards such as ASHRAE 62.2-2016 recommend minimum ventilation rates of 0.35 air changes per hour or no less than 15 cfm per person in residential settings [11,12]. European regulations regarding ventilation rates vary significantly, with air changes per hour in dwellings ranging from 0.23 to 1.21, and local exhaust rates spanning from 4.2 to 41.7 L/s [13]. These variations highlight the complexity and necessity of developing appropriate ventilation strategies that are tailored to the specific characteristics of buildings and regional conditions.
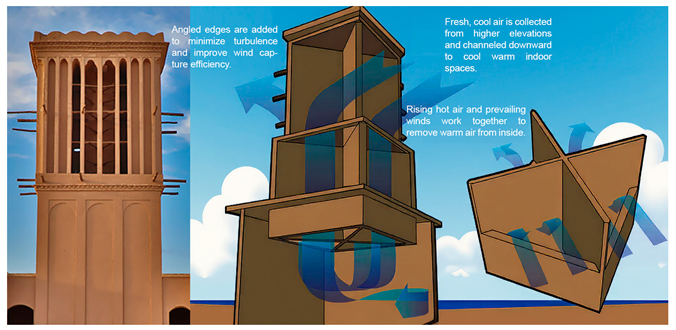
Previous studies on wind-driven ventilation through architectural elements have underscored their crucial role in naturally ventilated buildings [14]. Elements such as inlet and outlet openings, balcony dimensions, vernacular features, atriums, courtyards, wind towers, wing walls, chimneys, dome roofs, turbine ventilators, and more all influence airflow dynamics [15,16,17,18]. Table 1 summarizes the performance of these components in generating wind-driven ventilation. Their effectiveness is influenced by outdoor wind speed and direction, element size, terrain, and surrounding structures.
Strategic design plays a crucial role in facilitating natural ventilation. The placement and dimensions of inlet and outlet openings on façades significantly influence airflow and ventilation efficiency. The size and configuration of windows determine both the volume and speed of airflow within interior spaces [19]. Additionally, traditional and modern wind towers, especially in warm climates, further enhance natural ventilation [20]. Building envelope design, such as perforated screens or double-skin façades, can optimize airflow. In high-rise residential buildings, optimizing window-to-wall ratios and incorporating ventilation shafts have proven effective in enhancing ventilation performance. Dynamic façade systems, assessed through computational fluid dynamics (CFD) simulations, present promising adaptive strategies to improve both natural ventilation and thermal comfort. These advancements equip architects and engineers with valuable insights for designing more sustainable and efficient buildings.
A review of the literature informs this research by identifying knowledge gaps and selecting appropriate methodologies. Previous studies on natural ventilation and indoor environmental quality have highlighted architectural strategies with significant potential that are rarely implemented in actual building designs. This study explores the use of airfoil surfaces as an innovative concept for generating wind-induced ventilation. It examines the application of grouped airfoils on façades to create pressure differentials, thereby increasing indoor air velocity and air changes per hour (ACH). The study posits that manipulating building façades with grouped airfoils can enhance indoor airflow, ultimately contributing to occupant comfort.
The study specifically evaluates symmetrical airfoils, triple airfoil arrays, and flat-bottom airfoils in terms of their aerodynamic performance and impact on indoor airflow. These shapes were selected due to the limited research available on their effectiveness in ventilation, providing an opportunity to contribute original findings. The choice of symmetrical, semi-symmetrical, and flat-bottom airfoils is supported by their distinct aerodynamic properties and potential to enhance natural ventilation. The research utilizes a typical high-rise residential building in Kuala Lumpur, Malaysia, as a case study and employs numerical simulations to analyze various airfoil configurations.
Table 1. Effective elements for ventilation enhancement in buildings.
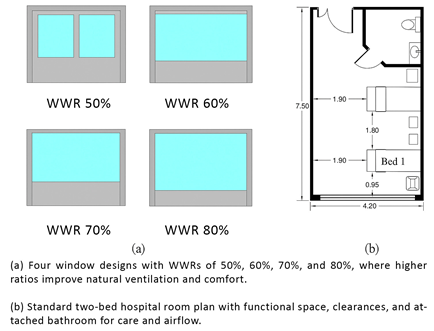
No.Device Type and FeatureScheme of DevicePerformance and Potential
1Window size, type, vertical level, and configurationArchitecture 05 00064 i001
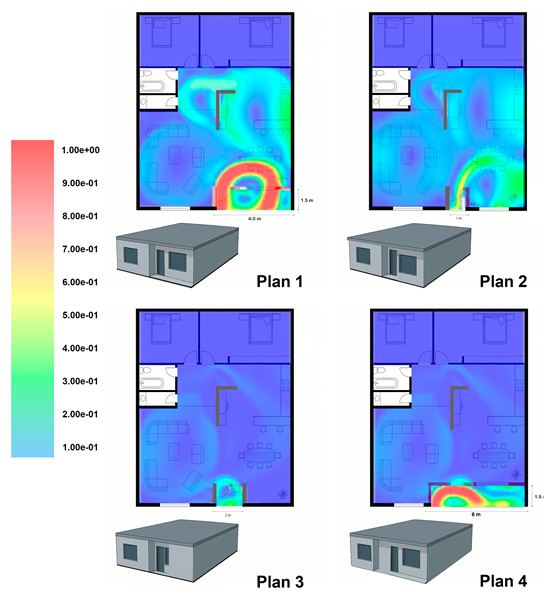
Passive ventilation type: The primary method of natural ventilation in domestic buildings [21]. The effect of the relative vertical level of the inlet and outlet openings [21,22].
Factors such as the relative vertical positioning of inlet and outlet openings, the inclusion of perpendicular windows to enhance cross-ventilation, and the use of louvered windows to improve pressure dynamics further contribute to optimizing airflow. Ventilation airflow rates typically range from 0.03 to 0.04 m3/h, underscoring the importance of integrating these elements to create effective and sustainable building environments [23,24,25,26].
2Window-to-floor/wall ratioArchitecture 05 00064 i002The window-to-floor/wall ratio (WFR) is a crucial indicator of a building’s potential for natural ventilation and thermal performance. A larger WFR increases the openings available for outdoor air, thereby enhancing airflow, cross-ventilation, and air exchange rates. This improvement contributes to lower indoor peak temperatures and better air quality, particularly in naturally ventilated buildings located in tropical climates [27,28,29,30].
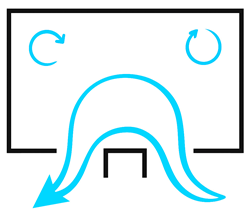
3Wing wallsArchitecture 05 00064 i003They can deliver up to 40% of the outdoor wind speed into the room. Without wing walls, only 15% can enter the building [31,32,33].
4Balcony at the building façadeArchitecture 05 00064 i004Variations in balcony depth and opening dimensions affect the distribution of airflow velocity [34]. The shape and dimensions of a balcony significantly affect wind pressure and indoor air velocity [35].
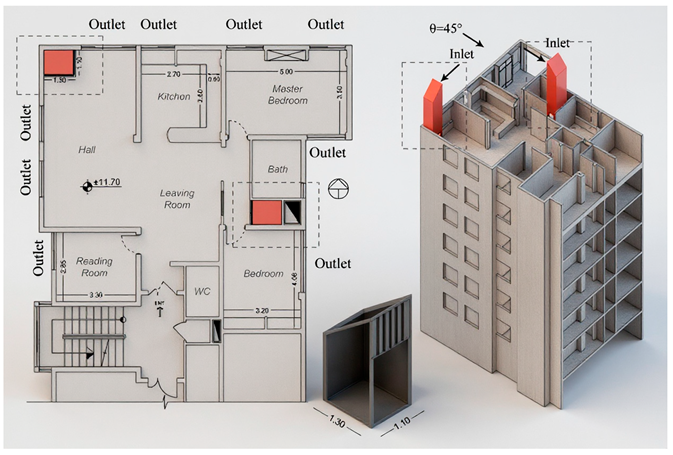
5Wind towerArchitecture 05 00064 i005
Applied traditionally in dwellings in hot and arid climates [36,37].
A wind tower can provide up to 20 ACH at an external wind speed of 1 ms−1 in a perpendicular direction [37]. The overall performance is influenced by its height, wind speed, and direction.
6Single-Sided Wind Tower (SSWT)Architecture 05 00064 i006
Single-sided wind tower at floor level [38].
SSWTs have a ventilation rate that was about 38% superior to that of the Double-Skin Facade Twin Face System (DSF-TFS) in terms of ventilation efficiency [38].
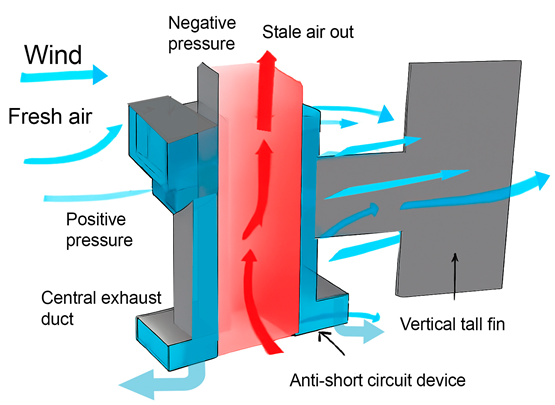
7Four-sided Wind TowersArchitecture 05 00064 i007Wind towers, including the Single-Sided Wind Tower (SSWT) and the Four-Sided Wind Tower, are engineered to capture wind flow and channel it into buildings. This design enhances indoor air velocity by 10–50% and decreases energy consumption by 20–50%, ultimately improving thermal comfort [38,39].
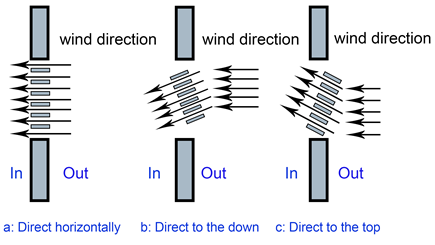
8Screen louvers at the openingArchitecture 05 00064 i008They can direct airflow in various directions within indoor spaces at a vertical level. Additionally, they can regulate the rate at which air enters based on outdoor wind velocities [21]. When the wind velocity outside is high, the louvers can decrease the rate of incoming airflow by adjusting their angle [40].
9Atrium-Based SystemsArchitecture 05 00064 i009They utilize the stack effect and wind-driven ventilation to allow warm air to rise and exit, drawing in cooler air from below. This approach reduces reliance on mechanical systems, improves air quality, and enhances thermal comfort [41].
10Double-Skin Facade (DSF)Architecture 05 00064 i010It creates a ventilated air gap between two façade layers to improve airflow and reduce thermal loads [38,42,43].
11Multi-Opening Wind Towers:Architecture 05 00064 i011The total ventilation rate for the four-sided system is 4.97 ACH, while the multi-opening system has a ventilation rate of 5.5 ACH [38].
The effectiveness of a windcatcher is significantly influenced by the size, shape, and positioning of its inlet and outlet openings [44].
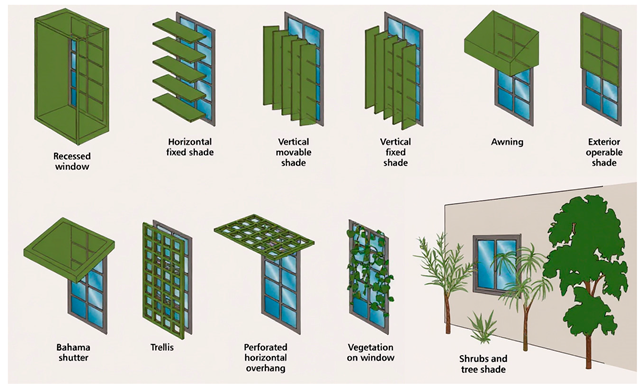
12Shading DevicesArchitecture 05 00064 i012The effectiveness of shading devices is significantly influenced by their orientation and the surrounding climate, highlighting their nuanced impact on airflow [45,46].
By minimizing temperature differentials that can disrupt natural ventilation patterns, they facilitate smoother airflow while simultaneously improving energy efficiency and reducing thermal discomfort by up to 65% [47,48].
13Optimizing Building Orientation and Urban LayoutArchitecture 05 00064 i013In certain areas, the dense construction and limited open spaces typical of compact urban forms are recognized as factors that can impede airflow and ventilation within buildings. The principle of designing urban layouts to minimize obstructions and facilitate unobstructed airflow is essential for improving natural ventilation strategies [38,49,50,51].

2. Materials and Methods

The current study investigates the application of grouped airfoils on building façades to assess their impact on air change per hour (ACH) within a unit of a high-rise (HR) building. To this end, an HR residential building located in a tropical climate was selected as a case study to evaluate the effectiveness of the proposed concept. Computational fluid dynamics (CFD) simulations were conducted to analyze the air change rate within the selected unit. The CFD results were validated against experimental data for the scenario without any airfoils. Subsequently, a comparative analysis was performed to evaluate the differences in ACH magnitudes for various shapes and configurations of airfoils in an array.
The selected case study focuses on a high-rise residential building situated in Kuala Lumpur, Malaysia, which is characterized by tropical climate conditions. This study evaluates three distinct airfoil configurations: symmetrical airfoils, semi-symmetrical airfoils, and flat-bottom airfoils. Each configuration is selected for its unique aerodynamic properties, which can significantly influence indoor airflow patterns and improve air change rates (ACH). Numerical simulations utilizing CFD serve as the primary methodological approach.
Initially, baseline simulations are conducted to establish the natural ventilation performance of the building without any airfoil interventions. Subsequent simulations analyze the effectiveness of symmetrical airfoils in facilitating bidirectional airflow and ensuring stable ventilation under varying wind conditions. The performance of triple airfoil arrays is assessed for their ability to maximize air capture and induce beneficial turbulence, potentially leading to a significant increase in ACH within the units. A comparative analysis includes the evaluation of flat-bottom airfoils, providing a baseline for understanding the advantages of more complex airfoil designs.

2.1. Building Description

A high-rise residential building in downtown Kuala Lumpur, Malaysia, was selected as a case study. The building consists of 17 floors, qualifying it as a high-rise structure according to the Emporis Standard (ESN 18727) [52]. Figure 1a illustrates the southern façade of the building, which features fifteen stories and two penthouses at the top. The floor-to-floor height of each unit is 3.1 m, including a ceiling thickness of 0.3 m. Glazed aluminum-frame sliding doors are installed in all living rooms, opening onto balconies to allow natural light and air into the units. The building’s design is octagonal, with its front elevation oriented to the west. Figure 1b presents the typical floor plan of the block. Each floor comprises eight units arranged in a south–north and southeast–northwest orientation. All rooms are well-ventilated, particularly the living rooms, which feature large windows. The entrance door is located opposite the living room window, facilitating cross-ventilation. To evaluate the effectiveness of airfoils in achieving acceptable ACH, a location in front of the balcony, near the living room window, was selected for simulation.
A southern unit, as shown in Figure 1, was selected on the 8th floor to examine the impact of airfoil arrays on the indoor air change rate. Figure 2 presents an architectural plan of the selected unit, illustrating the positions of its various component rooms.

2.2. Airfoil Arrays

Airfoils are widely used in a variety of aerodynamic devices, including airplanes, fans, and turbines. The shape of an airfoil creates distinct pressure and velocity distributions as a fluid flows around it. Consequently, air velocity can be increased when the flow moves past an airfoil. Therefore, airfoils can be considered for installation on the external surfaces of buildings as supplementary elements to increase wind speed at the inlets of the building façade. Moreover, in a study by Blocken, Moonen [53], the Venturi effect was described as an increase in flow speed resulting from a reduction in either the flow cross-section or air pressure, in accordance with Bernoulli’s principle.
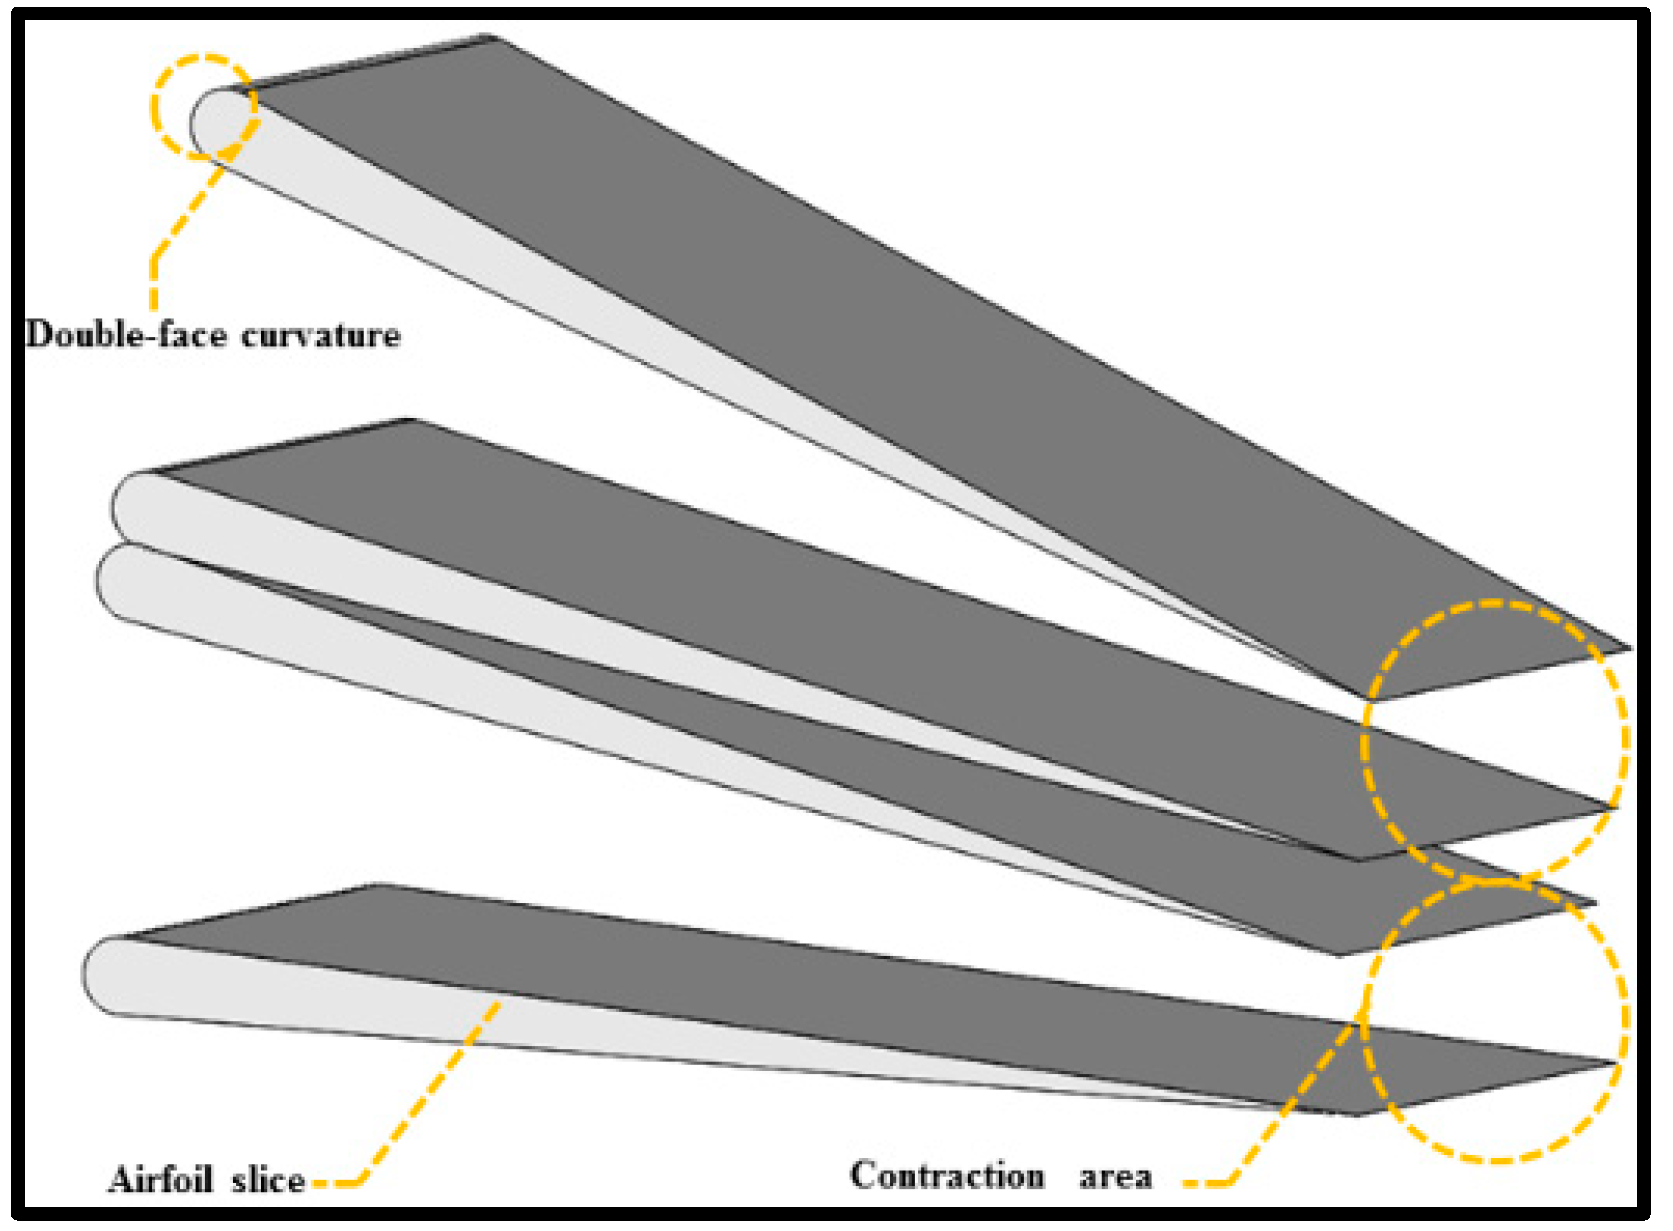
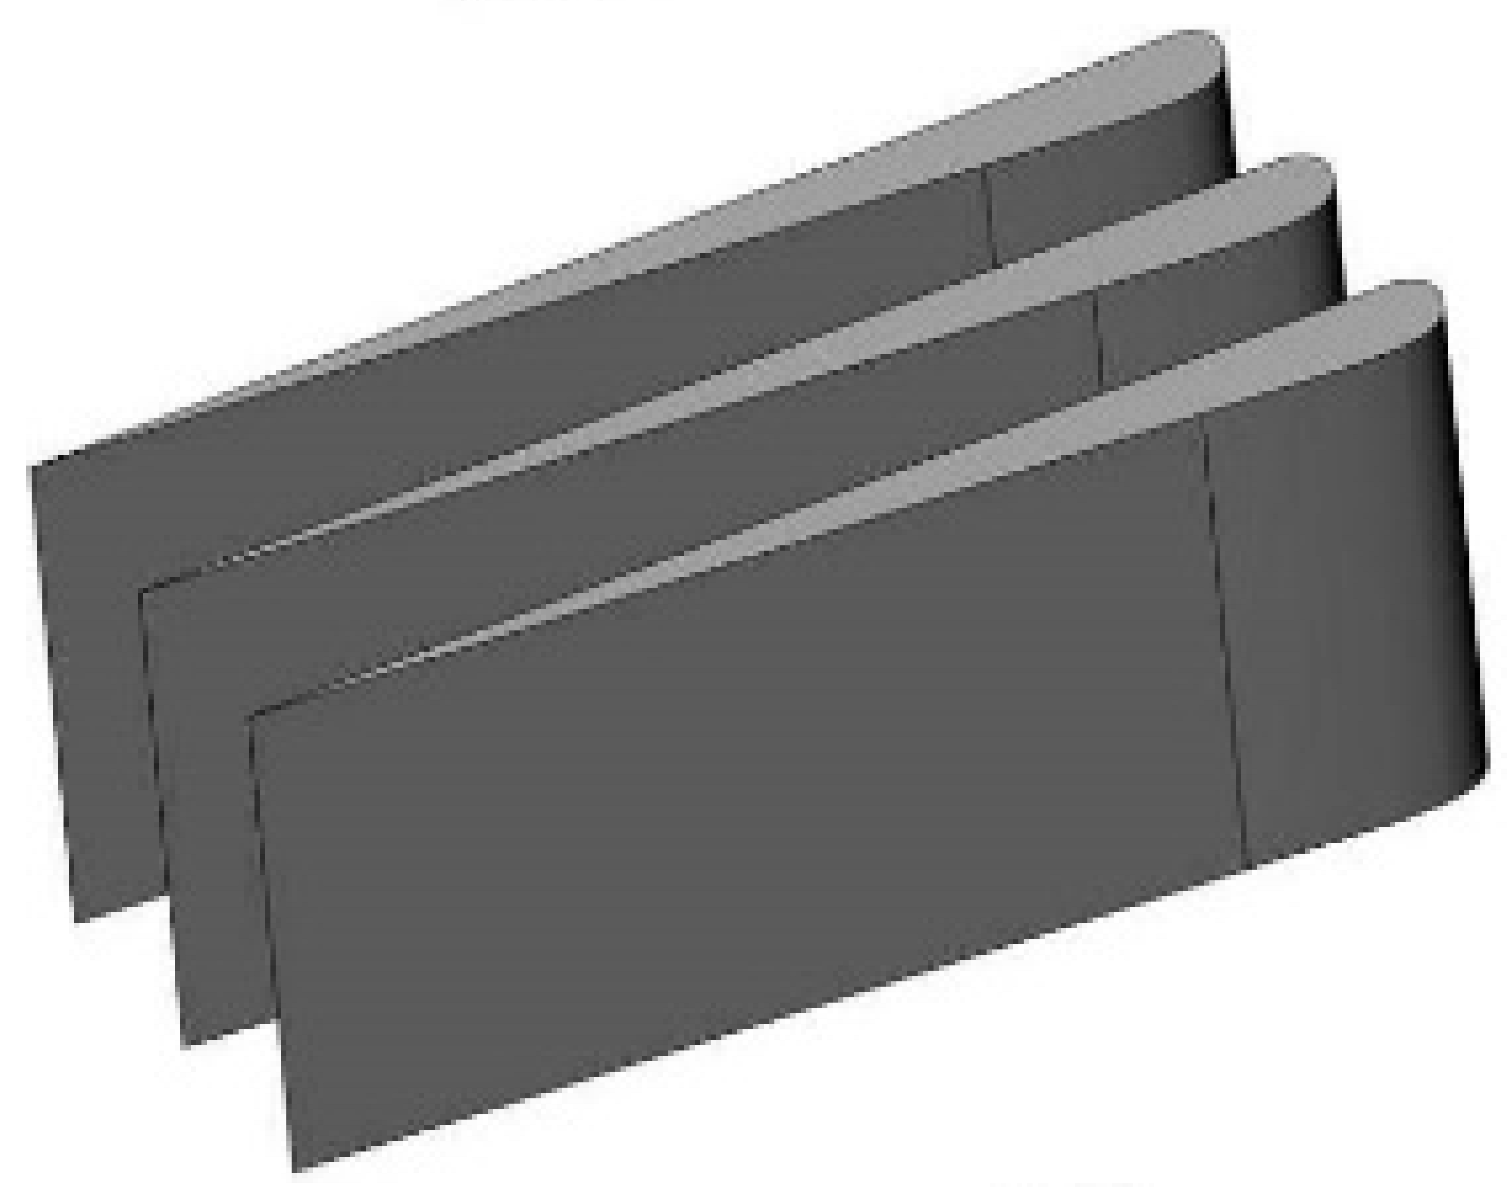
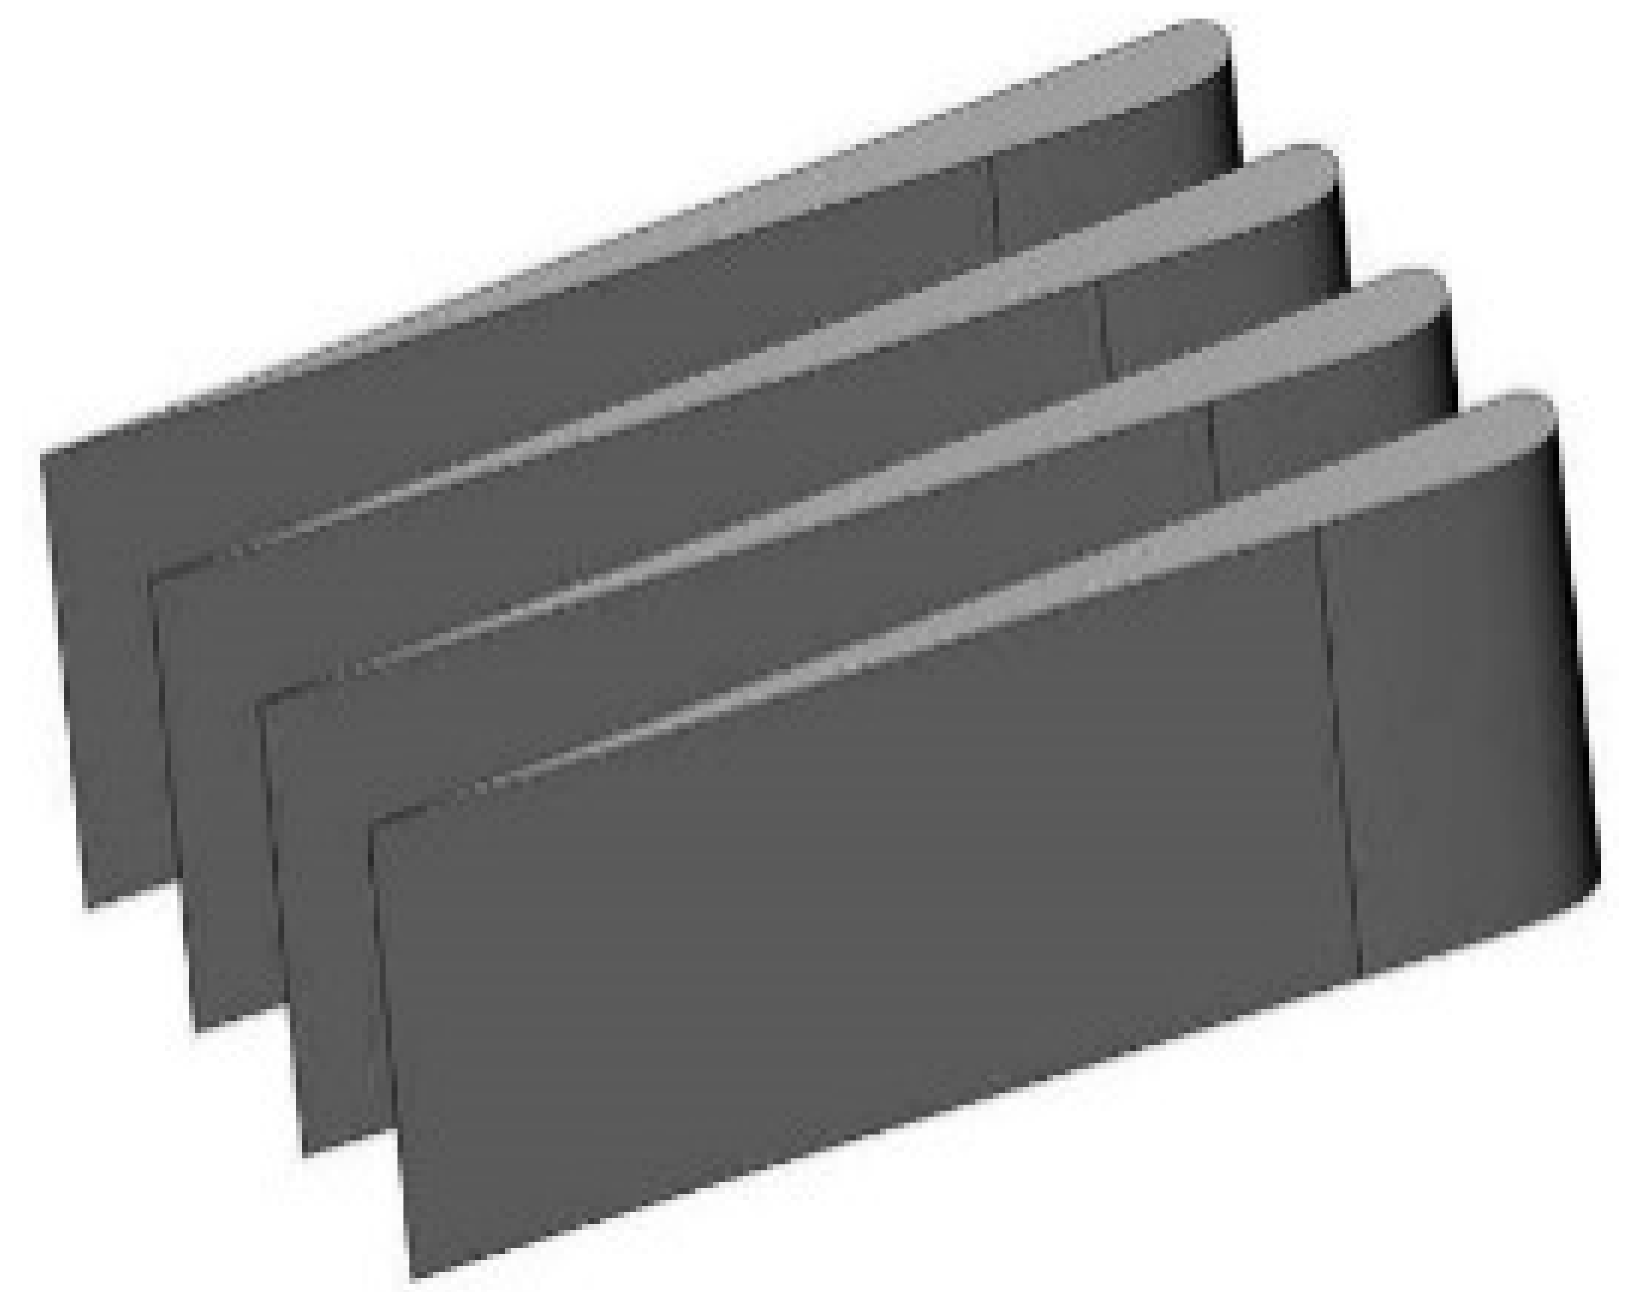
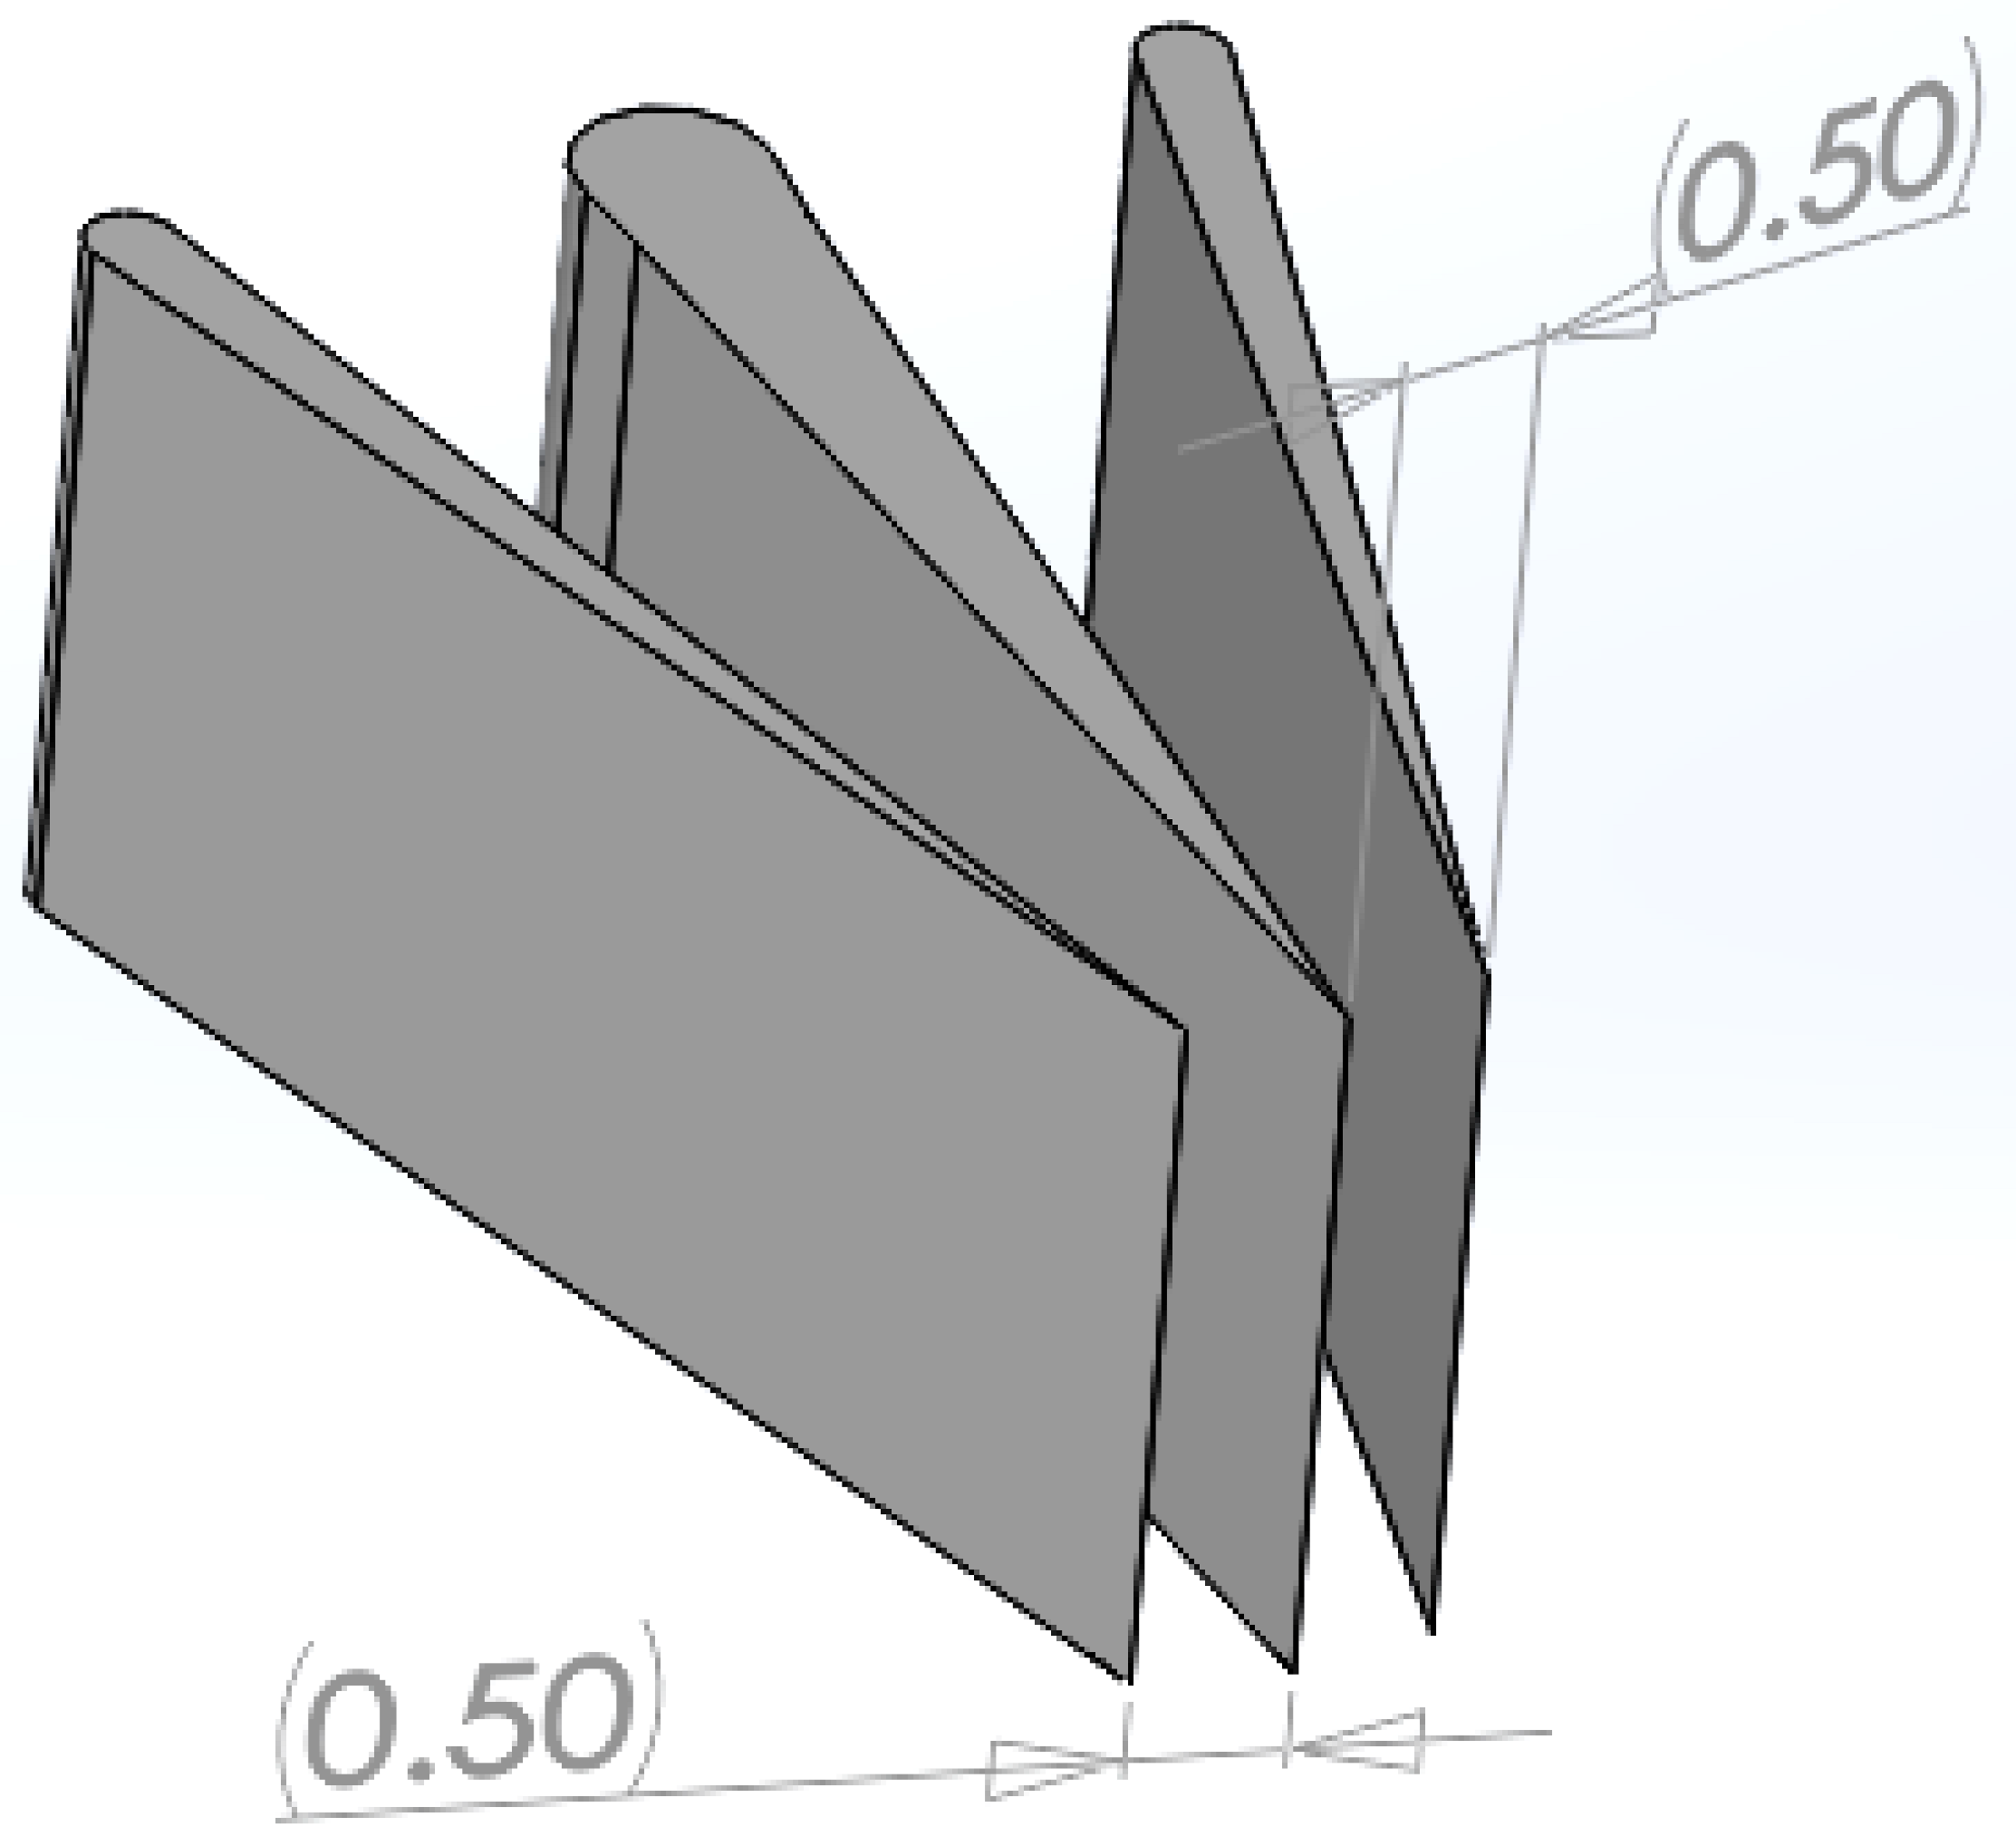
As the primary objective of this study is to increase air velocity at the inlets of residential units, the designed aerodynamic airfoils were arranged in arrays to generate the Venturi effect. Figure 3 illustrates the configuration of four airfoils in an array, where the airflow areas progressively decrease along the air passages. It is important to note that, strictly speaking, the Venturi effect refers to confined flows. In the case of airfoils on a building’s façade, however, air can flow over and around the structure, rather than solely through it. Consequently, it is generally inaccurate to assume that the flow speed in the contraction zone is inversely proportional to the cross-sectional area, as it would be in a confined flow [54].
The units in the selected building featured a trapezium-shaped balcony with a total area of 1.2 m2. The external walls of the balcony, located in front of the sliding windows, were identified as suitable locations for inducing wind velocity using airfoil arrays. As shown in Figure 4, parapets A and B were initially considered as potential installation points. However, the selection of parapet A led to the airfoil arrays obstructing the view from inside the unit and blocking sunlight from entering the residential space. Furthermore, this choice compromised the aesthetic value of the building’s façade. Therefore, parapet B was identified as the most suitable location for embedding the airfoils on the building’s façade. Positioned at the corner of the balcony, this placement allowed the induced wind velocity to enter the residential unit without blocking daylight.
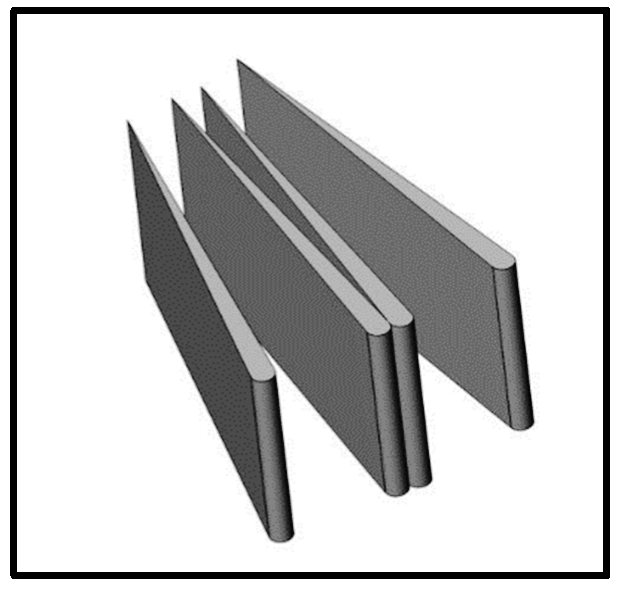
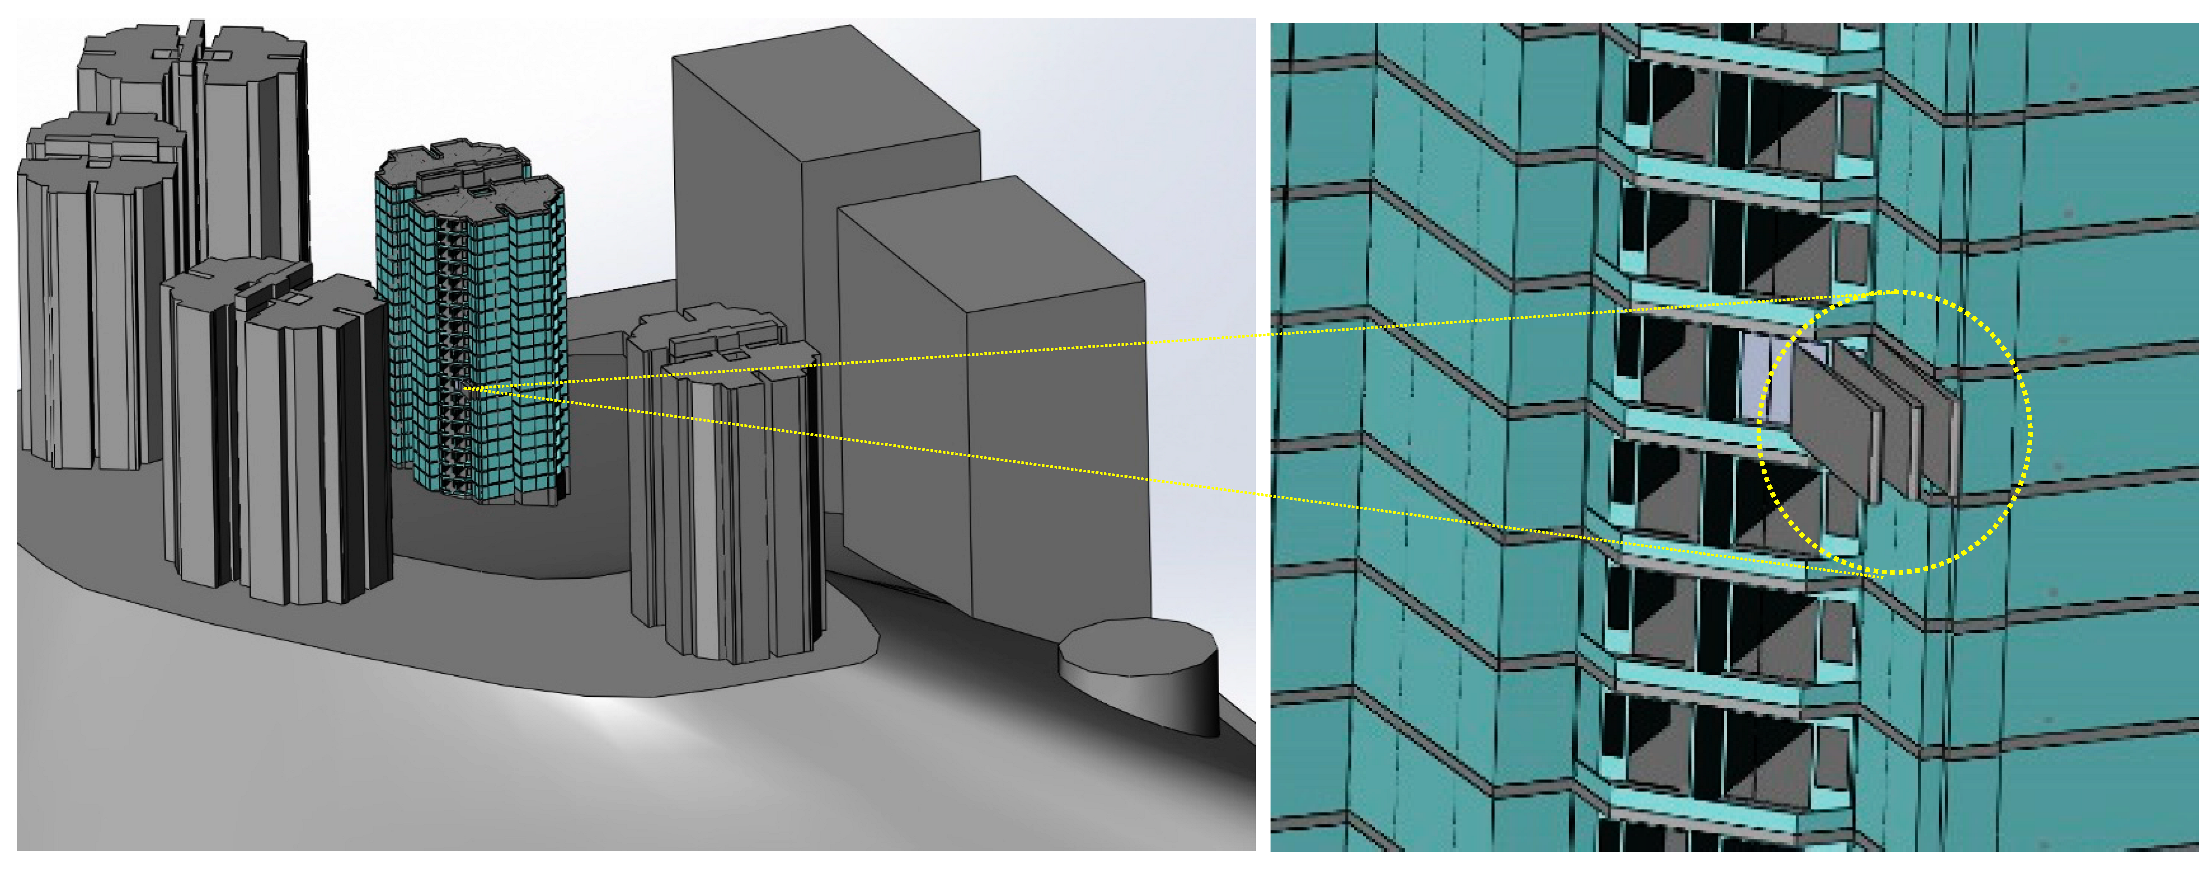
The airfoil arrays were installed vertically on parapet B. The minimum width of the air passages between the airfoils was established at 0.5 m, while the length of parapet B measured 1.5 m. Consequently, the maximum number of airfoils that could be arranged vertically in a group was four. Figure 5 illustrates the rotated array of four airfoils suitable for installation on parapet B. Additionally, Figure 6 shows the airfoil array installed on parapet B of the selected unit for the CFD simulations.
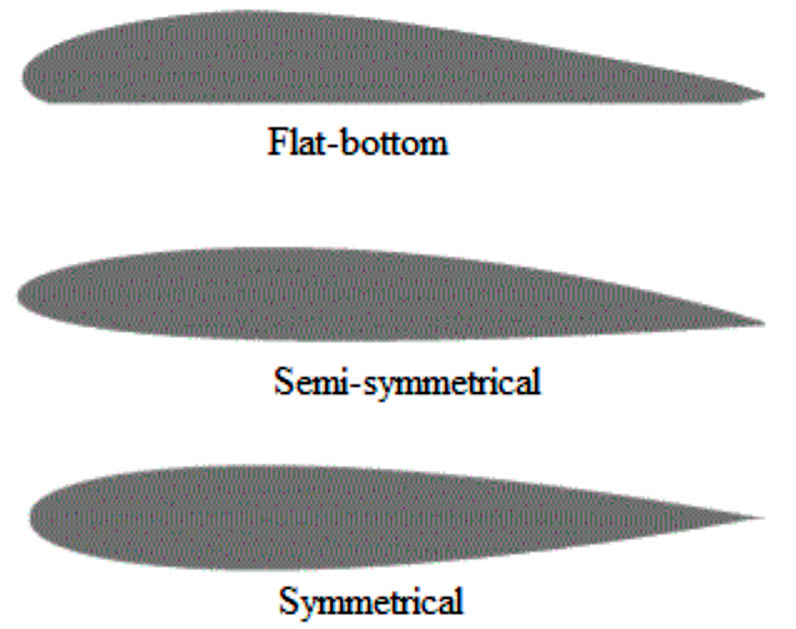
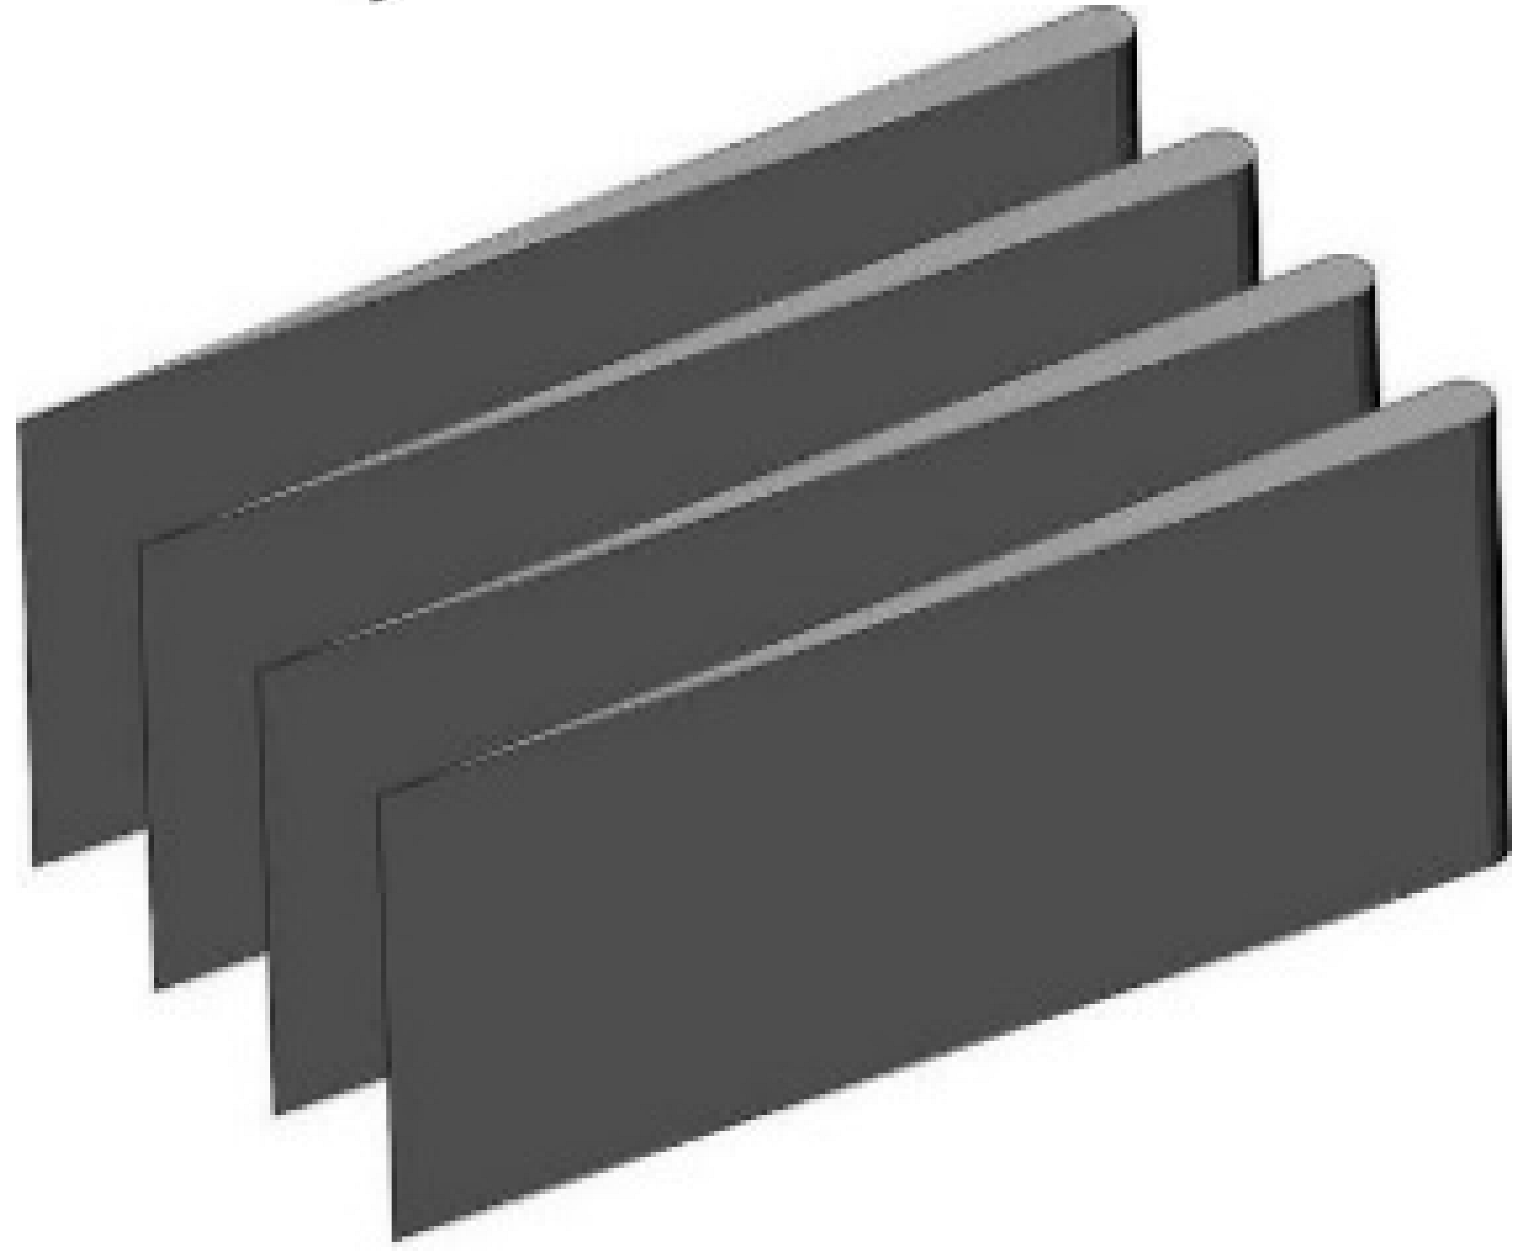
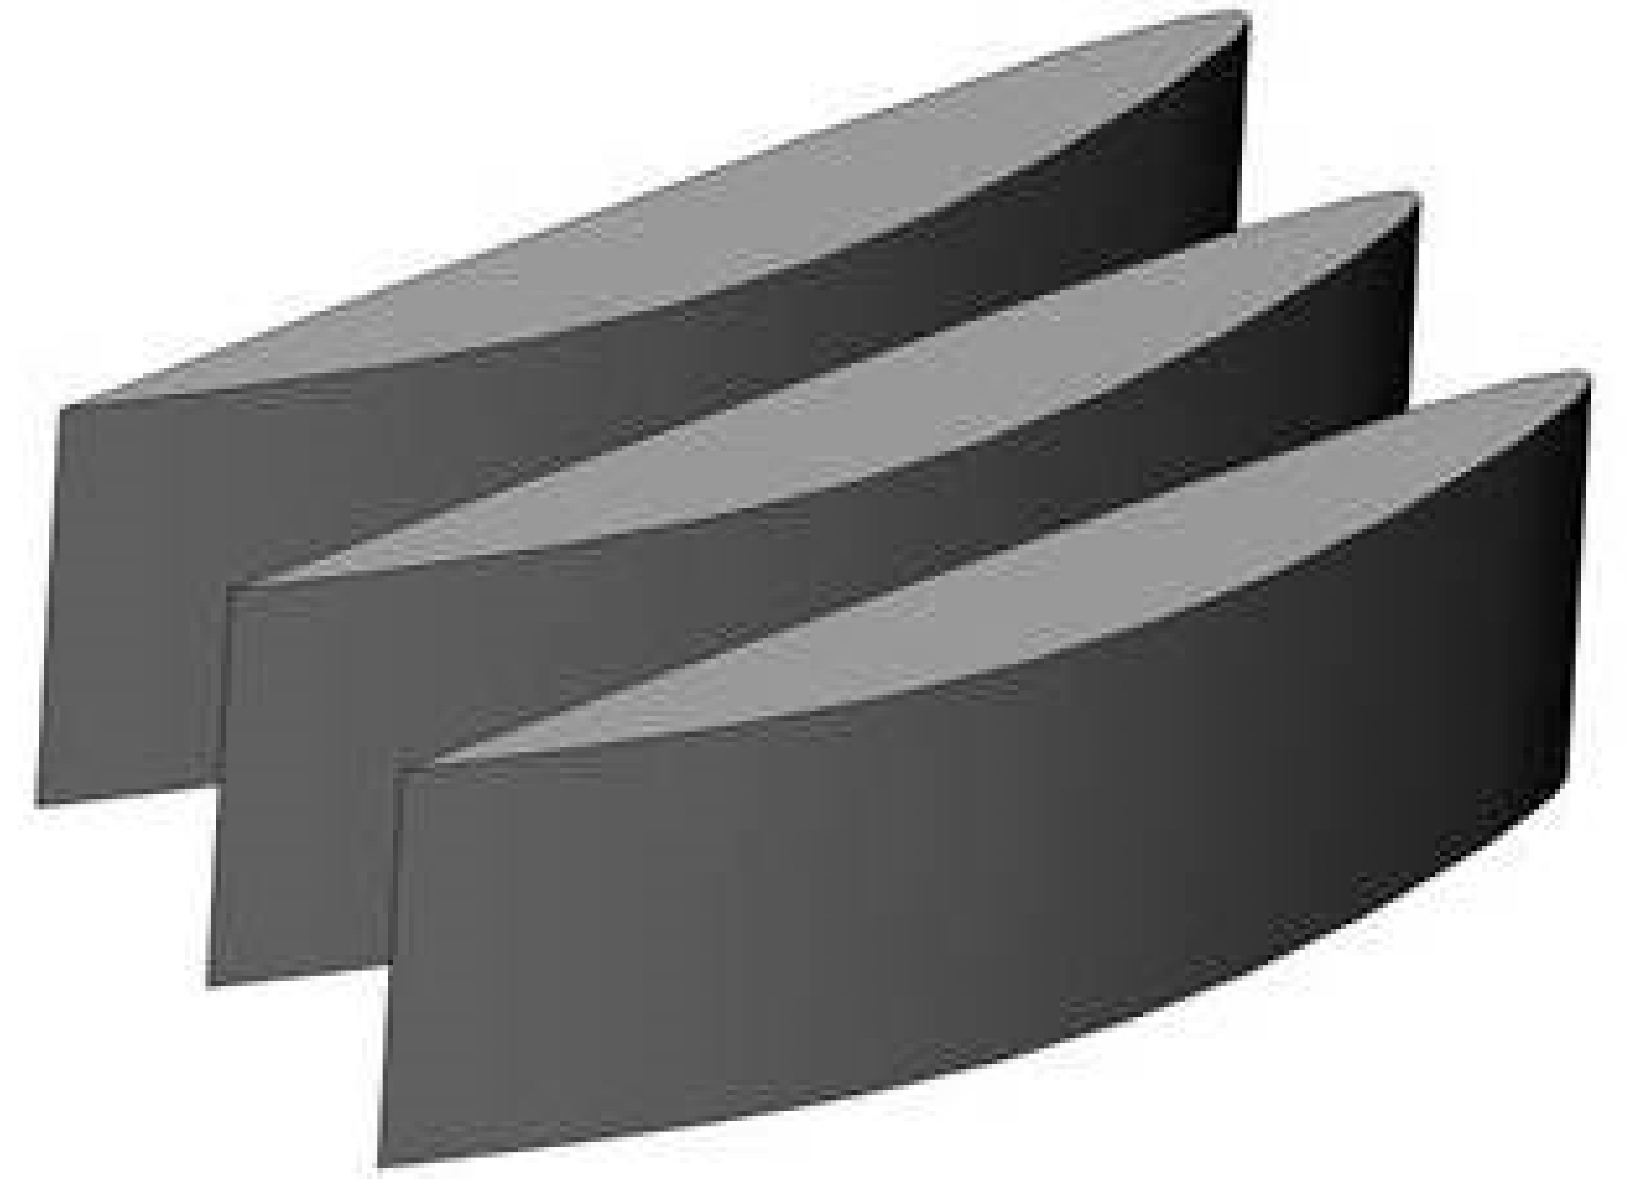
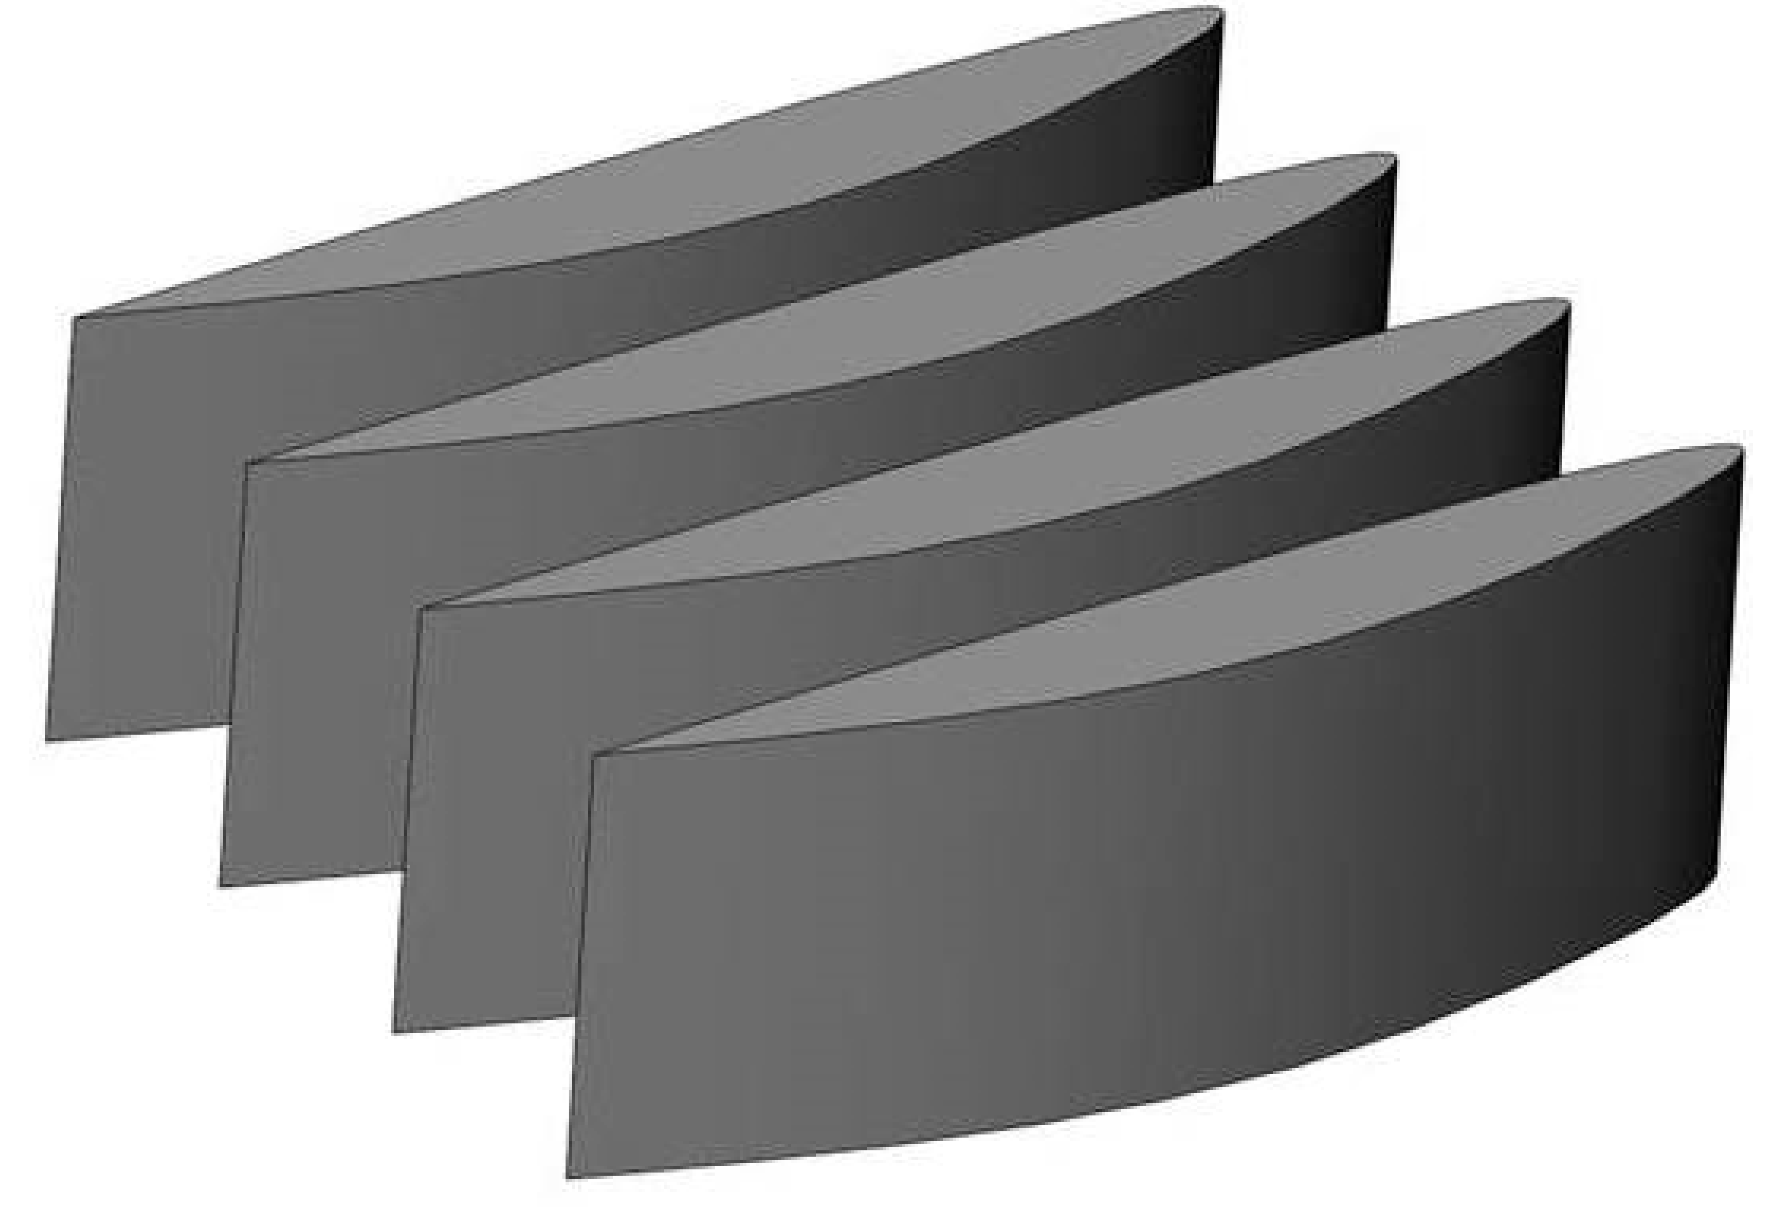
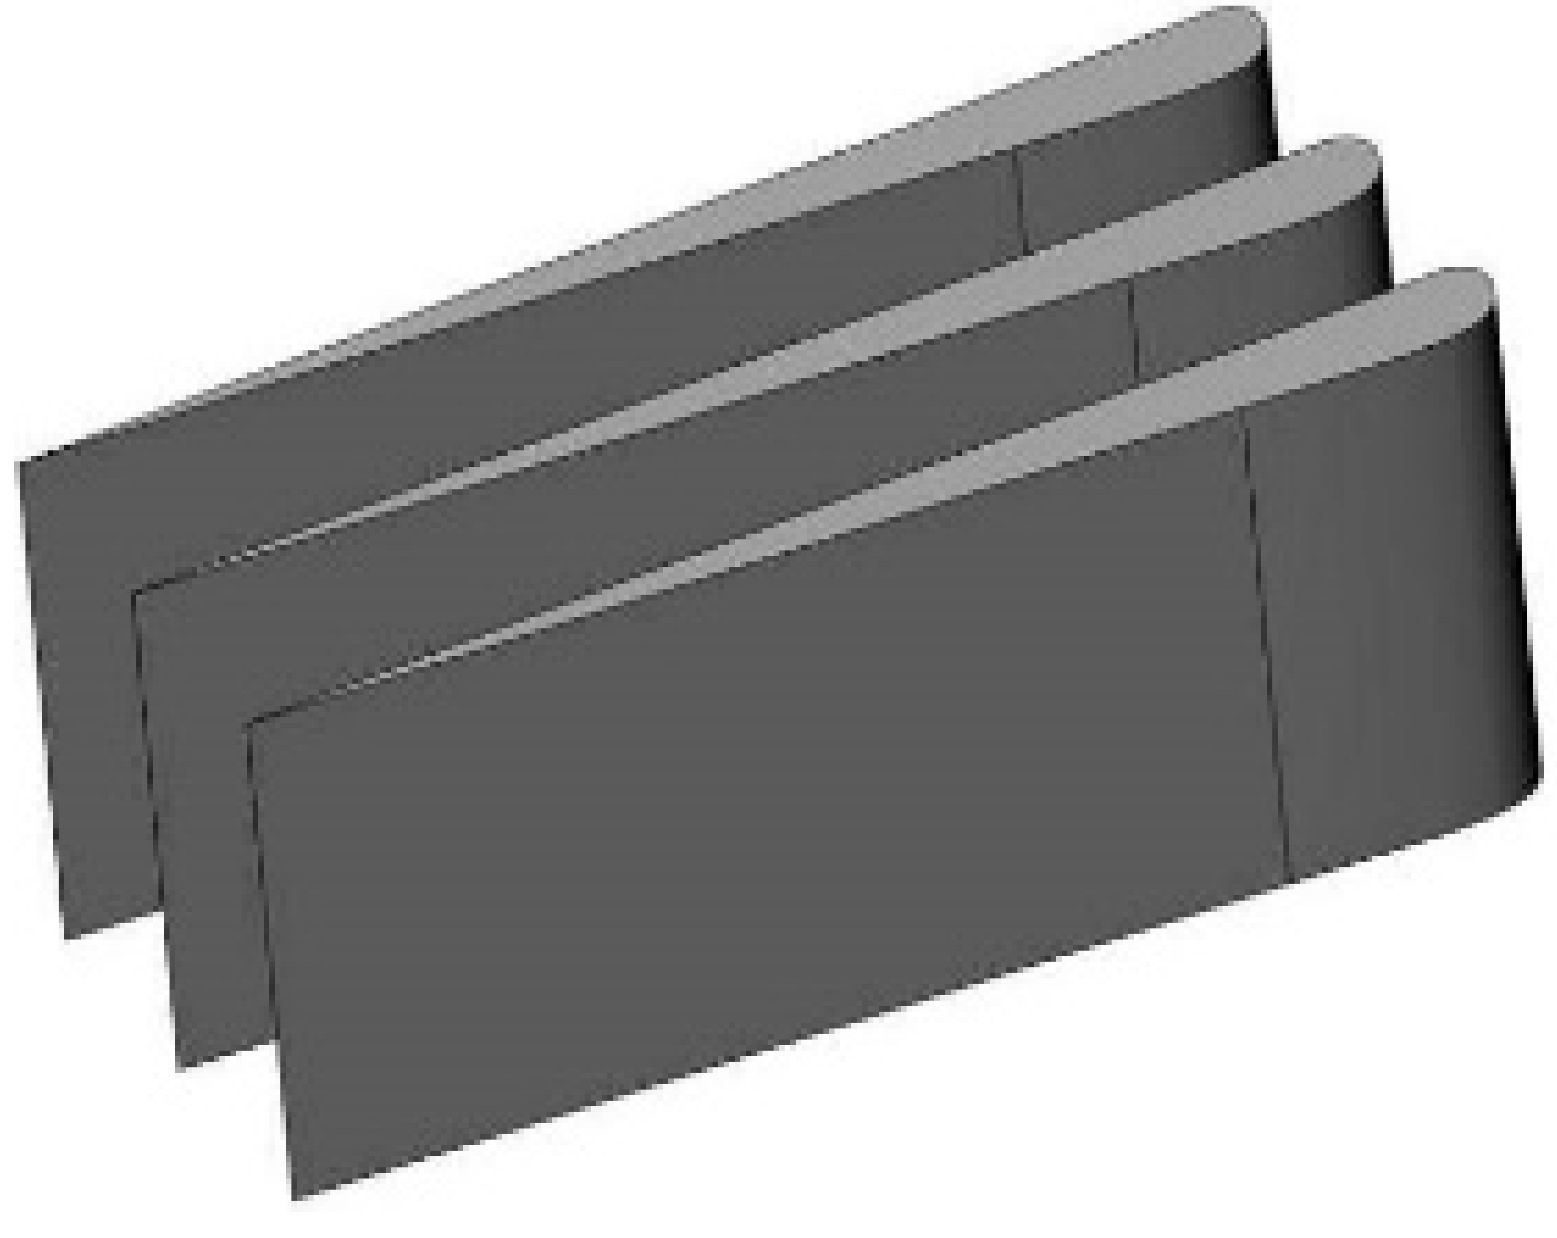
In this research, three airfoil shapes—flat-bottom, semi-symmetric, and symmetrical—were selected, along with two air passage depths (0.5 m and 0.75 m), to analyze the performance of the proposed concept. Figure 7 presents the differences between the selected shapes for further evaluation. Since the number of airfoils varied among the arrays and the length of parapet B was 1.5 m, the air passage widths were set to 0.75 m and 0.5 m for the triple and quadruple arrangements, respectively. Table 2 presents the various proposed airfoil arrangements and shapes. The chord length of the airfoils was maintained at a constant 2.4 m across all configurations. This length was selected to ensure practical feasibility for installation on the external surface of the building façade, allowing the airfoils to effectively capture wind. The height of the airfoils was established at 2.3 m, corresponding to the height of parapet B and the balcony ceiling.
Although the installation of airfoil arrays may increase the ACH in residential units, several negative impacts must be considered. For example, an inappropriate location on the building façade for installation could compromise aesthetic values. To improve the feasibility of this concept, parapet B was selected for this study (see Figure 4). This suitable location enables the airfoil arrays to be installed on the façade without blocking interior views or preventing sunlight from entering the residential unit. Furthermore, the aesthetic values of the building façade were maintained.
To translate the theoretical concept of airfoils into practical applications, selecting the most appropriate materials is crucial for ensuring cost-effectiveness and structural load. Consequently, feasible and viable materials for constructing grouped airfoil slices were investigated based on essential parameters. Key factors in material selection included lightweight properties, durability, flexibility, spatial adaptability, and cost-effectiveness. Based on these criteria, the study recommends three types of composites—fiberglass, Wood–Plastic Composite (WPC), and caoutchouc—alongside aluminum as suitable materials for constructing airfoil slices on the external surfaces of building façades.

2.3. Experimental Measurements

To collect indoor environmental parameters, six aluminum poles with clamps were designed to support the data loggers (HOBO U12) and air velocity sensors (T-DCI-F900-S-O), manufactured by the Onset Computer Corporation, which were distributed in the living, dining, and study rooms. Figure 8 illustrates the poles during the experimental tests conducted in the three selected rooms of the unit. All poles were positioned at least 0.8 m away from internal walls to mitigate wall effects [55]. Additionally, the time interval for all sensors and data loggers was set to one minute. As shown in Figure 8, air velocity was measured at two different heights, designated as M (medium, 1.1 m from the floor) and H (high, 1.8 m from the floor). The velocity sensor utilized a blade design with aluminum vanes. The data loggers were equipped with an external input channel to facilitate the connection to the air velocity sensor. The input voltage range was between 0 and 2.5 VDC, with an accuracy of ±2 mV or ±2.5% of the absolute reading. The air velocity sensors were capable of measuring wind speeds ranging from 0.15 to 10 m/s, with an accuracy of ±0.015 m/s or ±3% of the reading. The sensors could also detect velocities below 0.15 m/s with reduced accuracy, depending on environmental stability and signal averaging. To ensure reliability, multiple readings were recorded at each point and time-averaged to minimize noise.
In addition to the standard sensor (T-DCI-F900-S-O), the study conducted a supplementary test using a high-precision hot-wire anemometer (TSI VelociCalc 9545) to verify airflow measurements below 0.15 m/s. The comparison confirmed that the values reported by the T-DCI sensor in the 0.04–0.15 m/s range were within an acceptable deviation (±8%), validating the experimental data.

2.4. Numerical Simulations

Computational fluid dynamics (CFD) modeling is primarily utilized to investigate airflow patterns and air velocity both inside and outside buildings, as well as to analyze indoor air quality and thermal comfort—factors that are difficult to predict using alternative techniques [56].
In the current study, the FloEFD software version 13.1 from Mentor Graphics [57] was employed for the numerical analysis. A modified k-ε model was utilized to address turbulent indoor flow. This turbulent model incorporates additional empirical enhancements and damping functions proposed by Lam and Bremhorst [58], enabling it to effectively cover a wide range of turbulent flows, including shear and rotational flows (LB k-ε model). The finite volume method (FVM) was adopted as the discretization scheme to solve the Navier–Stokes equations. A SIMPLE (Semi-Implicit Method for Pressure-Linked Equations) algorithm was selected to couple pressure and velocity. Furthermore, the Two-Scales Wall Functions (2SWF) model was implemented as a near-wall treatment approach. Finally, the convergence criteria were 10−6 for continuity, momentum, energy, and k-ε equations [59,60].

Grid Generation and Boundary Conditions

The generated grid within the computational domain is of a structured type, consisting of rectangular parallelepiped cells with faces orthogonal to the specified axes of the Cartesian coordinate system. The near-boundary cells are portions of the original parallelepiped cells that have been cut by the geometry boundary. To create the grid in the software, we first constructed a fundamental mesh based on the defined computational domain and established guidelines [61,62,63]. This mesh was progressively adapted and refined based on the results obtained at each step of the process, using the refinement mode options in the software. Cells in regions with low gradients were merged, while those in areas with high gradients (such as the solid/fluid interface) were split [57]. Figure 9 shows the generated mesh within the computational domain, highlighting the stretching near the wall.
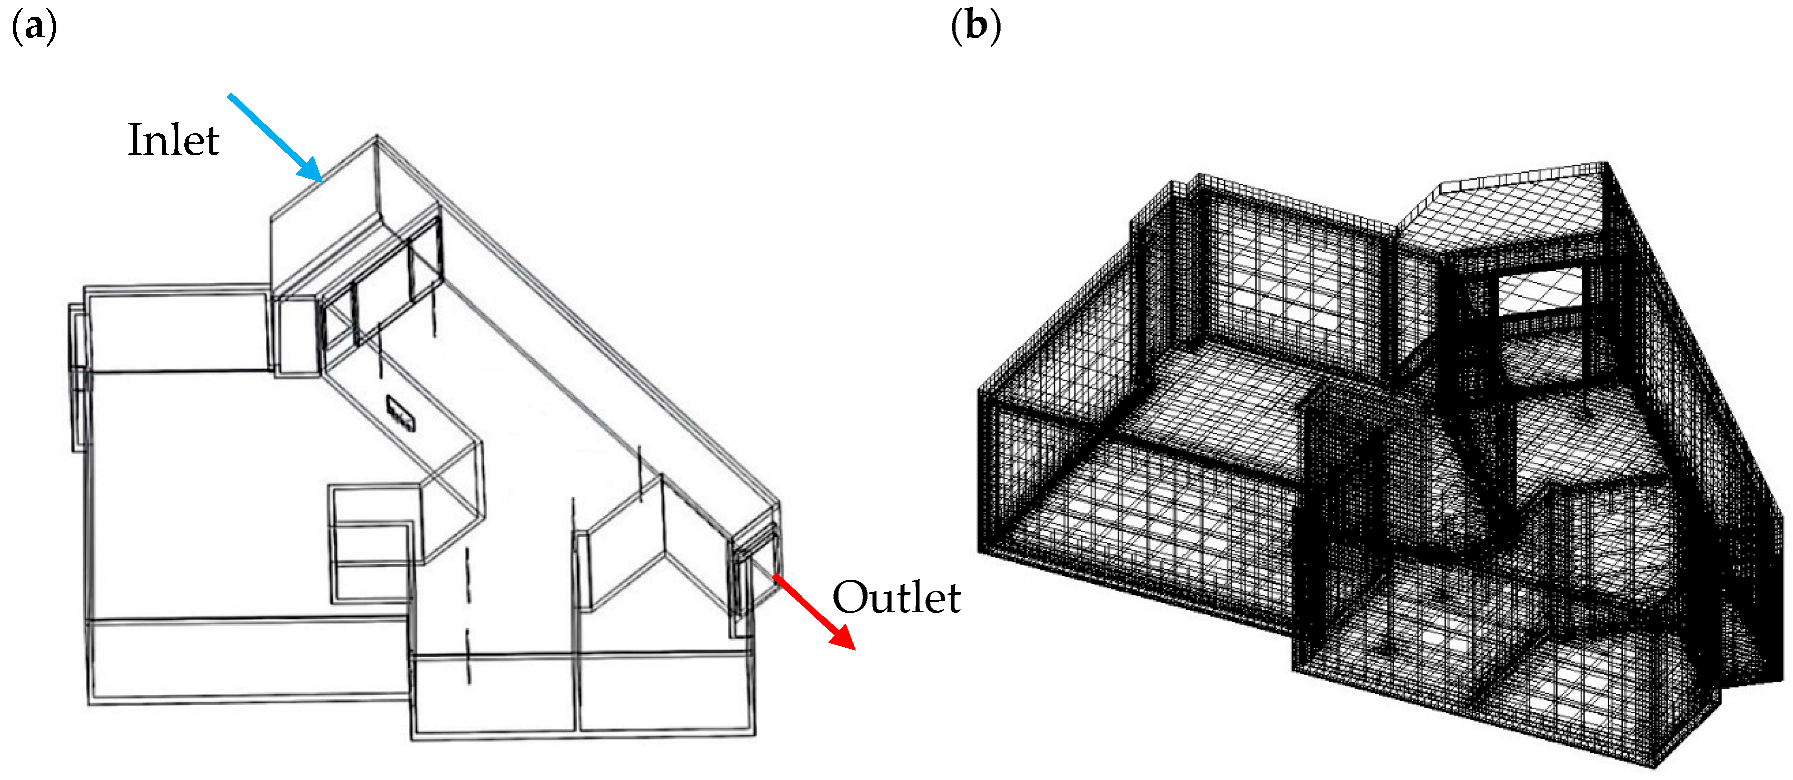
Based on the experimental tests, outdoor airflow entered the unit through the sliding window in the living room and was exhausted through a ventilation panel located above the entrance door, facilitating double-sided ventilation within the unit [64]. Table 3 presents the boundary conditions used to evaluate the proposed configurations of the triple and quadruple airfoil arrays. The data supporting the CFD simulations were collected during field measurements conducted both inside the unit and on the rooftop of the building. External weather conditions, as well as indoor air speeds and temperatures, were monitored throughout the day. From multiple measurements, conditions over a 30 min period in the afternoon—when outdoor and indoor conditions were relatively stable—were selected for use in the CFD simulation. The average values over this period provided the boundary conditions and validation data for the model.

3. Results and Discussion

The performance of each design was evaluated in FloEFD by calculating the average surface air velocity through the two sliding doors, which have a combined area of 3.06 m2. The conditions were configured to replicate those of the full-scale experimental test units, where two of the three sliding doors were open and the side-hung window was closed. In the FloEFD simulation model, the inlet area corresponded to the two sliding doors, totaling 3.06 m2.

3.1. Grid Sensitivity

Table 4 presents the air velocity values at 10 selected points using different grid resolutions based on the simulation results. The number of cells is also shown in Table 4 to demonstrate the mesh sensitivity and the adequacy of the mesh resolution used in the CFD simulations. Additionally, mesh refinement was conducted to distinguish discretization errors from other sources of error. The refinement ratio (r) for a three-dimensional mesh is defined as the ratio between the number of grid elements in the fine mesh (Δfine) and the coarse mesh (Δcoarse), as presented in Equation (1) below:
r = Δ f i n e Δ c o a r s e 1 3
Although the results indicate significant differences in the number of cells, the variation in air velocity between the fine and finest meshes is negligible. Consequently, the fine grid, which comprises a total of 1,542,115 cells, was selected as a suitable computational mesh for subsequent numerical simulations of the indoor environment. Refining the mesh ensures that the solution is independent of mesh size and that the resulting numerical data are both accurate and reliable.

3.2. Model Validation

To validate the CFD simulations of the indoor environment, the air velocity at the ten designated points was compared with measured data obtained under conditions without airfoils. Previous studies have established full-scale measurements to serve as a benchmark for comparing CFD results for validation [65,66,67,68]. A comparison between the numerical results and the experimental data is presented in Table 5. The simulation’s predicted results at all points show good agreement with the measured data.

3.3. CFD Outputs

To identify the optimal airfoil shape for enhancing air velocity at the inlet, various airfoil types—including symmetrical, semi-symmetrical, and flat-bottom designs—were initially evaluated through preliminary simulation tests using FloEFD software. The initial boundary conditions were established in the FloEFD simulation to assess the performance of different airfoil configurations in maximizing air velocity at the inlet area. The physical parameters considered in the CFD simulations included heat conduction in solids, radiation, and gravitational effects. To simulate wind velocity across the grouped airfoil slices on the external façade surfaces and to account for the influence of surrounding buildings on wind speed and direction, an external flow analysis was conducted in FloEFD. The average wind velocity was set to 0.37 m/s at the reference height, based on recorded data. The average outdoor air temperature was 32.2 °C, and the environmental pressure was set at 101,325 Pa.

3.4. CFD Simulation Results of Airfoil Configurations

The performance of six design alternatives was evaluated to determine the optimal airfoil shape for maximizing air velocity at the inlet area. The application of a thin lid, with a thickness of 0.1 m, on the inlet area facilitated the measurement of the surface goal for the area of interest within the FloEFD program. Consequently, the solver concentrated primarily on the inlet to solve the Navier–Stokes equations for that specific region. Figure 10a presents the qualitative results of the CFD simulation for the symmetrical quadruple airfoil slices installed on the building’s façade. According to the results, the average air velocity at the inlet area was 0.2 m/s, which was higher than that of the other airfoil shapes, except for the symmetrical triple airfoil slices. As shown in Figure 10b, certain points within the unit experienced the maximum air velocity, which positively impacts the ACH within the instantaneous volume of the residential unit.
Table 6 presents the results of the CFD simulation for six design alternatives, detailing the minimum, maximum, and average values of air velocity magnitude, total pressure at the selected inlet, and ACH for a residential unit located on the eighth floor facing south. A comparison of the results indicates that the symmetrical airfoil shape generates higher air velocity compared to the semi-symmetrical and flat-bottom configurations. As shown in Table 6, the application of symmetrical airfoils in the triple-grouped slices generates the maximum air velocity at the inlet area, with an average air velocity of 0.25 m/s, which is greater than that of the other design alternatives. Additionally, the surface air pressure was elevated, with an average inlet pressure of 101,183 Pa. The average air velocity for the symmetrical airfoil in the quadruple-grouped slices was 0.2 m/s, which is slightly lower than that observed in the triple-grouped slices.
According to Lechner [69], the air velocity magnitude near occupants, particularly at inlets or outlets, should be approximately 0.25 m/s to ensure comfortable ventilation. Therefore, the symmetrical airfoils in the triple-grouped slices can achieve an acceptable air velocity. In contrast, the symmetrical shape in the quadruple-grouped slices generates a barely noticeable but still comfortable airflow. The average air velocities for the semi-symmetrical airfoil slices were 0.18 m/s for the triple arrangement and 0.12 m/s for the quadruple arrangement, respectively. The flat-bottom shape in the triple-grouped slices yielded the lowest average velocity at 0.15 m/s, which further decreased to 0.11 m/s for the quadruple-grouped slices, marking the lowest among all design alternatives.
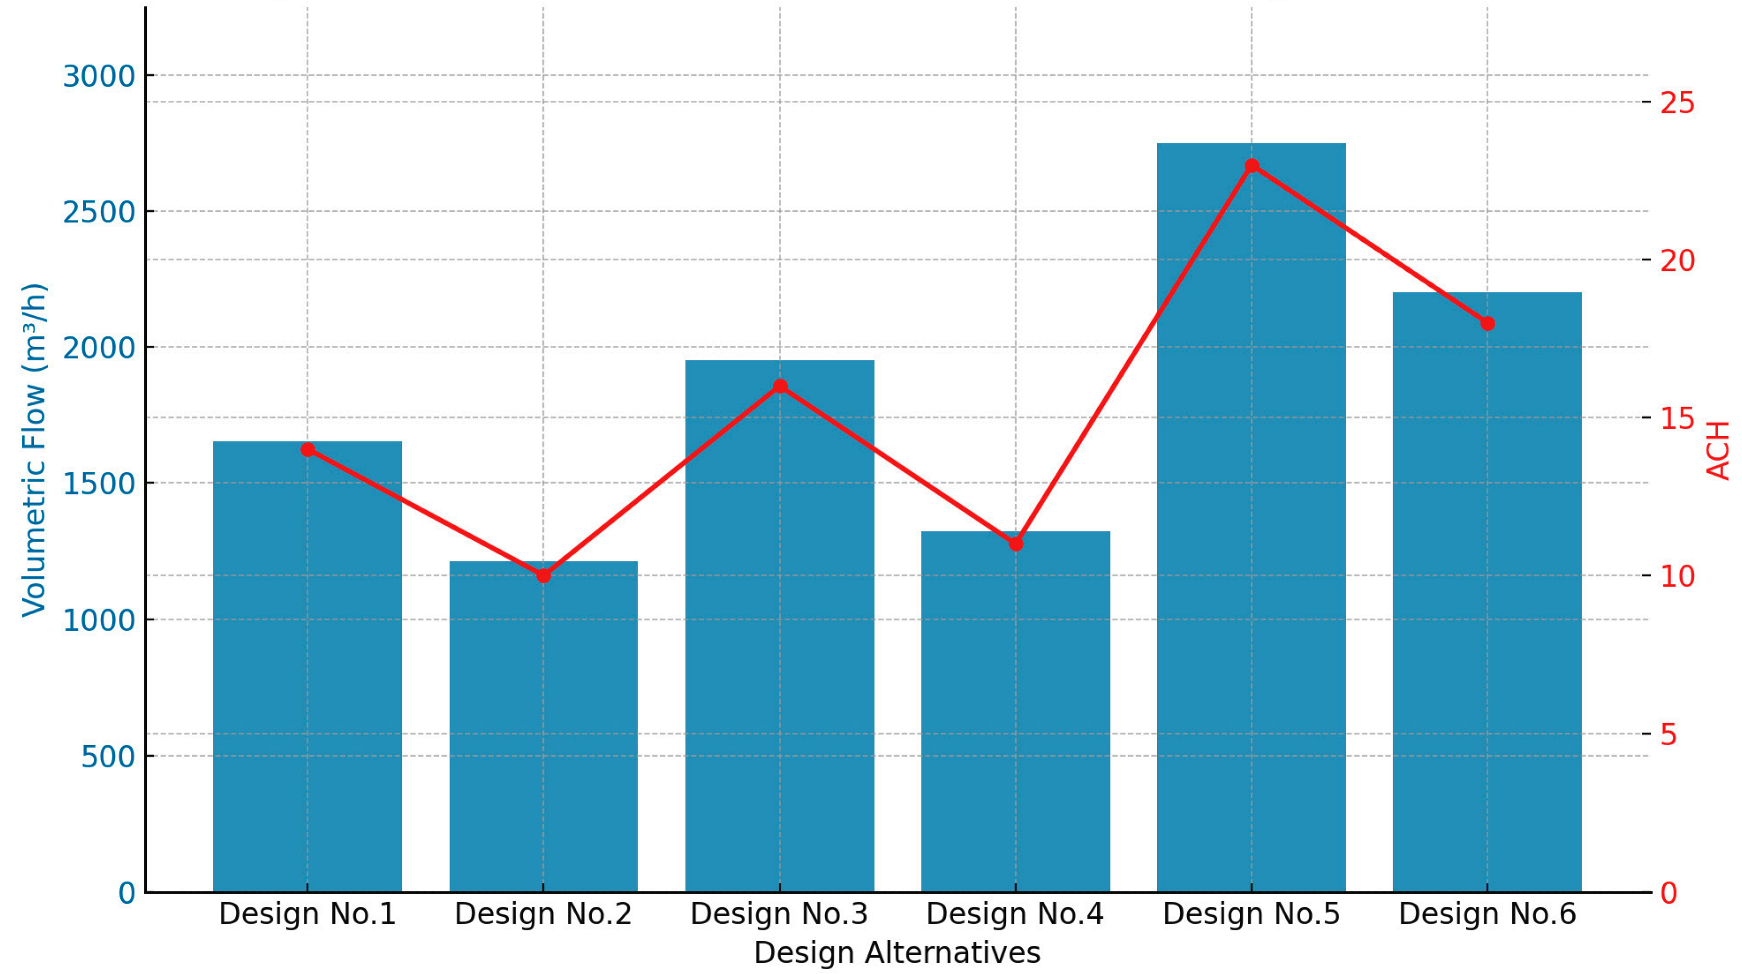
Table 6 presents the ACH values calculated for all designs based on unit volume. ACH is computed using Equation (2), where Q represents the volumetric airflow rate (m3/h) and V denotes the room volume (m3). Figure 11 illustrates the average volumetric airflow and ACH for all design alternatives. According to the results, Design No. 5 performs the best, with a volumetric airflow of 2750 m3/h and an ACH of 23, followed by Design No. 6, which has a volumetric airflow of 2203.2 m3/h and approximately 18 ACH. Design Nos. 1, 3, and 4 demonstrate moderate performance, while Design No. 2 is the least effective. These results underscore the critical role of airfoil geometry in enhancing passive ventilation and improving indoor air quality.
ACH = Q   ( m 3 / h ) V   ( m 3 )
The ACH values for all design alternatives indicated that increased air velocity (m/s) within a fixed volume resulted in higher ACH rates. Among the tested configurations, the symmetrical airfoil shape consistently produced greater air velocity than the semi-symmetrical and flat-bottom alternatives for both triple- and quadruple-grouped slices. In the triple-grouped configuration, the symmetrical airfoils achieved a maximum ACH value of 23 h−1. Further analysis revealed that the symmetrical airfoils in the triple-grouped slices increased ACH by approximately 30% and 40% compared to the semi-symmetrical and flat-bottom shapes, respectively. Similarly, in the quadruple-grouped configuration, the symmetrical airfoils attained an ACH of 18 h−1—approximately 40% and 44.4% higher than the semi-symmetrical and flat-bottom shapes, respectively.
According to the CFD simulation results, the symmetrical airfoil configuration generated the highest inlet air velocity, leading to greater ACH within the unit. Consequently, the symmetrical shape was selected for further CFD simulations to determine the optimal chord length, air gap width, and relative positioning of the airfoils.

3.5. CFD Simulation of Air Gaps for Symmetrical Grouped Airfoil Slices

Based on the results of the CFD simulation, symmetrical airfoil shapes in both triple and quadruple configurations were selected for further analysis to determine the optimal dimensions for the proposed concept. According to the Venturi effect, the air gap between the airfoil slices plays a critical role in either increasing or decreasing the air speed at the inlet area. Therefore, it is essential to simulate various air gap distances for both the triple and quadruple configurations to assess their impact on airflow performance.

Optimum Air Gap for the Triple-Grouped Slice Airfoils

The study also evaluated the angular symmetrical airfoil slices in a triple-grouped configuration to determine the optimal width for the air gaps. Unlike the quadruple configuration, the triple-grouped airfoil slices included two air gaps. However, the angles between the chord lines of the airfoils were consistent with the quadruple design, set at 10°. Based on research by Dehghani-Sanij and Soltani [37], the increase in airfoil slice curvature enhanced the wind speed at both the top and bottom surfaces of the airfoils. Since there was only one airfoil in the center of the configuration, additional space was available in the triple slices compared to the quadruple design. Consequently, there was an opportunity to increase the degree of curvature for the middle slice based on the available space at parapet B. The degree of curvature was designed to be twice as high as that of the side airfoils to further enhance wind speed.
Table 7 presents design alternatives for the air gaps in the triple-grouped slices. Distances of 0.3 m, 0.5 m, 0.6 m, 0.8 m, and 1.0 m were assigned as alternative values for the contraction area to identify the optimal dimensions for achieving the Venturi effect. Each proposed design for the triple airfoil slices was incorporated into the model individually to evaluate the induced wind speed at the surface area of the sliding doors. The boundary conditions and computational domain for the CFD simulations were consistent with those used in the parametric studies for the quadruple airfoil slices.
Table 8 presents the results of the numerical simulations conducted for various air gap widths at the sides of the triple-grouped airfoil slices. A comparison of the five design alternatives revealed that design alternative B produced the highest air velocity at the inlet surface. The results indicated that the optimal contraction width is 0.5 m, which minimizes wind blockage across the airfoil surfaces. According to the CFD simulation, the maximum air velocity was 0.57 m/s for the 0.5 m air gap, while the minimum was 0.44 m/s for the 1.0 m gap. Based on parametric tests, the optimal contraction width for the triple-grouped airfoil slices is summarized in Table 9. This optimal width, along with that for the quadruple-grouped slices, was established for further evaluation to determine the ideal airfoil length within the groups.

4. Conclusions

The current study conducted a comprehensive analysis of various airfoil configurations, including triple and quadruple arrays, to evaluate their efficiency in increasing ACH inside buildings. The results indicated the following outcomes:
  • Based on a review of studies, passive designs have been utilized in previous research to improve ventilation performance, particularly in low-rise buildings. Some passive elements employed on the external surfaces of buildings to enhance indoor air quality include the window-to-wall ratio, balconies with effective shapes and sizes, wing walls, and wind towers.
  • The study reveals that the proposed grouped airfoils differ from conventional elements like fins or louvers in both form and function. Conventional louvers are typically optimized for controlling solar radiation and providing limited directional ventilation. In contrast, the grouped airfoil arrays examined in this research are specifically designed to manipulate airflow patterns and enhance indoor air exchange through passive means. CFD simulation results (see Table 6) show that these profiles create significant pressure and velocity variations at the inlet, resulting in higher volumetric airflow rates and improved ACH values compared to standard planar systems. Moreover, unlike conventional louvers, the airfoil arrays are deployed in a grouped configuration with staggered orientation and spacing, deliberately engineered to exploit the pressure-driven ventilation. This design facilitates enhanced airflow entrainment and mixing, which is critical in improving natural ventilation in urban environments with low wind speeds or polluted air.
  • Different types of airfoils, including flat-bottom, semi-symmetrical, and symmetrical designs, have been utilized in the balconies of a high-rise residential building. The results of the CFD simulation indicated that the triple symmetrical airfoils could increase the air velocity at the inlet by up to 0.25 m/s, resulting in 23 ACH.
  • The average air velocity at the inlet area for the flat-bottom airfoils in the quadruple group was 0.11 m/s, the lowest among the evaluated design alternatives. This design produced only 10 ACH, the minimum air circulation rate for the studied unit.
  • The ideal width for the air gaps was identified through the analysis of the angular symmetrical airfoil sections in the triple group. A comparison of five spacing distances confirmed that design option B produced the highest inlet air velocity. It was determined that the contraction width should be adjusted to 0.5 m to reduce wind blocking at the airfoil surfaces. Based on CFD simulation findings, the peak air velocity recorded was 0.57 m/s with 0.5 m air gaps, while the lowest was 0.44 m/s with 1.0 m air gaps.
The study recommends further research on the application of airfoils with varying chord line lengths and air gap widths to identify the most effective configurations for passive design in high-rise buildings. Additionally, different wind speeds and directions should be examined to assess the airflow patterns and velocities generated by the designed airfoils.

Author Contributions

Conceptualization, A.A.; methodology, A.A.; software, A.A.; validation, A.A., A.J.; formal analysis, A.A., A.J.; investigation, A.A.; resources, A.A., A.J.; data curation, A.A.; writing—original draft preparation, A.A.; writing—review and editing, A.A.; visualization, A.A., A.J.; supervision, A.A.; project administration, A.A.; funding acquisition, A.A. All authors have read and agreed to the published version of the manuscript.

Funding

This research received no external funding.

Institutional Review Board Statement

Not applicable.

Data Availability Statement

The data presented in this study are available upon request from the corresponding authors. The data are not publicly available due to confidentiality.

Conflicts of Interest

The authors declare no conflicts of interest. The funders had no role in the design of this study, in the collection, analysis, or interpretation of data, in the writing of this manuscript, or in the decision to publish the results.

References

  1. Ürge-Vorsatz, D.; Khosla, R.; Bernhardt, R.; Chan, Y.C.; Vérez, D.; Hu, S.; Cabeza, L.F. Advances toward a net-zero global building sector. Annu. Rev. Environ. Resour. 2020, 45, 227–269. [Google Scholar] [CrossRef]
  2. González-Torres, M.; Pérez-Lombard, L.; Coronel, J.F.; Maestre, I.R.; Yan, D. A review on buildings energy information: Trends, end-uses, fuels and drivers. Energy Rep. 2022, 8, 626–637. [Google Scholar] [CrossRef]
  3. Yu, L.; Sun, Y.; Xu, Z.; Shen, C.; Yue, D.; Jiang, T.; Guan, X. Multi-agent deep reinforcement learning for HVAC control in commercial buildings. IEEE Trans. Smart Grid 2020, 12, 407–419. [Google Scholar] [CrossRef]
  4. Ürge-Vorsatz, D.; Cabeza, L.F.; Serrano, S.; Barreneche, C.; Petrichenko, K. Heating and cooling energy trends and drivers in buildings. Renew. Sustain. Energy Rev. 2015, 41, 85–98. [Google Scholar] [CrossRef]
  5. Zhang, H.; Yang, D.; Tam, V.W.; Tao, Y.; Zhang, G.; Setunge, S.; Shi, L. A critical review of combined natural ventilation techniques in sustainable buildings. Renew. Sustain. Energy Rev. 2021, 141, 110795. [Google Scholar] [CrossRef]
  6. Oh, S.; Choi, G.-S.; Kim, H. Climate-Adaptive Building Envelope Controls: Assessing the Impact on Building Performance. Sustainability 2023, 16, 288. [Google Scholar] [CrossRef]
  7. Thomas, A.J.; Bamidele, A.J.; Akande, I.; Rasheed, S.A.; Agbaje, I.A.; Ekolama, R.E.; Isaac, E.C. Natural ventilation and building form in a mixed-use development: The synergy. Int. J. Multidiscip. Res. Growth Eval. 2024, 5, 162–168. [Google Scholar]
  8. Elsarraj, M.; Mahmoudi, Y.; Keshmiri, A. Quantifying indoor infection risk based on a metric-driven approach and machine learning. Build. Environ. 2024, 251, 111225. [Google Scholar] [CrossRef]
  9. AIRFLOW. Guide to Indoor Air Quality (IAQ) Standards in the UK; AIRFLOW: High Wycombe, UK, 2024. [Google Scholar]
  10. Indoor Air Quality (IAQ) Scientific Findings Resource Bank. Ventilation Rates and Office Work Performance; Energy Technologies Area, Berkeley Lab: Berkeley, CA, USA, 2024. [Google Scholar]
  11. EPA. How Much Ventilation Do I Need in My Home to Improve Indoor Air Quality? I.A.Q. (IAQ), Ed.; EPA: Washington DC, USA, 2024. [Google Scholar]
  12. Fauber, J.P. An Update on ASHRAE/ASHE Standard 170. 2022, Volume 64. Available online: https://www.studocu.com/hk/document/the-university-of-hong-kong/air-conditioning/an-update-on-ashrae-ashe-standard-170-2021/120139794 (accessed on 1 August 2025).
  13. Brelih, N. Ventilation rates and IAQ in national regulations. REHVA—Fed. Eur. Heat. 2012, 1, 24–28. [Google Scholar]
  14. Yoon, N.; Piette, M.A.; Han, J.M.; Wu, W.; Malkawi, A. Optimization of window positions for wind-driven natural ventilation performance. Energies 2020, 13, 2464. [Google Scholar] [CrossRef]
  15. Loche, I.; Bre, F.; Gimenez, J.M.; Loonen, R.; Neves, L.O. Balcony design to improve natural ventilation and energy performance in high-rise mixed-mode office buildings. Build. Environ. 2024, 258, 111636. [Google Scholar] [CrossRef]
  16. Alshakir, M.H.; abed Hassan, S. Enhancing Natural Ventilation in Buildings: The Integrative Role of Wind Catchers and Atriums, Insights from Ancient Mesopotamian Architectural Elements. Sustain. Eng. Technol. Sci. 2025, 1, 52–60. [Google Scholar] [CrossRef]
  17. Ganjimorad, M.; Fernandez, J.D.; Heiranipour, M. Impact of wind in urban planning: A comparative study of cooling and natural ventilation systems in traditional Iranian architecture across three climatic zones. Archit. Pap. Fac. Archit. Des. STU 2024, 29, 15–29. [Google Scholar] [CrossRef]
  18. Shaeri, J.; Mahdavinejad, M.; Pourghasemian, M.H. A new design to create natural ventilation in buildings: Wind chimney. J. Build. Eng. 2022, 59, 105041. [Google Scholar] [CrossRef]
  19. Sacht, H.; Lukiantchuki, M.A. Windows size and the performance of natural ventilation. Procedia Eng. 2017, 196, 972–979. [Google Scholar] [CrossRef]
  20. Sirror, H. Innovative Approaches to Windcatcher Design: A Review on Balancing Tradition Sustainability and Modern Technologies for Enhanced Performance. Energies 2024, 17, 5770. [Google Scholar] [CrossRef]
  21. Rizk, A.; El Morsi, M.; Elwan, M. A review on wind-driven cross-ventilation techniques inside single rooms. Int. J. Sci. Eng. Res. 2018, 6, 75–93. [Google Scholar] [CrossRef]
  22. Cheong, C.H.; Kim, T.; Leigh, S.-B. Thermal and daylighting performance of energy-efficient windows in highly glazed residential buildings: Case study in Korea. Sustainability 2014, 6, 7311–7333. [Google Scholar] [CrossRef]
  23. Sahabuddin, M.; Firrdhaus, M.; Gonzalez-Longo, C. Traditional values and their adaptation in social housing design: Towards a new typology and establishment of ‘Air House’ standard in Malaysia. Int. J. Archit. Res. 2015, 9, 31–44. [Google Scholar] [CrossRef]
  24. Karava, P.; Stathopoulos, T.; Athienitis, A.K. Wind-induced natural ventilation analysis. Sol. Energy 2007, 81, 20–30. [Google Scholar] [CrossRef]
  25. ASHRAE. Handbook—Fundamentals; The American Society of Heating, Refrigerating and Air-Conditioning Engineers: Atlanta, GA, USA, 2017. [Google Scholar]
  26. Gao, C.; Lee, W. Evaluating the influence of openings configuration on natural ventilation performance of residential units in Hong Kong. Build. Environ. 2011, 46, 961–969. [Google Scholar] [CrossRef]
  27. Shiel, J.J.; Aynsley, R.; Moghtaderi, B.; Page, A. The importance of air movement in warmer temperatures: A novel SET* house case study. In Running Buildings on Natural Energy; Routledge: Oxfordshire, UK, 2018; pp. 81–94. [Google Scholar]
  28. Jiang, S.; Wang, C.; Yap, J.B.H.; Li, H.; Wood, L.C.; Hu, H.-S.; Xu, B. Developing standard window to floor ratio (Wfr) system for green residential buildings in subtropics. J. Green Build. 2021, 16, 109–134. [Google Scholar] [CrossRef]
  29. Ragab, A.; Hassieb, M.M.; Mohamed, A.F. Exploring the impact of window design and ventilation strategies on air quality and thermal comfort in arid educational buildings. Sci. Rep. 2025, 15, 19596. [Google Scholar] [CrossRef]
  30. Toodekharman, H.; Abravesh, M.; Heidari, S. Visual comfort assessment of hospital patient rooms with climate responsive facades. J. Daylighting 2023, 10, 17–30. [Google Scholar] [CrossRef]
  31. Chel, A.; Kaushik, G. Renewable energy technologies for sustainable development of energy efficient building. Alex. Eng. J. 2018, 57, 655–669. [Google Scholar] [CrossRef]
  32. Nejat, P.; Fekri, Y.; Sheikhshahrokhdehkordi, M.; Jomehzadeh, F.; Alsaad, H.; Voelker, C. The Windcatcher: A renewable-energy-powered device for natural ventilation—The impact of upper wing walls. Energies 2024, 17, 611. [Google Scholar] [CrossRef]
  33. Bhatia, A. Optimizing Wind Wing Wall Ventilation in High-Rise Buildings Within Dense Urban Hot and Humid Climate. Master’s Thesis, Rochester Institute of Technology, Rochester, NY, USA, 2024. [Google Scholar]
  34. Karimimoshaver, M.; Sadathosseini, M.; Aram, F.; Ahmadi, J.; Mosavi, A. The effect of geometry and location of balconies on single-sided natural ventilation in high-rise buildings. Energy Rep. 2023, 10, 2174–2193. [Google Scholar] [CrossRef]
  35. Zheng, X.; Montazeri, H.; Blocken, B. CFD analysis of the impact of geometrical characteristics of building balconies on near-façade wind flow and surface pressure. Build. Environ. 2021, 200, 107904. [Google Scholar] [CrossRef]
  36. Jomehzadeh, F.; Hussen, H.M.; Calautit, J.K.; Nejat, P.; Ferwati, M.S. Natural ventilation by windcatcher (Badgir): A review on the impacts of geometry, microclimate and macroclimate. Energy Build. 2020, 226, 110396. [Google Scholar] [CrossRef]
  37. Dehghani-sanij, A.R.; Soltani, M.; Raahemifar, K. A new design of wind tower for passive ventilation in buildings to reduce energy consumption in windy regions. Renew. Sustain. Energy Rev. 2015, 42, 182–195. [Google Scholar] [CrossRef]
  38. Aeinehvand, R.; Darvish, A.; Baghaei Daemei, A.; Barati, S.; Jamali, A.; Malekpour Ravasjan, V. Proposing Alternative Solutions to Enhance Natural Ventilation Rates in Residential Buildings in the Cfa Climate Zone of Rasht. Sustainability 2021, 13, 679. [Google Scholar] [CrossRef]
  39. Ma, Q.; Qian, G.; Yu, M.; Li, L.; Wei, X. Performance of windcatchers in improving indoor air quality, thermal comfort, and energy efficiency: A review. Sustainability 2024, 16, 9039. [Google Scholar] [CrossRef]
  40. Yang, Y.K.; Kim, M.Y.; Song, Y.W.; Choi, S.H.; Park, J.C. Windcatcher louvers to improve ventilation efficiency. Energies 2020, 13, 4459. [Google Scholar] [CrossRef]
  41. Habibi, S.; Kamel, E.; Memari, A.M. Design strategies for addressing COVID-19 issues in buildings. Energy 2024, 293, 130680. [Google Scholar] [CrossRef]
  42. Ahriz, A.; Mesloub, A.; Djeffal, L.; Alsolami, B.M.; Ghosh, A.; Abdelhafez, M.H.H. The Use of Double-Skin Façades to Improve the Energy Consumption of High-Rise Office Buildings in a Mediterranean Climate (Csa). Sustainability 2022, 14, 6004. [Google Scholar] [CrossRef]
  43. Andreeva, D.; Nemova, D.; Kotov, E. Multi-skin adaptive ventilated facade: A review. Energies 2022, 15, 3447. [Google Scholar] [CrossRef]
  44. Li, J.; Calautit, J.; Jimenez-Bescos, C. Parametric analysis of a novel rotary scoop dual-channel windcatcher for multi-directional natural ventilation of buildings. Energy Built Environ. 2024. [Google Scholar] [CrossRef]
  45. Yusoff, W.F.M.; Shaharil, M.I.; Mohamed, M.F.; Rasani, M.R.M.; Sapian, A.R.; Dahlan, N.D. Review of openings with shading devices at naturally ventilated buildings. Archit. Eng. Des. Manag. 2023, 19, 463–479. [Google Scholar] [CrossRef]
  46. Al-Yasiri, Q.; Szabó, M. A short review on passive strategies applied to minimise the building cooling loads in hot locations. Analecta Tech. Szeged. 2021, 15, 20–30. [Google Scholar] [CrossRef]
  47. Mazzetto, S. Dynamic Integration of Shading and Ventilation: Novel Quantitative Insights into Building Performance Optimization. Buildings 2025, 15, 1123. [Google Scholar] [CrossRef]
  48. Bonazza, M. Water Vapor, Precipitation and Evapotranspiration Isotopic Composition in the Tropical Atmospheric Boundary Layer. Doctoral Dissertation, Georg-August Universität, Göttingen, Germany, 2021. [Google Scholar]
  49. Raven, J.; Stone, B.; Mills, G.; Towers, J.; Katzschner, L.; Leone, M.F.; Gaborit, P.; Georgescu, M.; Hariri, M.; Lee, J.; et al. Urban Planning and Urban Design. In Climate Change and Cities: Second Assessment Report of the Urban Climate Change Research Network; Rosenzweig, C., Solecki, W.D., Romero-Lankao, P., Mehrotra, S., Dhakal, S., Ali Ibrahim, S., Eds.; Cambridge University Press: Cambridge, UK, 2018; pp. 139–172. [Google Scholar]
  50. Palusci, O.; Cecere, C. Urban Ventilation in the Compact City: A Critical Review and a Multidisciplinary Methodology for Improving Sustainability and Resilience in Urban Areas. Sustainability 2022, 14, 3948. [Google Scholar] [CrossRef]
  51. Prajongsan, P.; Sharples, S. Enhancing natural ventilation, thermal comfort and energy savings in high-rise residential buildings in Bangkok through the use of ventilation shafts. Build. Environ. 2012, 50, 104–113. [Google Scholar] [CrossRef]
  52. ESN 18727; Emporis: Hamburg, Germany, 2019. Available online: https://www.emporis.com/building/standard/search/ESN+18727 (accessed on 1 August 2025).
  53. Blocken, B.; Moonen, P.; Stathopoulos, T.; Carmeliet, J. Numerical study on the existence of the venturi effect in passages between perpendicular buildings. J. Eng. Mech. 2008, 134, 1021–1028. [Google Scholar] [CrossRef]
  54. Van Hooff, T.; Blocken, B.; Aanen, L.; Bronsema, B. A venturi-shaped roof for wind-induced natural ventilation of buildings: Wind tunnel and CFD evaluation of different design configurations. Build. Environ. 2011, 46, 1797–1807. [Google Scholar] [CrossRef]
  55. Etheridge, D.W.; Sandberg, M. Building Ventilation: Theory and Measurement; John Wiley & Sons: Chichester, UK, 1996; Volume 50. [Google Scholar]
  56. Chen, Q. Ventilation performance prediction for buildings: A method overview and recent applications. Build. Environ. 2009, 44, 848–858. [Google Scholar] [CrossRef]
  57. Mentor-Graphics. FloEFD Technical Reference, software version 14; Mentor-Graphics: Wilsonville, OR, USA, 2013. [Google Scholar]
  58. Lam, C.; Bremhorst, K. A modified form of the k-ε model for predicting wall turbulence. J. Fluids Eng. 1981, 103, 456–460. [Google Scholar] [CrossRef]
  59. Mirzaei, P.A.; Carmeliet, J. Dynamical computational fluid dynamics modeling of the stochastic wind for application of urban studies. Build. Environ. 2013, 70, 161–170. [Google Scholar] [CrossRef]
  60. Wang, L.; Wong, N.H. Coupled simulations for naturally ventilated rooms between building simulation (BS) and computational fluid dynamics (CFD) for better prediction of indoor thermal environment. Build. Environ. 2009, 44, 95–112. [Google Scholar] [CrossRef]
  61. Franke, J.; Hirsch, C.; Jensen, A.; Krüs, H.; Schatzmann, M.; Westbury, P.; Miles, S.; Wisse, J.; Wright, N. Recommendations on the use of CFD in wind engineering. In Proceedings of the COST Action C14, Impact of Wind and Storm on City Life and Built Environment, Brussels, Belgium, 5–7 May 2004; pp. C1.1–C1.11. [Google Scholar]
  62. Franke, J.; Hellsten, A.; Schlunzen, K.H.; Carissimo, B. The COST 732 Best Practice Guideline for CFD simulation of flows in the urban environment: A summary. Int. J. Environ. Pollut. 2011, 44, 419–427. [Google Scholar] [CrossRef]
  63. Tominaga, Y.; Mochida, A.; Yoshie, R.; Kataoka, H.; Nozu, T.; Yoshikawa, M.; Shirasawa, T. AIJ guidelines for practical applications of CFD to pedestrian wind environment around buildings. J. Wind. Eng. Ind. Aerodyn. 2008, 96, 1749–1761. [Google Scholar] [CrossRef]
  64. Aflaki, A.; Hirbodi, K.; Mahyuddin, N.; Yaghoubi, M.; Esfandiari, M. Improving the air change rate in high-rise buildings through a transom ventilation panel: A case study. Build. Environ. 2019, 147, 35–49. [Google Scholar] [CrossRef]
  65. Bay, E.; Martinez-Molina, A.; Dupont, W.A. Assessment of natural ventilation strategies in historical buildings in a hot and humid climate using energy and CFD simulations. J. Build. Eng. 2022, 51, 104287. [Google Scholar] [CrossRef]
  66. Chen, C.; Gorlé, C. Full-scale validation of CFD simulations of buoyancy-driven ventilation in a three-story office building. Build. Environ. 2022, 221, 109240. [Google Scholar] [CrossRef]
  67. Hu, H.; Kikumoto, H.; Ooka, R.; Lin, C.; Zhang, B. Comprehensive validation of experimental and numerical natural ventilation predictions based on field measurement with experimental house. Build. Environ. 2022, 207, 108433. [Google Scholar] [CrossRef]
  68. Iskandar, L.; Bay-Sahin, E.; Martinez-Molina, A.; Beeson, S.T. Evaluation of passive cooling through natural ventilation strategies in historic residential buildings using CFD simulations. Energy Build. 2024, 308, 114005. [Google Scholar] [CrossRef]
  69. Lechner, N. Heating, Cooling, Lighting: Sustainable Design Methods for Architects; John Wiley & Sons: Hoboken, NJ, USA, 2014. [Google Scholar]
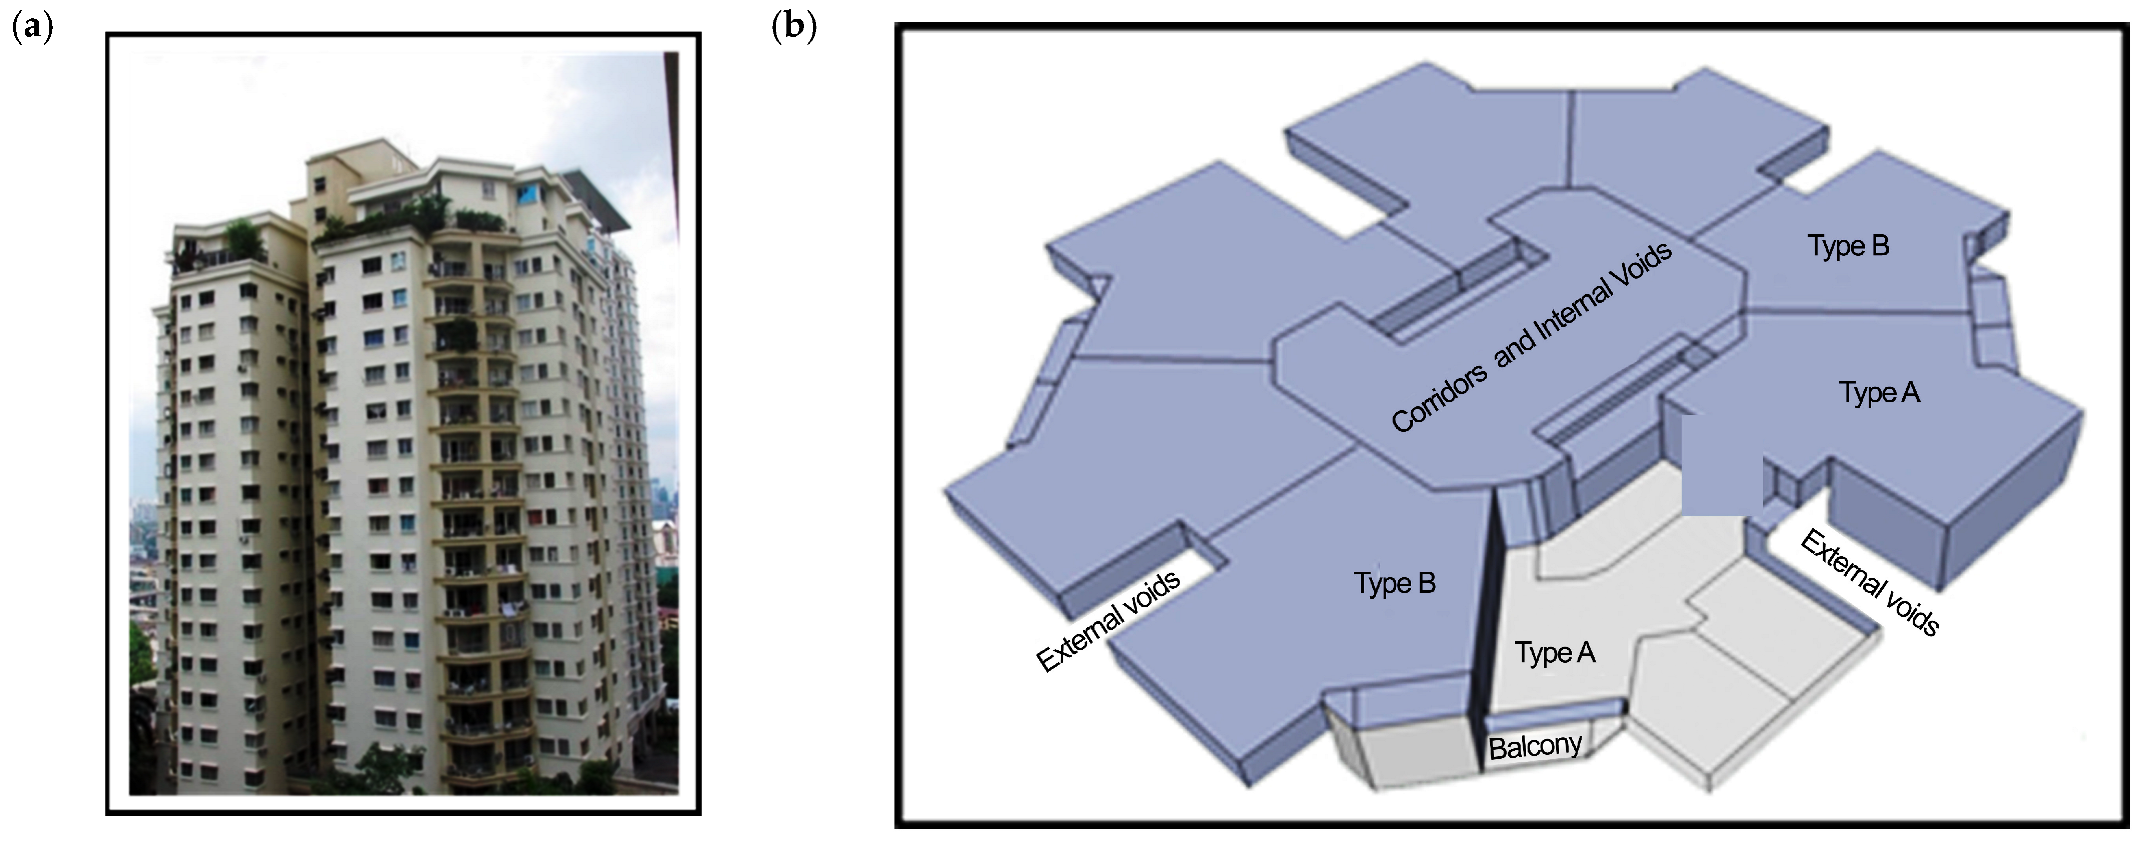
Figure 1. (a) South façade of the case study; (b) the floor layout of the case study includes eight residential units.
Architecture 05 00064 g001
Figure 2. Architectural plan of the selected unit (dimensions are in meters).
Architecture 05 00064 g002
Figure 3. Arrangement of airfoils in an array and the area reduction along the channels.
Architecture 05 00064 g003
Figure 4. Available parapets for the installation of airfoil array on the building’s façade.
Architecture 05 00064 g004
Figure 5. Vertical arrangement of airfoil array for installation on parapet B.
Architecture 05 00064 g005
Figure 6. Location of the installed airfoil array on the building’s façade.
Architecture 05 00064 g006
Figure 7. A top view of the applied airfoil to highlight the shape difference.
Architecture 05 00064 g007
Figure 8. Location and arrangement of the poles. (Pole 1 and 2 in the living room, Pole 3 and 4 in the Dining room, Pole 5 and 6 in the studying room).
Architecture 05 00064 g008
Figure 9. (a) Computational domain (dimensions are based on Figure 2); (b) generated grid with stretch.
Architecture 05 00064 g009
Figure 10. (a) Air velocity through the quadruple-grouped airfoils; (b) air velocity and pattern within a unit.
Architecture 05 00064 g010
Figure 11. The average volumetric airflow (m3/h) and ACH for six design alternatives based on the CFD simulations.
Architecture 05 00064 g011
Table 2. Various configurations of airfoil and air passage width.
TypeDesign
No.
Shape of the AirfoilAir Passage Width (m)Chord Line Length (m)Airfoil Height (m)
Flat-bottom1Architecture 05 00064 i0140.752.402.30
2Architecture 05 00064 i0150.502.402.30
Semi-symmetrical3Architecture 05 00064 i0160.752.402.30
4Architecture 05 00064 i0170.502.402.30
Symmetrical5Architecture 05 00064 i0180.752.402.30
6Architecture 05 00064 i0190.502.402.30
Table 3. Boundary conditions for the CFD simulations.
Air TemperatureWind SpeedTurbulence IntensityTurbulence LengthWalls
32.2 °C0.37 m/s10%0.03 mNo-slip
Table 4. Air velocity (m/s) at ten selected points for different grids.
Pole No.No. of Mesh CellsP1 *P2P3P4P5P6
PositionN/A ***Living roomLiving roomDining roomDining roomStudy roomStudy room
ElevationN/AM **H **MHMHMHMM
Coarse mesh270,7140.130.120.10.080.090.110.050.080.020.04
Medium mesh639,1450.140.120.10.080.090.110.050.080.020.05
Fine mesh1,542,1150.140.120.090.070.100.120.050.060.040.04
Finest mesh4,009,4990.150.120.090.080.110.120.050.060.040.04
* Positions of the calculated velocity based on Figure 8. ** M and H indicate mean medium (1.1 m) and high (1.8 m) levels. *** Not Applicable.
Table 5. Comparison of air velocity (ms−1) obtained from CFD simulation and measurement.
Pole No.P1P2P3P4P5P6
PositionLiving roomLiving roomDining roomDining roomStudy roomStudy room
ElevationMHMHMHMHMM
Experiment0.140.120.080.070.090.110.050.050.040.04
Numerical simulation0.140.120.090.070.100.120.050.060.040.04
Table 6. CFD simulation results for various airfoil shapes.
Design Alternative R1 C7ValueParameter
Pressure (Pa)Velocity (ms−1)Inlet Area (m2)Volumetric Flow (m3h−1)Unit Volume (m3)ACH
Design No. 1
Architecture 05 00064 i020
Min.101,1450.09
Max.101,1670.27
Ave.101,1550.153.061652.4117.514~
Design No. 2
Architecture 05 00064 i021
Min.101,1440.05
Max.101,1640.17
Ave.101,1540.113.061211.76117.510~
Design No. 3
Architecture 05 00064 i022
Min.101,1740.11
Max.101,1900.29
Ave.101,1570.183.061982.88117.516~
Design No. 4
Architecture 05 00064 i023
Min.101,1440.06
Max.101,1640.18
Ave.101,1540.123.061321.92117.511~
Design No. 5
Architecture 05 00064 i024
Min.101,1750.14
Max.101,1910.36
Ave.101,1830.253.062754.00117.523~
Design No. 6
Architecture 05 00064 i025
Min.101,1450.07
Max.101,1650.23
Ave.101,1820.23.062203.2117.518~
Table 7. Alternative width for the side air gaps in the angled triple airfoil.
Design AlternativeTwo Sides Air Gap Width (m)Shape of Group
A0.3Architecture 05 00064 i026
B0.5
C0.6
D0.8
E1.0
Table 8. Results of the CFD simulation tests for side air gaps in the angled triple-grouped airfoil slices.
Design AlternativeTwo Sides Air Gap Width (m)Average Air Velocity at the Inlet (ms−1)
A0.30.49
B0.50.57
C0.60.54
D0.80.49
E1.00.44
Table 9. Optimum air gap distances for the triple-grouped airfoil slices.
Two Sides Air Gap (m)Shape of GroupAir VelocityChord Line LengthAngle of Chord Line
0.5Architecture 05 00064 i0270.564.9510°
Disclaimer/Publisher’s Note: The statements, opinions and data contained in all publications are solely those of the individual author(s) and contributor(s) and not of MDPI and/or the editor(s). MDPI and/or the editor(s) disclaim responsibility for any injury to people or property resulting from any ideas, methods, instructions or products referred to in the content.