Abstract
Advanced technologies increase both the speed and the efficiency of work, saving time and money for practitioners. These technologies manifest in tools and resources that equip professionals across various sectors to carry out their work more effectively. Unfortunately, these resources can be confusing, convoluted, and critically misunderstood. Therefore, understanding emerging and advanced technology positions professionals to fill in gaps in knowledge and provides unrivaled value for the profession. This study examines advanced technology in the field of landscape architecture, analyzes applications of tools and resources, and provides a guide for implementation to answer the following research question: How can UAVs improve site analysis workflows for small landscape architecture firms? Focused on Unmanned Aerial Vehicles (UAVs), the discussion finds a multi-resource workflow leads to higher quality data, faster analysis, and more targeted solutions.
Keywords:
UAV; photogrammetry; landscape architecture; design workflow; site analysis; remote sensing; dji; practice 1. Introduction
Land surveying improved greatly through the use of remote sensing. Triangulation has been employed in making maps and subdividing lots [1,2]. The advancement in geological survey techniques significantly improved the methods used in data collection. The use of ground-penetrating radar (GPR), electrical resistivity (ER), and magnetometry allows for non-invasive or destructive subsurface surveying [1]. These techniques greatly enhance archaeological and geological research, improving precision land evaluations while minimizing workforce requirements.
UAV technology transformed the process of surveying, particularly in acquiring aerial data. High-quality cameras and LiDAR (Light Detection and Ranging) allow UAVs to acquire accurate topography over vast territories [3]. This technology is critical in developing detailed 3D models and high-quality maps useful in urban planning, environmental observation, and landscape architecture [4].
1.1. UAV Data Collection
The technical ability of UAVs has seen tremendous progress and development since their first applications in defense. This progress comes mainly in imagery, photogrammetry, and LiDAR. Currently, high-quality cameras on UAVs can capture detailed images from above. Integrating these images into various workflows allows for generating highly detailed ortho-perspective maps and accurately referencing 3D models [5,6]. Timelapse, Augmented Reality (AR), and Virtual Reality (VR) are some of the emerging uses of UAVs [7,8].
UAVs equipped with photogrammetric cameras capture a sequence of overlapping images varying in direction, which enables post-processing software to stitch together accurate 3D models or ortho-topographic images of the environment [9,10]. The ability of photogrammetry to capture large quantities of data with ease increases efficiency and advances decision-making during the design and construction processes, with resolution being the biggest drawback [6].
Light Detection and Ranging (LiDAR) technology by UAVs allows for the collection of 3D data, including terrain and vegetation, with stunning precision. [11,12]. This technology can penetrate biomass with greater precision, generating highly accurate analyses, which is already being used to significant effect in the Amazon rainforest [13].
Software also plays a critical role in the application of UAV post-processing [14]. Software for post-processing varies on accuracy determinable on use cases [15]. Pix4DPro, PhotoMod Lite, and Agisoft Metashape Professional are all powerful photogrammetry software with specialized applications [16]. Software developments are improving in accuracy and becoming more accessible with further innovation in the field.
1.2. UAVs in Landscape Architecture
While advancements in other fields shape the role and development of UAV technology, landscape architecture has increasingly adopted them, particularly in site analysis, imaging, and construction oversight. UAVs equipped with photogrammetry, LiDAR, and multispectral sensors now play an increasing role in data collection for informed site planning and design. Generating comprehensive topographical maps allows UAV-enabled landscape architects to understand landforms, vegetation patterns, and site conditions more accurately, supporting data-driven or parametric designs [17,18]. Additionally, the ability of UAVs to monitor long-term environmental change allows professionals to document site conditions before and after project implementation—a critical factor in evaluating the effectiveness of landscape interventions [19].
Construction administration utilizes UAVs to enhance project monitoring by providing real-time images to verify progress and compliance with design specifications. The everyday use of UAVs to monitor the site encourages collaboration among all parties. Project managers can also check that construction is carried out with attention to design intentions [17,20]. UAVs also streamline project management across larger sites by offering autonomous flight paths and data collection. UAVs also allow for the location and solution to problems that may arise in the construction process, such as construction hazards or unplanned modifications [20,21]. The integration of UAV technology into construction and design benefits construction administration as well as the total quality of the project.
Beyond construction administration and site analysis, UAVs are essential in conservation. Multispectral sensors allow UAVs to assess the health of plants, recognize biodiversity patterns, and monitor data necessary to inform ecological restoration [19,22]. Research has shown the efficiency of UAVs in monitoring urban landscapes, where aerial data helped landscape architects locate intervention zones and develop specific management strategies [23,24]. Additionally, UAVs enhance community involvement by providing dynamic visuals of proposed designs, increasing understanding and client feedback [25]. This function is helpful in public projects, where visualization helps gather community feedback and increase understanding of community involvement.
Case studies of UAVs in landscape architecture focus on the shifting perspective played by low-altitude aerial observations. Opportunities to develop more comprehensive and more valuable understandings of site, scale, and existing conditions are enhanced by the use of UAVs in landscape architecture [26,27]. In addition to the quantitative benefits and capabilities of UAVs, the qualitative aspect creates new avenues of design and exploration [28]. UAVs offer a changing perspective of the landscape that surveys to enhance the landscape architects’ workflows and methods [29].
Logical categorization of landscape architectural design divides the process into four broad categories: Site Inventory and Analysis, Conceptual Design, Design Development, and Project Implementation [30]. These categories serve to inform the work and methods used in each phase, allowing for a comprehensive and exhaustive workflow to be employed. Observations of what is shaping the beginning phases, while increasing precision and justification of construction, dominate the latter two [31].
While existing literature highlights the technical capabilities of UAVs, few texts directly address the role of UAVs in landscape architectural workflows. In particular, the literature overlooks how these improvements can be adopted into everyday site inventory processes.
This study bridges the gap between research on UAVs and professional landscape architecture firm workflows. This study leverages existing knowledge on UAV capabilities and applies it to current workflows to understand how practice might change.
The methodology and approach of this study are designed to answer the following question:
How can UAVs improve site analysis workflows for small landscape architecture firms?
2. Materials and Methods
This study employed two primary methodologies to evaluate the effectiveness of small unmanned aerial vehicles (sUAVs) in enhancing site documentation workflows for landscape architecture. First, a structured survey assessed current professional practices. Second, a comparative site analysis evaluated sUAV performance relative to conventional data acquisition methods.
A 26-question survey was distributed via email to licensed landscape architects in the southeastern U.S. through university departments and state ASLA chapters. Responses from 54 participants were analyzed using Qualtrics. The survey was structured in ten categories, identifying tools used, workflow sequencing, and application stages. A tool-phase matrix was created to reveal overlaps and gaps in practice. Tools listed included Google Earth, GIS, UAVs, vendor data, and professional surveys. The study received exempt status (IRB-25-010) from Mississippi State University.
The comparative analysis was conducted at a 0.51-acre site in Starkville, MS, selected for its mixed vegetation, utility presence, topographic complexity, and remote location. Five tools were assessed: Google Earth, GIS (MARIS), vendor imagery (Nearmap/Topoexport), sUAV (DJI Mavic 2 Pro, DJI, Shenzhen, China), and a professional survey (benchmark). Artifacts (imagery, 3D models) and data (contours, utilities, vegetation) were extracted and compared using Rhino 3D, Adobe Photoshop 2025, and QGIS 3.34 Prizren.
Each capture method was used to generate site data, which was analyzed for pixel resolution, visual identification, and projection distortion. Imagery was evaluated in Photoshop by measuring known objects to derive resolution (in cm/pixel). Visual identification accuracy was validated through on-site observations, verifying key features like tree locations, structures, and utilities. Vegetative clarity, an important parameter for landscape architects, was assessed by overlaying each dataset with the professional survey in Rhino 3D.
Photogrammetric flights were executed using Pix4Dcapture under controlled weather conditions (altitude: 40 m, angle: −60°, overlap: 80%). Data were processed in Pix4D Pro and imported into Rhino 3D. The model had a GSD (ground sample distance) of 0.99 cm/px. The flight data from Pix4D Pro used in this study was not referenced to a Ground Control Point because of the intent to measure it against a professional survey, treating the survey as the most accurate measure. Therefore, there was no RMSE for the photogrammetric model in this study; instead, its accuracy to the professional survey became the measure of accuracy. For this, sectional and topographic models were derived and compared to other resources. Quantitative comparisons used center-to-center distance measurements between tool-generated points and the professional survey to calculate deviation in centimeters. Data categories—contours; slopes; utilities; buildings; and vegetation—were measured independently to minimize confusion. This method utilized Rhino 3D as the tool of measurement with a precision of a tenth of a cm.
Professional surveys were used as the accuracy benchmark. Each tool’s outputs were analyzed in comparison to the survey across all categories. The study determined which resources could replicate or approximate survey-level detail, identifying both strengths and operational limitations.
This structured, mixed-methods approach allowed the development of a reproducible framework for evaluating site analysis tools and established a replicable standard for testing UAV-based workflows against traditional methods in landscape architecture.
3. Results
The results are divided into a series of sections that correlate to the process in which the methods were carried out. All measurements are presented with a confidence interval of 90%.
3.1. Survey Questionnaire
The survey received several responses that directed the course of the project. The number and type of respondents directly affected the collected data. The results are split into different categories of information. The overall number of respondents was 54.
Additionally, for each resource that was included in the study, participants were asked to indicate what artifacts/data they gathered from it, see Figure 1. This information was sorted into categories.
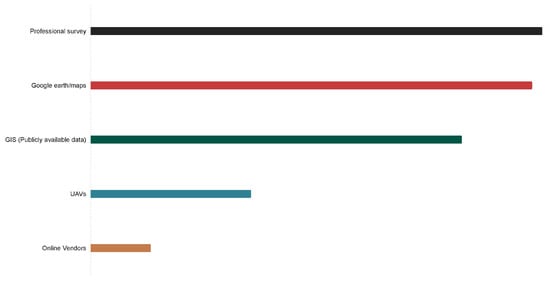
Figure 1.
This figure shows the number of responses received for each resource.
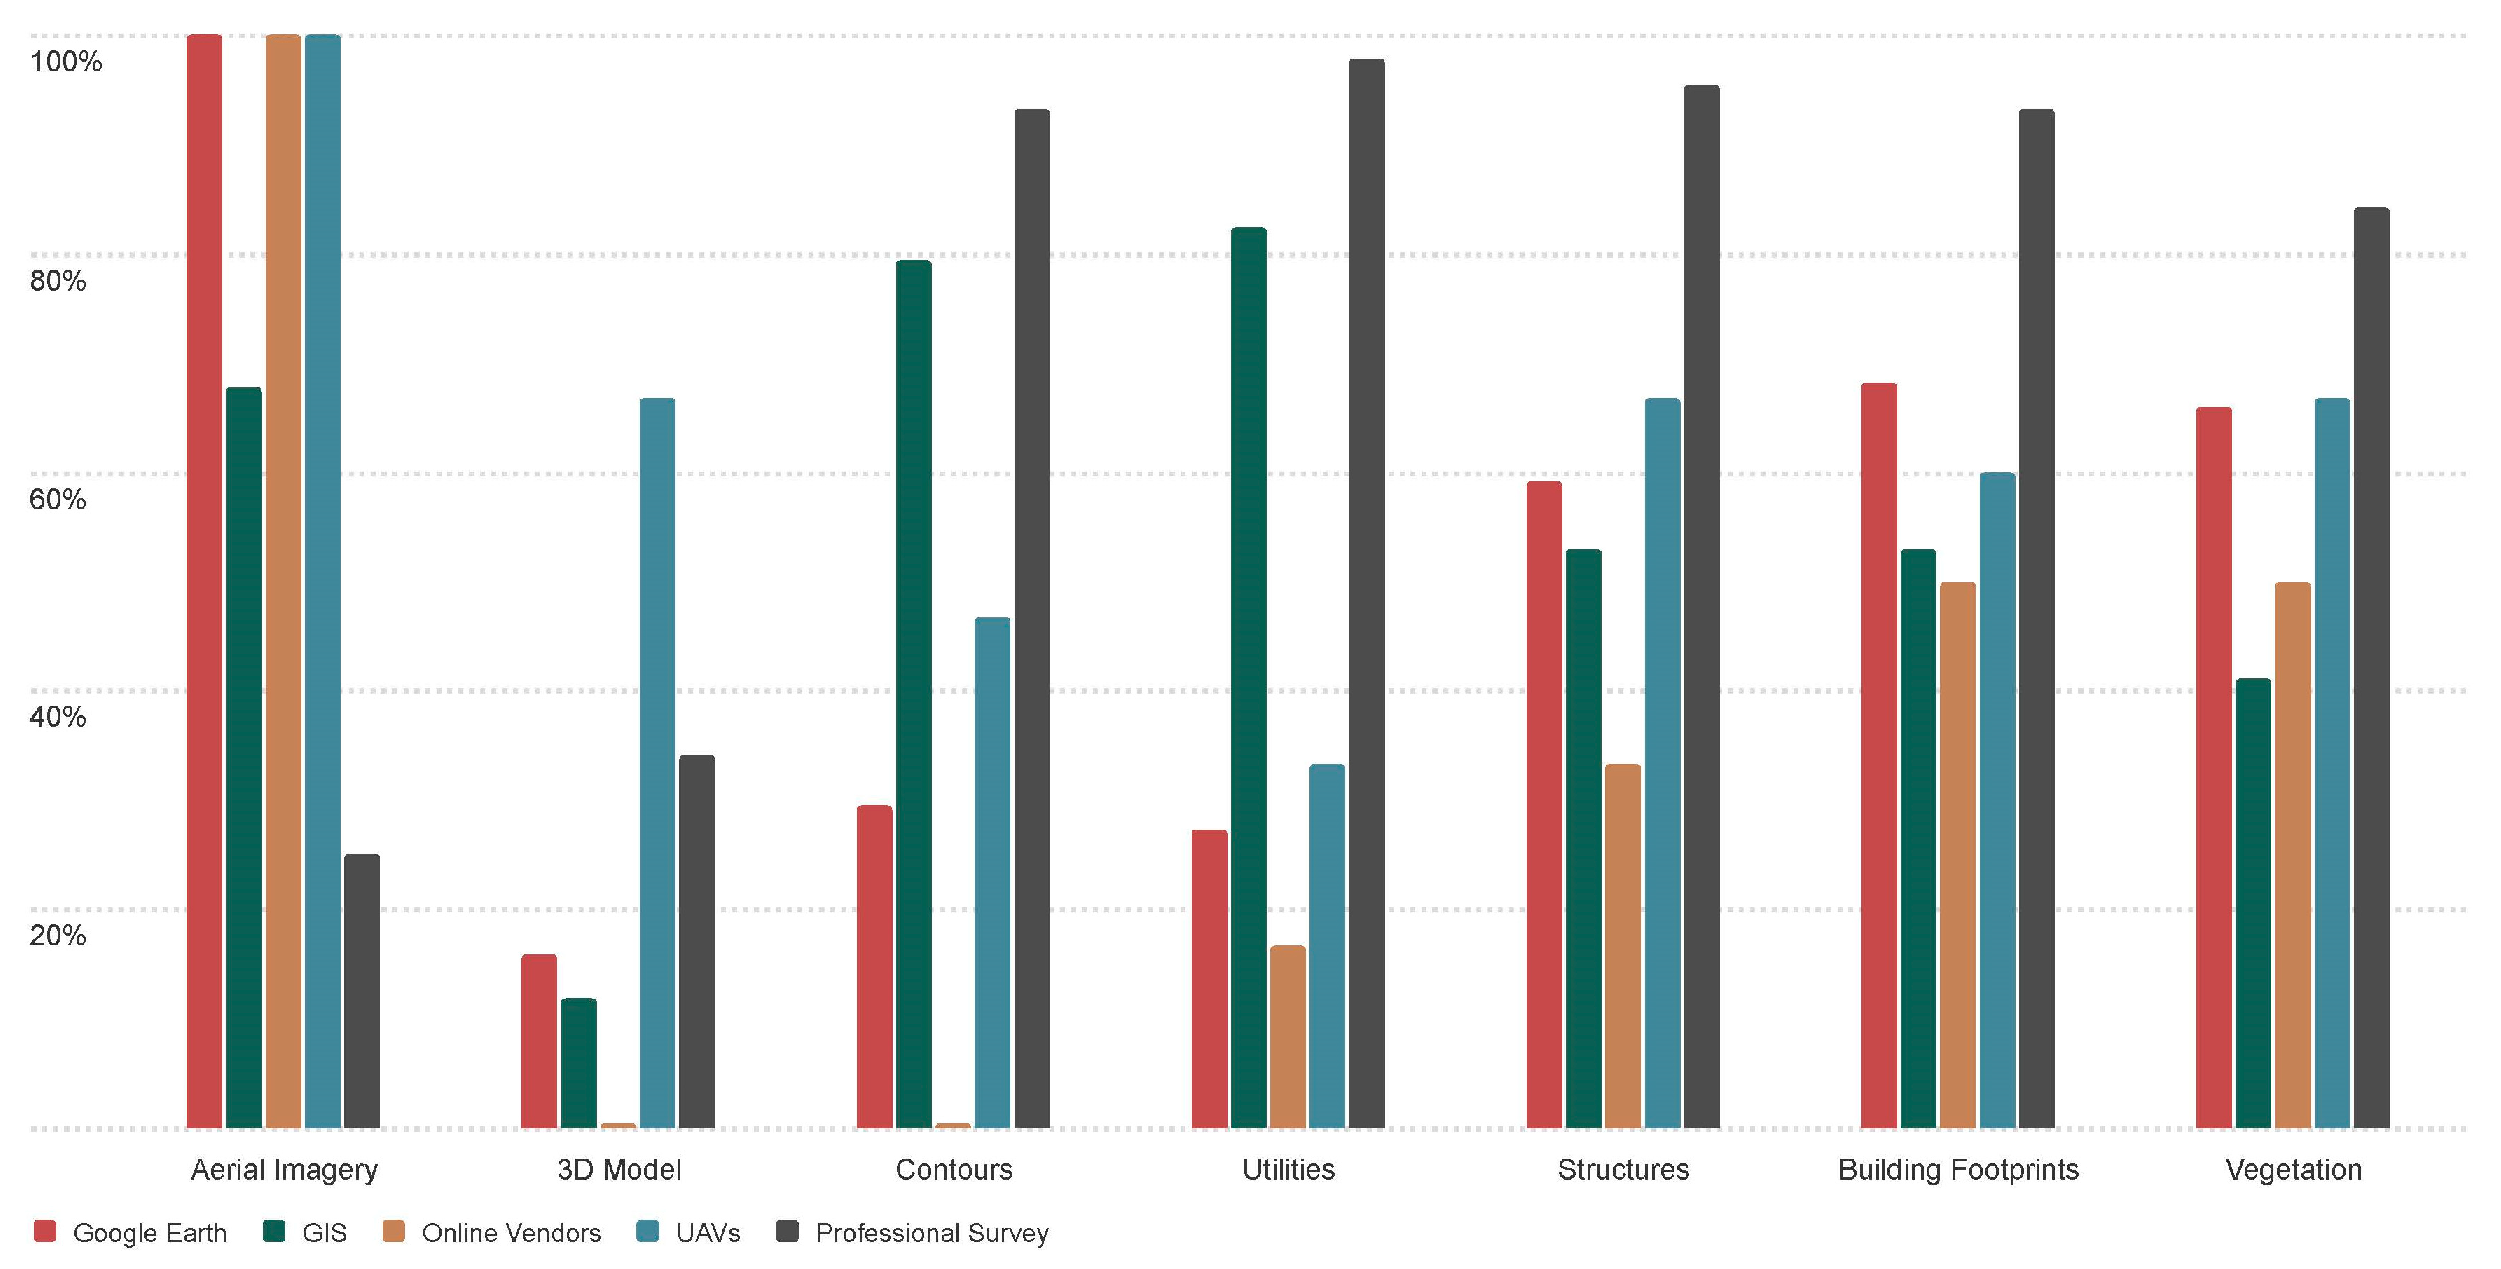
All the resources included in this study are being utilized for the collection of some type of data by current respondents. Each resource has a single or set of data types that people rely on more heavily than other resources, see Figure 2. For utilities, respondents lean on professional surveys and GIS, while for aerial imagery, other resources are turned to. The professional survey is heavily relied upon for all of the data categories but is less used for the artifacts. While for UAVs, that is slightly shifted with more of a focus on the artifacts and supplemental data. Nearmap and Google Earth focus primarily on aerial imagery, while respondents also use Google Earth for some types of data collection.
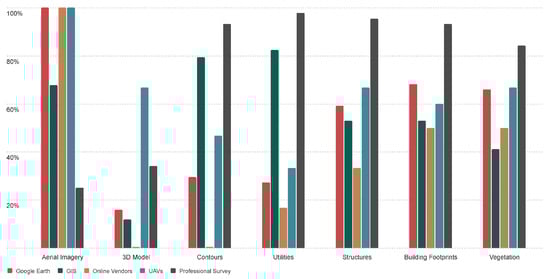
Figure 2.
This figure shows the artifacts that are gathered from each resource studied.
For each resource, there is a clear hierarchy of how practicing landscape architects and design professionals are using it in the real world. The survey works well to provide a benchmark to understand what the current use patterns are. But it does nothing to tell us if these are the best uses for these tools. This is where the next part of the method comes into play. The case study.
3.2. Case Study
The case study was conducted to test the real-world application of each resource as a site information collection tool. The site that was studied was 518 University Drive, Starkville, MS 39759. Each tool was utilized on the site to understand the type and quality of the data and artifacts collected.
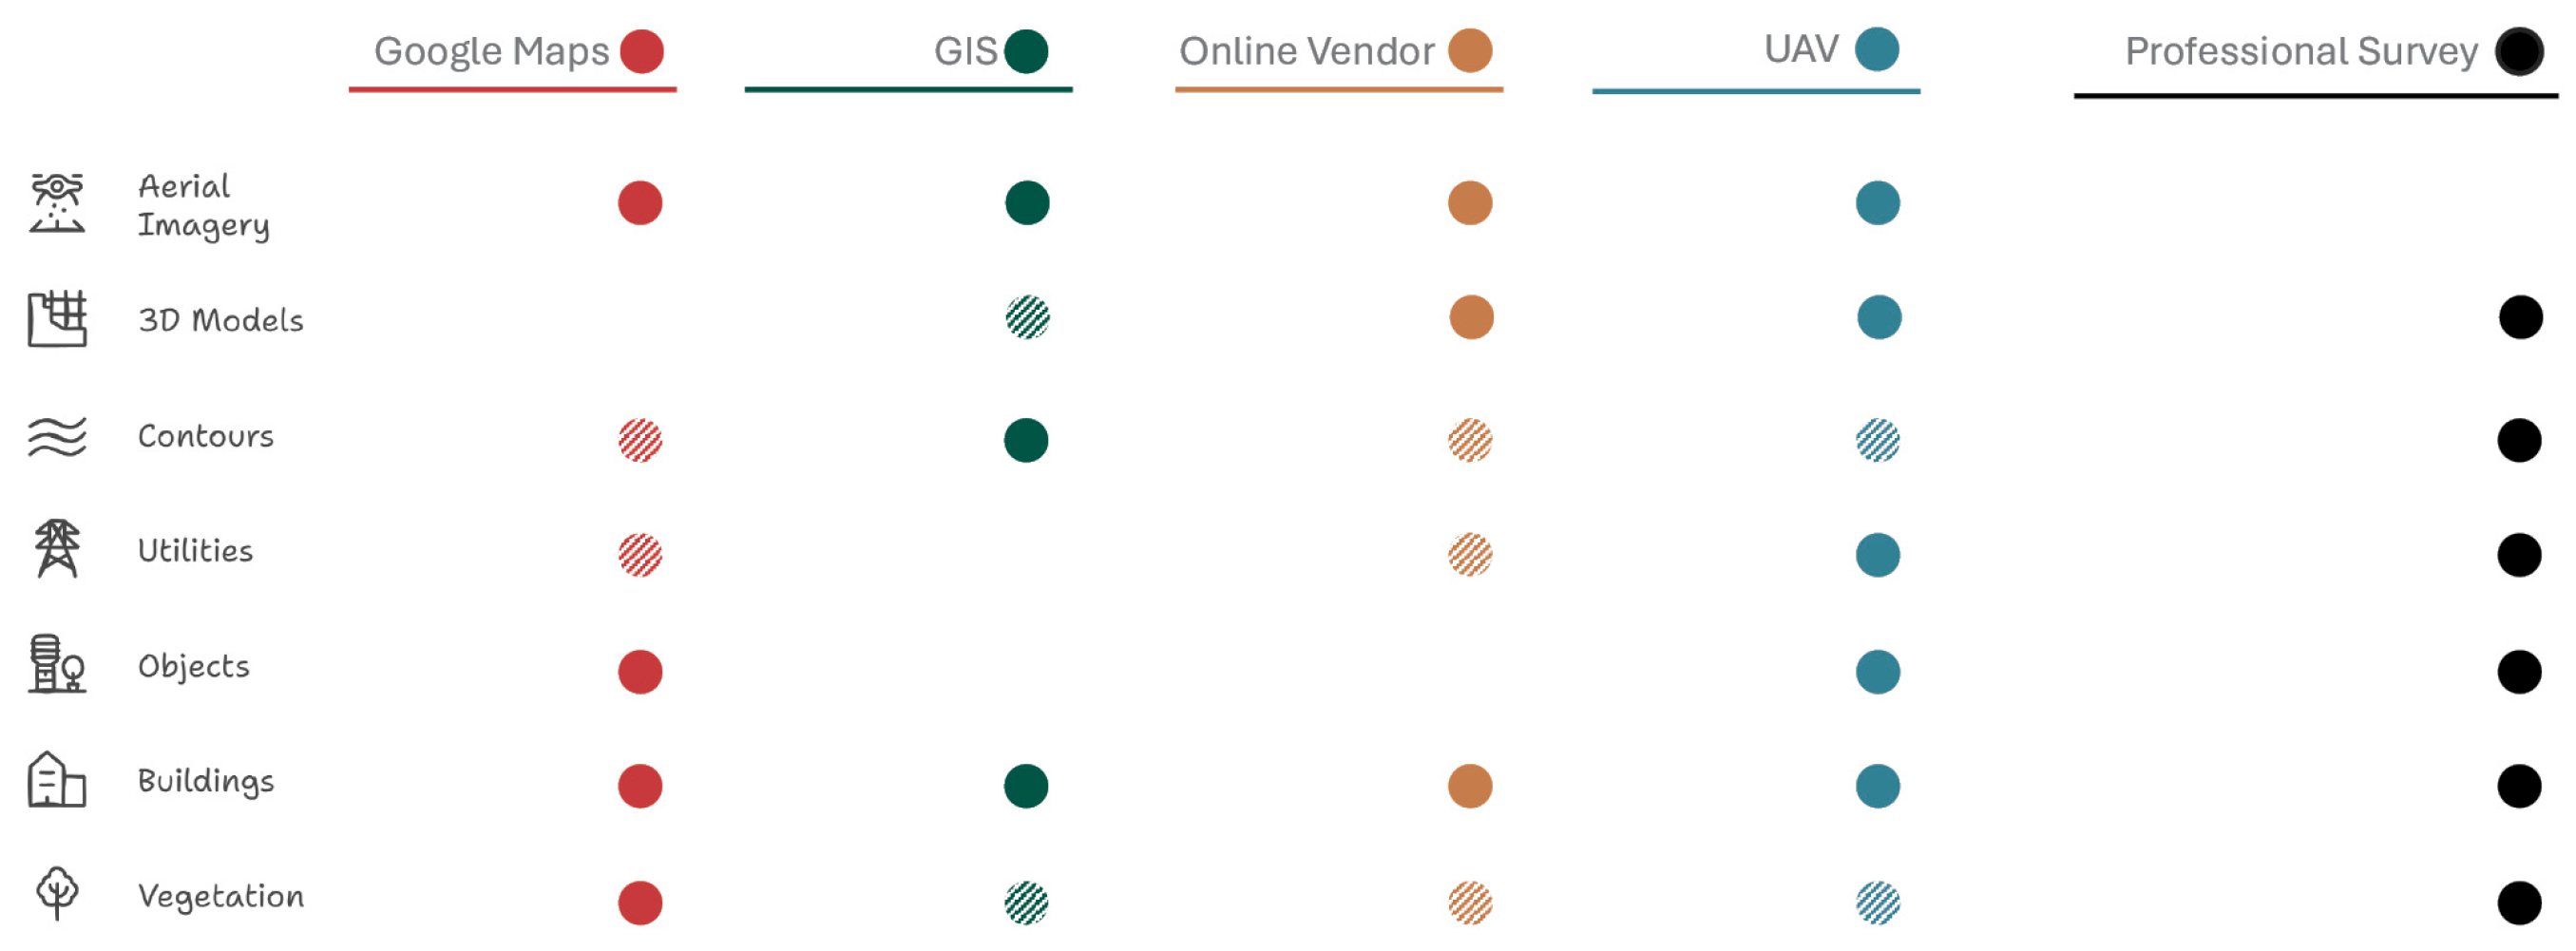
Each tool was tested based on the matrix determined from the survey. Because of the nature of the study, the professional survey was held constant as the most accurate information available, see Figure 3. This is because it is the gold standard of construction and is used to build off of for any project. Therefore, each resource was compared for accuracy against the professional survey in each category as much as possible.
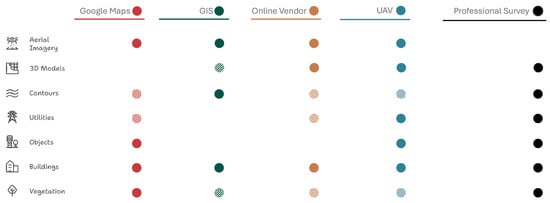
Figure 3.
This figure shows the results of the case study. Solid indicates strong data quality; hatched indicates weak data quality. Blank indicates no data.
A comparative analysis was conducted against the professional survey to understand the accuracy of information collected through each method. Due to the lack of aerial imagery in the professional survey, the analysis focused on the data categories rather than the artifacts. Each category of data were plotted and measured against the survey, as well as the other resources used. For each resource, the survey was held as a constant plotted in black, while the resources were plotted and color-coded: Google Earth—Red; GIS—Green; Online Vendor—Tan; and UAV—Blue.
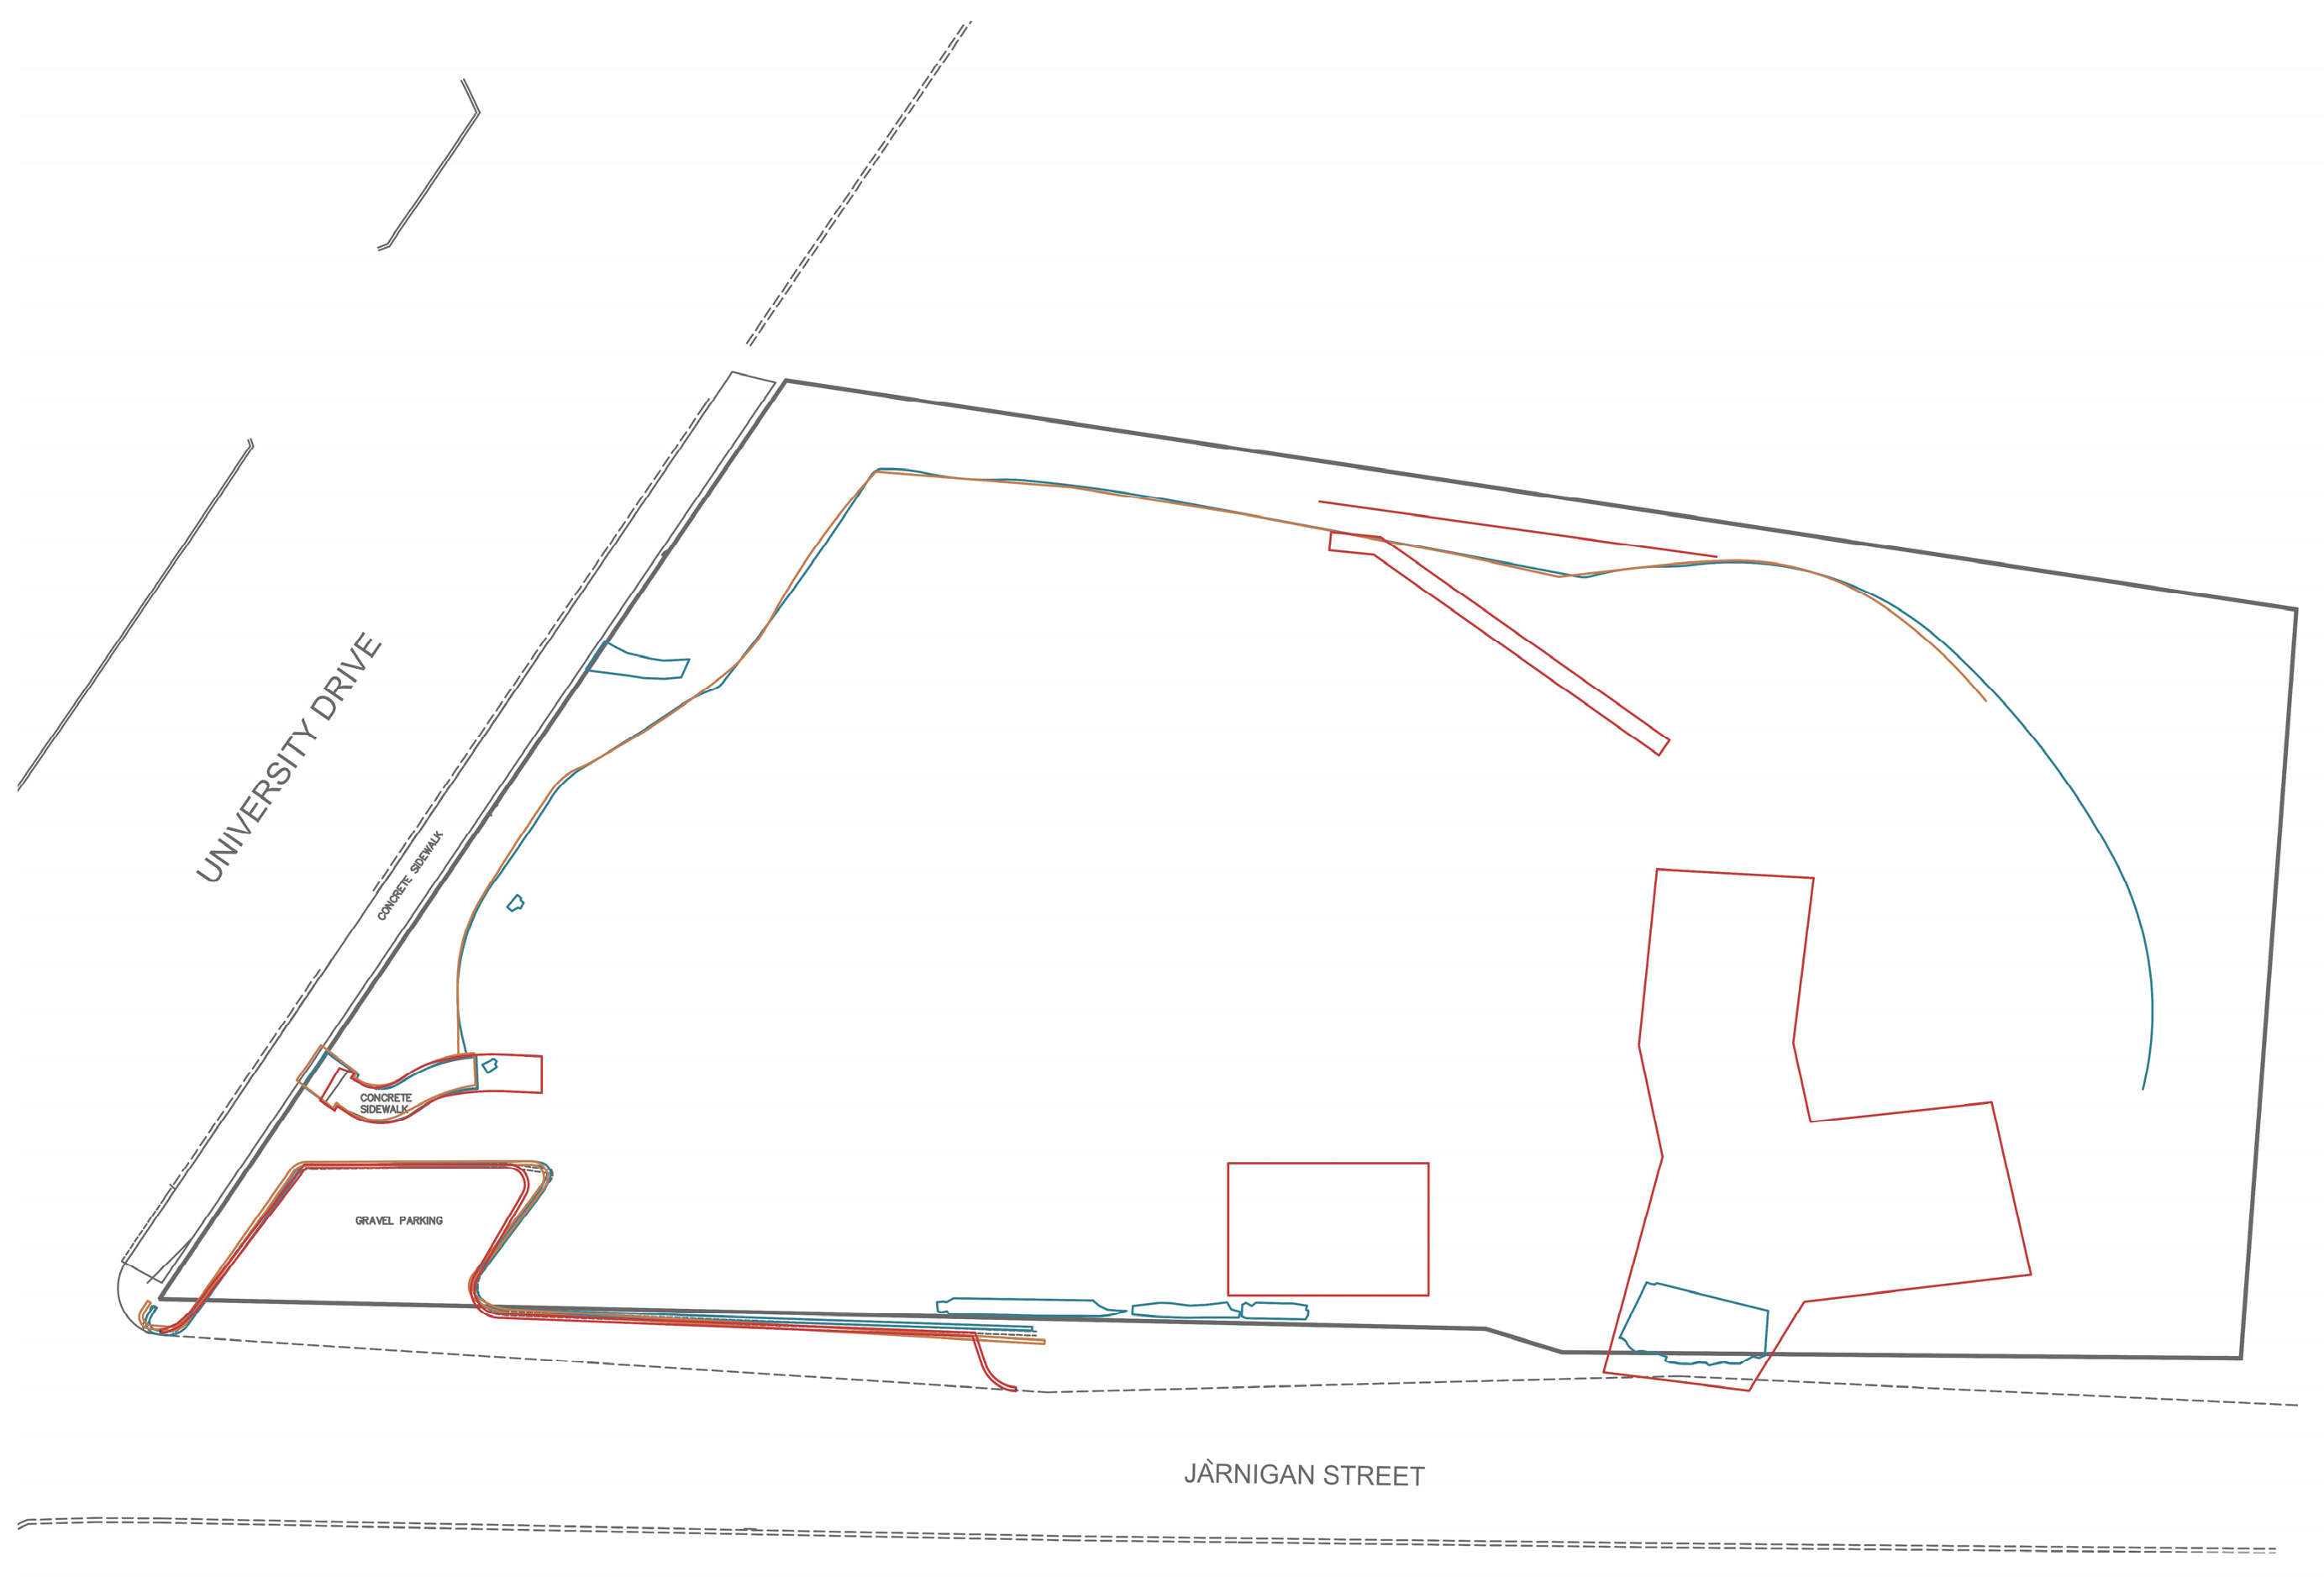
3.2.1. Sectional Contour Analysis
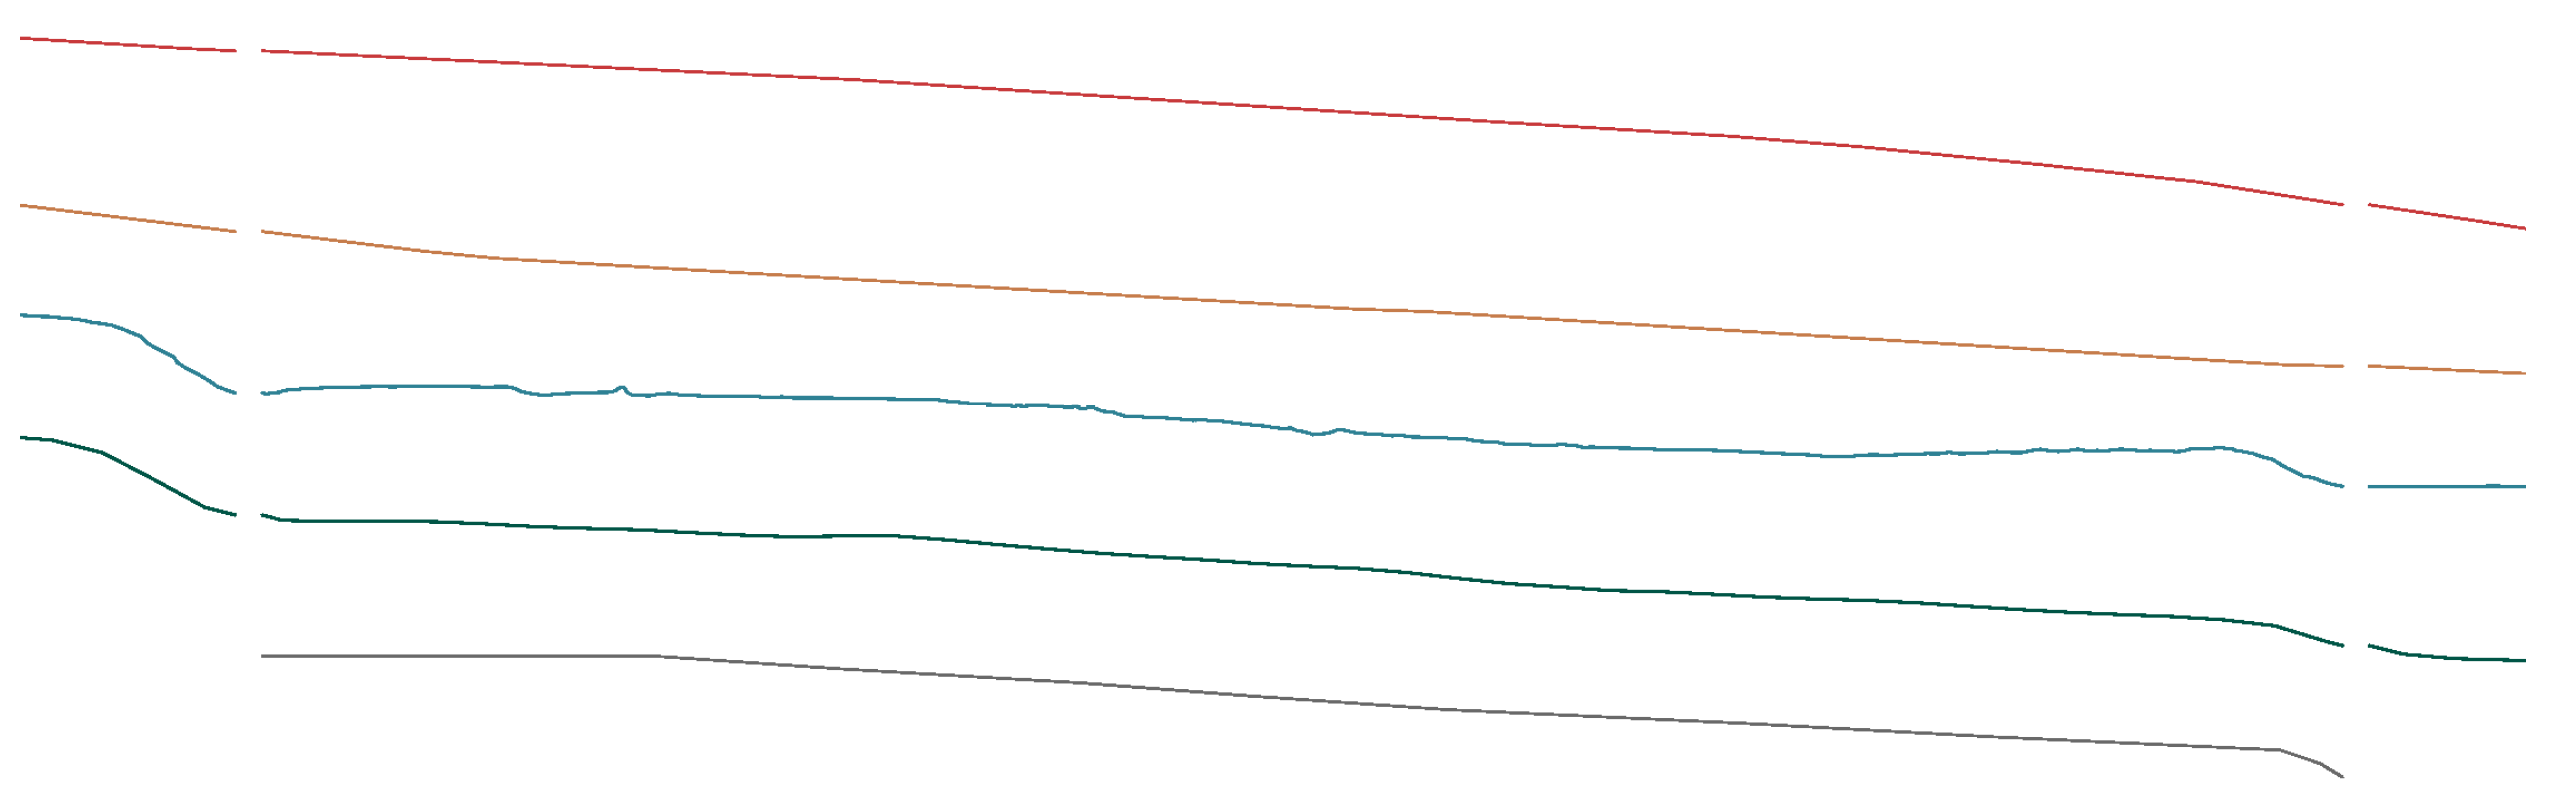
By drawing a section through the site and using the intersection points of the contours to draw a section, the accuracy of the information can be analyzed with much greater precision than using traditional contours see Figure 4. Additionally, when we use these section lines, we are also able to include all resources that provide topographic information rather than those that just provide contour lines. Slope information shows a different story of the accuracy of each resource.
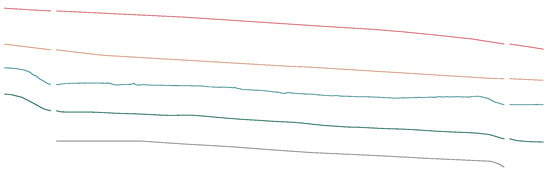
Figure 4.
Section cuts across the site. Google Earth—Red; GIS—Green; Online Vendor—Tan; UAV—Blue and Professional Survery—Black.
Using section transects allowed for the calculation of the area between the resources and the professional survey. This was carried out by creating a surface between each section line and the survey and then finding its area in cm2.
Google Earth data—plotted in red—this information is very imprecise; failing to account for any of the site-specific slope information and averaging more than a 91.44 cm deviation from the professional survey, see Table 1. GIS data—plotted in green—contains a high degree of consistency to the survey, never differing by more than 15.24 cm throughout the site and averaging 7.62 cm. Online vendor Topoexport, plotted in tan, has little to no variation on the section line, failing to show site-specific topographical information. On average, the slope is more than 25.4 cm off, up to 48.26 cm at the most. UAVs collected sectional information with quite high accuracy, with an average error of 5.08 cm on the west side. However, on the east side, the information warps up and averages 43.18 cm of difference.

Table 1.
Sectional Contour Accuracy (Area Difference in Centimeters Squared).
3.2.2. Utilities
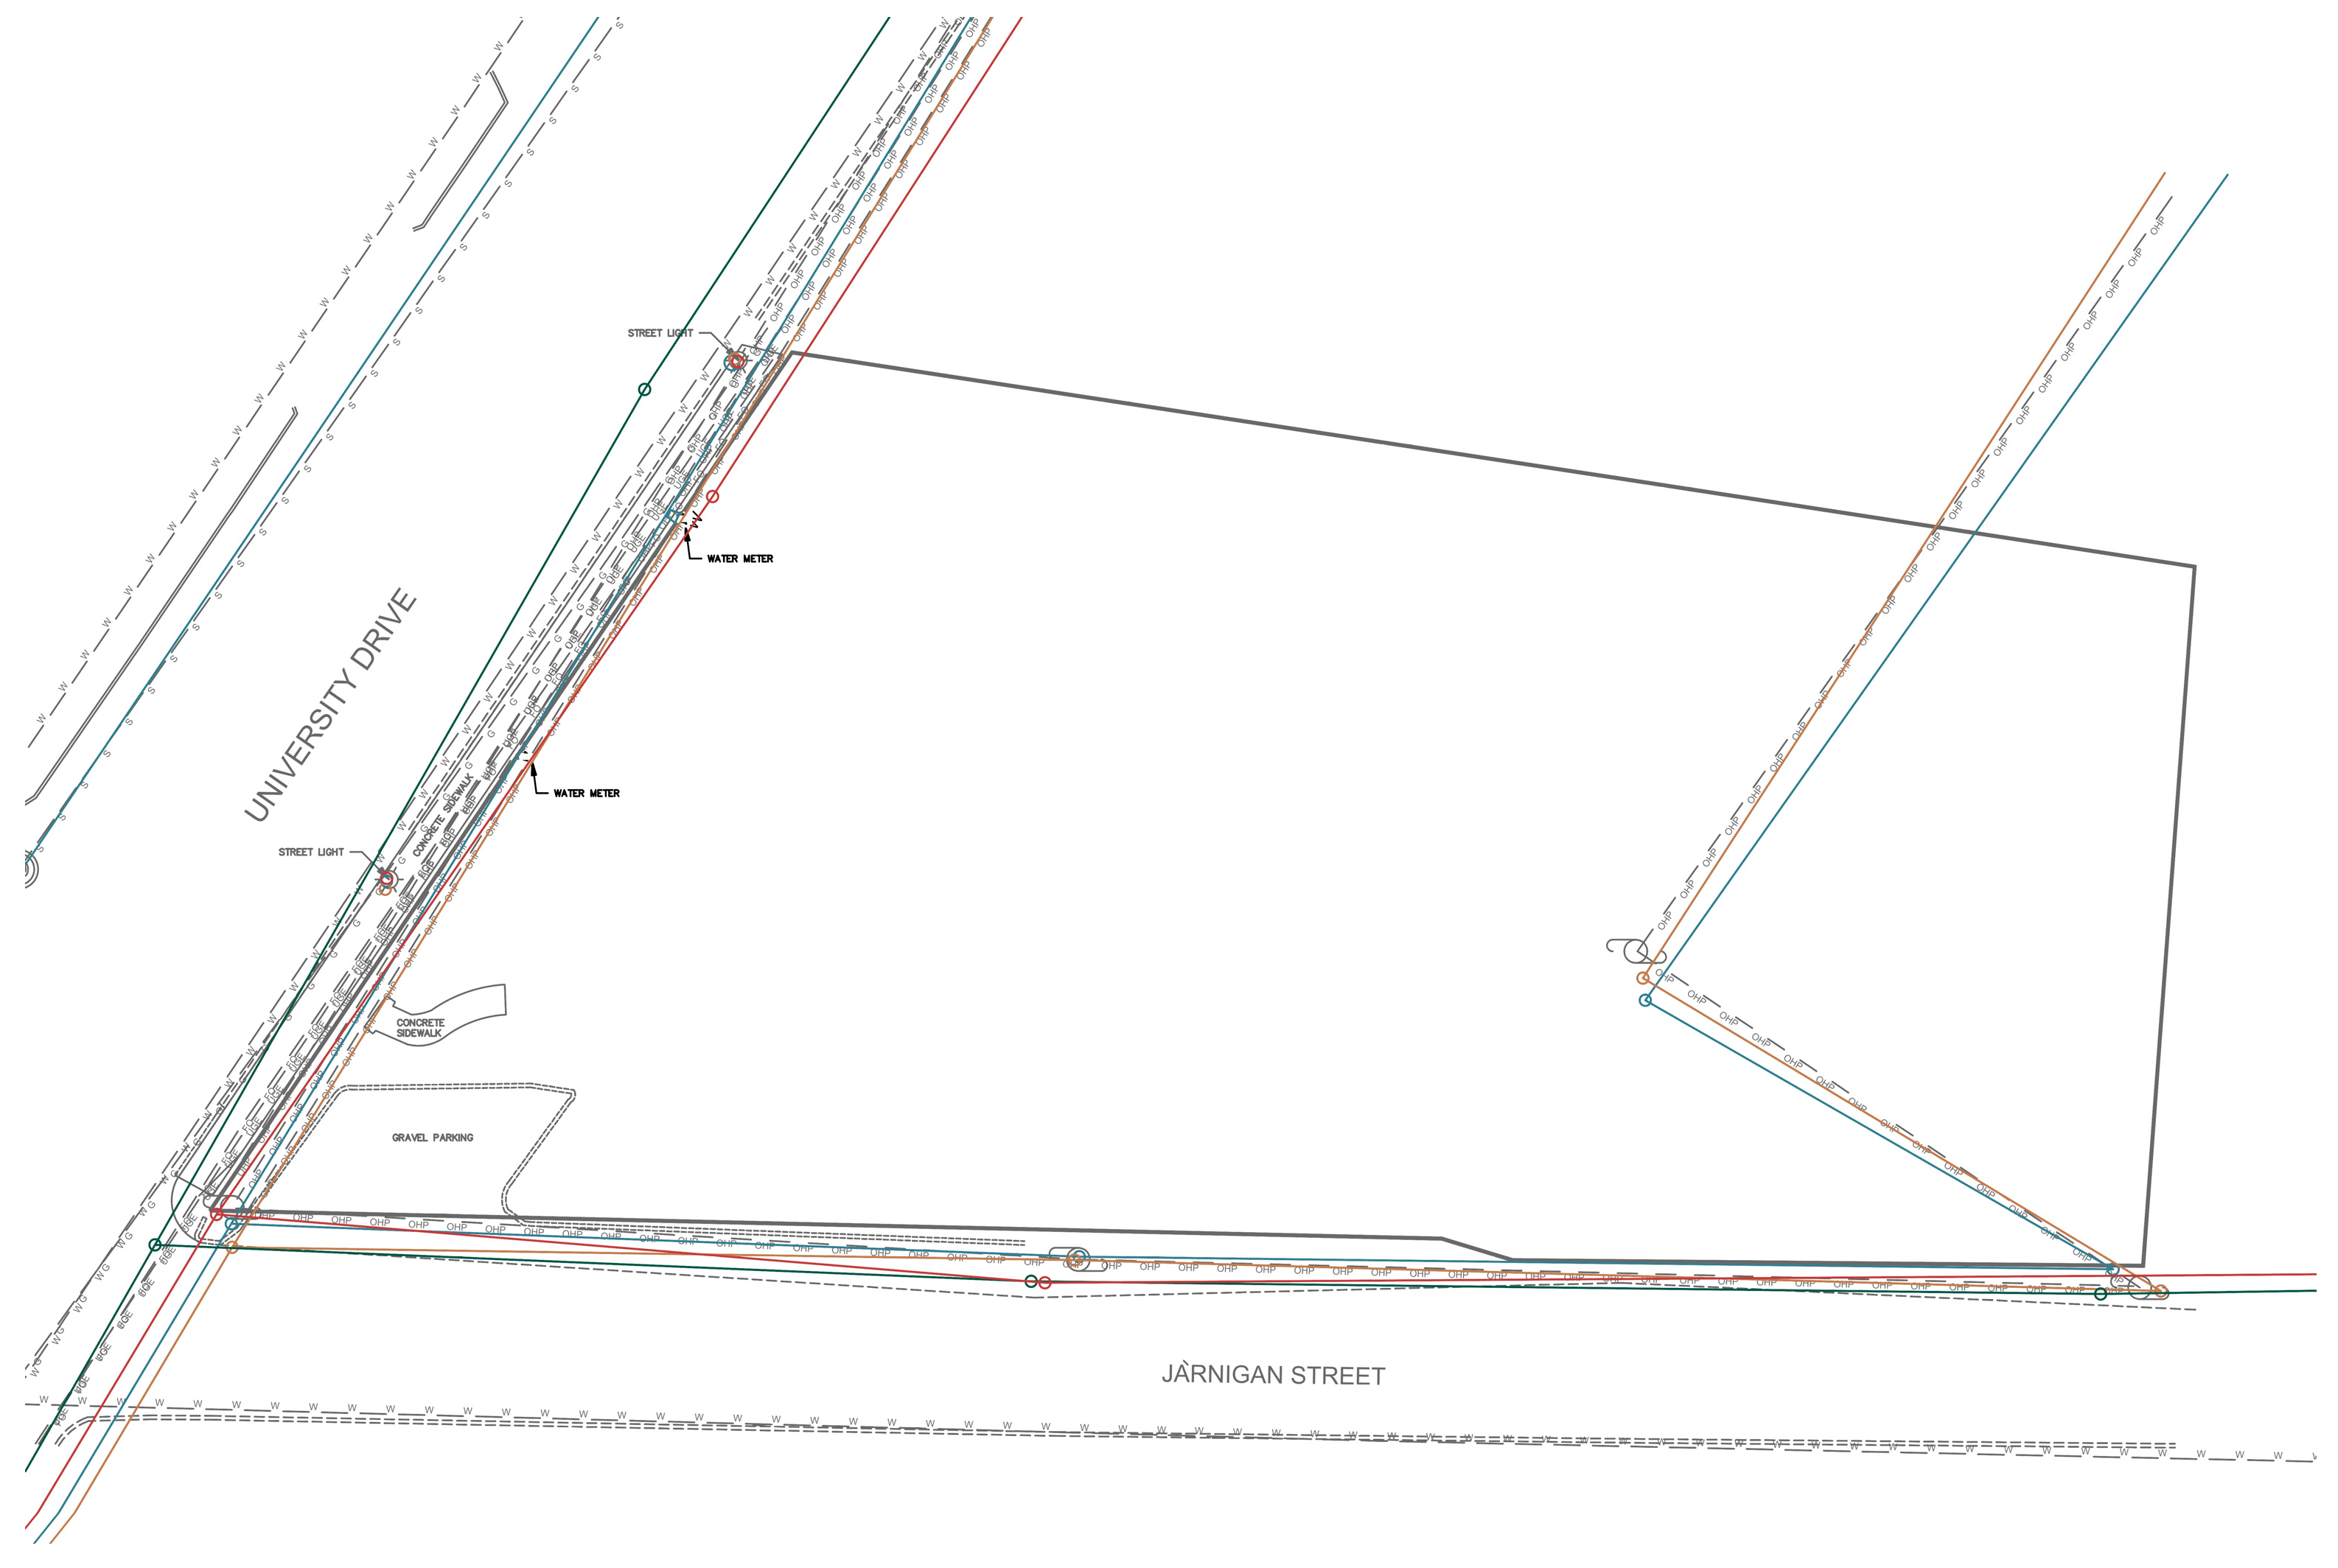
For the comparison of utilities on-site, only the above-ground utilities can be accurately located, as this is due to the method of analysis. For each resource, the aerial imagery was studied, and the location of utilities was plotted, see Figure 5.
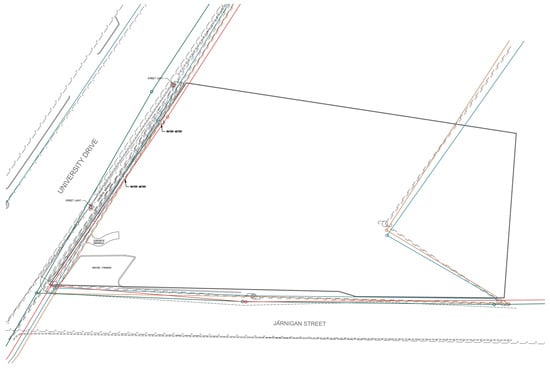
Figure 5.
Above-ground utilities on site. Google Earth—Red; GIS—Green; Online Vendor—Tan; UAV—Blue and Professional Survery—Black.
Google Earth utility data are decently inaccurate, making it incredibly hard to accurately identify utilities for this site. However, with the use of Google Earth street view, many of the more outstanding inaccuracies can be corrected. The location of streetlights is much more accurate, with the maximum difference being 17.78 cm off, see Table 2.
Table 2.
Utilities Accuracy.
3.2.3. Objects
For the comparison of objects on the site, aerial imagery was observed for all resources, see Figure 6. These images are one of the only ways to gain an understanding of specific site features such as parking pads, fences, and walkways. For the site of this study, several features show up depending on the resources you use to analyze it.
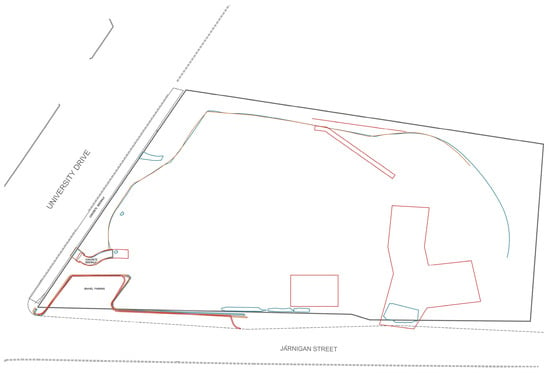
Figure 6.
Object Accuracy. Google Earth—Red; GIS—Green; Online Vendor—Tan; UAV—Blue and Professional Survery—Black.
Google Earth shows a collection of objects and site features that would accompany the houses located on the site: a fence, a walkway, a large parking pad, a gravel pull-off, and a series of steps. This information is decently accurate according to the Google Earth imagery and 3D model. However, these features no longer exist on the site. They have since been removed as part of a new construction project. Here, Google Earth information is inaccurate and misleading for an understanding of the current site conditions. This information grows increasingly accurate as the resource used moves from GIS to Nearmap to the UAV. The UAV is by far the most accurate; it locates the steps, the silt fence, and the gravel pull-off with a higher degree of precision in relation to the professional survey than Nearmap.
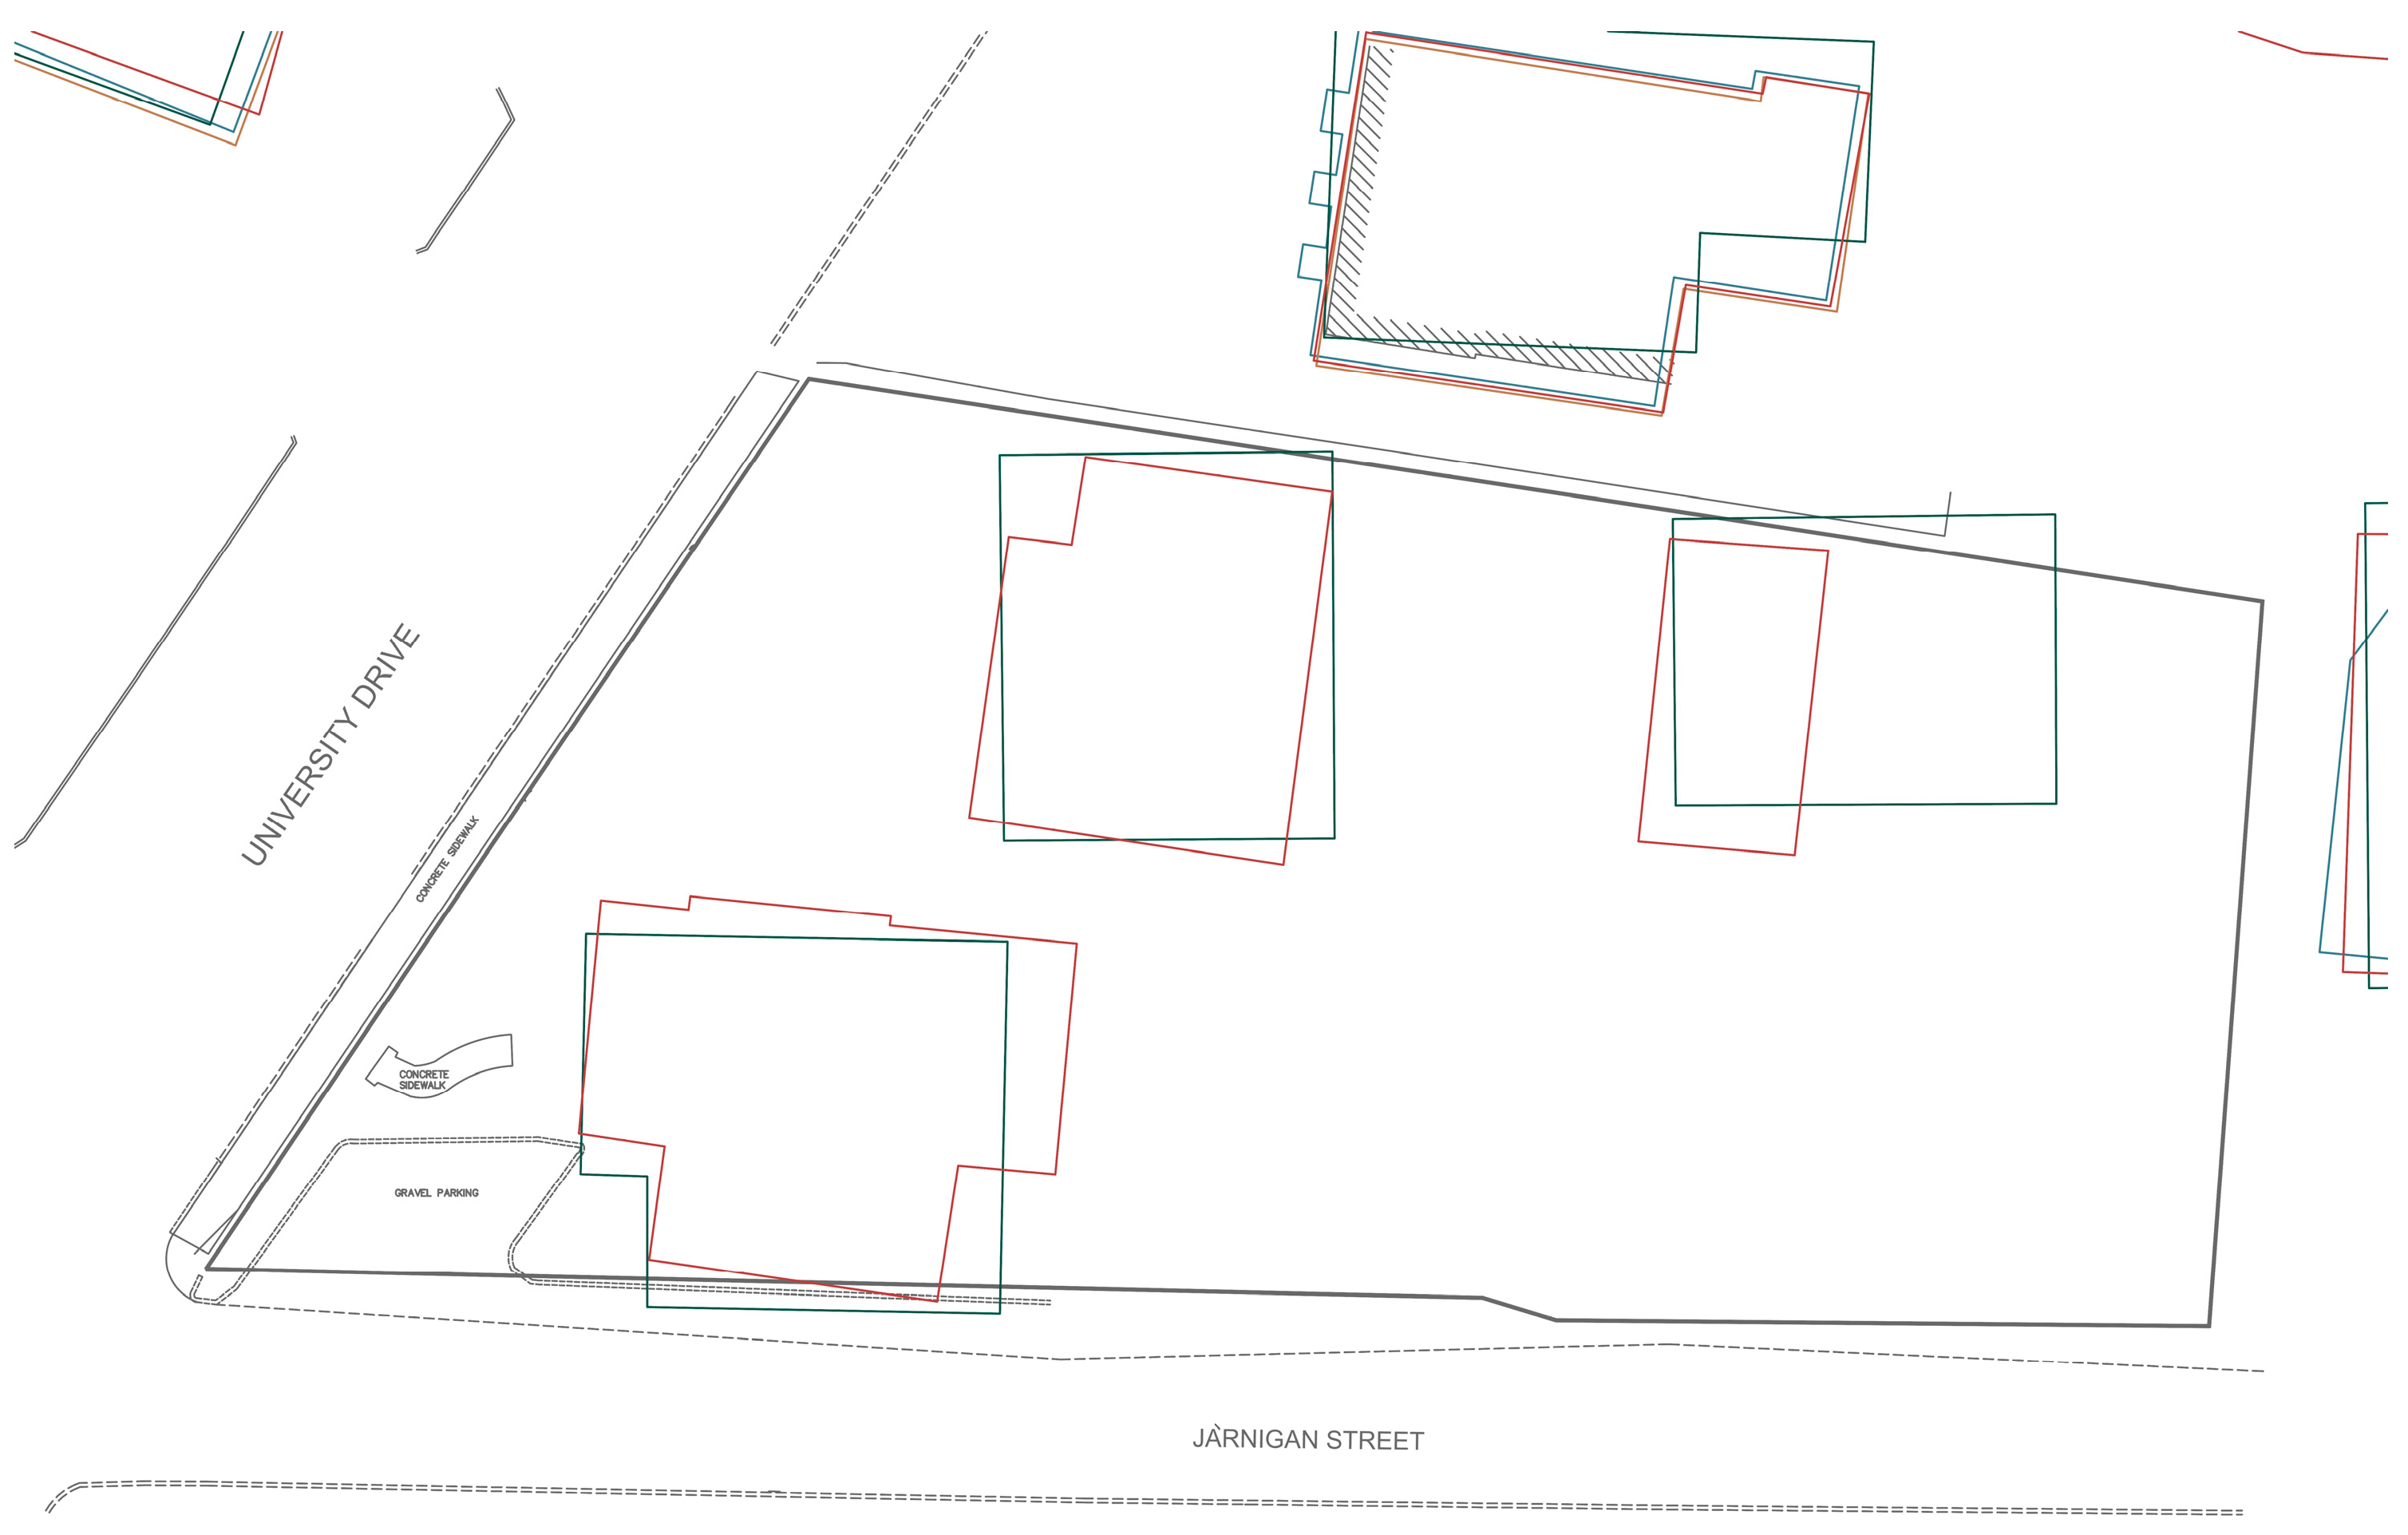
3.2.4. Buildings
Building information is a critical aspect of understanding a site, and as such, was a major focus of this study. The comparison used a combination of aerial imagery, 3D models, and dataset information available, see Figure 7.
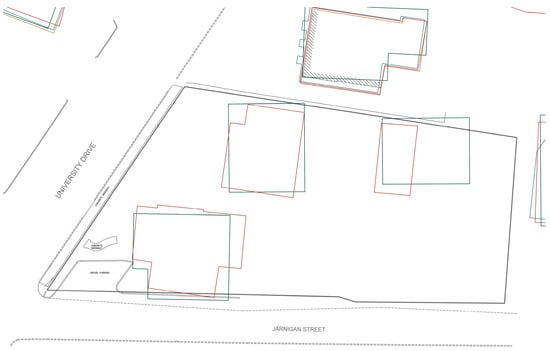
Figure 7.
Building Accuracy. Google Earth—Red; GIS—Green; Online Vendor—Tan; UAV—Blue and Professional Survery—Black.
Overall, the most accurate to the current conditions is the data from the UAV; however, it is less precise about the building location than the GIS data, see Table 3. Which is more accurate but not up to date with the current construction work happening on the site. The least accurate is Google Earth, with Nearmap in the middle.
Table 3.
Building Accuracy.
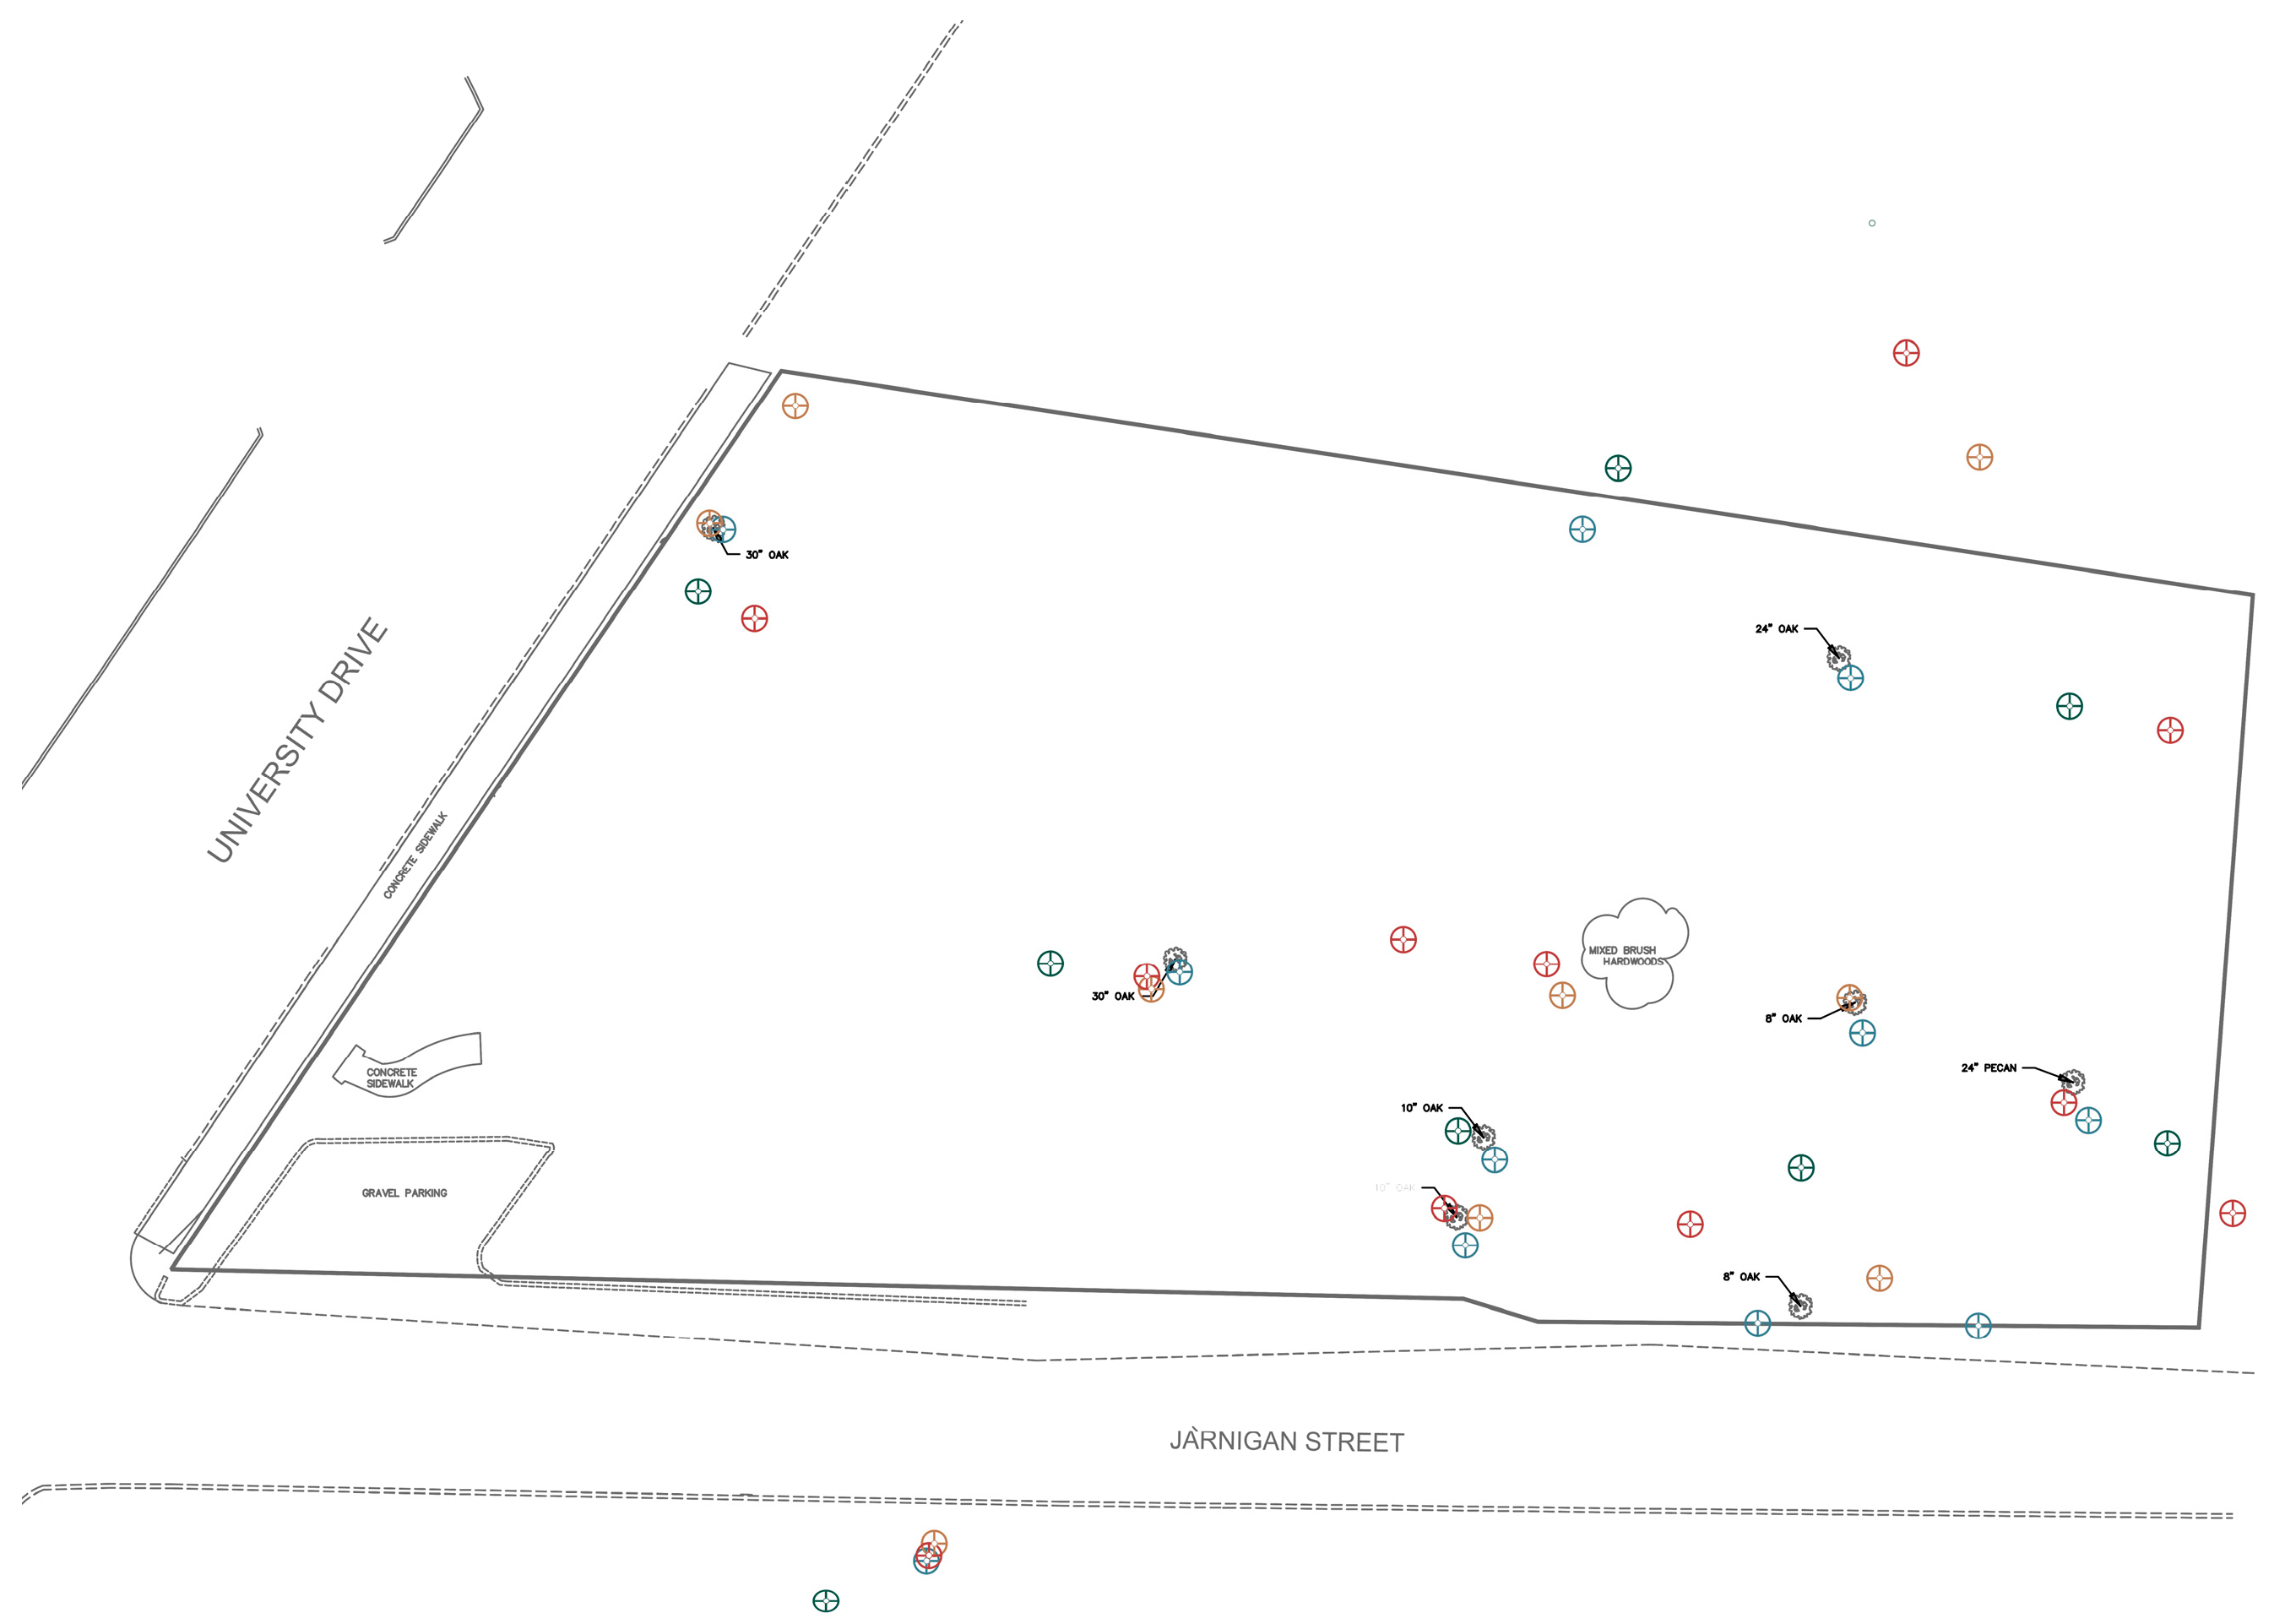
3.2.5. Vegetation
Vegetation data on the site is largely the location of tree trunks, with a lack of shrubs and lower ground cover, see Figure 8. This data were also based largely on the aerial, with some reliance on the 3D models where applicable. The survey identifies 8 trees and one area of hardwood brush.
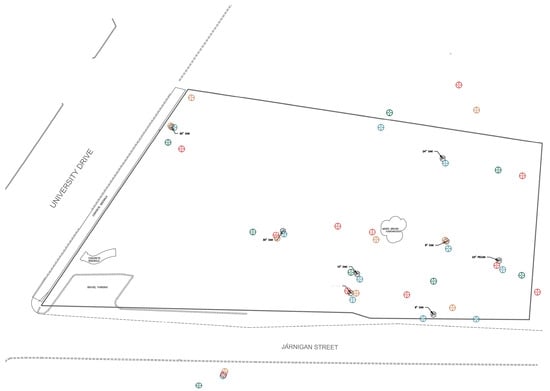
Figure 8.
Vegetation Accuracy. Google Earth—Red; GIS—Green; Online Vendor—Tan; UAV—Blue and Professional Survery—Black.
Each of these methods of collecting vegetation data are specific to the time and the season when the imagery of the data are collected to determine the accuracy. One of the reasons that the UAV data were more precise than the other was that it was collected in the winter, allowing for a better observation of the trunks of the trees than the data collected in summer, see Table 4. Different sites would vary depending on the time of the data collection.
Table 4.
Vegetation Accuracy.
3.3. Aerial and 3D Model Comparison
The second case study analysis method that was used was cross-resource comparison. For this, each artifact was compared laterally between resources to understand the differences between them more effectively. This comparison focused on the aerial imagery and the 3D model captured using each resource. Here, the understanding was made that GIS only serves to analyze other types of data, and therefore, the lateral comparison focuses only on three of the resources: Google Earth, Online Vendors, and UAVs.
The first artifact that was compared was aerial imagery. Here, the images were compared based on several criteria, including pixel resolution, date of capture, visual clarity, and usefulness, see Figure 9.
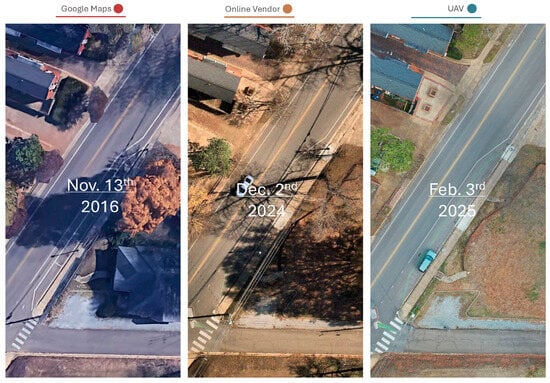
Figure 9.
Aerial Imagery Comparison.
Using the standard metric for calculating accuracy of aerial imagery in centimeters/pixel, the resolution of each aerial was compared. cm/px is the standard metric for assessing the GSD (ground sampling distance) and, as such, was used throughout. Google Earth had a resolution of 50 cm/px. Nearmap’s resolution was 5.2 cm/px, while the UAV had a resolution of 2.7 cm/px. Here, the UAV clearly stands out as the highest-resolution imagery as well as the most up-to-date. This leads to an increase in visual clarity and precision.
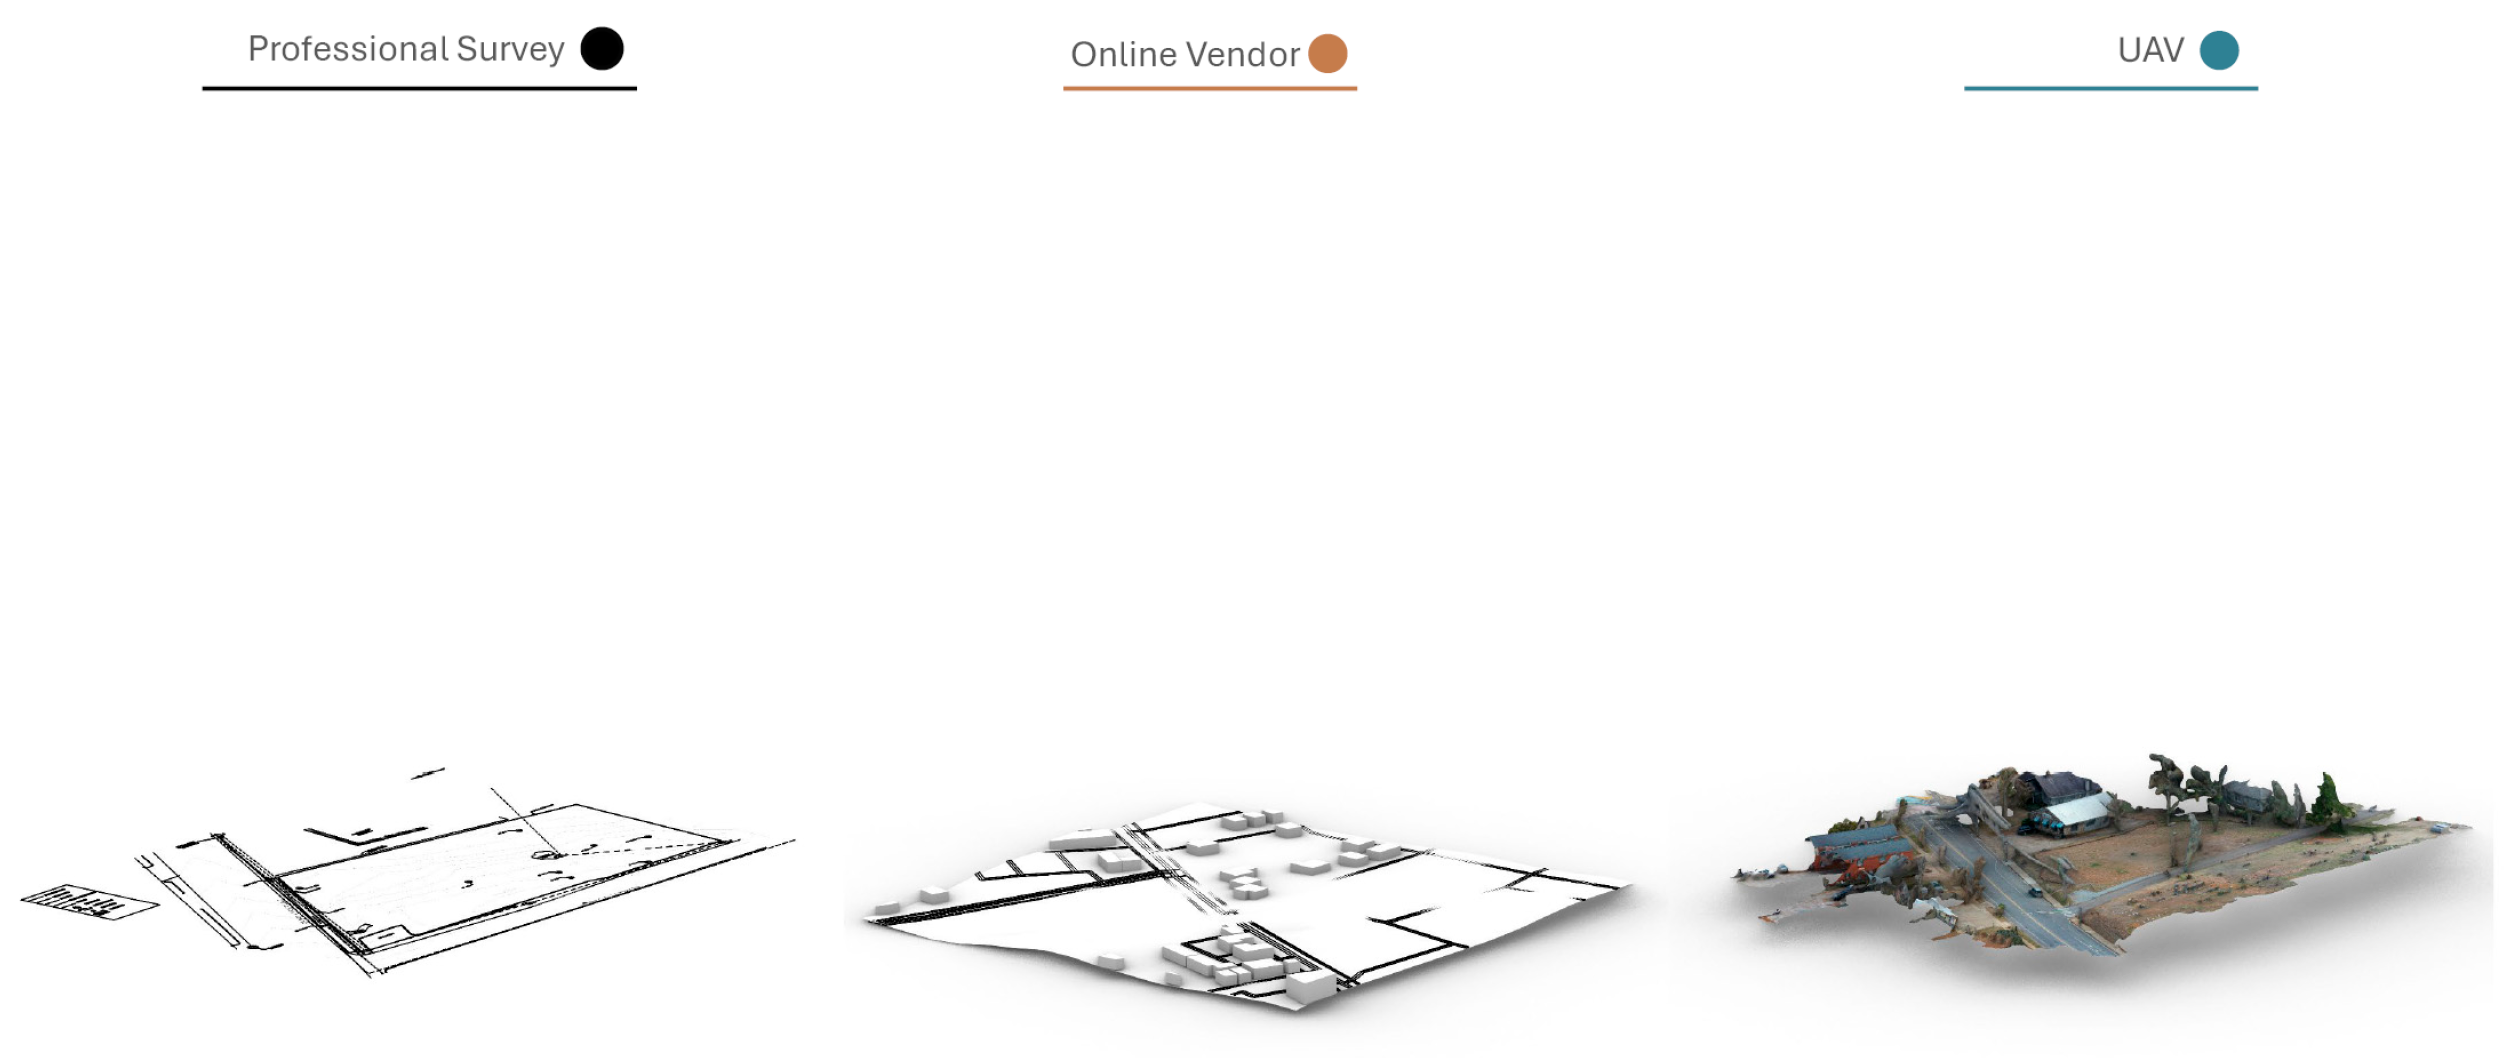
The second artifact that was laterally compared was the 3D model, see Figure 10. Three model artifacts were collected during this study. Online vendor Topoexport creates a model of the site for free, in addition to offering more features for a price. The UAV-generated model of the site using Pix4D photogrammetry software includes material information. The 3D model is included in the professional survey.
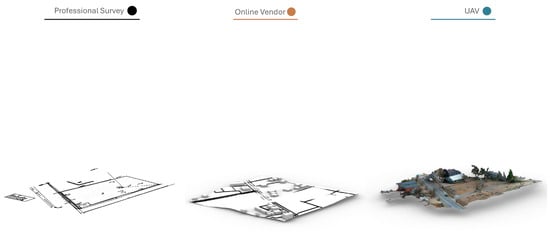
Figure 10.
Three-Dimensional Models by Resource.
The model provided in the professional survey consists of 2D vector lines with vertical measurements included on the contours. This results in a clean and precise CAD line model that accurately reflects existing conditions but does not generate surfaces or mesh geometry. As such, to develop a conceptual or representational model for use in design workflows, this data must be used as a base to build off of.
The Topoexport model differs in that it includes surface and solid geometry, but its overall quality is significantly lower. The generalized topography, absence of material data, and omission of vertical features such as vegetation limit its usefulness for detailed landscape analysis.
The UAV-generated model, built through photogrammetry, compiles a series of overlapping images to produce a detailed 3D artifact. This includes both surface textures and the spatial location of above-ground features, offering a comprehensive understanding of the site. For this study, the UAV model successfully captured the insurance building, site steps, and cemetery slope, and the mesh topography closely aligns with the contour lines from the professional survey. This produces a rich and accurate 3D model for manipulation in design software.
Photogrammetry workflows, however, come with known limitations. As discussed in the literature, they often misread dense groundcovers as topographic variation, and the triangulation method can lead to awkward first-person navigation. These issues are highly dependent on UAV settings and site-specific conditions but can be mitigated through strategic data collection.
3.4. Overall Comparison
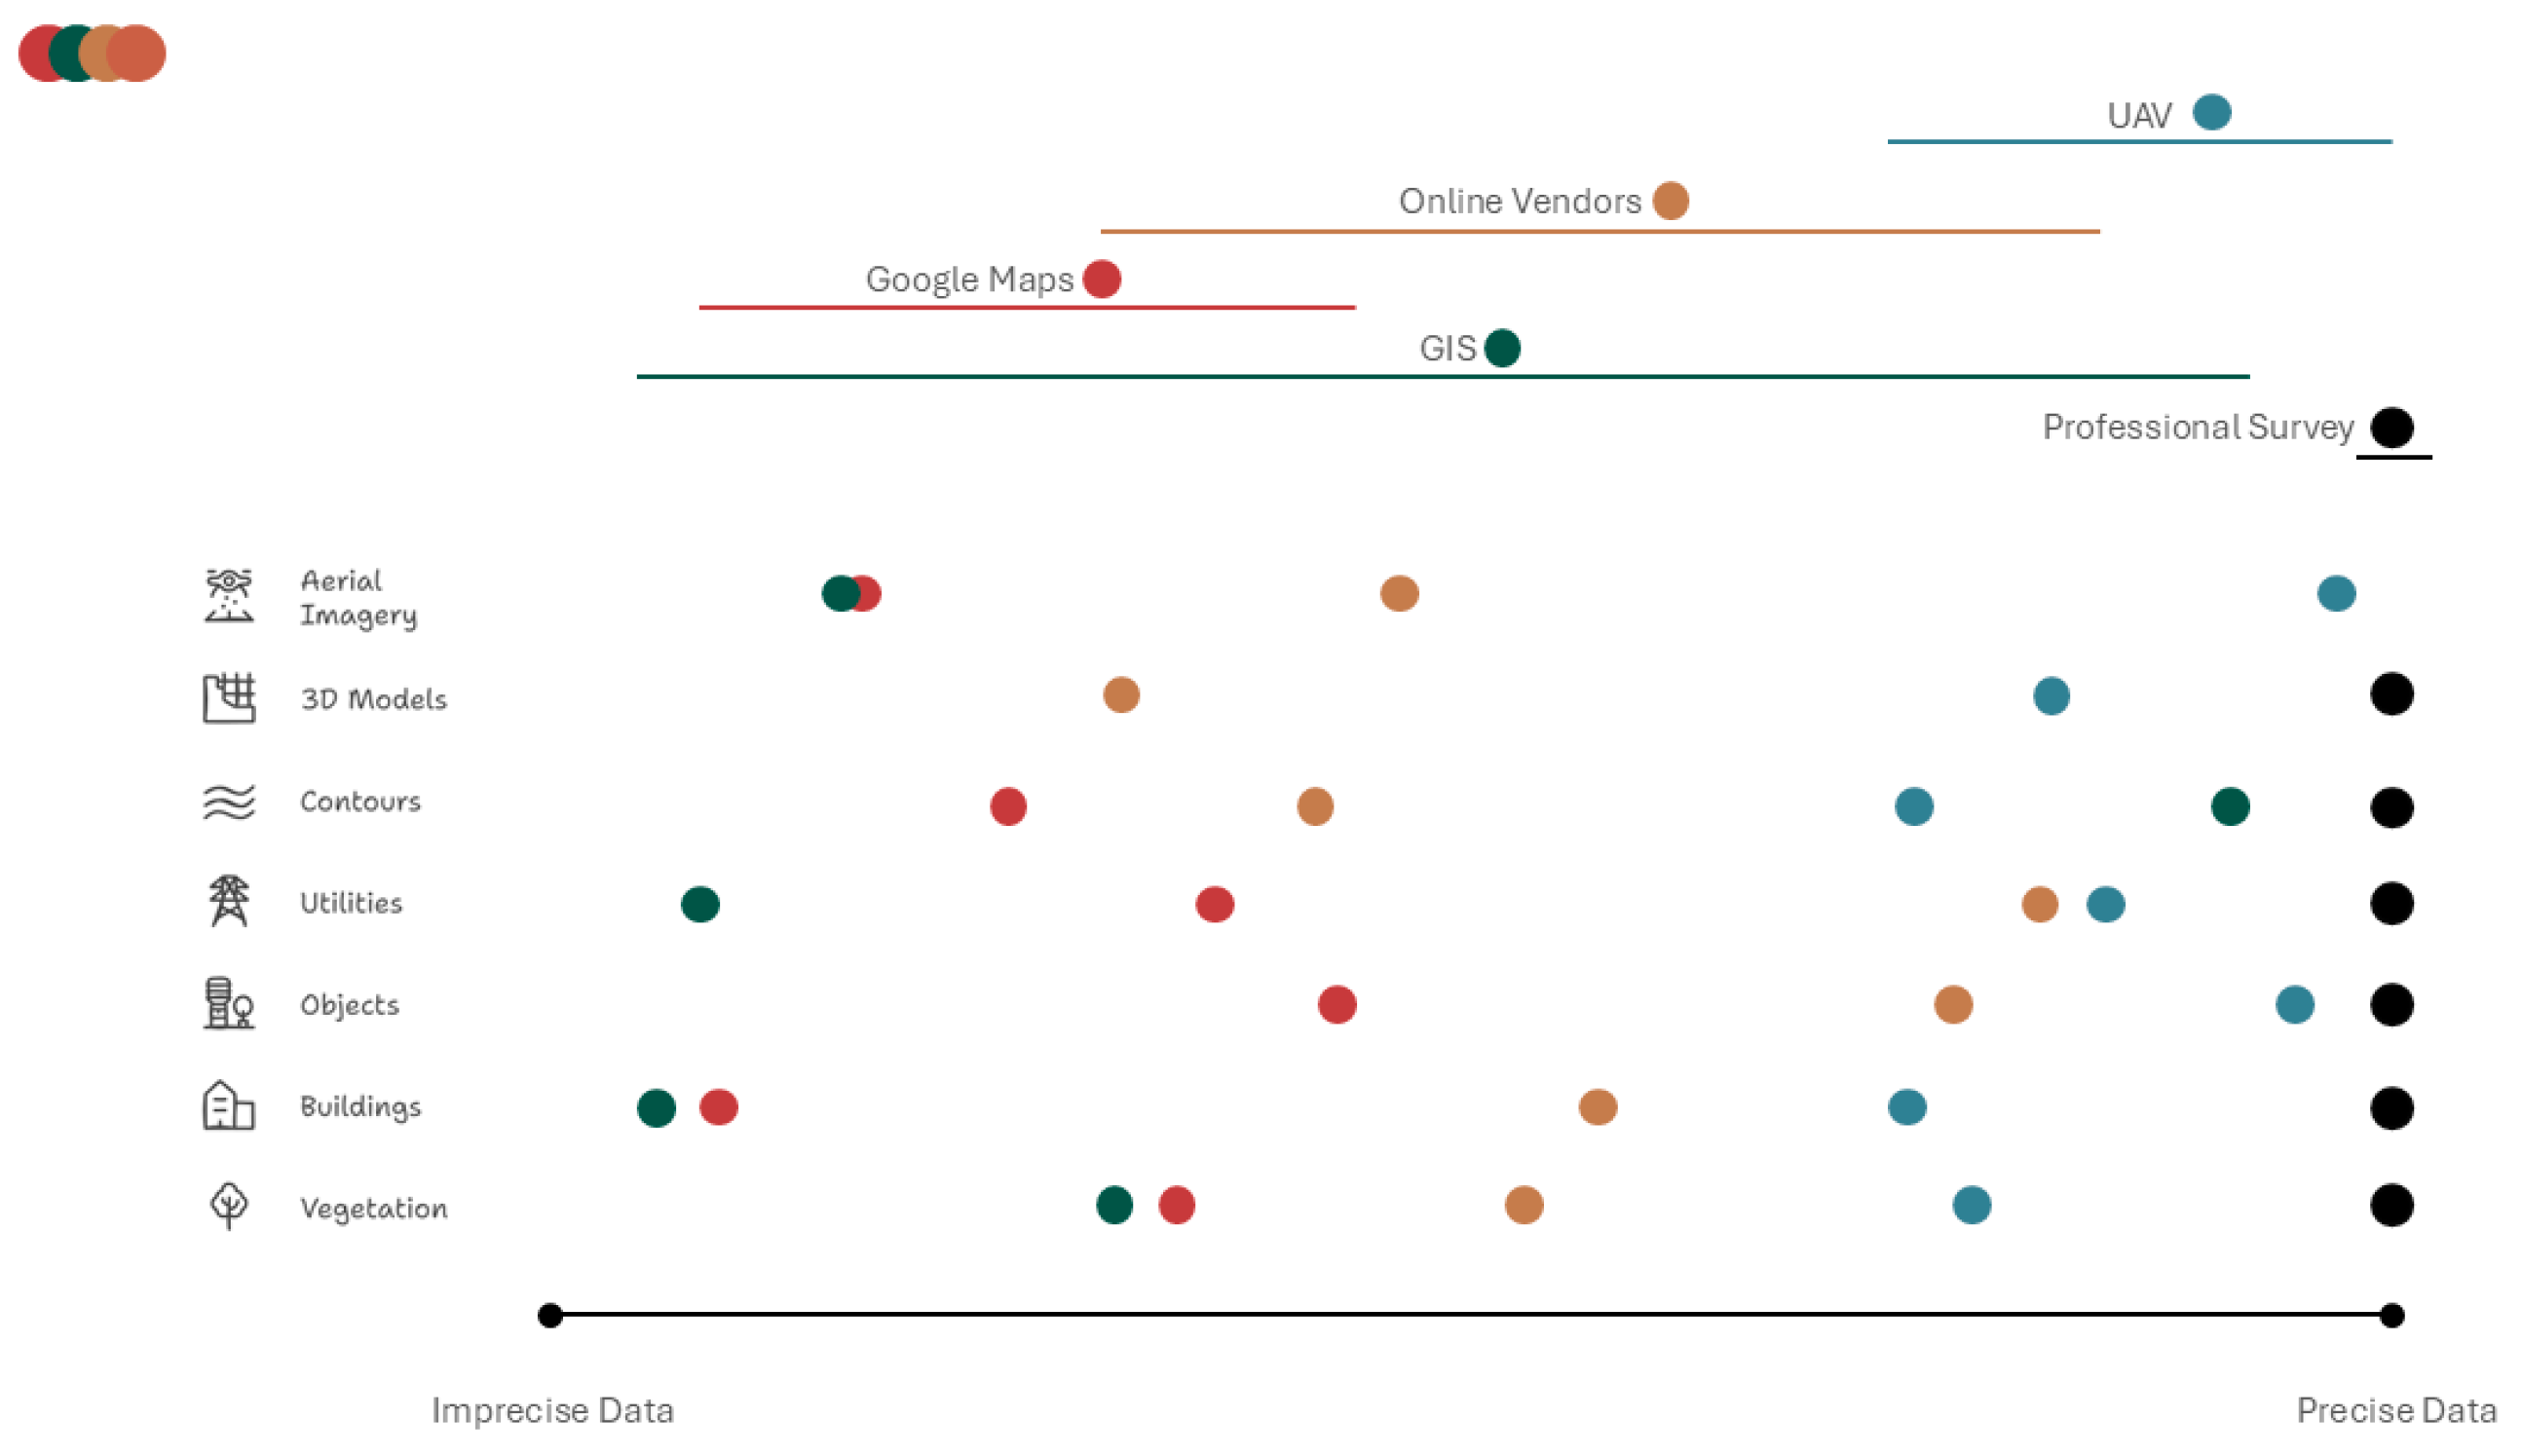
Taking these comparisons into account and analyzing them for overall accuracy creates a better understanding of the strengths and weaknesses of each tool. Figure 11 shows the overall placements of each resource in relation to the professional survey as well as laterally to each other resource. The results for this study show that there is a clear progression from less to more precise resources as you move across the top from left to right.
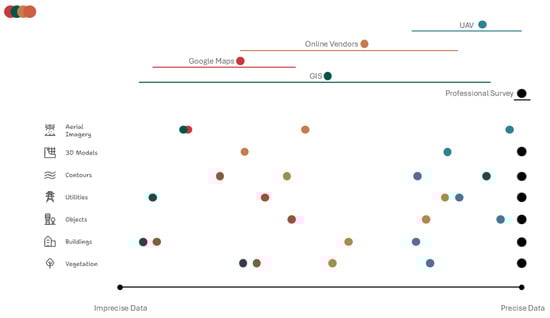
Figure 11.
Plot of accuracy by resource and artifacts.
In Figure 11, we can see the range of precision of each resource used in this study. Holding the professional survey constant as the most precise form of measurement, we can understand where the others fall along this scale. GIS is the most diverse resource for site analysis. When there is information about a site available, GIS can be the most accurate tool. When there is no available data about the site, the precision is very low or non-existent. For this study, GIS was both the most precise information for section data and the least precise information for above-ground utilities.
Google Earth and Maps are overall the least precise resources for gathering data about the site. From the low resolution of the aerial imagery to having the oldest date of collection, it was routinely inaccurate and inconsistent with site conditions. In every category of comparison, Google Earth was less precise than another resource and far enough off from the professional survey to require significant changes.
Online vendors also offered a decent range of precision, with Nearmap offering high-quality aerial imagery and accompanying it. However, Topoexport was not nearly as accurate or precise when it came to the 3D model of the data that came from it. Overall, the information depended on the specific vendor used and the price they charged for the data and artifacts.
The UAV was consistently the most precise referenced against the professional survey. Artifacts and data collected by UAV were consistently either the most or the second most precise information analyzed in this study. The aerial information is the most accurate artifact available, considering that the professional survey did not provide one. Objects were also located with as much accuracy as the professional survey and included some debris on-site that the survey left out. UAV was clearly the most accurate and precise resource overall included in this study.
3.5. Barriers of Site Analysis Resources
Several barriers need to be addressed when discussing the usefulness of each resource for site analysis. These barriers are contributing factors to the results. They shape access to these resources, and moreover, they shape the quality of data. Three main barriers will be addressed here: Cost, Time, and Knowledge.
3.5.1. Cost
The price of each resource is a determining factor when deciding which resource to use for site analysis. The most preferred price is no price at all. Two resources fall into this category, see Table 5. Google Earth is a free-to-use resource. There is no purchase or subscription needed to gather the data that I gathered in this study. This makes it one of the most accessible resources that exists for site analysis and understanding. GIS is a collection of data, and different tools exist for working with that data. This study used QGIS. QGIS is a free and open-source program available on Windows, Mac, and Linux. The data collected in this study were also free, gathered primarily from MARIS, with some data gathered from USGS repositories. This allowed the GIS analysis of this study to be conducted without cost.
Table 5.
Resource Barrier—Cost.
The next range is that of the low- to high-cost resources. These are the online vendors, ArcGIS Pro, and UAV. Online vendors vary in cost depending on the type and amount of data you capture; most offer a free trial or a free option for a certain amount of data. To use online vendors in the long term, though, a pay-per-use or subscription model is needed. This study used Nearmap for imagery and Topoexport for the 3D model data. Nearmap is a subscription model that ranges from $1500 to $212,000 annually, depending on the services desired. Topoexport offers free downloads under 50 km2. Beyond that, the price increases on a subscription plan of either $39 or $99 a month, per user. ArcGIS Pro 3.4—the paid professional GIS software—operates on a subscription model. There are different tiers available, but the price ranges from $700/yr to $4200/yr.
The UAV is a DJI Mavic 2 Pro, which cost $1449 at the time of purchase. Currently, as of April 21, 20, 25, this model is no longer available for purchase in the United States. The software that was used to post-process the imagery is Pix4Dmapper, which is a subscription model costing $291/month.
3.5.2. Time
The second barrier to each resource is the time it takes to gather the data and artifacts from it, see Table 6. This is an important step in evaluating the usefulness of each one. Google Earth is the fastest, with immediate access to artifacts through a website or downloadable program. This places it as the most accessible resource of those tested. Online vendors offer a close second place, with most offering immediate access once an account has been set up. This first step adds some time to the front end, but once established, it offers no more friction than Google Earth. For some features, such as the 3D mode, a small processing time is required, but it takes no more than 5 min.
Table 6.
Resource Barrier—Time.
GIS is in the middle range, depending on the type of data being collected and the location of the site. The tools—QGIS and ArcGIS Pro—are programs that require download; with ArcGIS Pro requiring an active subscription account. The time taken to collect the data varies, but it often takes somewhere in the range of 30 min to a few hours once the programs are installed. This accounts for searching and downloading shapefiles from online databases.
UAV is the most time-consuming resource for site analysis. Not only does it require traveling to the site and flying the programmed route, but the images must be processed in post. This can take a couple of hours of automated running time on a dedicated machine. Due to this, the total time it takes to use a UAV is highly variable on a case-by-case basis. The flight for this study took 3 min to conduct. The processing time took 31 min of generation and 2 h of stitching. This makes the UAV the slowest and most time-consuming resource for site analysis.
3.5.3. Knowledge
The knowledge required to use each of the resources studied also acts as a barrier to their adoption, see Table 7. Google Earth and online vendors offer the easiest interfaces in an attempt to be more user-friendly. These resources are intuitive and web-hosted with helpful descriptions and tutorial walkthroughs on the site. This streamlines the knowledge requirements for these resources and places them as the most user-friendly. Requirements for using them include internet access and the ability to find a print button.
Table 7.
Resource Barrier—Knowledge.
GIS is much more involved and requires more knowledge to use. Different applications for GIS software range in requirements from medium difficulty to more difficulty, depending on the analysis you are conducting. For this study, a more advanced knowledge of QGIS was required to gather the topographical information and the sectional data.
UAV knowledge requirements are the most demanding of the resources used in this study. There are more advanced software requirements for Pix4Dmapper and Pix4DCapture, but moreover, software used to analyze the output requires a higher knowledge base. Additionally, and most importantly, the UAV requires a Remote Pilot license issued by the FAA for commercial use. This requires passing a written test covering information from weather to section charts. FAA requirements for Remote Pilots are rigorous to maintain the safety of all individuals by ensuring safe operating conditions for all flights. Because of this, there is a very high knowledge base required for UAVs.
3.5.4. Overall
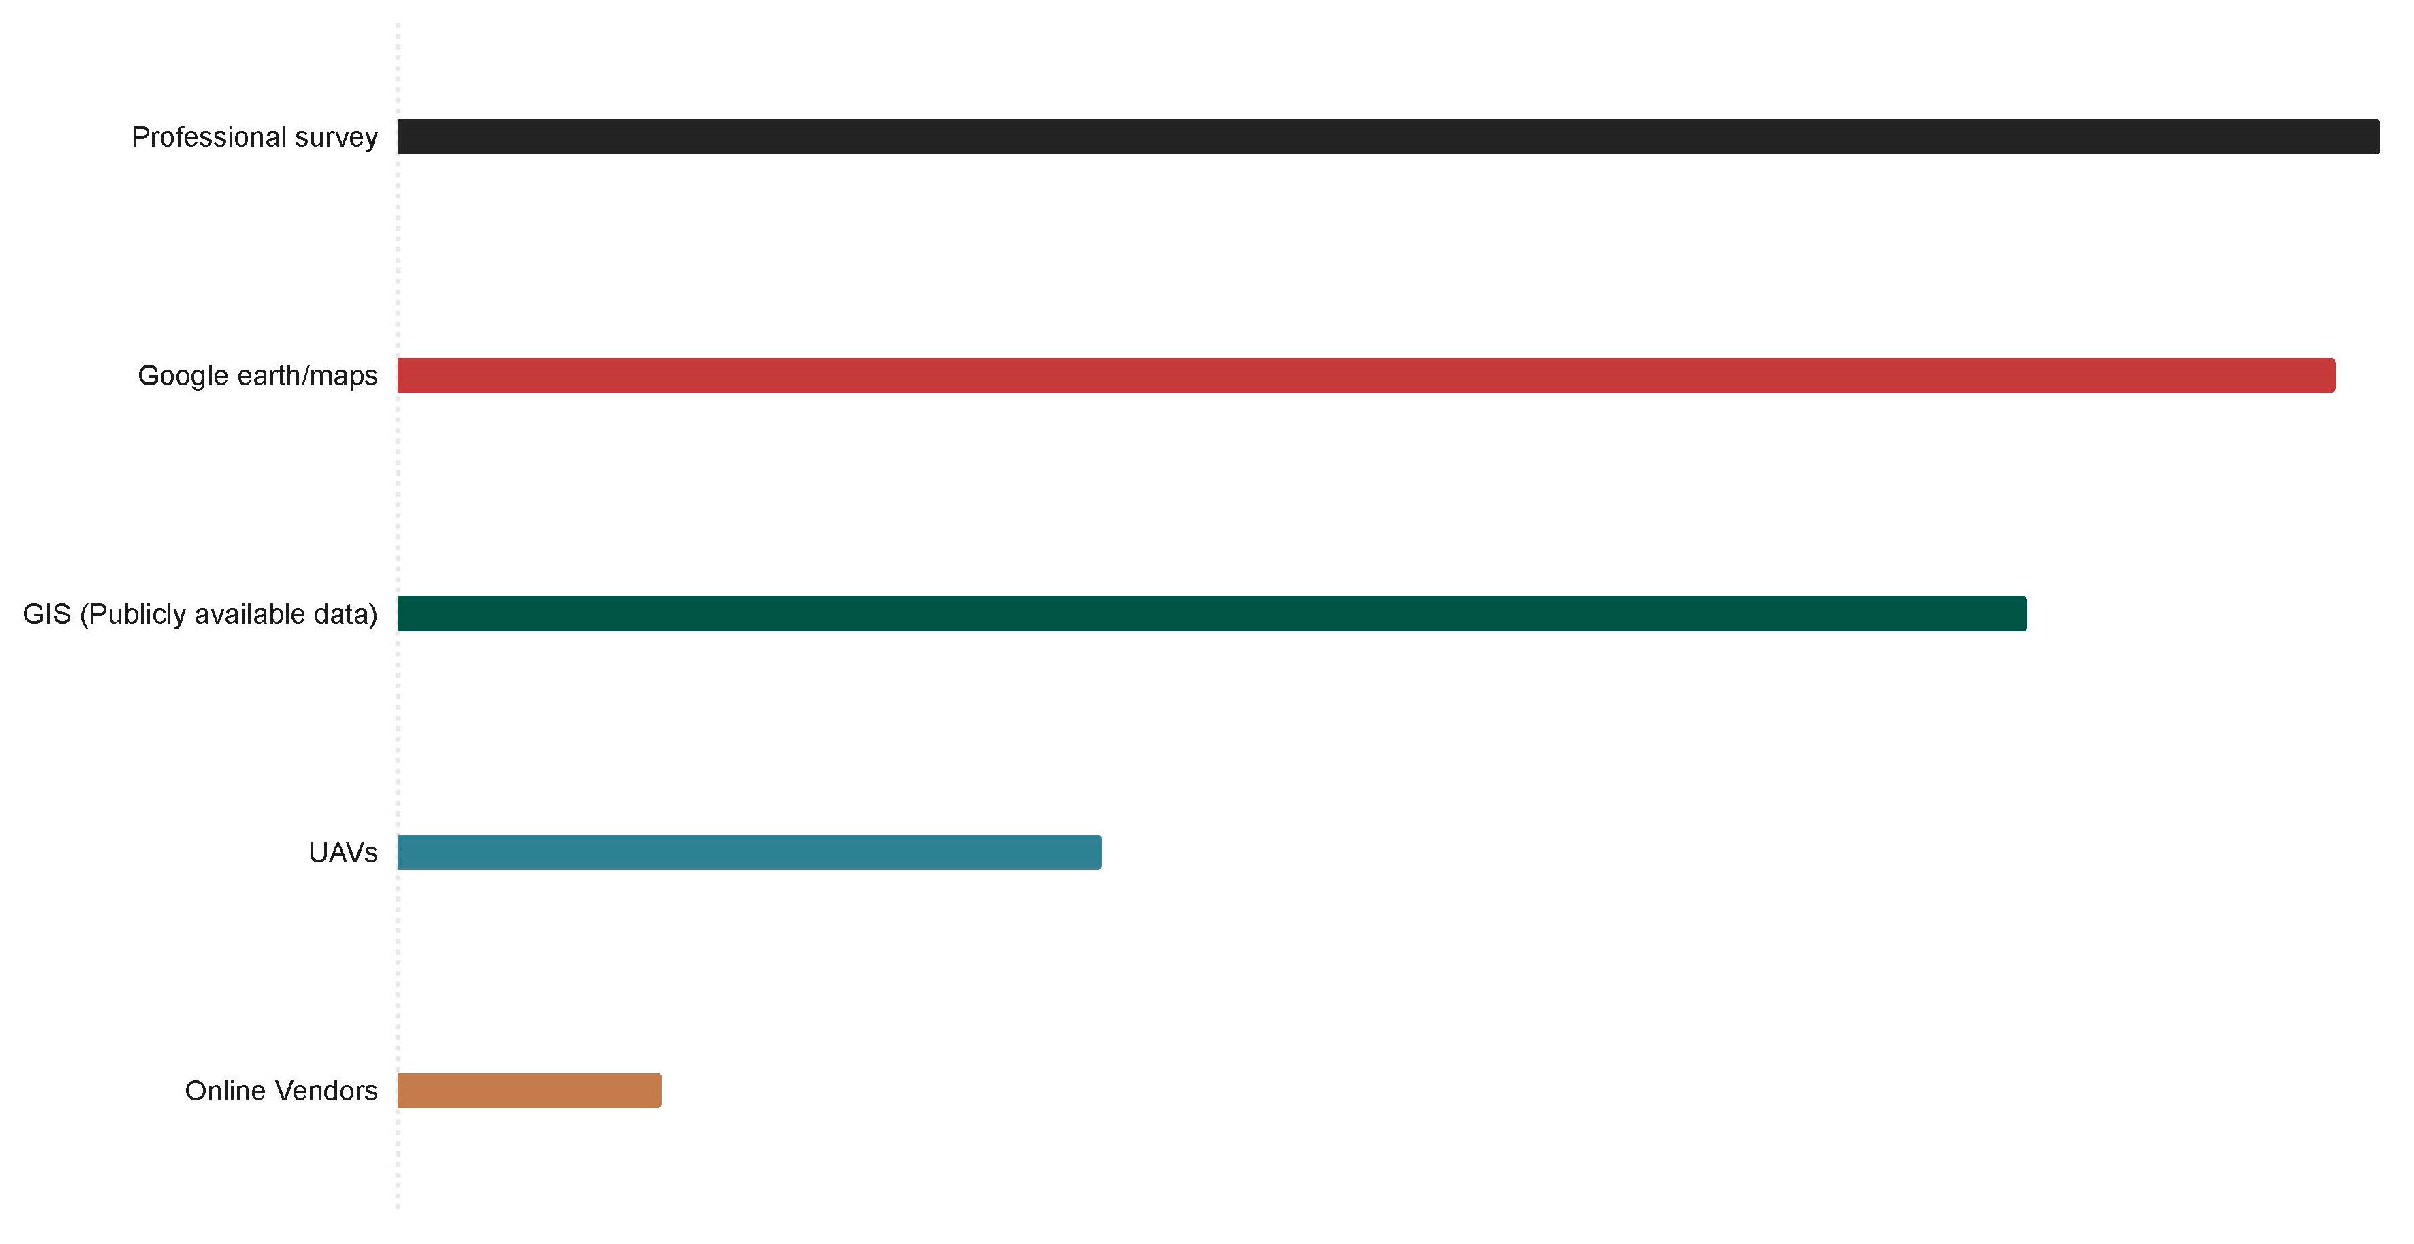
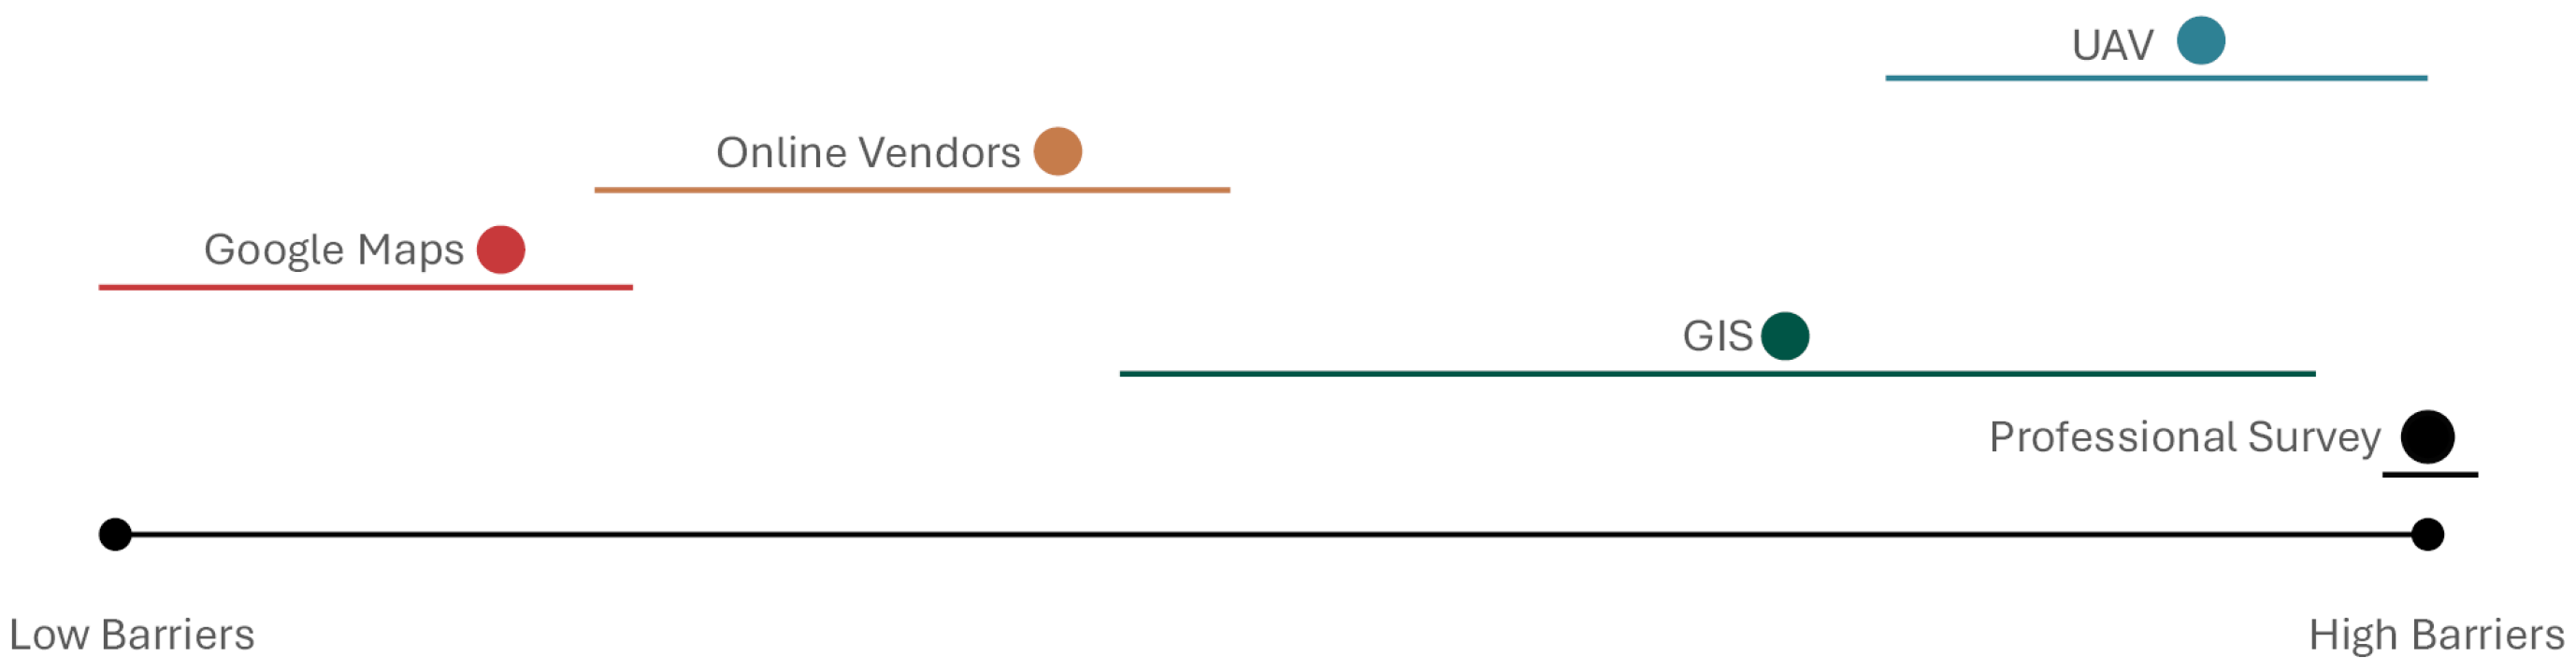
Figure 12 shows the overall combined barrier ranges for each resource analyzed in this study. Google Earth is the easiest resource to pick up and use at no cost, with minimal time, and with next to no special knowledge requirements. Online vendors fall slightly above this with varying but typically low costs, minimal time requirements, and low special knowledge. GIS is the broadest range, depending on the type of analysis used. Depending on the tool used, cost is either none or high, time is more involved and takes longer, and the knowledge requirement is decently high. UAV has the most barriers with a decently high entry cost, a large time commitment, and requires passing a special knowledge test proctored by the government.

Figure 12.
Barrier Bars.
4. Discussion
4.1. Intro
Based on the information gathered in the previous section, several key insights are revealed. No single resource offers every benefit without cost. UAVs are the most accurate and precise, while at the same time costing the most and requiring the most specialized knowledge. Google Earth is the most accessible, free, and easy-to-use, but it offers low accuracy and imprecise data. Each resource offers distinct advantages over the others, but none provides all of the best results. As the results indicate, UAVs do offer advantages to small landscape architectural firms, denying the null hypothesis.
Attempting to rank these resources can be unhelpful, as it fails to account for specialization. However, it is important to understand the relative advantages and disadvantages for more targeted applications. The most appropriate course of action is to look at the whole range of analysis and decide what best fits each specific circumstance. Choosing a tool or a resource always involves cost-value analysis. There are value attributes for each resource as well as costs. This aligns with the literature: each resource has strengths and weaknesses.
4.2. Multi-Resource Workflow
Alsamarraie et al. [17] and Kullmann [26] stress the need for overlapping and complementary tools to capture both qualitative and quantitative aspects of site analysis. This supports the layered, multi-scalar workflows outlined by Alsamarraie et al. [17], who emphasize the integration of UAV data into broader design practice.
Unified site analysis workflows better incorporate the strengths and weaknesses of each resource, covering gaps and improving site understanding. Each resource offers unique advantages that enhance data collection when used in tandem. This also aligns with the best practices laid out in the literature by duplicating information and layering and incorporating systems thinking into the process of inventory. In the same way that building a house requires more than just a hammer, analyzing a site requires more than just Google Earth. The advantages of incorporating multi-resources can be seen when comparing the best results in each category of analysis. The most precise data are captured for each category of artifact or data.
4.3. Initial Research and Site Analysis
Projects progress from less precise to more precise; as this process takes place, the tool best suited for the project changes. This reflects the literature discussed earlier. At the beginning of a project, a professional survey is disproportionate to the level of precision and accuracy needed, working to slow the process down in the details at a stage where moving fast and visioning is more appropriate, not to mention the high cost associated with the survey. Here, Google Earth is the best tool for the job. The level of access and time required make it the ideal tool for the first stages of understanding a site. Information such as the location of the site in a broader context, overall vegetation coverage, and road access can be understood at a glance. In less than five minutes, a basic understanding of the site is acquired without needing to travel to it.
This underscores the importance of choosing tools by phase, as mentioned in LaGro [30] and Çelik [31]. This mirrors LaGro’s [30] design process model, where early-phase tools prioritize accessibility and broad pattern recognition over technical precision. Çelik [31] also highlights the importance of using intuitive tools early in design to support ideation before technical documentation begins.
Most projects benefit from the use of Google Earth as the first tool used in understanding the site. All its advantages come into play while its disadvantages are mitigated. The low barriers of Google Earth allow for a solid understanding without overinvestment on the front end. Lack of precision and accuracy in the existing conditions can be rectified at a later stage without causing problems with the progression of the project. As the project moves from infancy to maturity, understanding likewise progresses in accuracy. Google Earth analysis sets the stage for further understanding. Site conditions are observed and marked for further inquiry later. Next steps are conducted in one of two ways: comprehensive remote analysis or refinement of site conditions.
Comprehensive remote analysis is best conducted in GIS. The ability to gather regional information and ecological conditions while requiring only medium time and knowledge positions GIS as the best tool to progress understanding in this way. GIS allows for an in-depth regional analysis that pairs well with the basic understanding of Google Earth to help flesh out the site analysis. Layering of information creates better base information and more thorough cross-referencing. It does so while pushing the project forward in both accuracy and precision, requiring more extensive knowledge and a greater time commitment.
Refinement of site conditions is best accomplished by an on-site visit. This visit allows for the reference of features and data available on Google Earth with accurate existing conditions. All the while helping refine and discover discrepancies in remote information. The best resource to pair with a site visit is easily the UAV. This tool allows for the recording of accurate, timely, and highly precise existing conditions. Not only for on-site referencing with previous data, but also for future work as the project requirements progress.
UAVs bridge the gap between professional surveys and Google Earth, reducing discrepancies and increasing understanding. This is critical as a project moves from initial conceptual phases to schematic design and design development phases. The accuracy of the data provided by UAVs minimizes the adjustments that are required in changing a design from a Google Earth-driven concept to a real-world proposal. This saves valuable time and resources for both the client and the firm, more than making up for the cost of the UAV at this stage of the project.
This structure both aligns and departs from the literature. While comprehensive remote analysis and professional survey-grade applications for UAVs and GIS fit in with the findings in the literature, Google Earth as an early-stage research tool departs. Google Earth is not seen as a noteworthy resource in most literature due to the errors and lack of precision; however, this study suggests otherwise.
4.4. Conceptual Design
Once a site has been researched and analyzed, the design can start to come together. As noted in the literature, having the accurate artifacts created by the UAV is invaluable. They provide detailed bases to start layering on with a precision close to the professional survey, minimizing late-stage change orders or realignments. This facilitates the design process with a greater degree of speed and confidence, knowing that as the project progresses, there will be fewer setbacks.
Additionally, the detailed base information allows projects to be pushed farther, quicker. Levels of refinement and feasibility that would traditionally take weeks can now be incorporated directly into the design process from the beginning. Exercises like area calculations, material takeoffs, texture analysis, and other vital spatial processes all benefit. This enhances workflow efficiency and design consistency.
The design process is heavily dependent on understanding scale. Sizing, proportioning, and locating are all substantially impacted by scale. This leads many designers to own engineering scales and pens and pencils of different weights; this increases perception and competency in handling the site. However, with the infinite canvas that most CAD software uses and the real-world measurements of UAV data, maintaining scale understanding is also enhanced.
Using the detailed base information gathered from Google Earth, GIS, and UAVs significantly shortens the modeling and drawing time of a project. This allows landscape architects to spend more time and effort focusing on the actual design rather than the back-end production. Clients benefit from enhanced designs, lower costs, and more accurate representations when multi-resource workflows are employed in the design phase. This study extends the discussion of UAV incorporation into design and construction workflows by demonstrating their precision and efficiency.
These results align with Puliti et al. [20] and Matese et al. [18], who found that UAV-derived photogrammetry greatly expedites the generation of accurate, real-world design bases.
4.5. Construction Documentation
For projects that progress to bidding or construction, a professional survey must be conducted. This is due to the accuracy of the data as well as the professional stamp. Professional surveys provide the legal responsibility and liability required for construction permitting. As such, design projects must base their measurements on the professional survey for precision. This is true for all construction documents.
Even so, throughout the project, the artifacts and data gathered in the beginning continue to improve and inform the design. GIS analysis continues to enhance understanding of off-site conditions, leading to more impactful design decisions. UAV images inform decisions with critical site information, reducing costly time sinks. Those images and artifacts also continue to inform graphical representations of the project, like renders, making it more attractive to clients and the general public.
4.6. Precision vs. Usefulness
It is also necessary to talk not just about the quantitative precision as compared to the professional survey, but also about the usefulness of each resource to the designer. Here, we must consider slightly different categories of comparison. While the professional survey offers the most accurate measurements of the site, it fails to include an aerial image. This leaves it far less useful to the designer than Google Earth for laying out a plan. There is minimal to no information on the ground cover, the shade paths, the way water runs, or the view sheds. The professional survey also fails to provide any information beyond the boundaries of the site. Ecosystems hardly ever operate at the scale of a single site, as noted abundantly in the literature, leaving a professional survey incomplete without observing the bigger picture.
This type of information is critical to designers and positions many of the resources of this study as more beneficial for landscape architects than the professional survey. Design relies heavily on the visual aspects of analysis, and as such, any of the resources that provide visual information, as well as site data, make themselves more valuable. Google Earth street view and on-site visits are significantly more informative to a landscape architect than CAD, regardless of the accuracy. This is demonstrated through the survey; Google Earth received the most responses.
UAVs fit naturally into this category. With an emphasis on location and imagery, UAVs naturally lend themselves to usefulness in landscape architectural site analysis. While some forms of data and information about a site struggle to give a comprehensive understanding, pictures and images of the site continue to offer a wealth of information both during the initial collection as well as afterwards. UAVs operate by taking a series of aerial images and using them in several ways to create additional artifacts. Because of this, however, the very method used to capture UAV data makes them incredibly valuable.
The final artifacts that are created by the UAV contain image material mapping. This increases its usefulness by itself; however, the original photographs are also available for reference. This means that a proper UAV site analysis provides accurate and information-rich final artifacts and, additionally, a comprehensive series of images covering the entire site. These two sets of visual information are critical for designers and analysts. This extends Kullmann’s [28] argument that ‘useful’ design data are not always the most precise but the most revealing of environmental relationships.
4.7. Bird’s-Eye Perspective
UAVs offer a unique perspective of the landscape. As seen in the literature, this perspective is between that of the satellite and the human. This unique perspective shifts the phenomenological experience of a site in ways that we are not used to. Historically, the way to gain an elevated view was to climb a tree or use a balloon. The desire to gain height and see out is ingrained in us and should not be ignored. UAVs offer a way to gain this perspective.
4.8. Tools Used vs. Best Tool
Another major topic of discussion indicated in this research is workflow alignment. This thesis studies the technical capabilities of these resources with a focus on current uses. How are practicing professionals currently utilizing and employing the resources included in this study? The survey questionnaire revealed current use patterns not only of resources in general but also of applications of those resources. The case study revealed the strengths and weaknesses of each resource. Cross-analysis of these datasets allows us to understand where improvements can be made immediately.
Google Earth is the most widely used resource, as indicated in the study. It is also the most consistently inaccurate. Respondents indicated that the major use of Google Earth was aerial imagery. The case study, however, revealed that the aerial imagery from Google Earth was the second most inaccurate and often might be the worst depending on the site. This indicates that most people are disproportionately using inaccurate resources. This discrepancy is concerning given the high reliance on Google Earth despite its low accuracy. It is the most used resource for understanding a site. Likewise, respondents indicated that building footprint data are a critical point of analysis for Google Earth, while the case study demonstrated that it is acutely inaccurate.
Meanwhile, the most accurate resource for aerial imagery—the UAV—is being used by less than 30% of respondents. This indicates a gap between what is accurate and what is used. This pattern holds for other categories of analysis. Out of the respondents who use GIS, the most important category indicated is utilities. In the case study, GIS is the least accurate resource for utility data. Consistently, this study demonstrates that the most accurate resource is not the most widely used. This reveals an opportunity for educators to focus on realigning this discrepancy while also addressing a gap in the literature between research and practice.
There are some categories where there is strong alignment. Contour data ranks second for GIS, and it is the most accurate resource. Likewise, out of the respondents who use Nearmap and UAVs, they indicated the aerial imagery as the most important artifact, which aligns with their strengths. This also holds in other categories of analysis for UAVs and GIS, with respondents valuing data that they can provide.
Overall, this study indicates that there is no strong relation between accuracy and use. Survey questionnaire responses have little relation to the accuracy of a resource at entry levels. When accounting for the level of specialized knowledge, however, there does seem to be some relation. Although more research is needed to confirm this. As the requirement for specialized knowledge increases, respondents’ use of accurate data and artifacts also increases. This seems to indicate that the more specialized knowledge a landscape architect acquires, the more likely they are to use resources that provide precise data.
This reveals a gap echoed by George and Park [27], who found that while students embraced UAV tools, professionals lagged due to cost, training, and institutional inertia. This mismatch is also noted by Kovanič et al. [8], who emphasize that photogrammetric workflows are underutilized despite clear benefits to scale, resolution, and cost when amortized.
There is a strong correlation between the barriers to a resource and its adoption. As the barriers increase, use decreases. This aligns with what one might expect on the subject. However, there seem to be some outliers to this. Online vendors, although they have low barriers, are not used as often as would be expected. Nearmap provides accurate artifacts and data while having low barriers, yet it is not used by many respondents. While Nearmap has low barriers, not many landscape architects are familiar with it. This suggests that both barriers and knowledge restrict the adoption of a resource.
4.9. Final Notes
This study finds that a multi-resource workflow is the best approach to site analysis. Doing so leverages the advantages of each resource while mitigating the disadvantages. Precision is necessary for the development of construction documents but not as important for design analysis. Not all valuable information can be documented quantitatively. A broader understanding of the strengths and weaknesses of site analysis resources should be worked towards. Landscape architects should understand the best tools for each task and apply them appropriately.
4.10. Limitations of the Study Methods
This study contains several limitations. Both the location and size of the site create limitations on the data that can be collected. This impacts the results of each resource. GIS suffers in this study, being in a rural area. Google Earth also suffers from less frequent image updates. These factors potentially weigh results in favor of the UAV and online vendors.
This study focuses on a single site for analysis. This creates challenges for creating a thorough comparison. With the focus of a single site, some resources might not demonstrate strengths or weaknesses that would show up with a larger study.
The methods used in this study provide limitations for the accuracy of the data. As the researcher, my understanding of the site improved throughout the process in ways I was unable to forget. This potential weighed the results for the resources that were studied last in the process, potentially artificially increasing their respective accuracy.
The artifacts used to gather data, specifically utility data, only allow for above-ground understanding. The professional survey provides information about underground utilities that none of the other resources can.
The UAV workflow used in this study does not have LiDAR capabilities. This limits the accuracy of the data captured and leaves a gap in the study. The use of photogrammetry alone fails to provide a full analysis of UAV abilities. Additionally, photogrammetry contains limitations dependent on the surfaces of objects studied, as noted in Alsamarraie [26].
Additionally, the sample size of the survey questionnaire was small (54), failing to provide a more reliable statistical analysis. This potentially shaped the results of the survey in ways that artificially inflated some responses.
5. Conclusions
How can UAVs improve site analysis workflows for small landscape architecture firms?
Small landscape architecture firms benefit from the adoption of UAVs into their workflows. UAVs enhance the accuracy and the speed of site analysis. Artifacts generated through UAV-enriched workflows provide improved base material for designs, elevated site understanding, and more targeted analysis. However, UAVs do not provide unhindered benefits. Implementing UAVs into workflows requires high upfront and recurring costs, dedicated machine processing time, and specialized knowledge.
Based on this information, a multi-resource workflow is best suited to incorporate UAVs. Doing so maximizes the strengths of each resource while mitigating or minimizing its weaknesses. Moving from low-barrier, general information to high-barrier, specific information mirrors the development of a project. Aligning these processes creates a greater impact while streamlining workflow efficiency. Progressing from Google Earth to GIS to UAVs creates a strong framework for site analysis.
UAVs also fit seamlessly into the experiential and subject site documentation process. Imaging capabilities and the “birds’ eye” view allow for yet another scale of site understanding. This scale fills a valuable phenomenological gap between the abstraction of the satellite and the entrenchment of the human eye as identified by Kullman [26]. This new perspective creates unique opportunities for site analysis and perception, enriching the research of a landscape architect.
Regulations, education, and cost currently limit the adoption of UAVs on a broader scale. However, as technology improves and costs fall, access to UAVs will only increase. Therefore, education on UAV capabilities and workflow opportunities is critical in improving the workflows of small landscape architecture firms.
Moving forward, schools of landscape architecture would benefit from integrating instruction on UAV capabilities and developing targeted landscape architecture UAV workflows for specific projects. These workflows create a strong base of knowledge for the students and faculty, not only benefiting the department but also impacting alumni and future employers. In this way, professors understand current technologies, students gain practical lifelong skills that make them more impactful, and the profession grows more robust as a result.
Future Work
This study answers a prescient and timely question dedicated to advancing the profession. However, it unearths more questions than it answers. These questions open opportunities for future work focused on a deeper understanding of nuances in UAVs.
How do UAV settings and photogrammetry software affect the precision of the data?
Carrying out the same methodology on multiple flights with different capture settings builds a framework for understanding UAV best practice. Work would be conducted iteratively, duplicating data for verification. Additionally, the use of LiDAR could be studied to understand the material benefit of object-penetrating LiDAR for landscape architectural workflows.
How does scale affect the results of this study?
Carrying out the same methodology on sites of different scales would be able to either verify or refute this study’s findings. Sites would be selected with attention to size, terrain, objects, and vegetation. This work would further the understanding of UAVs in typical site conditions encountered in the profession.
Author Contributions
Conceptualization, B.B. and P.S.; methodology, B.B. and P.S.; software, B.B.; validation, B.B., P.S., C.G. and D.M.; formal analysis, B.B.; investigation, B.B.; resources, B.B. and P.S.; data curation, B.B.; writing—original draft preparation, B.B.; writing—review and editing, P.S.; visualization, B.B.; supervision, P.S., C.G. and D.M.; project administration, B.B. All authors have read and agreed to the published version of the manuscript.
Funding
This research received no external funding.
Institutional Review Board Statement
The study was approved by the Institutional Review Board of Mississippi State University (IRB-25-010 and 3 April 2025).
Informed Consent Statement
Informed consent was obtained from all subjects involved in the study.
Data Availability Statement
All data is withheld at this time.
Conflicts of Interest
The authors declare no conflicts of interest.
References
- De Smedt, P.; Saey, T.; Meerschman, E.; De Reu, J.; De Clercq, W.; Van Meirvenne, M. Comparing Apparent Magnetic Susceptibility Measurements of a Multi-receiver EMI Sensor with Topsoil and Profile Magnetic Susceptibility Data over Weak Magnetic Anomalies. Archaeol. Prospect. 2014, 21, 103–112. [Google Scholar] [CrossRef]
- De Smedt, P.; Garwood, P.; Chapman, H.; Deforce, K.; De Grave, J.; Hanssens, D.; Vandenberghe, D. Novel insights into prehistoric land use at Stonehenge by combining electromagnetic and invasive methods with a semi-automated interpretation scheme. J. Archaeol. Sci. 2022, 143, 105557. [Google Scholar] [CrossRef]
- Draeyer, B.; Strecha, C. White Paper: How Accurate Are UAV Surveying Methods? 2014. Available online: https://www.studocu.com/es/document/universidad-catolica-de-valencia-san-vicente-martir/fotografia-digital/pix4d-white-paper-how-accurate-are-uav-surveying-methods/24555326 (accessed on 17 July 2025).
- Liu, X. Airborne LiDAR for DEM generation: Some critical issues. Prog. Phys. Geogr. 2008, 32, 31–49. [Google Scholar] [CrossRef]
- Serrat, C.; Banaszek, S.; Cellmer, A.; Gibert, V.; Banaszek, A. UAV, Digital Processing and Vectorization Techniques Applied to Building Condition Assessment and Follow-up. Teh. Glas. 2020, 14, 507–513. [Google Scholar] [CrossRef]
- Gevaert, C.M.; Persello, C.; Elberink, S.O.; Vosselman, G.; Sliuzas, R. Context-Based Filtering of Noisy Labels for Automatic Basemap Updating From UAV Data. IEEE J. Sel. Top. Appl. Earth Obs. Remote Sens. 2018, 11, 2731–2741. [Google Scholar] [CrossRef]
- Kemppinen, O.; Laning, J.C.; Mersmann, R.D.; Videen, G.; Berg, M.J. Imaging atmospheric aerosol particles from a UAV with digital holography. Sci. Rep. 2020, 10, 16085. [Google Scholar] [CrossRef] [PubMed]
- Kovanič, Ľ.; Topitzer, B.; Peťovský, P.; Blišťan, P.; Gergeľová, M.B.; Blišťanová, M. Review of Photogrammetric and Lidar Applications of UAV. Appl. Sci. 2023, 13, 6732. [Google Scholar] [CrossRef]
- Dayal, K.R.; Chauhan, I.M. UAV Photogrammetry for Feature Extraction and Mapping of Corrugated Industrial Rooftops. Int. Arch. Photogramm. Remote Sens. Spat. Inf. Sci. 2018, XLII-4, 129–133. [Google Scholar] [CrossRef]
- Matese, A.; Toscano, P.; Di Gennaro, S.F.; Genesio, L.; Vaccari, F.P.; Primicerio, J.; Belli, C.; Zaldei, A.; Bianconi, R.; Gioli, B. Intercomparison of UAV, Aircraft and Satellite Remote Sensing Platforms for Precision Viticulture. Remote Sens. 2015, 7, 2971–2990. [Google Scholar] [CrossRef]
- Su, S.; Yan, L.; Xie, H.; Chen, C.; Zhang, X.; Gao, L.; Zhang, R. Multi-Level Hazard Detection Using a UAV-Mounted Multi-Sensor for Levee Inspection. Drones 2024, 8, 90. [Google Scholar] [CrossRef]
- Puliti, S.; Breidenbach, J.; Astrup, R. Estimation of Forest Growing Stock Volume with UAV Laser Scanning Data: Can It Be Done without Field Data? Remote Sens. 2020, 12, 1245. [Google Scholar] [CrossRef]
- Khan, S.; Aragão, L.; Iriarte, J. A UAV–lidar system to map Amazonian rainforest and its ancient landscape transformations. Int. J. Remote Sens. 2017, 38, 2313–2330. [Google Scholar] [CrossRef]
- Baqersad, J.; Poozesh, P.; Niezrecki, C.; Avitabile, P. Photogrammetry and optical methods in structural dynamics—A review. Mech. Syst. Signal Process. 2017, 86, 17–34. [Google Scholar] [CrossRef]
- Dai, F.; Lu, M. Assessing the Accuracy of Applying Photogrammetry to Take Geometric Measurements on Building Products. J. Constr. Eng. Manag. 2010, 136, 242–250. [Google Scholar] [CrossRef]
- Niethammer, U.; Rothmund, S.; Schwaderer, U.; Zeman, J.; Joswig, M. Open Source Image-Processing Tools for Low-Cost UAV-Based Landslide Investigations. Int. Arch. Photogramm. Remote Sens. Spat. Inf. Sci. 2012, XXXVIII-1-C22, 161–166. [Google Scholar] [CrossRef]
- Alsamarraie, M.; Ghazali, F.; Hatem, Z.M.; Flaih, A.Y. A Review on the Benefits, Barriers of the Drone Employment in the Construction Site. J. Teknol. Sci. Eng. 2022, 84, 121–131. [Google Scholar] [CrossRef]
- Çïlek, A.; Berberoğlu, S.; Dönmez, C.; Ünal, M. Generation of High-Resolution 3-D Maps for Landscape Planning and Design Using UAV Technologies. J. Digit. Landsc. Archit. 2020, 5, 275–284. [Google Scholar] [CrossRef]
- Lee, K.; Elliott, S.; Tiansawat, P. Use of Drone RGB Imagery to Quantify Indicator Variables of Tropical-Forest-Ecosystem Degradation and Restoration. Forests 2023, 14, 586. [Google Scholar] [CrossRef]
- Javaid, M.; Khan, I.H.; Singh, R.P.; Rab, S.; Suman, R. Exploring contributions of drones towards Industry 4.0. Ind. Robot Int. J. Robot. Res. Appl. 2021, 49, 476–490. [Google Scholar] [CrossRef]
- Sapirstein, P. Accurate measurement with photogrammetry at large sites. J. Archaeol. Sci. 2016, 66, 137–145. [Google Scholar] [CrossRef]
- Milligan, B. Making terrains: Surveying, drones and media ecology. J. Landsc. Archit. 2019, 14, 20–35. [Google Scholar] [CrossRef]
- Videras Rodríguez, M.; Melgar, S.G.; Cordero, A.S.; Márquez, J.M.A. A Critical Review of Unmanned Aerial Vehicles (UAVs) Use in Architecture and Urbanism: Scientometric and Bibliometric Analysis. Appl. Sci. 2021, 11, 9966. [Google Scholar] [CrossRef]
- Sestras, P.; Badea, G.; Badea, A.C.; Salagean, T.; Roșca, S.; Kader, S.; Remondino, F. Land surveying with UAV photogrammetry and LiDAR for optimal building planning. Autom. Constr. 2025, 173, 106092. [Google Scholar] [CrossRef]
- Meyer-Lorey, R.; Acabado, S. Manifest Destiny in Southeast Asia: Archaeology of American Colonial Industry in the Philippines, 1898–1987. Am. Antiq. 2024, 89, 417–439. [Google Scholar] [CrossRef]
- Kullmann, K. The drone’s eye: Applications and implications for landscape architecture. Landsc. Res. 2018, 43, 906–921. [Google Scholar] [CrossRef]
- George, B.; Park, K. Flying High: A Case Study of the Integration of Drones into a Landscape Architecture Curriculum. J. Digit. Landsc. Archit. 2020, 246–253. [Google Scholar] [CrossRef]
- Kullmann, K. Hyper-realism and loose-reality: The limitations of digital realism and alternative principles in landscape design visualization. J. Landsc. Archit. 2014, 9, 20–31. [Google Scholar] [CrossRef]
- Maghazei, O.; Lewis, M.A.; Netland, T.H. Emerging technologies and the use case: A multi-year study of drone adoption. J. Oper. Manag. 2022, 68, 560–591. [Google Scholar] [CrossRef]
- LaGro, J.A. Site Analysis: A Contextual Approach to Sustainable Land Planning and Site Design; John Wiley & Sons: Hoboken, NJ, USA, 2011; ISBN 978-1-118-17455-5. [Google Scholar]
- Çelik, F. Basic Design Education in Landscape Architecture. Int. J. Archit. Res. ArchNet-IJAR 2014, 8, 176. [Google Scholar] [CrossRef]

Disclaimer/Publisher’s Note: The statements, opinions and data contained in all publications are solely those of the individual author(s) and contributor(s) and not of MDPI and/or the editor(s). MDPI and/or the editor(s) disclaim responsibility for any injury to people or property resulting from any ideas, methods, instructions or products referred to in the content. |
© 2025 by the authors. Licensee MDPI, Basel, Switzerland. This article is an open access article distributed under the terms and conditions of the Creative Commons Attribution (CC BY) license (https://creativecommons.org/licenses/by/4.0/).