Abstract
Background/Aims: We explored the possibility of using urine polar metabolites as non-invasive biomarkers of alcohol-associated liver disease (ALD) for early-stage diagnosis and severity assessment, as well as the possible changes in metabolic pathways in ALD patients. Methods: Polar metabolites were extracted with 80% methanol, and parallel 2DLC-MS was used for polar metabolite quantification. Results: Data from untargeted metabolomics showed that 194 metabolites were significantly changed in patients, and three metabolites can differentiate healthy controls (HC), non-severe ALD, and severe alcohol-associated hepatitis (severe AH) with high accuracy (0.92–0.97). Pathway analysis showed that arginine biosynthesis and histidine metabolism pathways were among the pathways containing the metabolites that were most altered in the urine of patients. Metabolites in the urea cycle, histidine catabolism, and histidine dipeptides pathways were notably increased in the urine of ALD patients, but none of the metabolites in these two pathways can simultaneously differentiate patients from healthy volunteers and non-severe ALD from severe AH. As the top differentiated pathways, the alterations of arginine biosynthesis and histidine metabolism indicate their importance in the metabolic dysfunction of ALD. Conclusions: Our results show that the abundance changes of specific metabolites can differentiate the disease severity of ALD, showing the potential of urine polar metabolites as non-invasive biomarkers for early-stage diagnosis and disease severity assessment of ALD.
1. Introduction
Alcohol-associated liver disease (ALD) is a leading liver disease and an important focus of clinical and translational research. Liver damage is generally asymptomatic and reversible in the early stages of ALD but can proceed to permanent liver damage without intervention. The disease may progress to alcohol-associated hepatitis (AH) or even more severe stages by the time ALD is diagnosed. AH causes the death of up to 30% of patients in 90 days without treatment [1]. Therefore, identifying ALD in its early stages is pivotal for successfully treating ALD before irreversible liver damage occurs [2]. Unfortunately, current methods for diagnosing ALD at an early stage often lack sensitivity [3,4]. Gaps in the overall diagnosis and medical management of ALD remain a challenge. An estimated 165 million individuals worldwide will have ALD by 2050 [5]. Consequently, reliable, non-invasive methods to diagnose and distinguish subjects at various stages of ALD are urgently needed.
Metabolic dysfunction in the liver represents a predominant feature in the early stages of ALD. However, the metabolic mechanisms underlying early-stage ALD remain poorly understood. During the past few years, studies on the metabolic signature of ALD have shown that the metabolism of both lipids and polar metabolites was disturbed by alcohol consumption [6,7]. In these studies, multiple metabolites were found to be potential biomarkers for ALD diagnosis, including 3-hydroxytetradecanedioic acid, isocitric acid, and sebacic acid [5]. N-Lauroglycine is the best for identifying cirrhosis, with 100% sensitivity and 90% negative predictive value (NPV), while decatrienoic acid was shown to be the best for assessing disease severity (i.e., differentiating patients with and without cirrhosis) with 100% sensitivity and 100% NPV [8]. However these studies did not examine if these metabolites could differentiate earlier stages of ALD, and the mechanism(s) underpinning these metabolic changes are not clear.
Compounds metabolized in tissues are eventually excreted into urine once their functions in the organism are complete. Therefore, urinary metabolites in a certain context can provide insight into the metabolic status of tissues. In the case of ALD, metabolites in the urine of patients can reflect the extent of metabolic disorders in the liver. In addition, urine is an ideal sample type for disease biomarker study because it is collected non-invasively, readily available, obtained in large quantities, and is relatively less complex than other samples [9,10]. Urine can be collected by patients at home in large volumes, which is especially important when study patients cannot go to clinical laboratories in situations like the COVID-19 pandemic. We recently found that the abundance levels of several bile acids, nucleosides, caffeine metabolites, and tryptophan metabolites were significantly altered stepwise in the urine of patients with different stages of ALD [11,12,13,14]. These studies highlight the potential of urinary metabolites to serve as diagnostic markers for the development and progression of ALD.
In this study, we aimed to identify metabolites in urine that serve as potential biomarkers for diagnosing early-stage ALD. Urine samples were collected from 19 healthy volunteers and 46 patients with different stages of ALD. After extracting polar metabolites from each urine sample, the metabolic profile differences of the polar metabolites between groups were analyzed by parallel two-dimensional liquid chromatography–mass spectrometry (2DLC-MS). Pathway analysis of the significantly altered metabolites was also performed to identify the metabolic pathways disrupted by alcohol consumption and, thus, provide insight into the disease mechanisms.
2. Methods and Patients
2.1. Patient Recruitment and Sample Collection
This study was approved by the University of Louisville Institutional Review Board (IRB protocol code: 08.0302, approval date 26 June 2008), and information on patient definitions and recruitment is detailed in our recent publications [11,13,15], and the same batch of samples were used in this study. All study participants had a complete history, physical examination, and laboratory evaluation. Each participant was also provided informed consent before participation, including appropriate authorization for data and sample collection. Nineteen healthy controls (HC) and 46 ALD patients were enrolled in this study. Patient samples were categorized by Model for End-Stage Liver Disease (MELD) score, and the group information is listed in Table S1. Patients with severe AH (severe AH) had MELD > 20 (n = 25). Patients with non-severe ALD spanned the spectrum from those with minimal liver enzyme abnormalities to moderate AH (12 < MELD < 20, n = 21).
All participants’ urine specimens were collected in the morning after overnight fasting and stored at −80 °C until use. All de-identified data from participants who provided urine samples were collected at baseline, as well as information on subsequent death, if available. Clinical data included participant demographics (age, sex), drinking history, medical assessments at admission, and medical history. Confirmatory tests for AH (laboratory and imaging) and markers of liver severity (MELD score) were collected and analyzed. A laboratory panel specific to this study was comprised of a comprehensive metabolic panel (CMP, including liver injury panel), coagulation measures, and complete blood count tests. All data were analyzed at the University of Louisville.
2.2. Polar Metabolite Extraction
Polar metabolites were extracted as described previously [13]. Briefly, samples were thawed on ice, and 100 μL of human urine was transferred to a fresh tube. Selective precipitation of large molecules and some metabolites was achieved by adding methanol at a ratio of 1:4 (v/v). After vortexing for 2–3 min, the mixture was centrifuged at 14,000× g for 20 min at 4 °C. One hundred µL of supernatant was mixed with 100 µL of deionized water (diH2O) and then analyzed by 2DLC-MS. Group-based pooled samples were also prepared by mixing a small portion of the supernatants of samples in the same group.
2.3. Untargeted Metabolomics for Metabolite Relative Quantification
All samples were analyzed on a Thermo Q Exactive HF Hybrid Quadrupole-Orbitrap Mass Spectrometer coupled with a Thermo Dionex UltiMate 3000 HPLC system (Thermo Fisher Scientific, Waltham, MA, USA) using the method described previously [13,16]. Specifically, the Ultimate 3000 HPLC system was equipped with a hydrophilic interaction liquid chromatography (HILIC) column and a reversed-phase liquid chromatography (RPC) column, and the HILIC and RPC columns were configured in parallel mode. The HILIC column was a SeQuant® ZIC®-cHILIC HPLC column (150 × 2.1 mm i.d., 3 µm) purchased from Phenomenex (Torrance, CA, USA). The RPC column was an ACQUITY UPLC HSS T3 column (150 × 2.1 mm i.d., 1.8 µm) purchased from Waters (Milford, MA, USA). Each column was connected with a 2 μL sample loop. The two columns were held at 40 °C. Mobile phase A was diH2O with 0.1% formic acid (v/v) and 10 mM ammonium acetate (pH = 3.25), and mobile phase B was 100% acetonitrile with or without 0.1% formic acid for RPC and HILIC column, respectively. All samples were analyzed by 2DLC-MS in both positive mode (+) and negative mode (−) for metabolite quantification. The group-based pooled samples were analyzed by 2DLC-MS/MS in positive and negative modes to acquire MS/MS spectra at three collision energies (20, 40, and 60 eV) for metabolite identification.
2.4. Nitric Oxide (NO) Detection
NO in human urine samples was analyzed using a total nitric oxide detection kit (Life Sciences, Lausen, Switzerland) following the manufacturer’s instructions.
2.5. Metabolite Identification and Statistical Data Analysis
XCMS software (Version 3.7.1) was used for spectrum deconvolution [17]. Compound Discoverer software (version 3.2, Thermo Fisher Scientific, Inc., Waltham, MA, USA) and MetSign software were used for metabolite identification [16]. For metabolite identification, a total of 363 authentic standards of polar metabolites were purchased from Sigma-Aldrich Corp. (St. Louis, MO, USA), Fisher Scientific (Loughborough, UK), and Cayman Chemical (Ann Arbor, MI, USA). Each of these metabolites was analyzed by the parallel 2DLC-MS/MS. The retention time, precursor ion m/z, and MS/MS spectrum of each metabolite standard were recorded in an in-house database. Experimental data from each experiment were first matched to the metabolites in the in-house database with thresholds of retention time < 0.5 min, precursor ion m/z < 5 ppm, and MS/MS spectrum similarity > 0.4. Any data point without a match in the in-house data database was submitted to Compound Discoverer for MS/MS spectrum match only. The threshold of spectrum similarity was set to >40 with a maximum of 100.
Statistical analyses were performed using SPSS software (version 25, IBM Corporation, Armonk, NY, USA) and R (version 4.1.0). Distributional assumptions of continuous outcomes were checked, and if needed, a data transformation (e.g., log transformation) was applied to meet the normality assumption. Partial least squares-discriminant analysis (PLS-DA) was performed to overview the metabolic profile differences among groups. Univariate analysis of metabolite abundance among groups was conducted using one-way ANOVA with Bonferroni’s post hoc tests. The decision tree algorithm was used for hierarchical classification to select metabolites that differentiate groups. Group cross-linear-by-linear association test (also known as Mantel–Haenszel test for trend) was used for linear trend analysis. ROC analysis was used to classify patients based on the abundance of metabolites. The thresholds of statistical significance tests were set as p ≤ 0.05, fold-change ≥ 50%, and areas under the ROC curve (AUC) > 0.7 or <0.3.
3. Results
3.1. Metabolites Serve as Early Markers for ALD Diagnosis
A total of 380 metabolites were identified in this study using both in-house and public databases. Among these identified metabolites, 194 had significant abundance changes with p < 0.05 and fold-change (FC) ≥ 50% as patient groups compared to HC or as severe AH compared to non-severe ALD (Table S2). To discover the potential markers that could differentiate the stages of ALD, ROC analysis was performed between HC and patients, and between non-severe ALD and severe AH. A total of 143 and 111 metabolites were detected, with significant abundance changes between the two groups in each comparison. A decision tree-based hierarchical classification was performed to classify HC, non-severe ALD, and severe AH using the abundance of the significantly changed metabolites. The results showed that using the abundance of 3-hydroxysebacic acid and androsterone glucuronide could differentiate patients from HC with an accuracy of 0.97 (95% confidence interval (CI), 0.89–1.00) (Figure 1A). Among the patients, the abundance change of 7,9-dimethylguanine, which was also reported in our previous publication [12], could differentiate non-severe ALD from severe AH with an accuracy of 0.92 (95% CI, 0.80–0.98) (Figure 1B). This result suggests that these metabolites could be used to determine the ALD stage with a high accuracy.
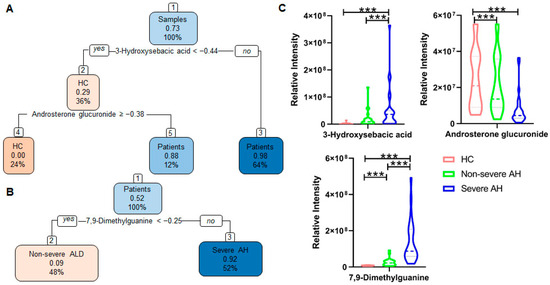
Figure 1.
Decision tree-based hierarchical classification of samples using an abundance of metabolites with statistically significant changes between groups. Patient samples were categorized into non-severe ALD and severe AH by MELD score. The first number inside each box represents the proportion of patients in (A) and severe AH in (B). The second number represents the percentage of samples in a group. (A) Using two metabolites could distinguish the HC and patients with ALD with an accuracy of 0.97 (95% CI, 0.89–1.00). (B) Using one metabolite 7,9-dimethylguanine could differentiate non-severe ALD from severe AH with an accuracy of 0.92 (95% CI, 0.80–0.98). (C) Abundance changes of the three metabolites. Patient samples were categorized into non-severe ALD and severe AH by MELD score. One-way ANOVA was used for the statistical significance test, and Bonferroni correction was used for the post hoc analysis: * p < 0.05; ** p < 0.01; *** p < 0.001.
The patients in this study have a large age span, ranging from 27 to 67 years old. To investigate whether age affects the results, we included age as a variable and performed the hierarchical classification analysis. An identical hierarchical classification result was obtained (Figure S1), suggesting that age did not affect the selection of metabolites as markers for ALD stage determination.
Although three metabolites could differentiate the three groups with a high accuracy, their performance may not surpass that of the MELD score. We noticed that six patients died; one of them deceased in 64 days after sample collection with a MELD score of 11, placing the patient in the non-severe ALD group. This suggests that the selected metabolites may not reliably distinguish truly severe cases if patients are grouped by their MELD scores. To address this, we reclassified the samples into four groups based on MELD scores and clinical outcomes: HC, non-severe ALD (MELD ≤ 19), severe AH (MELD ≥ 20), and dead patients. Their MELD scores are shown in Figure 2A. We then performed the same statistical analyses. From the significantly altered metabolites, we identified several metabolites that showed clear trends across the four groups (Figure 2B). For example, 4-hydroxy-3- methoxyphenylglycol sulfate and indole-3-lactic acid levels increased with disease severity and peaked in samples from deceased patients. In contrast, 3-(3-sulfooxyphenyl)propanoic acid decreased with disease severity and reached its lowest level in the urine of deceased patients. From these data, we observed that the MELD score cannot differentiate died from severe AH, while the abundance of these three metabolites in the died group was significantly different from that in severe AH, demonstrating their strong potential as diagnostic biomarkers.
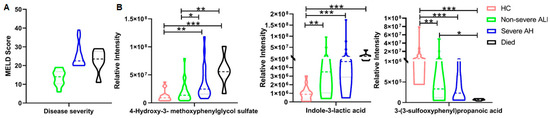
Figure 2.
Potential biomarkers to differentiate patients with outperform current diagnostic methods. (A) Patient samples were categorized into non-severe ALD and severe AH by MELD score; samples from patients who passed away after sample collection were categorized in the died group. (B) The abundance changes of three metabolites. One-way ANOVA was used for the statistical significance test, and Bonferroni correction was used for the post hoc analysis: * p < 0.05; ** p < 0.01; *** p < 0.001.
3.2. Metabolites in Arginine Biosynthesis Were Significantly Changed in Urine of Patients with ALD
Pathway analysis was carried out using all significantly changed metabolites, and the results are shown in Figure S2 and our previous publication [13]. After caffeine metabolism, the arginine biosynthetic is the most strongly affected pathway in ALD (Figure S2). Nine metabolites in this pathway were detected by untargeted metabolomics. Six (glutamic acid, glutamine, arginine, N-acetylcitrulline and N-acetylglutamic acid, and urea) had significant abundance changes between groups (Table S2). Most of these metabolites were increased with or without statistical significance, but N-acetylglutamic acid and urea were significantly decreased in patients’ urine (Figure 3A). A proteomics study on AH patients’ liver samples showed that the expression of the enzyme N-acetylglutamate synthase (NAGS), which is responsible for the conversion of glutamic acid to n-acetylglutamic acid, was decreased in the livers of patients with AH [18]. The increased glutamic acid but decreased N-acetylglutamic acid discovered in this study suggest the inhibition of this conversion and further confirm the literature reports. The linear-by-linear association test showed that some of those metabolites had a statistically significant increase with increasing disease severity. However, none of those metabolites could simultaneously differentiate HC, non-severe ALD, and severe AH (Figure 3B), suggesting that metabolites in the arginine biosynthesis pathway are not good candidates for stage ALD diagnosis.
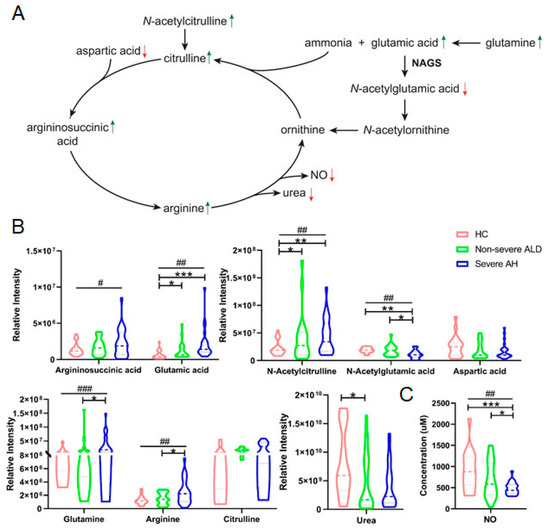
Figure 3.
The abundance of metabolites in the arginine biosynthetic pathway was significantly changed in the urine of patients with ALD. (A) The arginine biosynthesis pathway and abundance change of arginine metabolites. The green arrow indicates increased while the red arrow indicates decreased level of the metabolites. (B) Quantification results of metabolites in the arginine biosynthesis pathway by 2DLC-MS. (C) Quantification result of nitric acid (NO) in urine samples. Patient samples were categorized into non-severe ALD and severe AH by MELD score. One-way ANOVA was used for the statistical significance test, and Bonferroni correction was used for the post hoc analysis: * p < 0.05; ** p < 0.01; *** p < 0.001. The p values of the linear-by-linear association test for the linear trend were indicated as # p < 0.05, ## p < 0.01, ### p < 0.001.
The arginine biosynthetic pathway is important for urea synthesis, an essential liver metabolic function that plays a key regulatory role in nitrogen homeostasis. A decrease in urea synthesis capacity compromises the patient’s ability to eliminate toxic levels of nitrogenous substances, resulting in an increased risk of hepatic encephalopathy. Our results show that urea was significantly decreased even though all other metabolites in this pathway were increased (Figure 3B), suggesting that urea synthesis in the liver was decreased in patients with ALD. This conclusion is consistent with a literature report showing that functional hepatic nitrogen clearance decreases in patients with AH [18].
In addition to urea synthesis, the arginine biosynthesis pathway also produces nitric oxide (NO), which is made from arginine by various NO synthases (NOSs). The increase of all other metabolites and the decrease in urea in this pathway led us to investigate NO concentration in urine samples. The results showed a significant decreasing trend of NO level (Figure 3C). NO is produced by NOSs that are only active in the body and not in urine [19]. Therefore, NO concentration in urine is not the final product of arginine metabolism. Additional studies need to be conducted to determine the change in this pathway.
3.3. Alterations of Histidine Metabolites in Urine of Patients with ALD
Literature studies show that histidine and its certain derivatives are antioxidants and anti-inflammatory agents and function as chelators in multiple human diseases [20,21]. To our knowledge, no literature reports have shown a change in histidine metabolism in ALD. In this study, we found that the derivatives of histidine, including its catabolic products, dipeptides, and histamine metabolites, were changed in the urine of patients with ALD. Figure 4A shows that the abundance of metabolites in the histidine pathway was altered in the urine of patients with ALD. All metabolites in the catabolic sub-pathway were increased in patients’ urine even though the abundance changes in histidine and formiminoglutamic acid were not statistically significant (Figure 4B). The histidine-containing dipeptides, carnosine and anserine, as well as their hydrolysis product, 1-methylhistidine, were significantly increased. In contrast, another derivative of carnosine, n-acetylcarnosine, was decreased in the urine of patients with severe AH (Figure 4C).
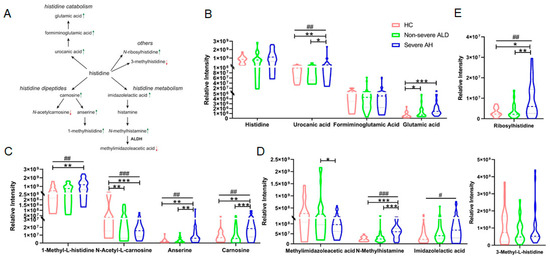
Figure 4.
The abundance change in metabolites in the histidine metabolism pathway in the urine of patients with ALD. (A) Histidine metabolism pathway and the abundance change in some metabolites detected by 2DLC-MS. The green arrow indicates increased while the red arrow indicates decreased level of the metabolites. (B) Quantification results of metabolites detected in the histidine catabolism pathway. (C) Quantification results of histidine bipeptides. (D) Quantification results of metabolites in histamine metabolism pathway. (E) Quantification results of the other two metabolites of histidine derivatives. One-way ANOVA was used for the statistical significance test, and Bonferroni correction was used for the post hoc analysis: * p < 0.05; ** p < 0.01; *** p < 0.001. The p values of the linear-by-linear association test for the linear trend are indicated as # p < 0.05, ## p < 0.01, ### p < 0.001.
n-Methylhistamine is a major metabolite of histamine that is further metabolized into methylimidazoleacetic acid (Figure 4A) and excreted in the urine. Figure 4D shows that n-methylhistamine and imidazolelactic acid were increased in patients’ urine samples with or without statistical significance, but methylimidazoleacetic acid was decreased considerably in severe AH compared to non-severe ALD, indicating that the inhibited conversion of n-methylhistamine into the latter. In the proteomics study of AH patient liver samples, they found that the expression of enzyme aldehyde dehydrogenases 2 (ALDH2) was significantly decreased [18]. All these results indicate that histamine metabolism was also affected in ALD patients. In addition to the above three sub-pathways, n-ribosylhistidine and 3-methylhistidine are also metabolites of histidine. Our results showed that n-ribosylhistidine was significantly increased in the urine of patients with severe AH, while 3-methylhistidine was decreased in non-severe ALD without statistical significance (Figure 4E).
4. Discussion
Currently, only a few prognostic markers are used clinically for ALD [22], and there is a great need for early diagnostic and prognostic markers for ALD [23]. Recent studies have attempted to address these needs [5,8,24], but diverse technologies used in the analyses, variable animal strains used in experimental models, and sample types have led to substantial differences in the results. This study aimed to systematically characterize the polar metabolite abundance changes in the urine of patients with various stages of ALD and to identify potential non-invasive metabolomic biomarkers for the diagnosis and severity assessment of various stages of ALD. Based on our previous study, the MELD score was the best parameter to categorize ALD patient samples; therefore, we grouped the samples in this project by MELD score as well. Screening biomarkers in patients’ urine by untargeted metabolomics, we found that combining 3-hydroxysebacic acid and androsterone glucuronide can differentiate patients from healthy volunteers, and 7,9-dimethylguanine alone can differentiate non-severe ALD from severe AH. We also found that the abundance changes in three metabolites, 4-hydroxy-3- methoxyphenylglycol sulfate, indole-3-lactic acid, and 3-(3-sulfooxyphenyl)propanoic acid, have a potential to differentiate severe AH from patients who may have died in 90 days. Combining MELD scores with changes in these metabolites may provide a more accurate way of diagnosing ALD patients.
In addition to the biomarkers, pathway analysis was conducted to investigate the metabolic pathways that were affected by alcohol consumption. The result showed that the caffeine metabolism, the arginine biosynthetic pathway, and histidine metabolism were the top three pathways that significantly changed in the urine of patients with ALD. We reported caffeine metabolism and tryptophan metabolism pathways in our previous studies [13,14], and the latter was also found to be changed in this study without statistical significance (Figure S2). In this study, we focus on the arginine biosynthetic pathway and histidine pathway. The arginine biosynthetic pathway is responsible for nitrogen homeostasis and NO synthesis in the liver. Urea synthesis capacity decreases in patients with compromised liver function [25], whereas it increases in patients with inflammation [26]. These two mechanisms are involved in AH. The urea synthesis capacity in the livers of patients with AH results from the balance of these two mechanisms. The decreased levels of urea and NO in patients suggest that urea synthesis and the conversion of arginine to ornithine might be inhibited in the livers of patients with AH.
Histidine plays a key role in cell metabolism [27,28]. As an active and versatile amino acid, it is a key catalytic residue in many enzymes and is important for protein interactions [29]. Histidine is essential for the formation of various metal-bearing enzymes and compounds and contributes to the formation of iron-containing molecules, including ferritin, which is necessary for energy supply. Previous studies showed a reduced energy supply in ALD [30,31], but whether this is related to histidine remains unclear. In the current study, we found that the level of free histidine was unchanged, but the levels of its catabolic products and three other derivatives (1-methylhistidine, N-ribosylhistidine, and imidazolelactic acid) were increased in the urine of patients with ALD. Additionally, histidine strongly inhibits lipid peroxidation [32]. Histidine thus plays a role in many biological processes and has a broad protective effect against tissue damage. This conclusion is further supported by previous studies showing that histidine or carnosine supplementation can lower high serum transaminase activities and hepatic histopathologic changes and decrease proinflammatory, prooxidant, and profibrotic parameters in the livers of alcohol-fed rats [33]. The increased carnosine and anserine levels in urine observed in this study support the increased levels of reactive oxygen species in patients with ALD. Collectively, these data demonstrate that the metabolism of histidine in the liver is extensively changed by alcohol.
There are several limitations in the current study. Firstly, the three metabolites used to differentiate patients with healthy volunteers and patients with different stages of ALD have a weak correlation, which limits the use of these biomarkers in clinical diagnosis. Secondly, this study did not include patients with metabolic dysfunction-associated steatotic liver disease, therefore, we cannot determine the metabolites that specifically changed in AH. Thirdly, hormone level and genetic background (such as ethnicity, diet, etc.) also modulates the effects of alcohol in ALD and affects human metabolism. Therefore, gender and genetic background should be considered when selecting biomarkers for disease diagnosis. However, the small sample size in this project limited this analysis. Finally, the current study did not include a metabolomics study in patient liver tissue samples, which limits the explanation of the mechanism(s) of ALD development.
5. Conclusions
We analyzed the metabolite profile of polar metabolites in the urine of patients with non-severe ALD and severe AH and compared the abundance changes in identified metabolites with HC. We found that multiple metabolic pathways were changed by alcohol consumption, including the arginine biosynthesis pathway and histidine metabolism pathway. Among the identified 380 polar metabolites, the combination of 3-hydroxysebacic acid and androsterone glucuronide can differentiate patients from the HC with an accuracy of 0.97 (95% CI, 0.89–1.00), and 7,9-dimethylguanine alone can differentiate non-severe ALD from severe AH with an accuracy of 0.92 (95% CI, 0.80–0.98). By grouping patients based on MELD scores and clinical outcomes, we also found that 4-hydroxy-3-methoxyphenylglycol sulfate, indole-3-lactic acid, and 3-(3-sulfooxyphenyl)propanoic acid have strong potential as diagnostic biomarkers. Therefore, these three metabolites can be used as biomarkers for the development and progression of ALD.
Supplementary Materials
The following supporting information can be downloaded at: https://www.mdpi.com/article/10.3390/ijtm5020021/s1, Figure S1: Hierarchical classification of urine samples by decision tree. Figure S2: Pathway analysis using all significantly changed metabolites. Table S1: Demographic, drinking, and liver indicators of study participants by group. Table S2: Metabolites with significant abundance changes between groups.
Author Contributions
L.H.: writing—original draft, formal analysis, data curation. V.V.: data curation, investigation, resources. R.X.: investigation. X.Y.: investigation. X.M.: investigation. S.K.: investigation, writing—review and editing. E.G.M.: writing—review and editing. W.F.: writing—review and editing. C.J.M.: funding acquisition, project administration, supervision, data curation, resources. X.Z.: investigation, funding acquisition, project administration, supervision, data curation, writing—review and editing. All authors have read and agreed to the published version of the manuscript.
Funding
This work was supported by NIH [S10OD020106 (XZ); 1P20GM113226 (CJM); 1P50AA024337 (CJM); 1U01AA026934 (CJM); 1U01AA026936 (CJM); 1U01AA026980 (CJM); U01AA021893 (CJM), and 1R21AA031563-01 (LH)]. The content is solely the responsibility of the authors and does not necessarily represent the official views of the National Institutes of Health. This work was also supported by the Department of Veterans Affairs, 2I01CX002219-05A2 (CJM).
Institutional Review Board Statement
This study was approved by the Institutional Review Board (IRB) of the University of Louisville; IRB protocol code: 08.0302, approval date 26 June 2008. All study participants were informed about the purpose of the study and any potential risks/side effects prior to participation.
Informed Consent Statement
Informed consent was obtained from all subjects involved in the study.
Data Availability Statement
The data will be available through metabolomics workbench.
Acknowledgments
The authors thank Marion McClain for proofreading the manuscript.
Conflicts of Interest
All authors declare no conflicts of interest for this project.
Declaration of generative AI and AI-assisted technologies in the writing process
During the preparation of this work the author(s) used ChatGPT (Version 4.0, access in May, 2024) in order to improve the readability and language of the manuscript. After using this tool, the author(s) reviewed and edited the content as needed and take(s) full responsibility for the content of the published article.
Abbreviations
AH: Alcohol-associated hepatitis; ALD: Alcohol-associated liver disease; LC-MS: liquid chromatography–mass spectrometry; MELD: Model for end-stage liver disease; PLS-DA: partial least squares-discriminant analysis.
References
- Poynard, T.; Mathurin, P.; Lai, C.L.; Guyader, D.; Poupon, R.; Tainturier, M.H.; Myers, R.P.; Muntenau, M.; Ratziu, V.; Manns, M.; et al. A comparison of fibrosis progression in chronic liver diseases. J. Hepatol. 2003, 38, 257–265. [Google Scholar] [CrossRef] [PubMed]
- Abenavoli, L.; Masarone, M.; Federico, A.; Rosato, V.; Dallio, M.; Loguercio, C.; Persico, M. Alcoholic Hepatitis: Pathogenesis, Diagnosis and Treatment. Rev. Recent. Clin. Trials 2016, 11, 159–166. [Google Scholar] [CrossRef]
- Kendrick, S.F.W.; O’Boyle, G.; Mann, J.; Zeybel, M.; Palmer, J.; Jones, D.E.J.; Day, C.P. Acetate, the Key Modulator of Inflammatory Responses in Acute Alcoholic Hepatitis. Hepatology 2010, 51, 1988–1997. [Google Scholar] [CrossRef] [PubMed]
- Mookerjee, R.P.; Malaki, M.; Davies, N.A.; Hodges, S.J.; Dalton, R.N.; Turner, C.; Sen, S.; Williams, R.; Leiper, J.; Vallance, P.; et al. Increasing dimethylarginine levels are associated with adverse clinical outcome in severe alcoholic hepatitis. Hepatology 2007, 45, 62–71. [Google Scholar] [CrossRef]
- Liang, Q.; Wang, C.; Li, B.B.; Zhang, A.H. Metabolomics of alcoholic liver disease: A clinical discovery study. RSC Adv. 2015, 5, 80381–80387. [Google Scholar] [CrossRef]
- Yu, M.; Zhu, Y.; Cong, Q.; Wu, C. Metabonomics Research Progress on Liver Diseases. Can. J. Gastroenterol. Hepatol. 2017, 2017, 8467192. [Google Scholar] [CrossRef]
- Qiu, S.; Zhang, A.H.; Guan, Y.; Sun, H.; Zhang, T.L.; Han, Y.; Yan, G.L.; Wang, X.J. Functional metabolomics using UPLC-Q/TOF-MS combined with ingenuity pathway analysis as a promising strategy for evaluating the efficacy and discovering amino acid metabolism as a potential therapeutic mechanism-related target for geniposide against alcoholic liver disease. RSC Adv. 2020, 10, 2677–2690. [Google Scholar] [CrossRef]
- Suciu, A.M.; Crisan, D.A.; Procopet, B.D.; Radu, C.I.; Socaciu, C.; Tantau, M.V.; Stefanescu, H.O.; Grigorescu, M. What’s in Metabolomics for Alcoholic Liver Disease? J. Gastrointest. Liver 2018, 27, 51–58. [Google Scholar] [CrossRef] [PubMed]
- Ioannidis, J.P.A.; Khoury, M.J. Improving Validation Practices in “Omics” Research. Science 2011, 334, 1230–1232. [Google Scholar] [CrossRef]
- Liang, Q.; Wang, C.; Li, B.B. Metabolomic Analysis Using Liquid Chromatography/Mass Spectrometry for Gastric Cancer. Appl. Biochem. Biotech. 2015, 176, 2170–2184. [Google Scholar] [CrossRef]
- He, L.; Vatsalya, V.; Ma, X.; Zhang, J.; Yin, X.; Kim, S.; Feng, W.; McClain, C.J.; Zhang, X. Metabolic Profiling of Bile Acids in the Urine of Patients with Alcohol-Associated Liver Disease. Hepatol. Commun. 2021, 5, 798–811. [Google Scholar] [CrossRef] [PubMed]
- He, L.; Vatsalya, V.; Ma, X.; Klinge, C.M.; Cave, M.C.; Feng, W.; McClain, C.J.; Zhang, X. Metabolic Analysis of Nucleosides/Bases in the Urine and Serum of Patients with Alcohol-Associated Liver Disease. Metabolites 2022, 12, 1187. [Google Scholar] [CrossRef] [PubMed]
- Xu, R.; He, L.; Vatsalya, V.; Ma, X.; Kim, S.; Mueller, E.G.; Feng, W.; McClain, C.J.; Zhang, X. Metabolomics analysis of urine from patients with alcohol-associated liver disease reveals dysregulated caffeine metabolism. Am. J. Physiol.-Gastrointest. Liver Physiol. 2022, 324, G142–G154. [Google Scholar] [CrossRef]
- Xu, R.; Vatsalya, V.; He, L.; Ma, X.; Feng, W.; McClain, C.J.; Zhang, X.J.A.C.; Research, E. Altered urinary tryptophan metabolites in alcohol-associated liver disease. Alcohol Clin. Exp. Res. 2023, 47, 1665–1676. [Google Scholar] [CrossRef] [PubMed]
- Vatsalya, V.; Cave, M.C.; Kong, M.Y.; Gobejishvili, L.; Falkner, K.C.; Craycroft, J.; Mitchell, M.; Szabo, G.; McCullough, A.; Dasarathy, S.; et al. Keratin 18 Is a Diagnostic and Prognostic Factor for Acute Alcoholic Hepatitis. Clin. Gastroenterol. Hepatol. 2020, 18, 2046–2054. [Google Scholar] [CrossRef]
- He, L.; Li, F.; Yin, X.; Bohman, P.; Kim, S.; McClain, C.J.; Feng, W.; Zhang, X. Profiling of Polar Metabolites in Mouse Feces Using Four Analytical Platforms to Study the Effects Of Cathelicidin-Related Antimicrobial Peptide in Alcoholic Liver Disease. J. Proteome Res. 2019, 18, 2875–2884. [Google Scholar] [CrossRef]
- Tautenhahn, R.; Patti, G.J.; Rinehart, D.; Siuzdak, G. XCMS Online: A web-based platform to process untargeted metabolomic data. Anal. Chem. 2012, 84, 5035–5039. [Google Scholar] [CrossRef]
- Glavind, E.; Aagaard, N.K.; Gronbaek, H.; Moller, H.J.; Orntoft, N.W.; Vilstrup, H.; Thomsen, K.L. Alcoholic Hepatitis Markedly Decreases the Capacity for Urea Synthesis. PLoS ONE 2016, 11, e0158388. [Google Scholar] [CrossRef]
- Iwakiri, Y.; Kim, M.Y. Nitric oxide in liver diseases. Trends Pharmacol. Sci. 2015, 36, 524–536. [Google Scholar] [CrossRef]
- Wade, A.M.; Tucker, H.N. Antioxidant characteristics of L-histidine. J. Nutr. Biochem. 1998, 9, 308–315. [Google Scholar] [CrossRef]
- Holecek, M. Histidine in Health and Disease: Metabolism, Physiological Importance, and Use as a Supplement. Nutrients 2020, 12, 848. [Google Scholar] [CrossRef] [PubMed]
- Rahimi, E.; Pan, J.J. Prognostic models for alcoholic hepatitis. Biomark. Res. 2015, 3. [Google Scholar] [CrossRef] [PubMed]
- Sanyal, A.J.; Gao, B.; Szabo, G. Gaps in Knowledge and Research Priorities for Alcoholic Hepatitis. Gastroenterology 2015, 149, 4–9. [Google Scholar] [CrossRef][Green Version]
- Michelena, J.; Alonso, C.; Martinez-Arranz, I.; Altamirano, J.; Mayo, R.; Sancho-Bru, P.; Bataller, R.; Gines, P.; Castro, A.; Caballeria, J. Metabolomics Discloses a New Non-invasive Method for the Diagnosis and Prognosis of Patients with Alcoholic Hepatitis. Ann. Hepatol. 2019, 18, 144–154. [Google Scholar] [CrossRef]
- Vilstrup, H. Synthesis of Urea after Stimulation with Amino-Acids—Relation to Liver-Function. Gut 1980, 21, 990–995. [Google Scholar] [CrossRef]
- Thomsen, K.L.; Nielsen, S.S.; Aagaard, N.K.; Sandahl, T.D.; Gronbaek, H.; Frystyk, J.; Flyvbjerg, A.; Vilstrup, H. Tumor necrosis factor-alpha acutely up-regulates urea synthesis in vivo in rats—A hepatic component of inflammatory catabolism? Scand. J. Clin. Lab. Investig. 2010, 70, 151–157. [Google Scholar] [CrossRef]
- Liao, S.M.; Du, Q.S.; Meng, J.Z.; Pang, Z.W.; Huang, R.B. The multiple roles of histidine in protein interactions. Chem. Cent. J. 2013, 7. [Google Scholar] [CrossRef]
- Jakopitsch, C.; Auer, M.; Regelsberger, G.; Jantschko, W.; Furtmuller, P.G.; Ruker, F.; Obinger, C. The catalytic role of the distal site asparagine-histidine couple in catalase-peroxidases. Eur. J. Biochem. 2003, 270, 1006–1013. [Google Scholar] [CrossRef] [PubMed]
- Li, F.; Fitz, D.; Fraser, D.G.; Rode, B.M. Catalytic effects of histidine enantiomers and glycine on the formation of dileucine and dimethionine in the salt-induced peptide formation reaction. Amino Acids 2010, 38, 287–294. [Google Scholar] [CrossRef]
- Nassir, F.; Ibdah, J.A. Role of mitochondria in alcoholic liver disease. World J. Gastroenterol. 2014, 20, 2136–2142. [Google Scholar] [CrossRef]
- Cunningham, C.C.; Van Horn, C.G. Energy availability and alcohol-related liver pathology. Alcohol. Res. Health 2003, 27, 291–299. [Google Scholar] [PubMed]
- Erickson, M.C.; Hultin, H.O. Influence of histidine on lipid peroxidation in sarcoplasmic reticulum. Arch. Biochem. Biophys. 1992, 292, 427–432. [Google Scholar] [CrossRef] [PubMed]
- Baykara, B.; Micili, S.C.; Tugyan, K.; Tekmen, I.; Bagriyanik, H.; Sonmez, U.; Sonmez, A.; Oktay, G.; Yener, N.; Ozbal, S. The protective effects of carnosine in alcohol-induced hepatic injury in rats. Toxicol. Ind. Health 2014, 30, 25–32. [Google Scholar] [CrossRef] [PubMed]
Disclaimer/Publisher’s Note: The statements, opinions and data contained in all publications are solely those of the individual author(s) and contributor(s) and not of MDPI and/or the editor(s). MDPI and/or the editor(s) disclaim responsibility for any injury to people or property resulting from any ideas, methods, instructions or products referred to in the content. |
© 2025 by the authors. Licensee MDPI, Basel, Switzerland. This article is an open access article distributed under the terms and conditions of the Creative Commons Attribution (CC BY) license (https://creativecommons.org/licenses/by/4.0/).