Article

The Early Response After Radiation Therapy on Three-Dimensional Oral Cancer Model Using Patient-Derived Cancer-Associated Fibroblasts

1
Neutron Therapy Research Center, Okayama University, Okayama 700-8558, Japan
2
Department of Oral and Maxillofacial Surgery, Graduate School of Medicine, Dentistry and Pharmaceutical Sciences, Okayama University, Okayama 700-8558, Japan
3
Particle Radiation Oncology Center, Institute for Integrated Radiation and Nuclear Science, Kyoto University, Osaka 590-0494, Japan
4
Department of Physiology, Graduate School of Medicine, Dentistry and Pharmaceutical Sciences, Okayama University, Okayama 700-8558, Japan
5
Department of Oral Pathology and Medicine, Graduate School of Medicine, Dentistry and Pharmaceutical Sciences, Okayama University, Okayama 700-8558, Japan
6
Division of Biomimetics, Faculty of Dentistry & Graduate School of Medical and Dental Sciences, Niigata University, Niigata 951-8514, Japan
*
Author to whom correspondence should be addressed.
Int. J. Transl. Med. 2025, 5(1), 12; https://doi.org/10.3390/ijtm5010012
Submission received: 13 December 2024 / Revised: 13 March 2025 / Accepted: 18 March 2025 / Published: 20 March 2025

Abstract

:
Background/Objectives: Cancer-associated fibroblasts (CAFs), which are an important component of the tumor microenvironment, have been reported to have an adverse effect on conventional radiotherapy. This study aims to elucidate the effects of CAFs in boron neutron capture therapy (BNCT) using a three-dimensional (3D) oral cancer model. Methods: Three-dimensional cancer models were fabricated using patient-derived CAFs or patient-derived normal oral fibroblasts (NOFs) and a human oral squamous cell carcinoma cell line. Each 3D cancer model was performed with either a conventional X-ray treatment or BNCT and additionally analyzed histomorphologically. Results: The 3D oral cancer-CAFs model demonstrated a greater depth of cancer cell invasion than the 3D oral cancer-NOFs model. Radiation therapy for the 3D oral cancer models indicated a trend for decreasing cancer cell invasion and cell number with dose dependence in both X-ray and BNCT. In comparison with X-rays, BNCT showed a consistent increase in the number of NOFs and a significant reduction in the number of CAFs. Conclusions: BNCT for the 3D oral cancer model was shown to be effective against cancer cells and CAFs but not against NOFs, indicating its usefulness as a minimally invasive treatment for advanced cancer. Furthermore, it is indicated that the 3D oral cancer-CAFs model is a valuable tool to evaluate cancer treatment and research, particularly in high-grade malignant tumors with invasion.

1. Introduction

These days, the target of cancer treatment has been shifting from the tumor itself to the structures surrounding tumors. These structures are known as the tumor microenvironment (TME), which is a dynamic network composed of cellular components, such as tumor cells, cancer-associated fibroblasts (CAFs), or infiltrating immune cells, and also non-cellular components of extracellular matrix (ECM) and factors that are secreted by these cells [1]. CAFs, which make up the majority of cellular components of TME, may constitute as much as 80% of the tumor mass in advanced stages of head and neck cancers, and they play important roles in tumor proliferation, tumor cell invasion, tumor angiogenesis, and resistance to treatments [2]. Due to the heterogeneity of CAFs, treatments targeting CAFs alone are often unsuccessful [3]. However, targeting both CAFs and cancer cells may have the potential to improve therapeutic efficacy [4].
The primary treatment for oral cancer is surgical resection; however, in cases with a high risk of recurrence, adjuvant therapies, such as radiation therapy, are often selected for the purpose of eliminating the cancer cells in the surrounding tissues. Radiation therapy is expected to be effective for CAFs, yet there are several reports suggesting that CAFs are involved in radiation resistance [1,5,6]. The processes by which CAFs enhance radiation resistance are still under investigation, but these factors have been reported to have significant roles in the process, such as secretion of growth factors and cytokines [5] and the DNA damage induced by irradiation [2].
Boron neutron capture therapy (BNCT) is a tumor-selective particle radiotherapy [7]. After the boron drug is injected into the patient, where it selectively accumulates in the tumor cells, neutron beams are then directed at the tumor. This causes nuclear reactions in the cancer cells, leading to cell death [8]. Therefore, BNCT is expected to be a low-side-effect therapy, as it can selectively destroy cells while having minimal impact on normal cells. BNCT is considered an effective treatment option for locally advanced or recurrent unresectable head and neck cancers [9]; however, the effect of BNCT on CAFs remains unclear at present.
As the importance of TME is established, experiments using three-dimensional (3D) models are emphasized because the interaction and communications between tumor cells and the cells surrounding tumors play crucial roles in tumor progression and metastasis [10]. Additionally, in the field of radiation therapy, 3D cultures are promising tools for preclinical studies because the traditional 2D cell culture cannot accurately model hypoxia, which is known to result in reduced therapeutic responses [11]. In this study, we fabricated a 3D oral cancer model, which consists of two layers, the stromal layer and the cancer layer, by using patient-derived CAFs and oral cancer cells to mimic the TME of oral cancer. The aim of this study is to elucidate cancer–stroma interactions by BNCT.

2. Materials and Methods

2.1. Cell Culture

To develop the 3D oral cancer model, human tongue squamous carcinoma (HSC-4, TIMS (JCRB) Bank, JCRB0624), patient-derived normal oral fibroblasts (NOFs), and patient-derived cancer-associated fibroblasts (CAFs) were used for the cell culture. NOFs and CAFs were provided by Niigata University (Niigata University Ethical Committee Approval #2022-0300) for the experiment [12]. The isolation, characterization, and culture of NOFs and CAFs were performed as previously described [12]. Both NOFs and CAFs are derived from the same oral cancer patient, with NOFs isolated from cancer-negative sites and CAFs from cancer false-positive sites. NOFs and CAFs were used in the experiments after 1–4 passages. All cells were grown in Alpha Modified Eagle Medium (α-MEM; NACALAI TESQUE Inc., Kyoto, Japan) supplemented with 10% heat-inactivated fetal bovine serum (FBS; Corning, New York, NY, USA), penicillin (10,000 units/mL), and streptomycin (10,000 μg/mL; NACALAI TESQUE Inc., Kyoto, Japan) in a humidified atmosphere of 5% CO2 at 37 °C. When these cells reached 70–80% confluence, they were serially subcultured using a 0.025% trypsin/EDTA solution (NACALAI TESQUE Inc., Kyoto, Japan).

2.2. Fabrication of a Human 3D Oral Cancer Model Using Patient-Derived Fibroblasts

The 3D oral cancer model comprising an oral cancer cell layer and an underlying stromal layer with NOFs and CAFs was fabricated as previously reported with some modifications [13]. Briefly, after 250 μL of an acellular type I collagen matrix (Cellmatrix Type I-A, Nitta Gelatin, Osaka, Japan) was prepared in a tissue culture insert of a twelve-well Thincert deep-well plate (Greiner Bio, Kremsmuenster, Austria), 750 μL of the mixture of the type I collagen matrix and either NOFs or CAFs at 2 × 10⁵ cells was poured onto a gelatinized matrix. This procedure led to the formation of a stromal layer in the model. Then, 5 mL of αMEM with 10% FBS was added to each well, and 0.5 mL was placed on the collagen gel matrix inside the insert. This created a submerged condition, and the setup was incubated at 37 °C in a humidified atmosphere with 5% CO2 for 7 days. The medium was refreshed every 2 days. On day 2, the stromal layer was separated from the sidewall of the insert using a scalpel, allowing for the spontaneous contraction of the stromal layer. On day 7, 2.0 × 10⁵ HSC4 cells resuspended in 10 μL of medium were seeded onto the top surface of the stromal layer where the contraction had completed. The 3D oral cancer model was cultured in submerged conditions for the next seven days. On day 14, the 3D oral cancer model was raised at an air–liquid interface by reducing the medium volume to 4.2 mL. The culture continued to promote epithelial stratification for another 7 days. The number of days since the start of the air–liquid interface culture is denoted as post-air–liquid interface culture day (PD), and day 14 is equal to PD 0. The 3D oral cancer models were referred to as the 3D cancer-NOFs model and 3D cancer-CAFs model, respectively. All 3D oral cancer models were independently established three times (N = 3).

2.3. X-Ray Irradiation for 3D Oral Cancer Model

X-ray radiation was applied to 3D oral cancer models on PD 2. A tabletop X-ray irradiation device (MX-80Labo, mediXtec Corporation, Chiba, Japan) was used for X-ray irradiation. The tube voltage and tube current were set to 80 kV and 1.25 mA, respectively, and the distance from the irradiation source was set to the surface of the cancer cell layer. After removal of the culture medium, the twelve-well Thincert deep-well plates were set in the X-ray irradiation device. Irradiation was conducted at three different doses (0, 5, 10, and 20 Gy) at a dose rate of 26.40 Gy/h. After the irradiation, the 3D oral cancer models were cultured for another 5 days at the air–liquid interface, with refreshing the medium every 2 days. All experiments were performed in triplicate (N = 3).

2.4. BNCT for 3D Oral Cancer Model

The treatment planning for BNCT was developed as previously reported with some modifications [14]. The boron concentration of 3D oral cancer models was measured to determine the neutron irradiation dose. Boron drug (Borofaran®, Stella Pharma, Osaka, Japan) was added in the medium at a volume ratio of 1:10, and the sample was collected 24 h after adding the boron drug. The 3D oral cancer models without the addition of the boron drug were also prepared for the measurement of boron concentration. The collected samples were heated after being treated with HNO3 and measured by an inductively coupled plasma-mass spectrometer (ICP-MS, Agilent7500cx, Agilent Technologies, Tokyo, Japan). According to the result of the ICP-MS measurement, the irradiation time of the neutron beam was determined so that the irradiation dose for the cancer cell layer would be comparable with the X-ray irradiation. The boron drug was added to the medium 24 h before the irradiation. The neutron irradiation was performed at the Heavy Water Neutron Irradiation Facility of the Kyoto University Research Reactor (KUR) at 1 MW operation on PD 2 [15]. The neutron fluence was measured by the activation method using gold foil [16]. After the irradiation, the 3D oral cancer models were cultured for another 5 days at the air–liquid interface, with refreshing the medium every 2 days. All experiments were performed in triplicate (N = 3).

2.5. Histological Analysis

When the models were completed after culturing for 21 days, they were fixed in 4% paraformaldehyde and embedded in paraffin. Sections of 5 μm thickness were prepared for hematoxylin-eosin (HE) staining and used for histological examinations. Each stained slice was photographed at 10× magnification using a BZ-X800 microscope (Keyence, Osaka, Japan). The eosin-stained collagen-dominant area was defined as the stromal layer, and the hematoxylin-stained layer in the upper portion of the stromal layer was designated as the cancer cell layer. The gross and tumor areas were measured using the ImageJ software version 1.54 (National Institute of Health, Bethesda, MD, USA) as previously reported with some modifications [17]. The depth of the cancer cell invasion (DOI) was defined as the vertical length from the surface of the cancer layer to the most invasive area and was measured at three hot spots in one slice; the average of three points was calculated with reference to a previously reported paper with some modifications [13]. A hot spot was defined as an area in which the density of cancer cells was relatively high. The number of cancer cells and fibroblasts was counted using the ImageJ software. Our previous research [17] has demonstrated that fibroblasts are smaller in size than cancer cells. Therefore, the distinction between cell types was made based on differences in cell size. In counting the number of fibroblasts, NOFs and CAFs were defined as fibroblasts. The relative viability was defined as the ratio of radiation-treated cells to untreated cells, reflecting the tendency of cell reduction upon irradiation. The relative viability of fibroblasts and cancer cells was calculated separately for the 3D cancer-NOFs model and the 3D cancer-CAFs model. The analysis was conducted as a blind study.

2.6. Statistical Analysis

The data are shown as means ± standard deviation or as three points representing the three values obtained. Data comparison was performed using multiple unpaired t-tests. For the data comparison of the effect of X-ray and BNCT, a one-way ANOVA and Tukey’s test were used. The p-values < 0.05 and <0.01 were considered statistically significant.

3. Results

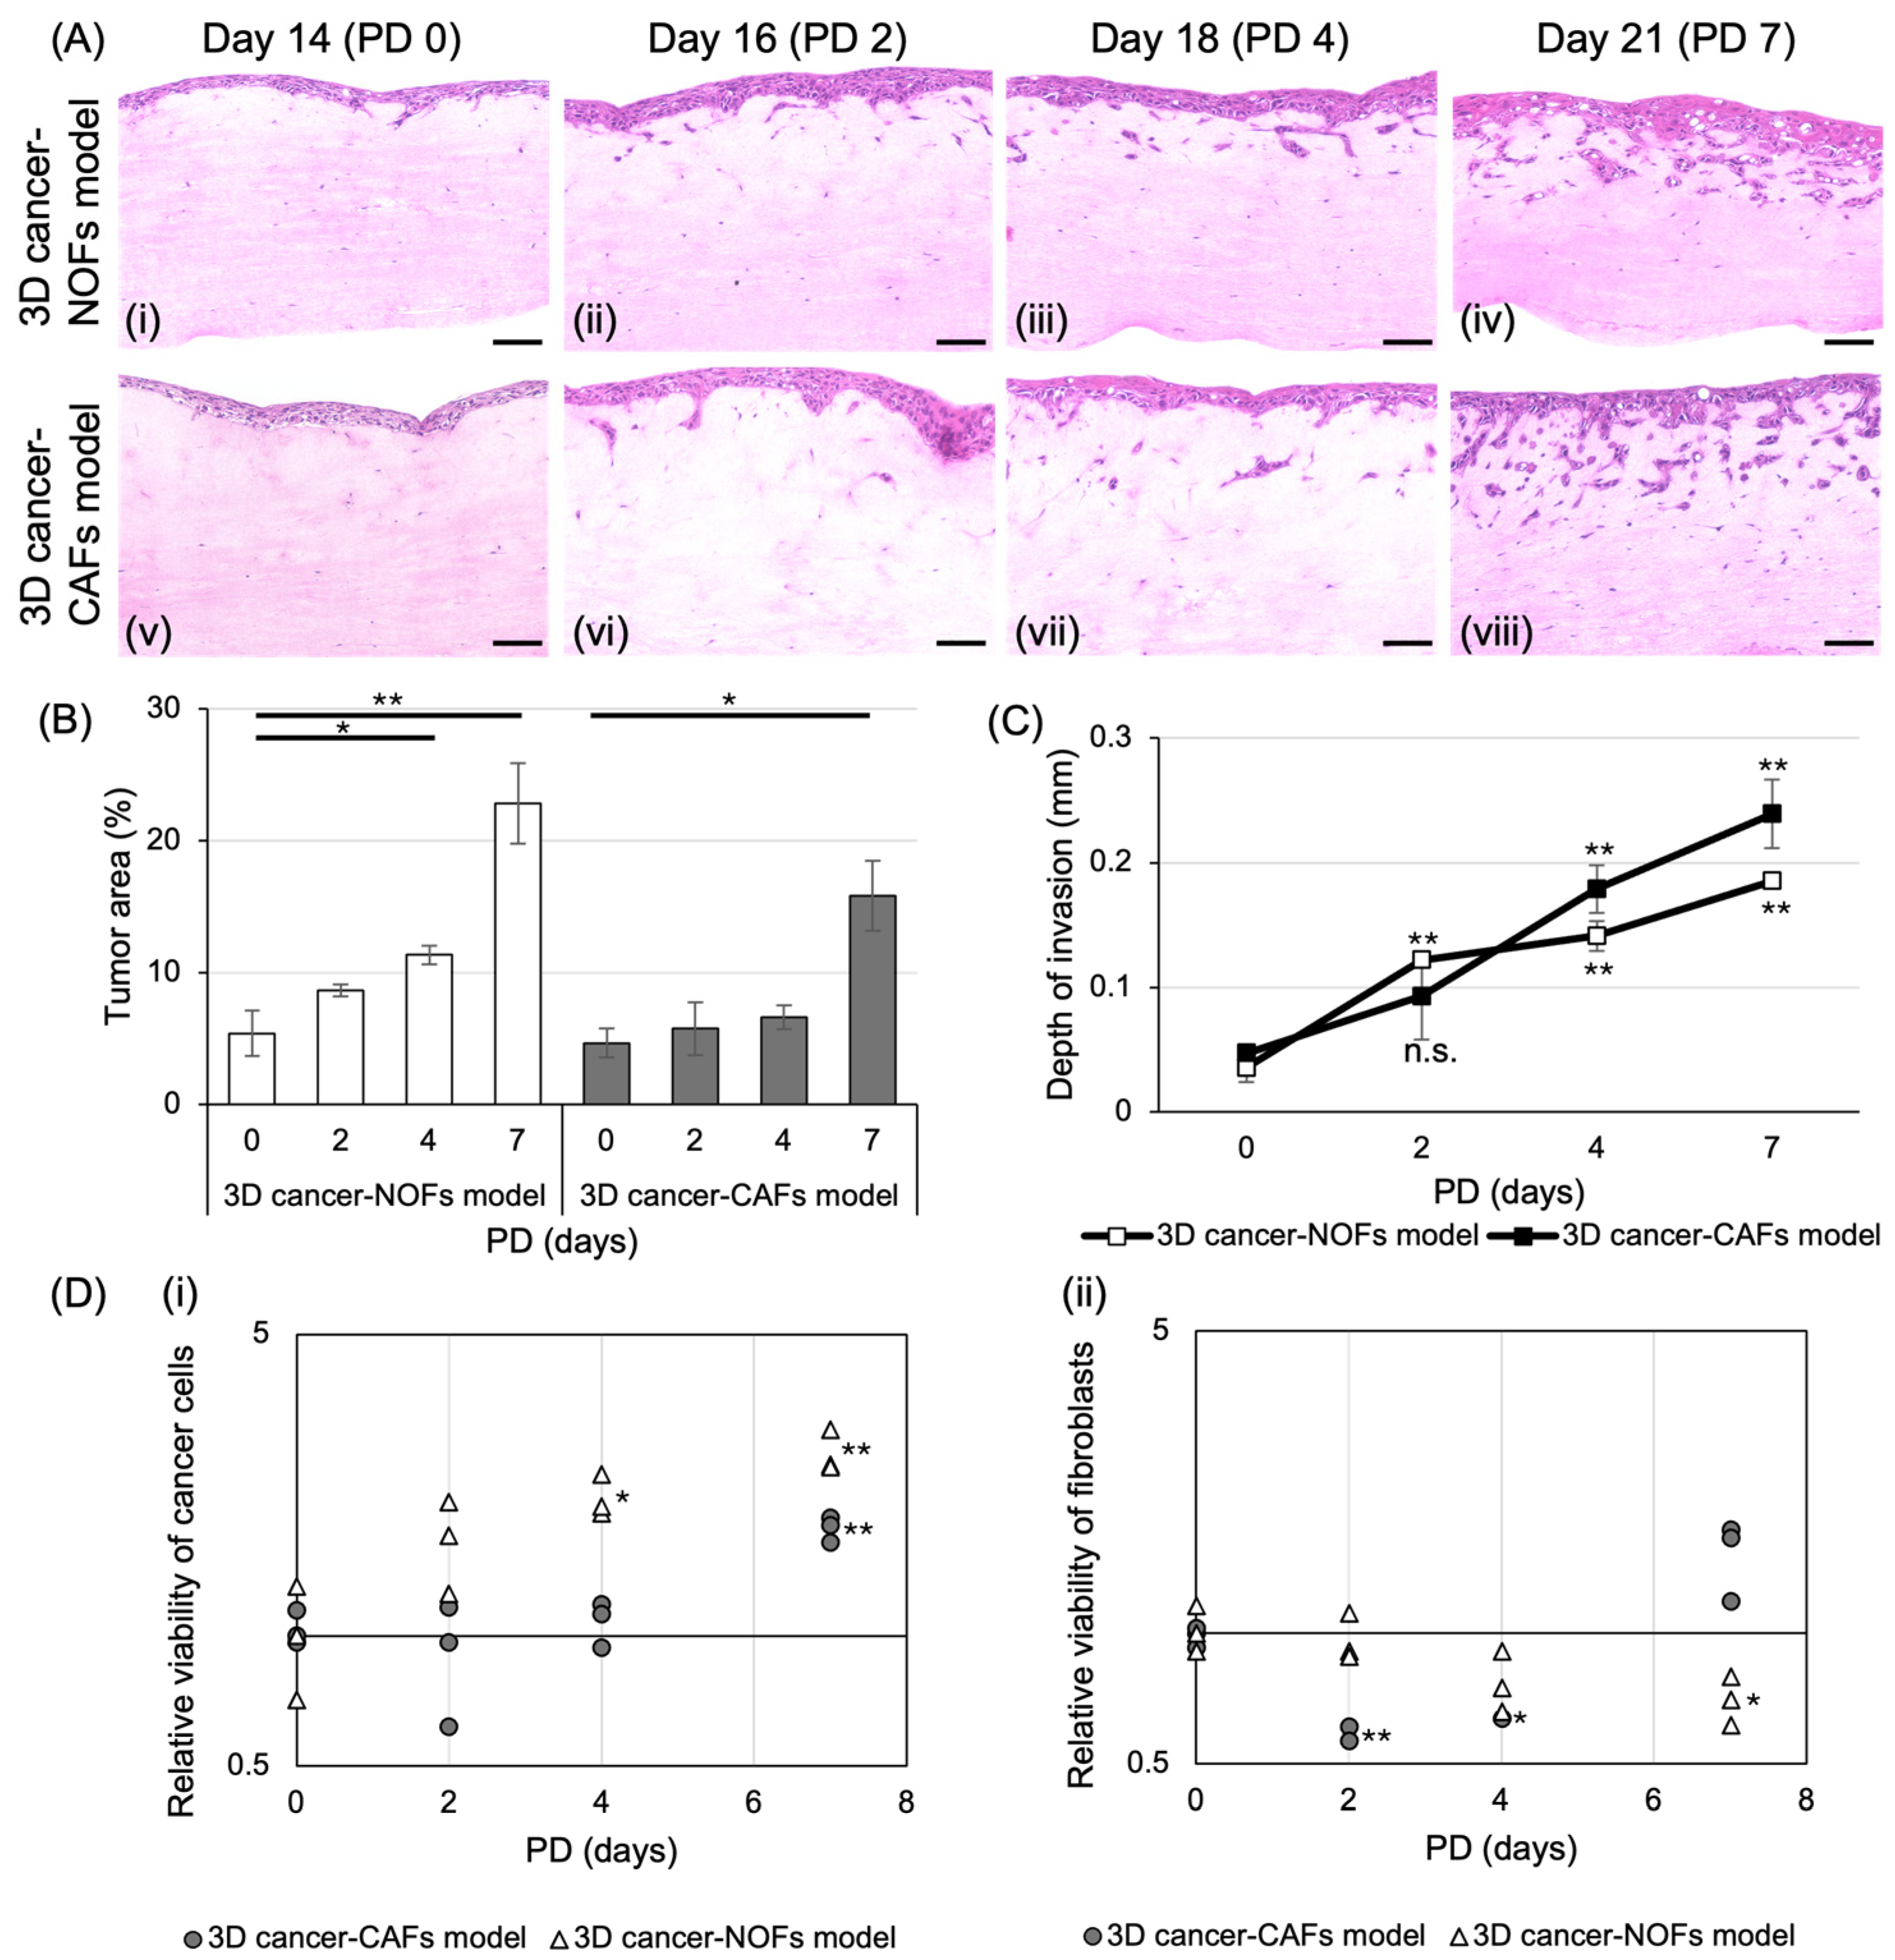
3.1. Fabrication of 3D Oral Cancer Models and Histological Evaluation

The 3D cancer-NOFs and 3D cancer-CAFs models were fabricated for histological evaluation. The histological examination showed the invasive proliferation of cancer cells over time (Figure 1A). The cancer cells formed a multilayer at PD 0, and the cancer cells started to infiltrate into the stromal layer after PD 2. The tumor area increased as time advanced for both models (Figure 1B). Although statistically not significant, there was an increasing trend of cancer cell invasion for both models (Figure 1C). For relative viability (Figure 1D), the median value of the PD 0 group was set to 1 and plotted on a logarithmic scale. In the 3D cancer-NOFs model, the relative viability of cancer cells increased over time. In contrast, in the 3D cancer-CAFs model, the relative viability of cancer cells remained unchanged until PD 4 and showed a slight increase at PD 7 (Figure 1D(i)). The relative viability of fibroblasts in both the 3D cancer-NOFs and 3D cancer-CAFs models exhibited a similar decreasing trend until PD 4; however, in the 3D cancer-CAFs model, the fibroblast viability increased at PD 7 (Figure 1D(ii)).

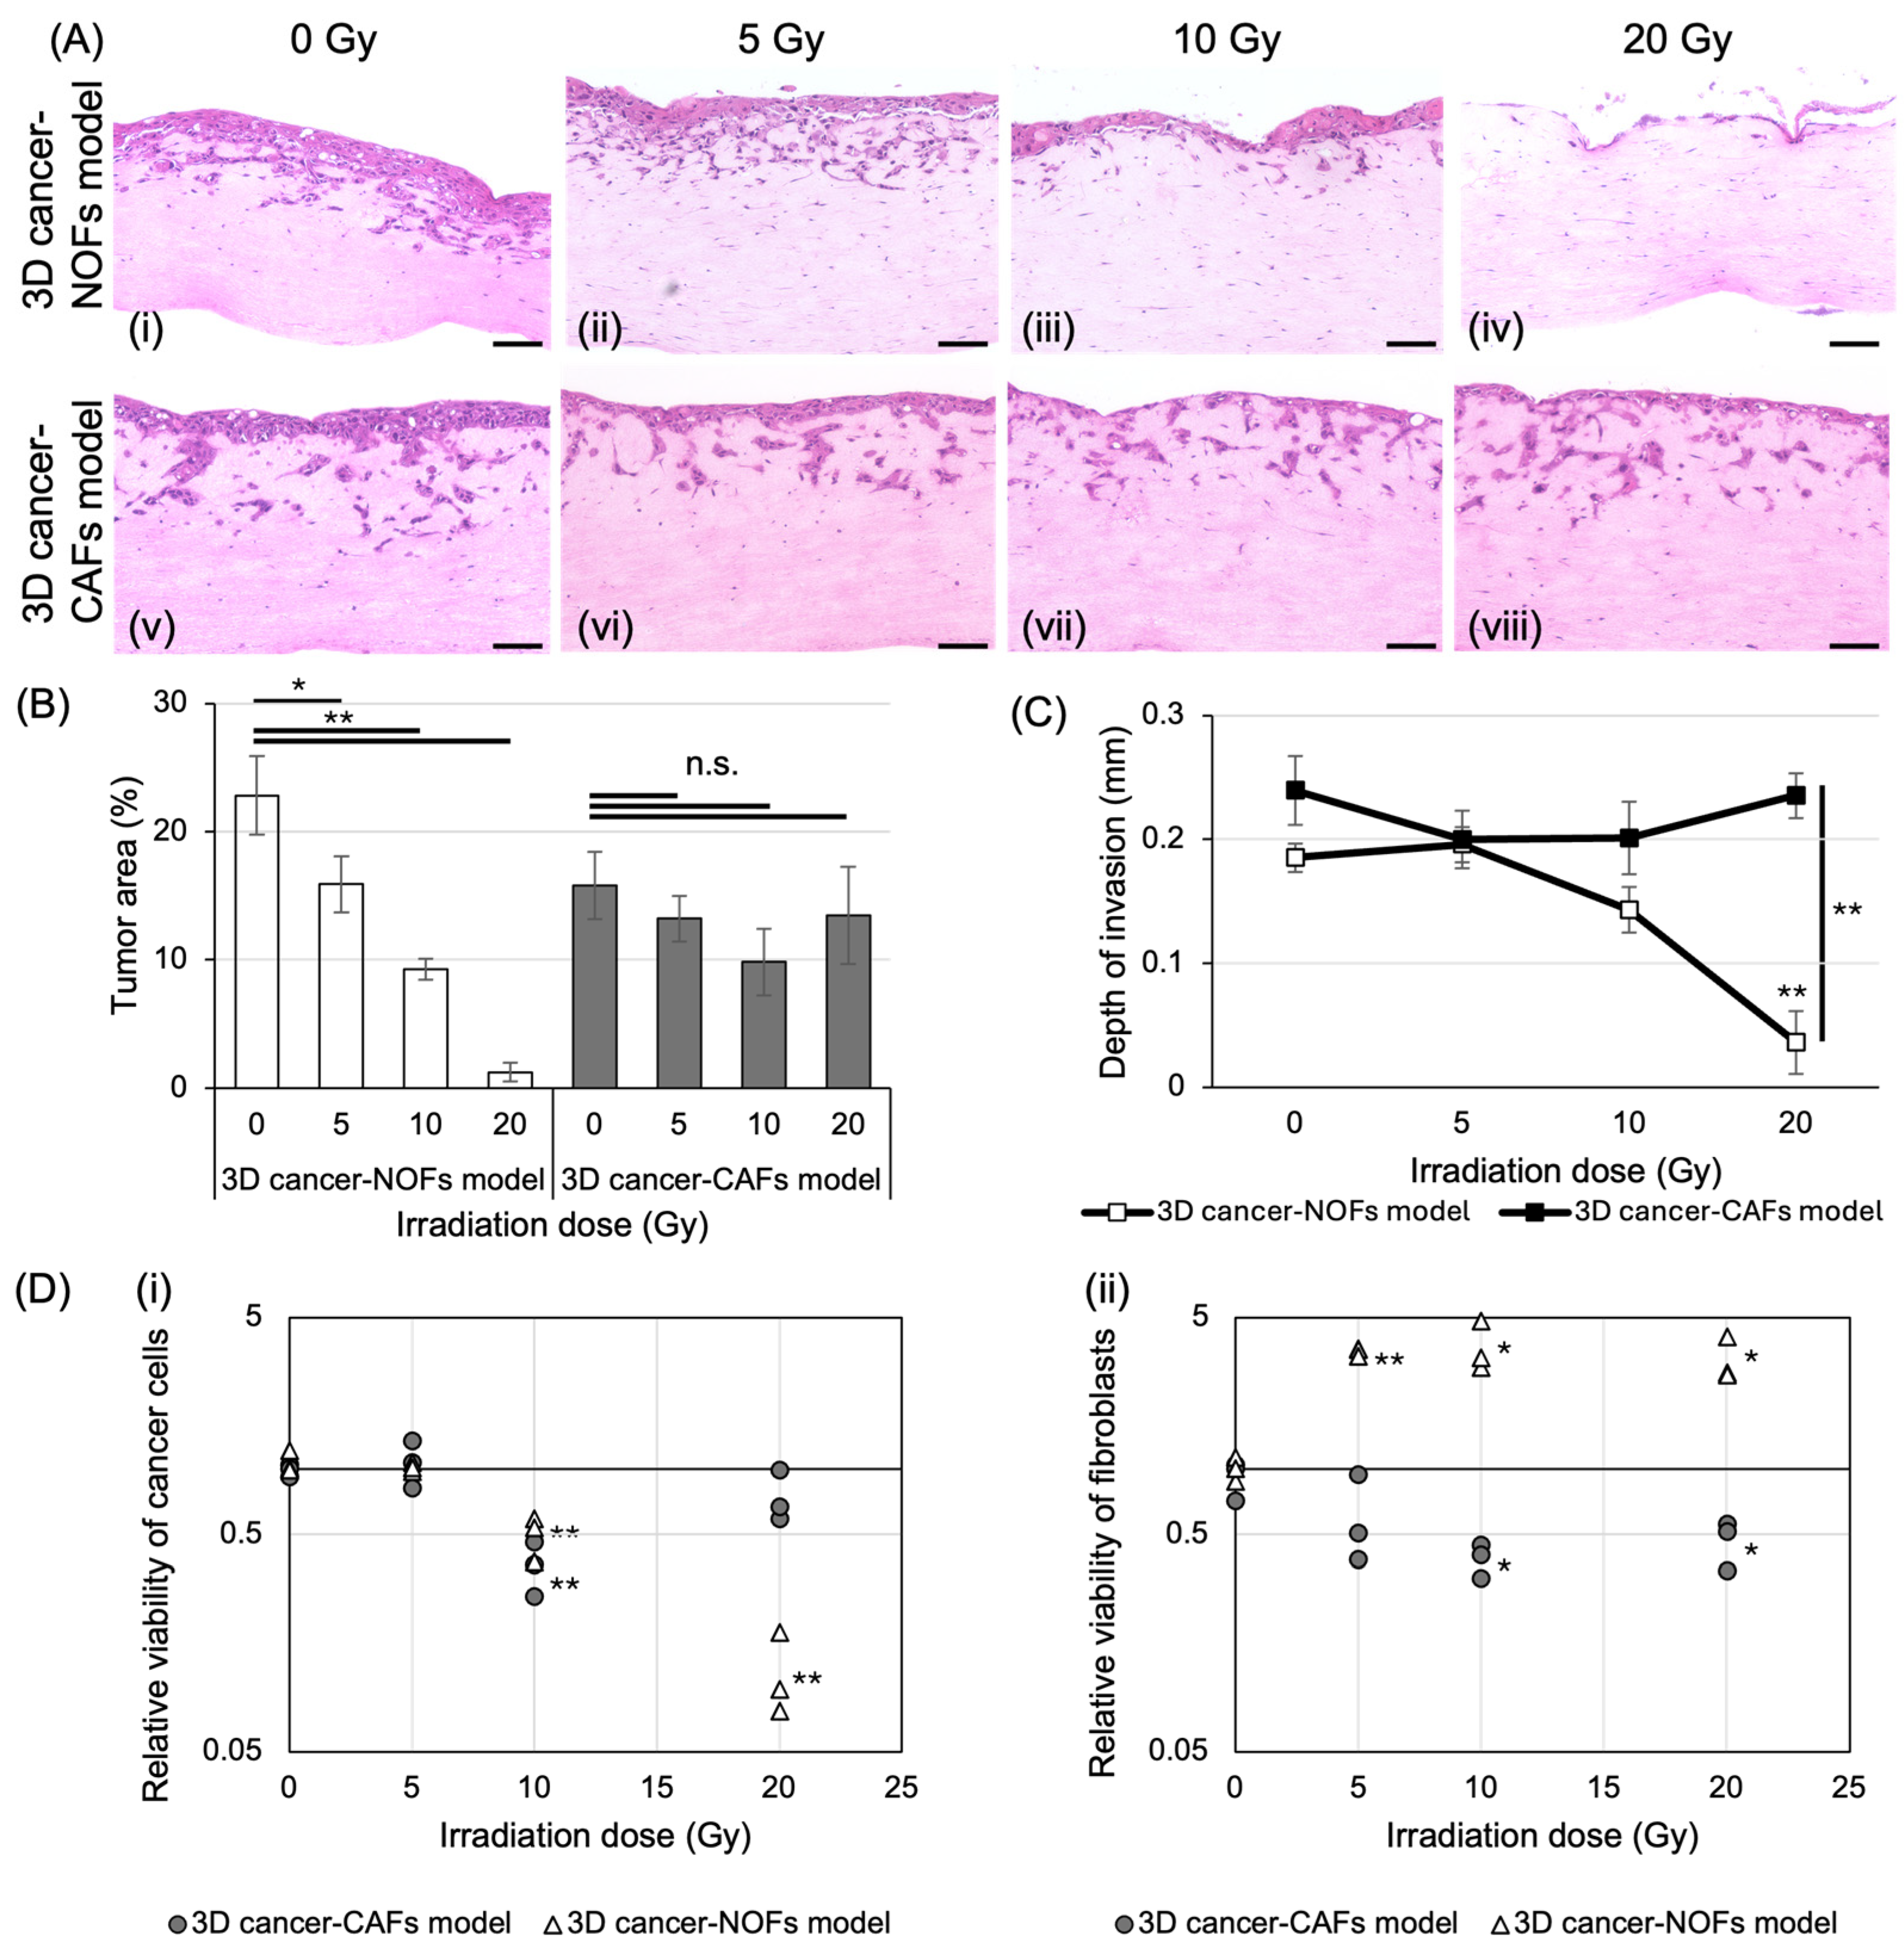
3.2. The Effect of X-Ray Irradiation on 3D Oral Cancer Models

The X-ray irradiations at 0, 5, 10, and 20 Gy were conducted for both the 3D cancer-NOFs and CAFs models, and a histological analysis was performed on the models collected on PD 7, which is five days after irradiation. The cancer cells formed a multilayer, but the layer became thinner as the irradiation dose increased (Figure 2A). The tumor area in the 3D cancer-NOFs model significantly decreased in an X-ray irradiation dose-dependent manner. In contrast, the tumor area in the 3D cancer-CAFs model showed no significant changes after X-ray irradiation (Figure 2B). The DOI of the NOFs model significantly decreased after irradiation at 20 Gy, while for the 3D cancer-CAFs model, X-ray irradiation seemed to be not effective for the invasion of cancer cells (p < 0.01 comparing the DOI of the 3D cancer-NOFs and CAFs models after receiving 20 Gy of X-ray irradiation), suggesting that X-ray irradiation is not effective for the cancer cell invasion of the 3D cancer-CAFs model (Figure 2C). For the relative viability of cancer cells, those in the 3D cancer-NOFs model decreased to 10% after irradiation at 20 Gy (Figure 2D(i)). In the 3D cancer-CAFs model, the relative viability decreased after 10 Gy of irradiation; however, no significant difference was observed at 20 Gy. For the relative viability of fibroblasts, irradiation had no significant effect on NOFs, whereas the relative viability of CAFs significantly decreased after irradiation at doses exceeding 10 Gy (Figure 2D(ii)).

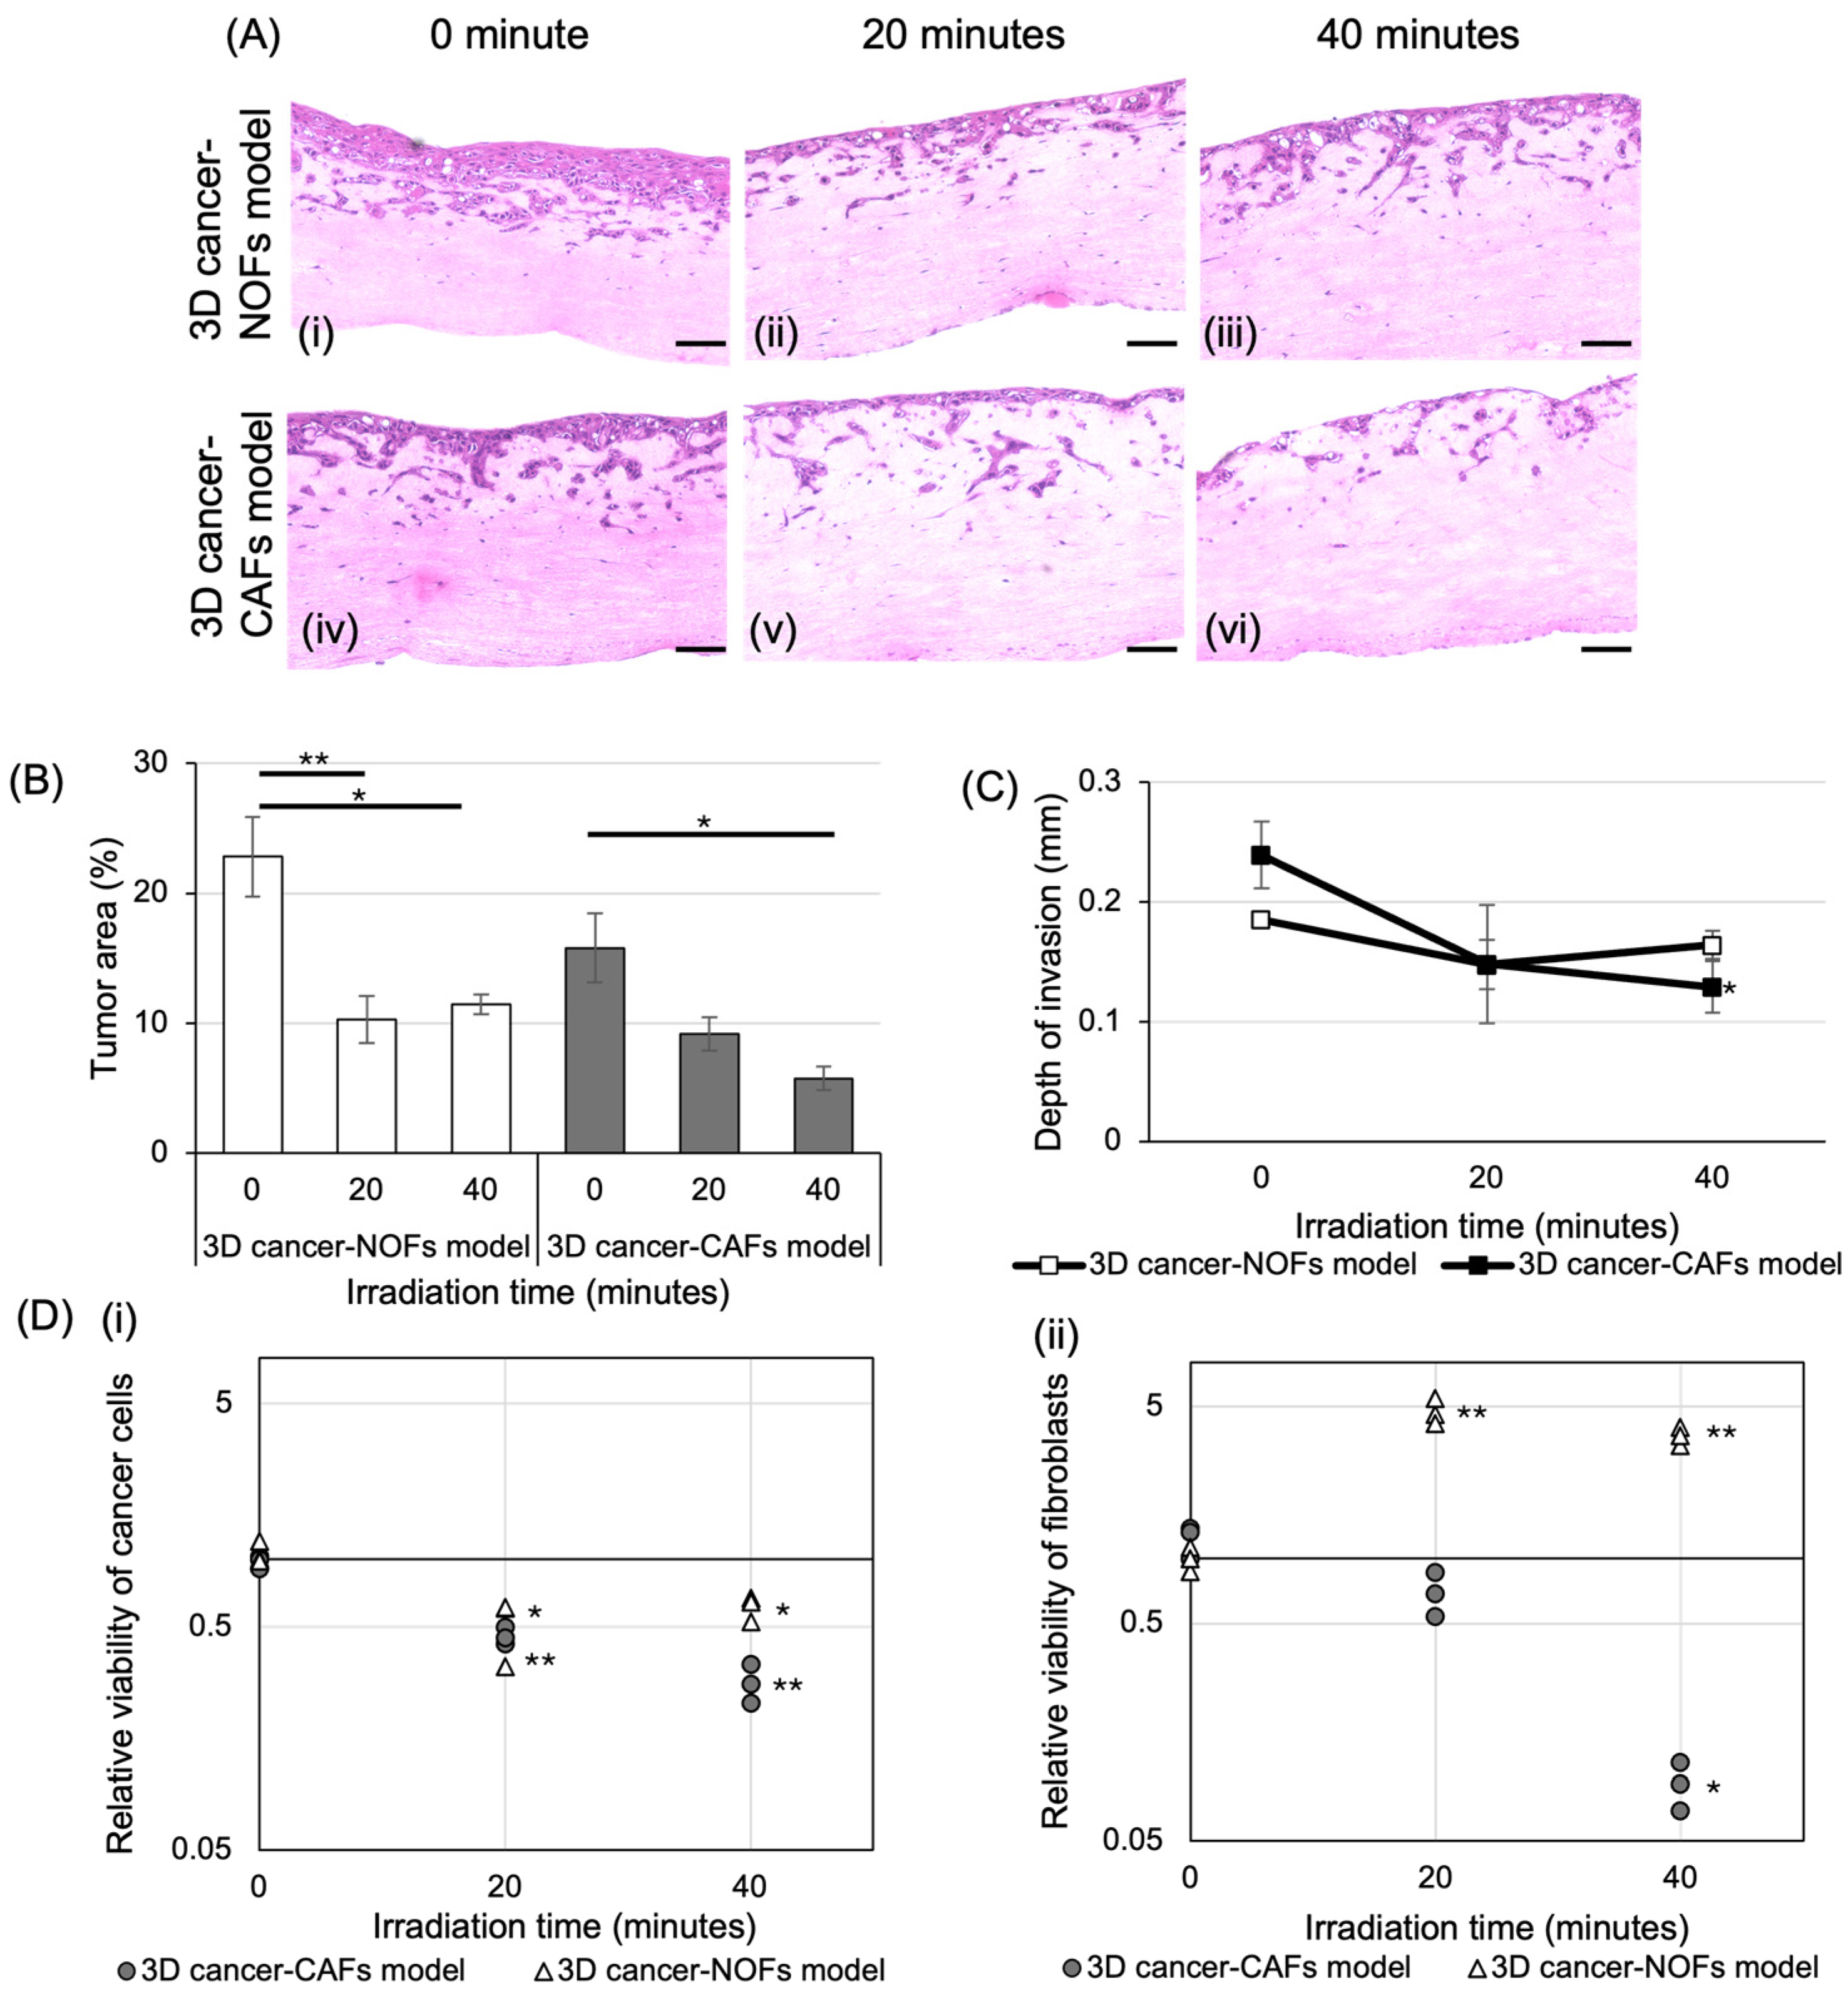
3.3. The Effect of BNCT on 3D Oral Cancer Models

On PD 2 (24 h after adding the boron drug), the boron concentrations of both the 3D cancer-NOFs and CAFs models were measured by ICP-MS, and the boron concentration of the 3D cancer-NOFs model was 53.91 ± 4.14 ppm, whereas that of the 3D cancer-CAFs model was 56.14 ± 6.24 ppm, which showed no statistically significant difference between the two models (Table 1). According to the boron concentration of each model, the irradiation time was calculated so that the tumor dose would be 10 and 20 Gy equivalent to the X-ray dose (Gy-eq), which was 20 and 40 min. The actual dose after 20 min of neutron beam irradiation was 8.71 ± 0.6 Gy-eq for the 3D cancer-NOFs model and 9.07 ± 1.01 Gy-eq for the 3D cancer-CAFs model. The actual dose after 40 min of neutron beam irradiation was 17.66 ± 1.36 Gy-eq for the 3D cancer-NOFs model and 18.38 ± 2.04 Gy-eq for the 3D cancer-CAFs model. These results were nearly equal to the planned dose. In addition, the dose is mainly the dose due to the nuclear reaction of boron-10 with thermal neutrons, but it also includes the dose due to the nuclear reaction of nitrogen with thermal neutrons, the dose due to the elastic scattering of hydrogen with fast neutrons, and the dose due to the mixed gamma rays.
Histologically, a similar trend of layer thinning observed after X-ray irradiation was also noted following BNCT (Figure 3A). The tumor area of the 3D cancer-NOFs model significantly decreased in an irradiation time-dependent manner, and the same can be said for the 3D cancer-CAFs model after irradiating for 40 min compared with 0 min (p < 0.05) (Figure 3B). The DOI in the 3D cancer-CAFs model decreased by 40% (p < 0.05) after an irradiation of 40 min compared with 0 min (Figure 3C). The relative viability of cancer cells significantly decreased in both models (Figure 3D(i)). In contrast, the relative viability of fibroblasts increased in the 3D cancer-NOFs model but decreased in the 3D cancer-CAFs model (Figure 3D(ii)).

3.4. Comparison of the Effect of X-Ray and BNCT

In the 3D cancer-NOFs model, the number of cancer cells significantly decreased after conducting both X-ray irradiation and BNCT. The same trend was observed in the 3D cancer-CAFs model as well, but after irradiating at 20 Gy-eq, BNCT was more effective for cancer cells in the 3D cancer-CAFs model, whereas X-ray was more effective for that in the 3D cancer-NOFs model (Figure 4A). A significant difference in the number of fibroblasts was not observed in the 3D cancer-NOFs model after any radiation therapy at any dose. However, in the 3D cancer-CAFs model, the number of fibroblasts significantly decreased after irradiation, and after irradiating at 20 Gy-eq, BNCT was more effective compared to the X-ray irradiation (Figure 4B).

4. Discussion

The tumor microenvironment is composed of cellular components, including cancer cells and fibroblasts, as well as ECM components. This environment contributes to cancer invasion, metastasis, and malignant progression. Among these components, CAFs affect cancer cell proliferation and metastasis through cell-to-cell contact and the production of various humoral factors. It has been reported that the invasion of CAFs correlates with prognosis in various carcinomas, including head and neck cancer, lung cancer, and colorectal cancer [18]. CAFs play an important role in regulating the composition and tissue microstructure of the TME and are also the cells responsible for remodeling the interstitial collagen [19]. Furthermore, ECM, which is primarily composed of collagen, plays a pivotal role in cancer progression. It is becoming increasingly evident that the collagen present in the stroma exerts a substantial influence on tumor formation. Therefore, since CAFs promote tumor formation and also affect responses to treatment, we fabricated a 3D oral cancer model through the co-culture of patient-derived CAFs in the interstitial collagen and a human oral squamous cell carcinoma cell line and examined the effect of CAFs on radiation cancer therapy from a histomorphological perspective. The seeding of CAFs into the cancer stroma enabled the fabrication of a highly malignant 3D oral cancer model, exhibiting a significant increase in both the number of cancer cells and cancer invasion over time (Figure 1).
In recent years, radiation therapy using alpha rays, which has a high therapeutic effect against cancer and a few side effects on the surrounding normal cells, has attracted attention, and BNCT for head and neck cancer is one example of its clinical application. However, there are few reports on the mechanism of BNCT [9]. Therefore, we considered that the role of CAFs in the cancer stroma was related to efficacy, and we conducted a comparative analysis with a conventional X-ray treatment. We then evaluated the radiation response of CAFs using a 3D model. Following X-ray treatment of 3D oral cancer models, the 3D cancer-NOFs model demonstrated a reduction in the number of cancer cells and cancer invasion with increasing the irradiation dose. In contrast, the 3D cancer-CAFs model exhibited radioresistance, with a minimal change in the number of cancer cells and cancer invasion with increasing the irradiation dose, although the number of CAFs decreased after the irradiation (Figure 2). These data using the 3D oral cancer-CAFs model are similar to the clinical data showing that CAFs within the cancer stroma are responsible for the regrowth of cancer cells and the adverse events observed following conventional radiotherapy for cancer [1,20]. Conversely, following the BNCT treatment, which is anticipated to be a novel radiotherapy for the 3D oral cancer model, the 3D cancer-NOFs model demonstrated a reduction in cancer cell numbers and cancer invasion with increasing the neutron dose, while NOFs remained unaltered. This is in accordance with reports of reduced damage to normal tissue in human clinical practice [21]. Furthermore, the 3D cancer-CAFs model exhibited a reduction in the number of cancer cells, cancer invasiveness, and CAFs with increasing the neutron dose, indicating that the therapeutic efficacy of BNCT can be achieved even in cancers infiltrated by CAFs with a poor prognosis (Figure 3). The results of this BNCT in the 3D cancer-CAFs model are similar to the results of BNCT in organoids, animals, and humans [22,23,24]. The bystander effects of BNCT are not well understood, and using 3D oral cancer models will facilitate the investigation of the interaction between CAFs and tumor cells in particular [25]. In the future, the research using 3D oral cancer models will be continued with a focus on the alterations in cell proliferation and cell death immediately following BNCT. The findings of this study offer valuable insights into the mechanisms of cancer invasion following radiotherapy of CAFs using a 3D oral cancer model. However, given the reported association between CAFs and radiation-induced carcinogenesis [26] and the transformation of NOFs to CAFs in esophageal cancer [27], long-term follow-ups using the 3D model are anticipated in future studies.
In head and neck cancer, a minimally invasive cancer treatment including BNCT has been developed. However, the development of radiation evaluation systems as a novel prescreening approach is not progressing in comparison with the development of drug evaluation systems that determine dosage and usage [28]. In addition, the combination of radiation therapy and immune checkpoint inhibitors, which can be expected to have an abscopal effect due to the development of immune checkpoint inhibitors, has been developed [29]. However, because there are many questions regarding the optimal dose fractionation, total dose, and timing of combination therapy with immune checkpoint inhibitors and radiation therapy, an optimal evaluation model for preclinical studies is required. In preclinical models, such as 2D cell culture models and animal models, there are discrepancies between the results of preclinical research and those of clinical research. This is due to the use of repeated passage cell lines that have lost their original biological characteristics in 2D cell culture models and the use of immunodeficient mice that do not reproduce cancer stroma like human cancer tissues in animal models [30]. Consequently, there is a necessity for co-clinical trials that directly compare the results of preclinical research and clinical research. In addition, the utilization of 3D-cultured patient-derived cells and organoids is anticipated to facilitate the development of models that more closely resemble the biological characteristics of cancer patients [31]. Currently, there is considerable debate among researchers regarding the optimal use of these models for co-clinical trials, and the establishment of a strategic research system is, therefore, imperative. This study proposes that the efficacy and safety of cancer treatments can be evaluated using 3D models that accurately reproduce the human cancer microenvironment, thereby accelerating the clinical application of cancer treatment research and development. In the future, we aim to generate data on the efficacy and safety of radiotherapy using 3D models, such as the 3D organotypic in vitro oral cancer model with four co-cultured cell types [12], which reproduces normal tissue around cancer, and oral cancer models with a vascular network [32], and to create a radiotherapy evaluation system that can biologically evaluate dose and irradiation methods.

5. Conclusions

A 3D oral cancer model was fabricated to replicate the proliferation and invasion of cancer cells through the co-culture of patient-derived CAFs in the interstitial collagen and a human oral squamous cell. The early response of BNCT on the 3D oral cancer-CAFs model showed a reduction in the number of cancer cells and CAFs, as well as in cancer invasiveness, with increasing the neutron dose, similar to those observed in human clinical studies. This study indicated that the 3D oral cancer-CAFs model is a valuable tool for cancer treatment research and evaluation, particularly for studying cancer progression. Furthermore, the 3D oral cancer model is considered useful as a preclinical trial for cancer treatment development.

Author Contributions

Conceptualization, K.I. (Kazuyo Igawa) and K.I. (Kenji Izumi); methodology, K.I. (Kazuyo Igawa) and Y.S.; software, I.Y. and Y.S.; validation, I.Y. and Y.S.; formal analysis, I.Y. and N.K.; investigation, I.Y., N.K., P.H. and H.M.; resources, A.F., K.T. and K.I. (Kenji Izumi); data curation, I.Y. and Y.S.; writing—original draft preparation, I.Y. and K.I. (Kazuyo Igawa); writing—review and editing, K.I. (Kazuyo Igawa), Y.S. and K.I. (Kenji Izumi); visualization, I.Y.; supervision, K.I. (Kazuyo Igawa) and K.I. (Kenji Izumi); project administration, K.I. (Kazuyo Igawa); funding acquisition, K.I. (Kazuyo Igawa) and S.I. All authors have read and agreed to the published version of the manuscript.

Funding

This research was supported by JSPS KAKENHI, grant number 23K11918.

Institutional Review Board Statement

This study was conducted in accordance with the Declaration of Helsinki and approved by the Ethical Committee of Niigata University (Approval #2022-0300).

Informed Consent Statement

Informed consent was obtained from all subjects involved in the study.

Data Availability Statement

The raw data supporting the conclusions of this article will be made available by the authors on request.

Acknowledgments

We would like to thank all the staff at the Institute of Central Research Laboratory, Okayama University Medical School, for the assistance with the histological analysis; the Advanced Science Research Center, Okayama University, for the use of the X-ray irradiation equipment; the Institute of Plant Science and Resources, Okayama University, for the assistance with the ICP-MS analysis; and the Institute for Integrated Radiation and Nuclear Science, Kyoto University, for their technical assistance during the irradiation.

Conflicts of Interest

The authors declare no conflicts of interest.

References

  1. Zhang, Y.; Lv, N.; Li, M.; Liu, M.; Wu, C. Cancer-associated fibroblasts: Tumor defenders in radiation therapy. Cell Death Dis. 2023, 14, 541. [Google Scholar] [CrossRef] [PubMed]
  2. Bienkowska, K.J.; Hanley, C.J.; Thomas, G.J. Cancer-Associated Fibroblasts in Oral Cancer: A Current Perspective on Function and Potential for Therapeutic Targeting. Front. Oral Health 2021, 2, 686337. [Google Scholar] [CrossRef] [PubMed]
  3. Arebro, J.; Lee, C.M.; Bennewith, K.L.; Garnis, C. Cancer-Associated Fibroblast Heterogeneity in Malignancy with Focus on Oral Squamous Cell Carcinoma. Int. J. Mol. Sci. 2024, 25, 1300. [Google Scholar] [CrossRef] [PubMed]
  4. El Herch, I.; Tornaas, S.; Dongre, H.N.; Costea, D.E. Heterogeneity of cancer-associated fibroblasts and tumor-promoting roles in head and neck squamous cell carcinoma. Front. Mol. Biosci. 2024, 11, 1340024. [Google Scholar] [CrossRef]
  5. Piper, M.; Mueller, A.C.; Karam, S.D. The interplay between cancer associated fibroblasts and immune cells in the context of radiation therapy. Mol. Carcinog. 2020, 59, 754–765. [Google Scholar] [CrossRef]
  6. Barker, H.E.; Paget, J.T.; Khan, A.A.; Harrington, K.J. The tumour microenvironment after radiotherapy: Mechanisms of resistance and recurrence. Nat. Rev. Cancer 2015, 15, 409–425. [Google Scholar] [CrossRef]
  7. Monti Hughes, A.; Hu, N. Optimizing Boron Neutron Capture Therapy (BNCT) to Treat Cancer: An Updated Review on the Latest Developments on Boron Compounds and Strategies. Cancers 2023, 15, 4091. [Google Scholar] [CrossRef]
  8. Wang, S.; Zhang, Z.; Miao, L.; Li, Y. Boron Neutron Capture Therapy: Current Status and Challenges. Front. Oncol. 2022, 12, 788770. [Google Scholar] [CrossRef]
  9. Takeno, S.; Yoshino, Y.; Aihara, T.; Higashino, M.; Kanai, Y.; Hu, N.; Kakino, R.; Kawata, R.; Nihei, K.; Ono, K. Preliminary outcomes of boron neutron capture therapy for head and neck cancers as a treatment covered by public health insurance system in Japan: Real-world experiences over a 2-year period. Cancer Med. 2024, 13, e7250. [Google Scholar] [CrossRef]
  10. Fontana, F.; Marzagalli, M.; Sommariva, M.; Gagliano, N.; Limonta, P. In Vitro 3D Cultures to Model the Tumor Microenvironment. Cancers 2021, 13, 2970. [Google Scholar] [CrossRef]
  11. Wishart, G.; Gupta, P.; Schettino, G.; Nisbet, A.; Velliou, E. 3D tissue models as tools for radiotherapy screening for pancreatic cancer. Br. J. Radiol. 2021, 94, 20201397. [Google Scholar] [CrossRef] [PubMed]
  12. Aizawa, Y.; Haga, K.; Yoshiba, N.; Yortchan, W.; Takada, S.; Tanaka, R.; Naito, E.; Abé, T.; Maruyama, S.; Yamazaki, M.; et al. Development and Characterization of a Three-Dimensional Organotypic In Vitro Oral Cancer Model with Four Co-Cultured Cell Types, Including Patient-Derived Cancer-Associated Fibroblasts. Biomedicines 2024, 12, 2373. [Google Scholar] [CrossRef]
  13. Naito, E.; Igawa, K.; Takada, S.; Haga, K.; Yortchan, W.; Suebsamarn, O.; Kobayashi, R.; Yamazaki, M.; Tanuma, J.I.; Hamano, T.; et al. The effects of carbon-ion beam irradiation on three-dimensional in vitro models of normal oral mucosa and oral cancer: Development of a novel tool to evaluate cancer therapy. In Vitro Cell. Dev. Biol. Anim. 2024, 60, 1184–1199. [Google Scholar] [CrossRef] [PubMed]
  14. Igawa, K.; Izumi, K.; Sakurai, Y. Development of the Follow-Up Human 3D Oral Cancer Model in Cancer Treatment. BioTech 2023, 12, 35. [Google Scholar] [CrossRef] [PubMed]
  15. Sakurai, Y.; Kobayash, T. Spectrum evaluation at the filter-modified neutron irradiation field for neutron capture therapy in Kyoto University Research Reactor. Nucl. Instrum. Methods Phys. Res. A 2004, 531, 585–595. [Google Scholar] [CrossRef]
  16. Sakurai, Y.; Kobayashi, T. Characteristics of the KUR Heavy Water Neutron Irradiation Facility as a neutron irradiation field with variable energy spectra. Nucl. Instrum. Methods Phys. Res. Sect. A Accel. Spectrometers Detect. Assoc. Equip. 2000, 453, 569–596. [Google Scholar] [CrossRef]
  17. Sercombe, L.; Igawa, K.; Izumi, K. Radiation evaluation assay using a human three-dimensional oral cancer model for clinical radiation therapy. Talanta Open 2024, 9, 100297. [Google Scholar] [CrossRef]
  18. Mao, X.; Xu, J.; Wang, W.; Liang, C.; Hua, J.; Liu, J.; Zhang, B.; Meng, Q.; Yu, X.; Shi, S. Crosstalk between cancer-associated fibroblasts and immune cells in the tumor microenvironment: New findings and future perspectives. Mol. Cancer 2021, 20, 131. [Google Scholar] [CrossRef]
  19. Nissen, N.I.; Karsdal, M.; Willumsen, N. Collagens and Cancer associated fibroblasts in the reactive stroma and its relation to Cancer biology. J. Exp. Clin. Cancer Res. 2019, 38, 115. [Google Scholar] [CrossRef]
  20. Zhang, Z.; Dong, Y.; Wu, B.; Li, Y.; Liu, Z.; Gao, Y.; Gao, L.; Song, Q.; Zheng, Z.; Yao, Y. Irradiation enhances the malignancy-promoting behaviors of cancer-associated fibroblasts. Front. Oncol. 2022, 12, 965660. [Google Scholar] [CrossRef]
  21. Sato, M.; Hirose, K.; Takeno, S.; Aihara, T.; Nihei, K.; Takai, Y.; Hayashi, T.; Bando, K.; Kimura, H.; Tsurumi, K.; et al. Safety of Boron Neutron Capture Therapy with Borofalan(10B) and Its Efficacy on Recurrent Head and Neck Cancer: Real-World Outcomes from Nationwide Post-Marketing Surveillance. Cancers 2024, 16, 869. [Google Scholar] [CrossRef] [PubMed]
  22. Yu, L.-Y.; Hsu, C.-H.; Li, C.-Y.; Hong, S.-Y.; Chen, C.-R.; Chen, C.-S. Evaluating the biological effectiveness of boron neutron capture therapy by using microfluidics-based pancreatic tumor spheroids. Analyst 2023, 148, 3045–3056. [Google Scholar] [CrossRef]
  23. Yu, L.S.; Jhunjhunwala, M.; Hong, S.Y.; Yu, L.Y.; Lin, W.R.; Chen, C.S. Tissue Architecture Influences the Biological Effectiveness of Boron Neutron Capture Therapy in In Vitro/In Silico Three-Dimensional Self-Assembly Cell Models of Pancreatic Cancers. Cancers 2021, 13, 4058. [Google Scholar] [CrossRef] [PubMed]
  24. Yura, Y.; Fujita, Y. Boron neutron capture therapy as a novel modality of radiotherapy for oral cancer: Principle and antitumor effect. Oral Sci. Int. 2013, 10, 9–14. [Google Scholar]
  25. Martinez-Zubiaurre, I.; Hellevik, T. Cancer-associated fibroblasts in radiotherapy: Bystanders or protagonists? Cell Commun. Signal. 2023, 21, 108. [Google Scholar] [CrossRef]
  26. Berzaghi, R.; Gundersen, K.; Dille Pedersen, B.; Utne, A.; Yang, N.; Hellevik, T.; Martinez-Zubiaurre, I. Immunological signatures from irradiated cancer-associated fibroblasts. Front. Immunol. 2024, 15, 1433237. [Google Scholar] [CrossRef]
  27. Tanaka, K.; Miyata, H.; Sugimura, K.; Fukuda, S.; Kanemura, T.; Yamashita, K.; Miyazaki, Y.; Takahashi, T.; Kurokawa, Y.; Yamasaki, M.; et al. miR-27 is associated with chemoresistance in esophageal cancer through transformation of normal fibroblasts to cancer-associated fibroblasts. Carcinogenesis 2015, 36, 894–903. [Google Scholar] [CrossRef]
  28. Engrácia, D.M.; Pinto, C.I.G.; Mendes, F. Cancer 3D Models for Metallodrug Preclinical Testing. Int. J. Mol. Sci. 2023, 24, 11915. [Google Scholar] [CrossRef]
  29. De Felice, F.; Musio, D.; Tombolini, V. Immune Check-Point Inhibitors and Standard Chemoradiotherapy in Definitive Head and Neck Cancer Treatment. J. Pers. Med. 2021, 11, 393. [Google Scholar] [CrossRef]
  30. Manduca, N.; Maccafeo, E.; De Maria, R.; Sistigu, A.; Musella, M. 3D cancer models: One step closer to in vitro human studies. Front. Immunol. 2023, 14, 1175503. [Google Scholar] [CrossRef]
  31. Jubelin, C.; Muñoz-Garcia, J.; Griscom, L.; Cochonneau, D.; Ollivier, E.; Heymann, M.F.; Vallette, F.M.; Oliver, L.; Heymann, D. Three-dimensional in vitro culture models in oncology research. Cell Biosci. 2022, 12, 155. [Google Scholar] [CrossRef] [PubMed]
  32. Bessho, T.; Takagi, T.; Igawa, K.; Sato, K. Gelatin-based cell culture device for construction and X-ray irradiation of a three-dimensional oral cancer model. Anal. Sci. 2023, 39, 771–778. [Google Scholar] [CrossRef] [PubMed]
Figure 1. Histological analysis of a 3D oral cancer model. (A) Representative histological images of 3D cancer-NOFs model (iiv) and 3D cancer-CAFs model (vviii) at PD 0 (i,v), 2 (ii,vi), 4 (iii,vii), and 7 (iv,viii). HE staining. Scale bar = 100 μm. (B) Comparison of the tumor area of the 3D cancer-NOFs model and the 3D cancer-CAFs model at PD 0, 2, 4, and 7. Data are expressed as the mean ± SD. (C) Comparison of DOI at PD 0. Data are expressed as the mean ± SD. (D) Relative viability after starting incubation at the air–liquid interface. (i) shows the relative viability of cancer cells, whereas (ii) shows the relative viability of fibroblasts. The data are shown as three points representing the three values obtained. For (BD), n.s. (not significant), p > 0.05, * p < 0.05, ** p < 0.01, multiple unpaired t-tests, compared to PD 0 (N = 3).
Ijtm 05 00012 g001
Figure 2. Histological analysis of a 3D oral cancer model after X-ray irradiation. (A) Representative histological images of the 3D cancer-NOFs model (iiv) and the 3D cancer-CAFs model (vviii) at 5 days post-X-ray irradiation of 0 (i,v), 5 (ii,vi), 10 (iii,vii), and 20 (iv,viii) Gy. HE staining. Scale bar = 100 μm. (B) Comparison of tumor area of the 3D cancer-NOFs and CAFs models after X-ray irradiation (0, 5, 10, and 20 Gy). Data are expressed as the mean ± SD. (C) Comparison of DOI after X-ray irradiation (0, 5, 10, and 20 Gy). Data are expressed as the mean ± SD. (D) Relative viability after X-ray irradiation (0, 5, 10, and 20 Gy). (i) shows the relative viability of cancer cells in the 3D cancer-NOFs and CAFs models, whereas (ii) shows that of fibroblasts in the 3D cancer-NOFs and CAFs models. The data are shown as three points representing the three values obtained. For (BD), n.s. (not significant), p > 0.05, * p < 0.05, ** p < 0.01, multiple unpaired t-tests, compared to 0 Gy (N = 3). For (C), ** p < 0.01, multiple unpaired t-tests, comparing the 3D cancer-NOFs and CAFs models (N = 3).
Ijtm 05 00012 g002
Figure 3. Histological assays of a 3D oral cancer model after BNCT. (A) Representative histological images of the 3D cancer-NOFs model (iiii) and the 3D cancer-CAFs model (ivvi) at 5 days after 0 (i,iv), 20 (ii,v), and 40 (iii,vi) minutes of neutron irradiation. HE staining. Scale bar = 100 μm. (B) Comparison of tumor area of the 3D cancer-NOFs model and the 3D cancer-CAFs model after neutron irradiation. Data are expressed as the mean ± SD. (C) Comparison of DOI after neutron beam irradiation (0, 20, and 40 min). Data are expressed as the mean ± SD. (D) Relative viability after neutron irradiation (0, 20, and 40 min). (i) shows the relative viability of cancer cells in the 3D cancer-NOFs and CAFs models, whereas (ii) shows that of fibroblasts in the 3D cancer-NOFs and CAFs models. The data are shown as three points representing the three values obtained. For (BD), * p < 0.05, ** p < 0.01, multiple unpaired t-tests, compared to 0 min (N = 3).
Ijtm 05 00012 g003
Figure 4. Comparison of radiation effects. (A) Comparison of the number of cancer cells in the 3D cancer-NOFs and CAFs models after treatment with either X-ray or BNCT at 10 or 20 Gy. (B) Comparison of cancer cell number of the 3D cancer-NOFs and CAFs models after treatment with either X-ray or BNCT at 10 or 20 Gy. n.s. (not significant), p > 0.05, * p < 0.05, ** p < 0.01, a one-way ANOVA, and Tukey’s test, compared to control (N = 3).
Ijtm 05 00012 g004
Table 1. Total dose of the 3D oral cancer model after 20 and 40 min of neutron beam irradiation.
Irradiation TimeType of ModelBoron Concentration (ppm)Thermal Neutron Fluence (cm−2)Total Dose (Gy-eq)
0 min3D cancer-NOFs model53.91 ± 4.1400
3D cancer-CAFs model56.14 ± 6.2400
20 min3D cancer-NOFs model53.91 ± 4.142.21 × 10128.71 ± 0.67
3D cancer-CAFs model56.14 ± 6.242.21 × 10129.07 ± 1.01
40 min3D cancer-NOFs model53.91 ± 4.144.48 × 101217.66 ± 1.36
3D cancer-CAFs model56.14 ± 6.244.48 × 101218.38 ± 2.04
Disclaimer/Publisher’s Note: The statements, opinions and data contained in all publications are solely those of the individual author(s) and contributor(s) and not of MDPI and/or the editor(s). MDPI and/or the editor(s) disclaim responsibility for any injury to people or property resulting from any ideas, methods, instructions or products referred to in the content.

