
Potential Translational Thioflavin T Methodology as a Complement of Cell-Based Assays and after Drug Exposition


Abstract
:1. Introduction
2. Materials and Methods
2.1. Materials
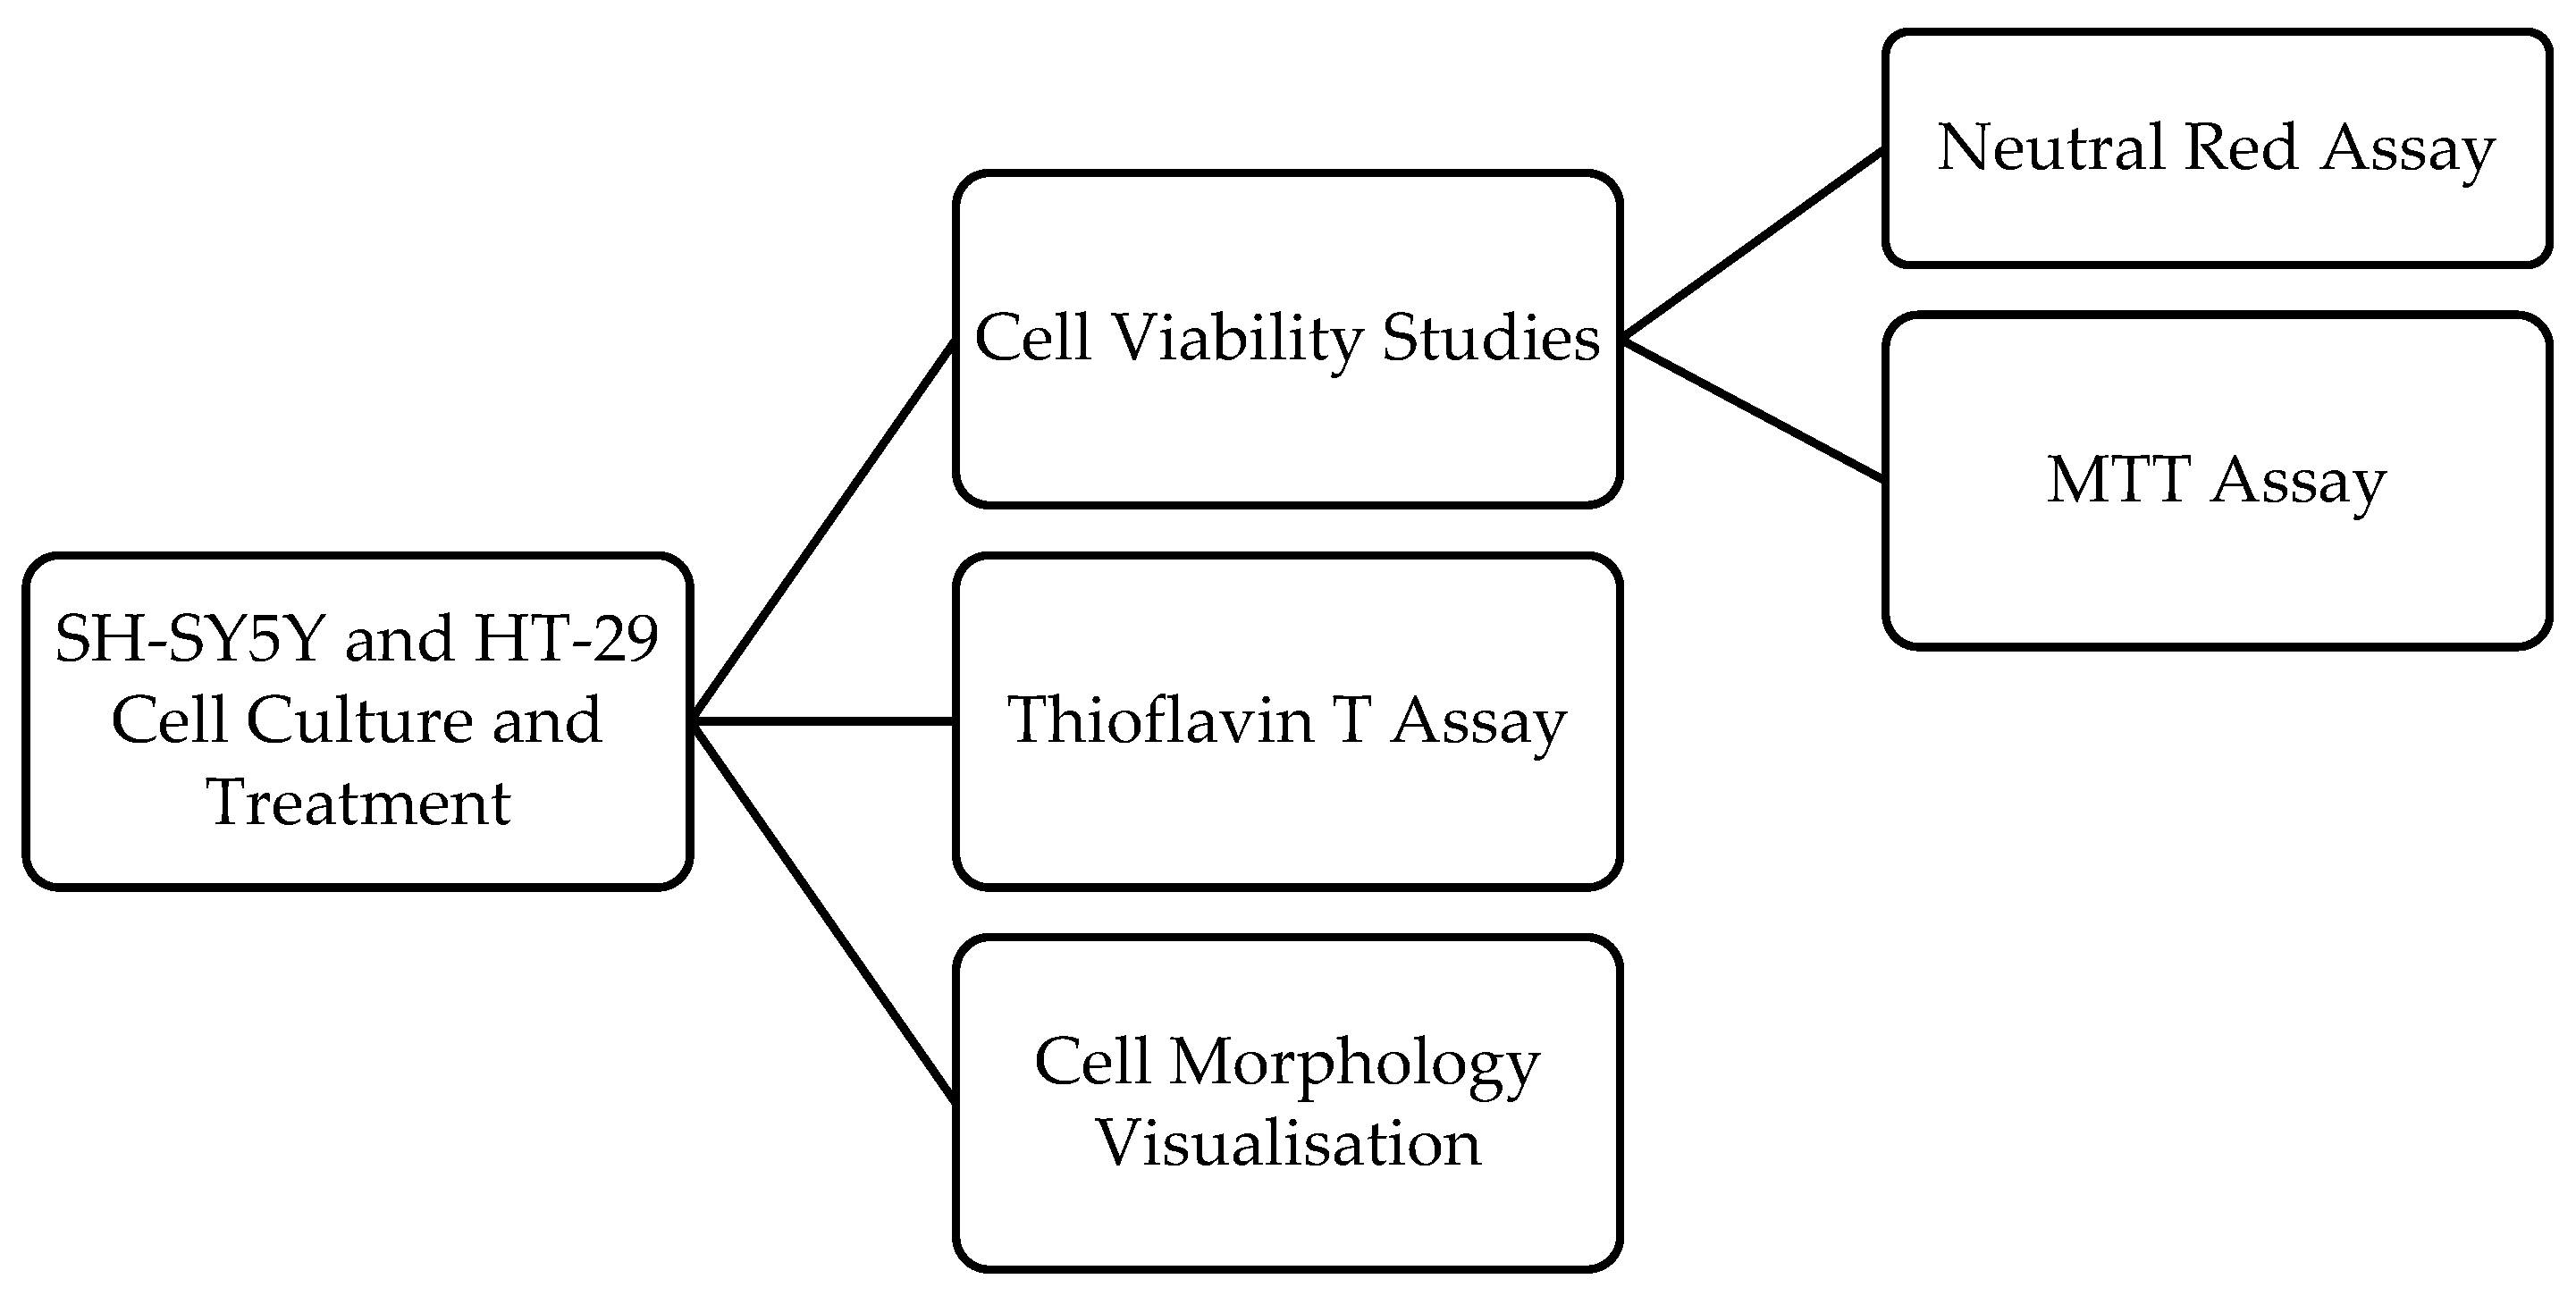
2.2. Cell Culture
2.3. Cell Treatment
2.4. Cell Viability Assays
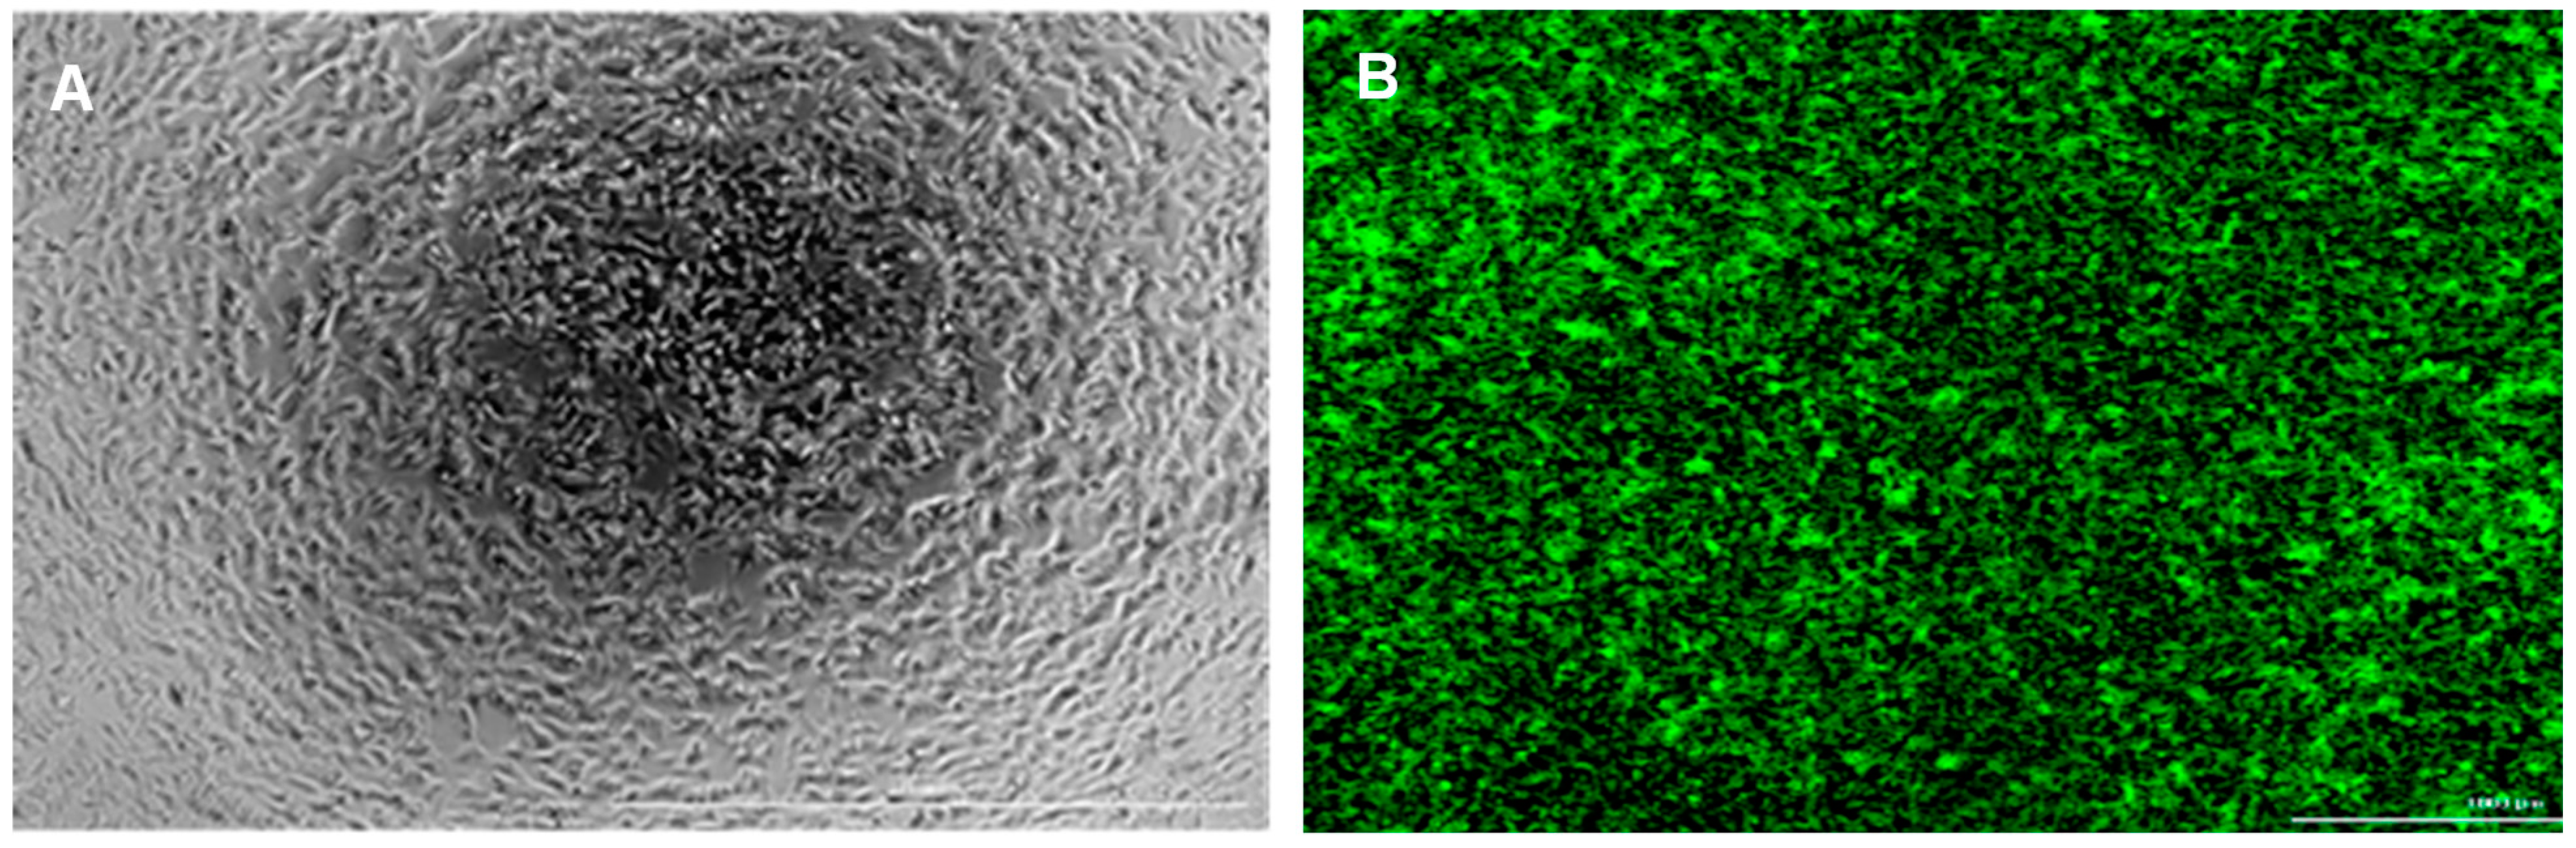
2.5. Cell Morphology Visualisation
2.6. Thioflavin T Assay
2.7. Statistical and Data Analyses
3. Results and Discussion
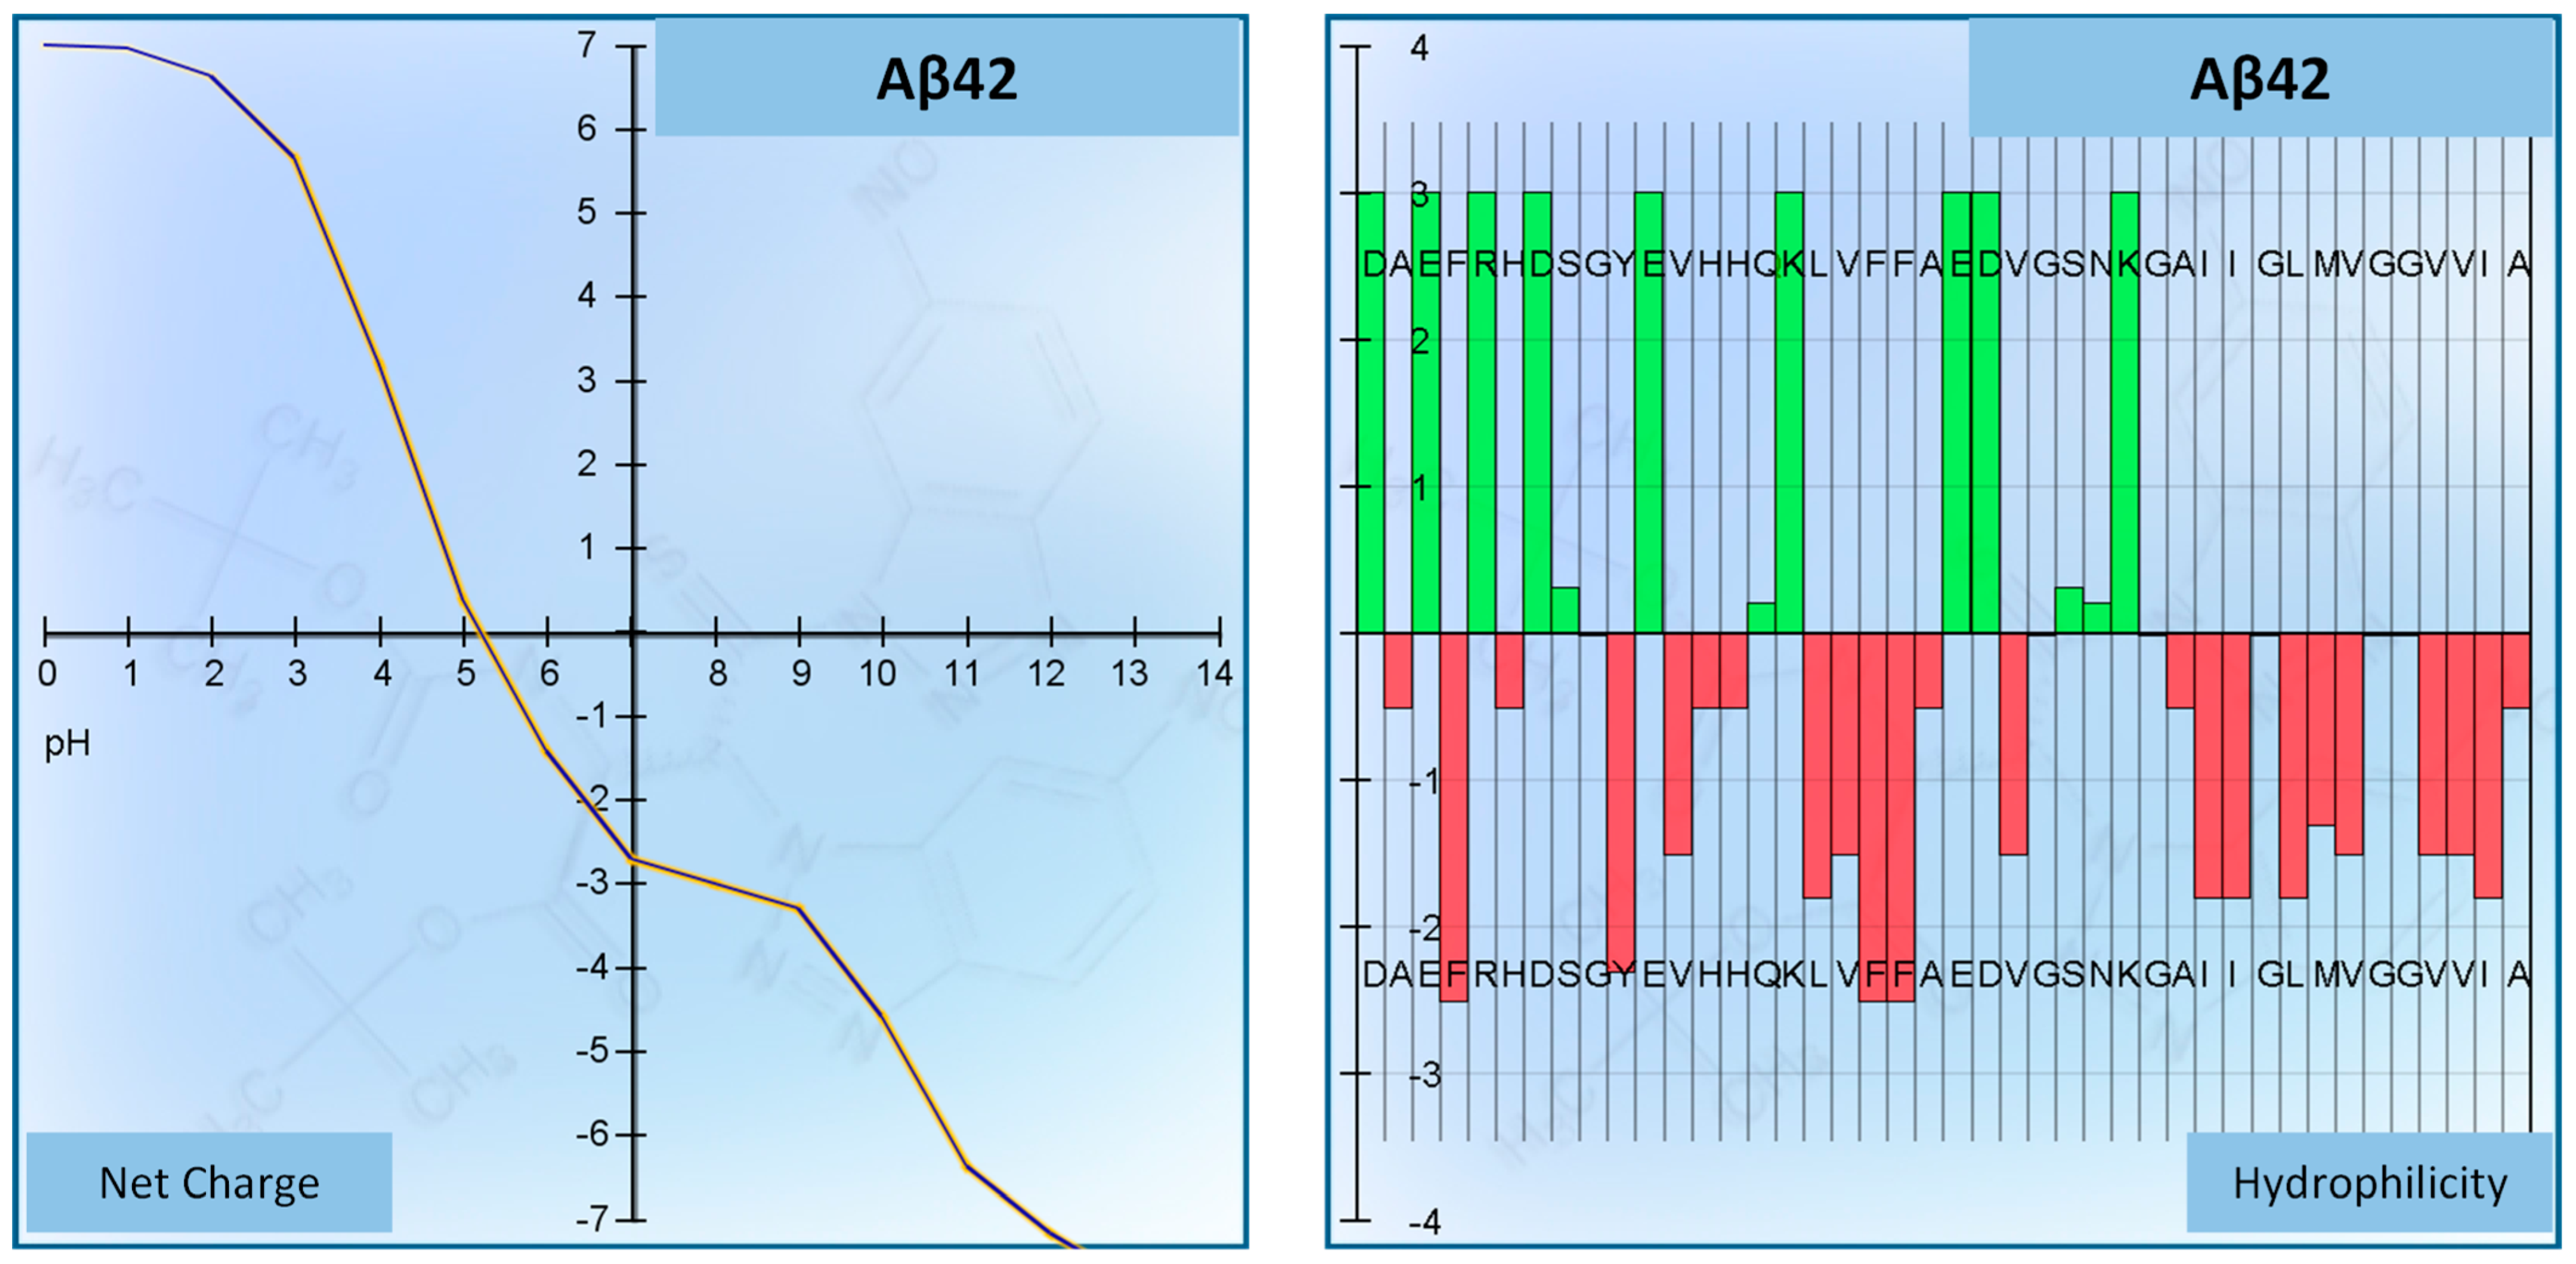
3.1. SH-SY5Y Cells and Peptide Aβ42
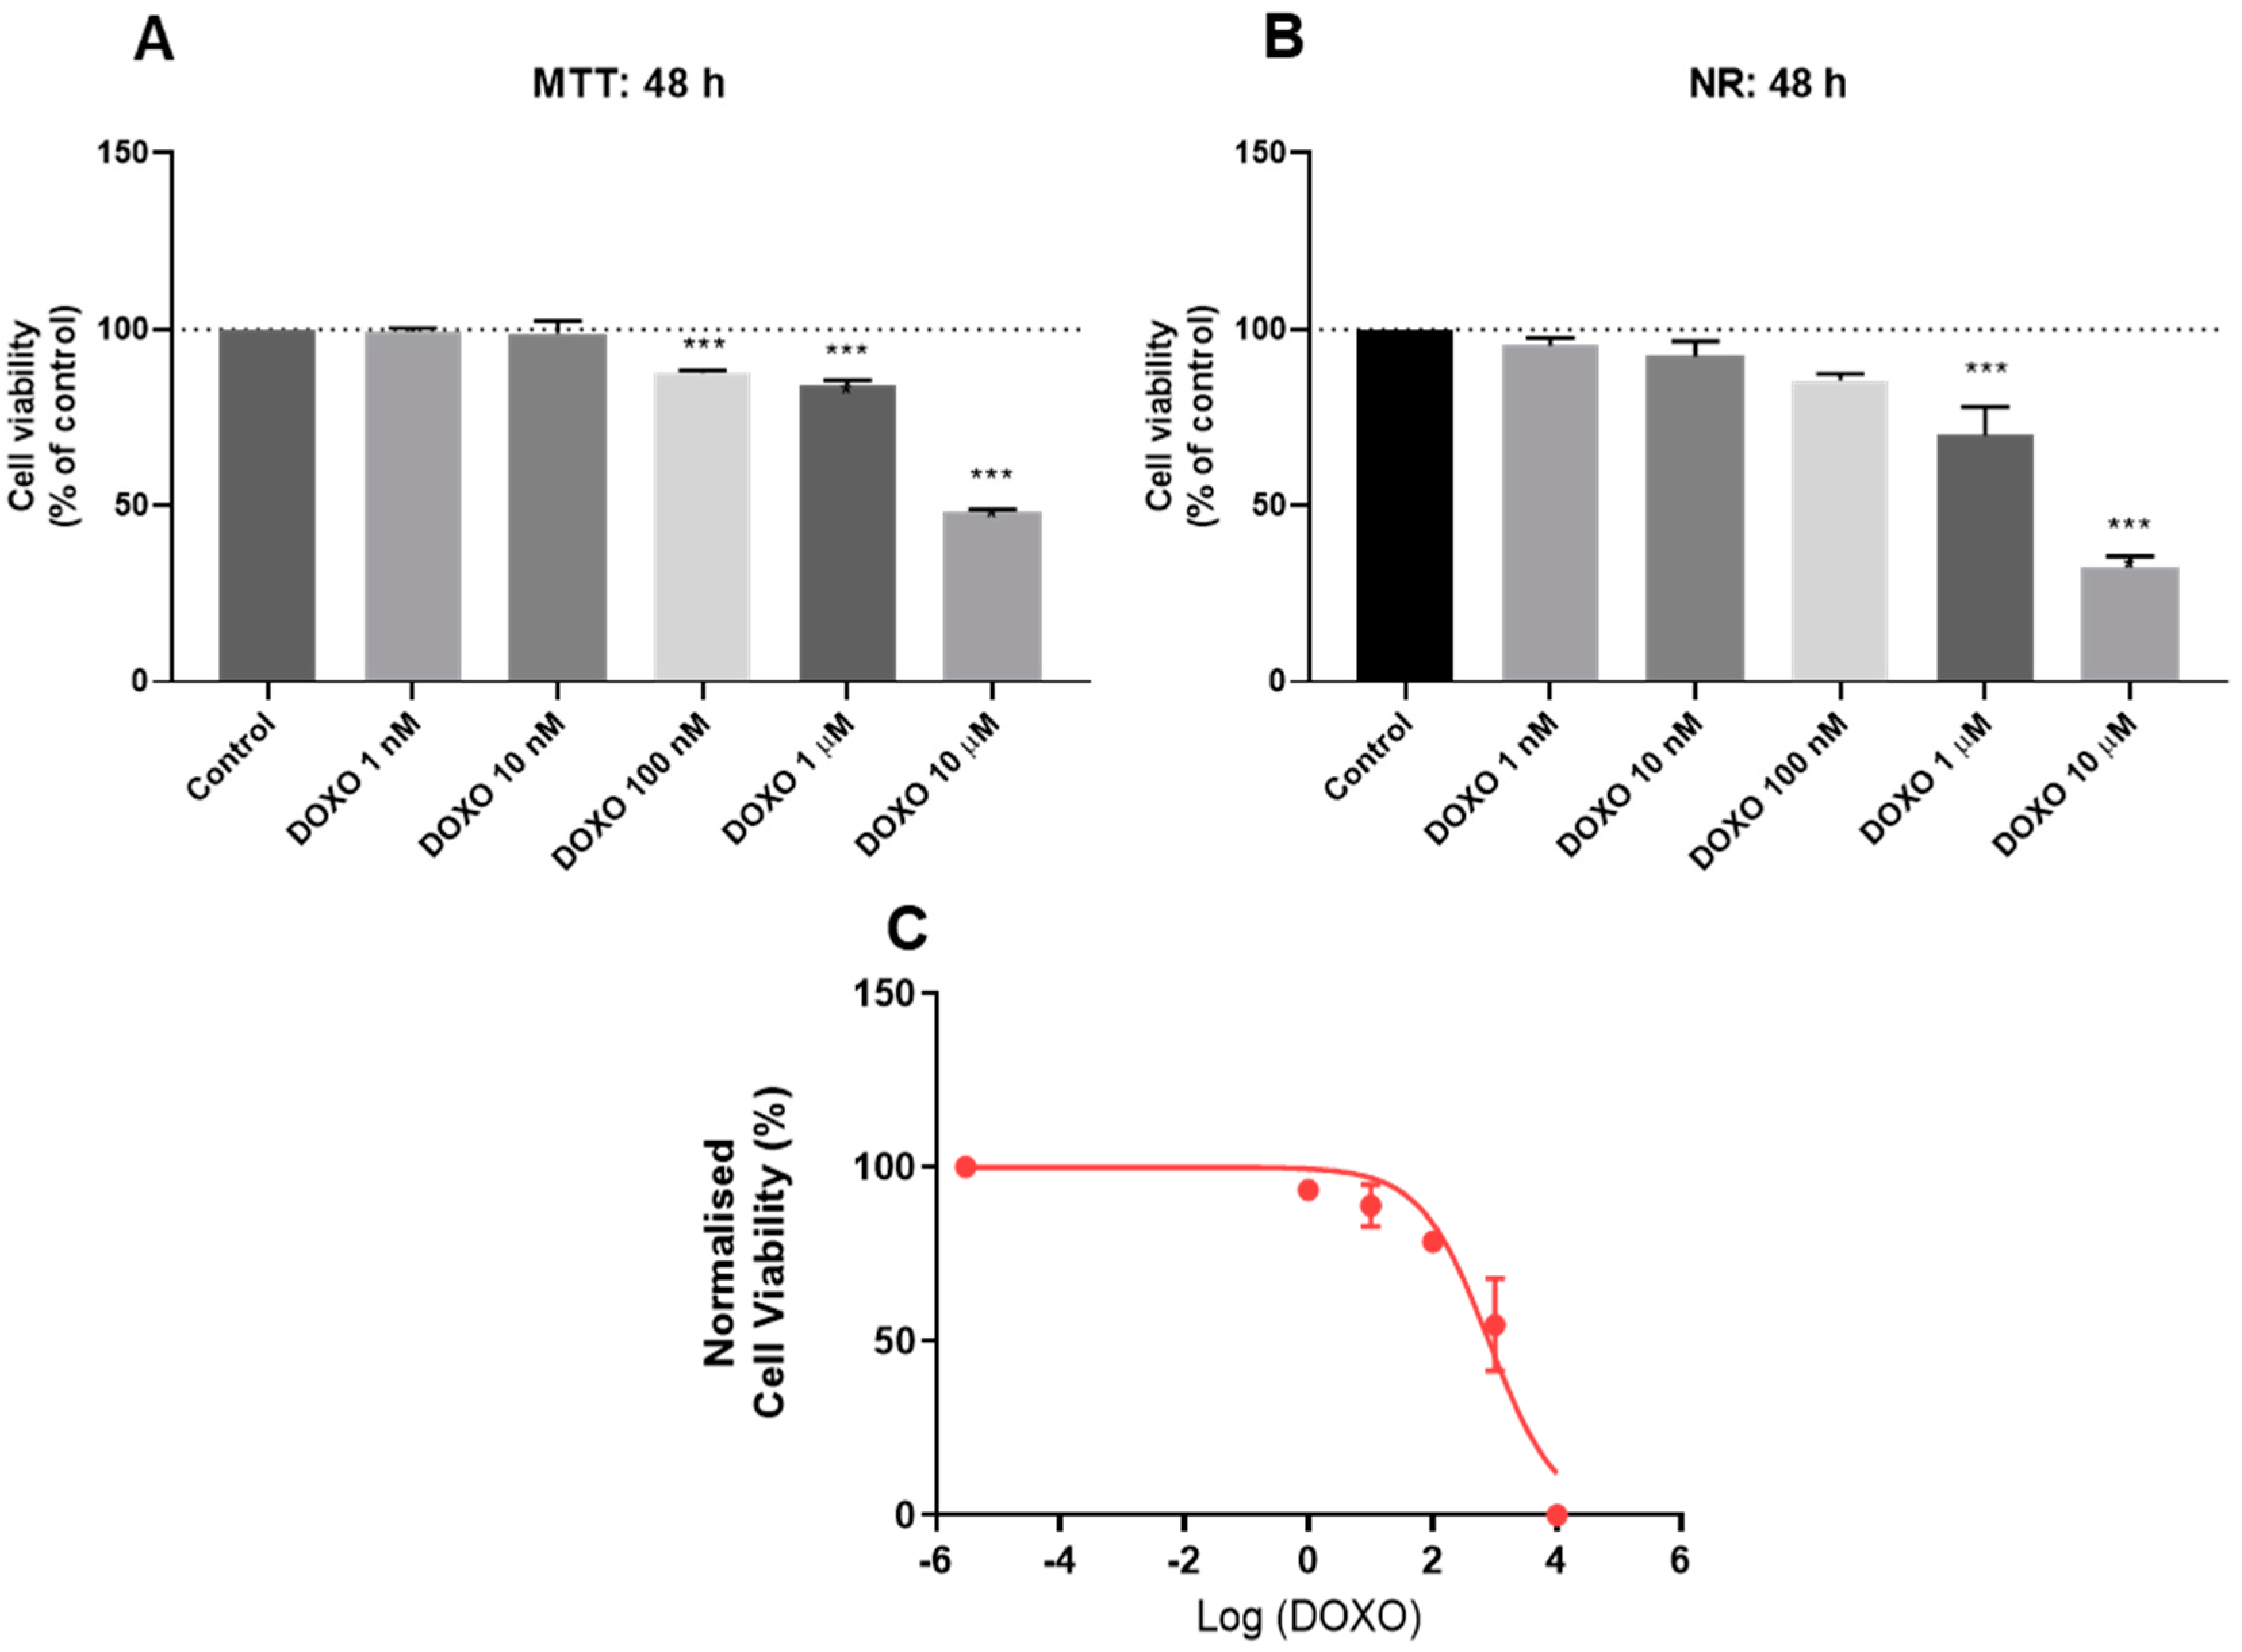
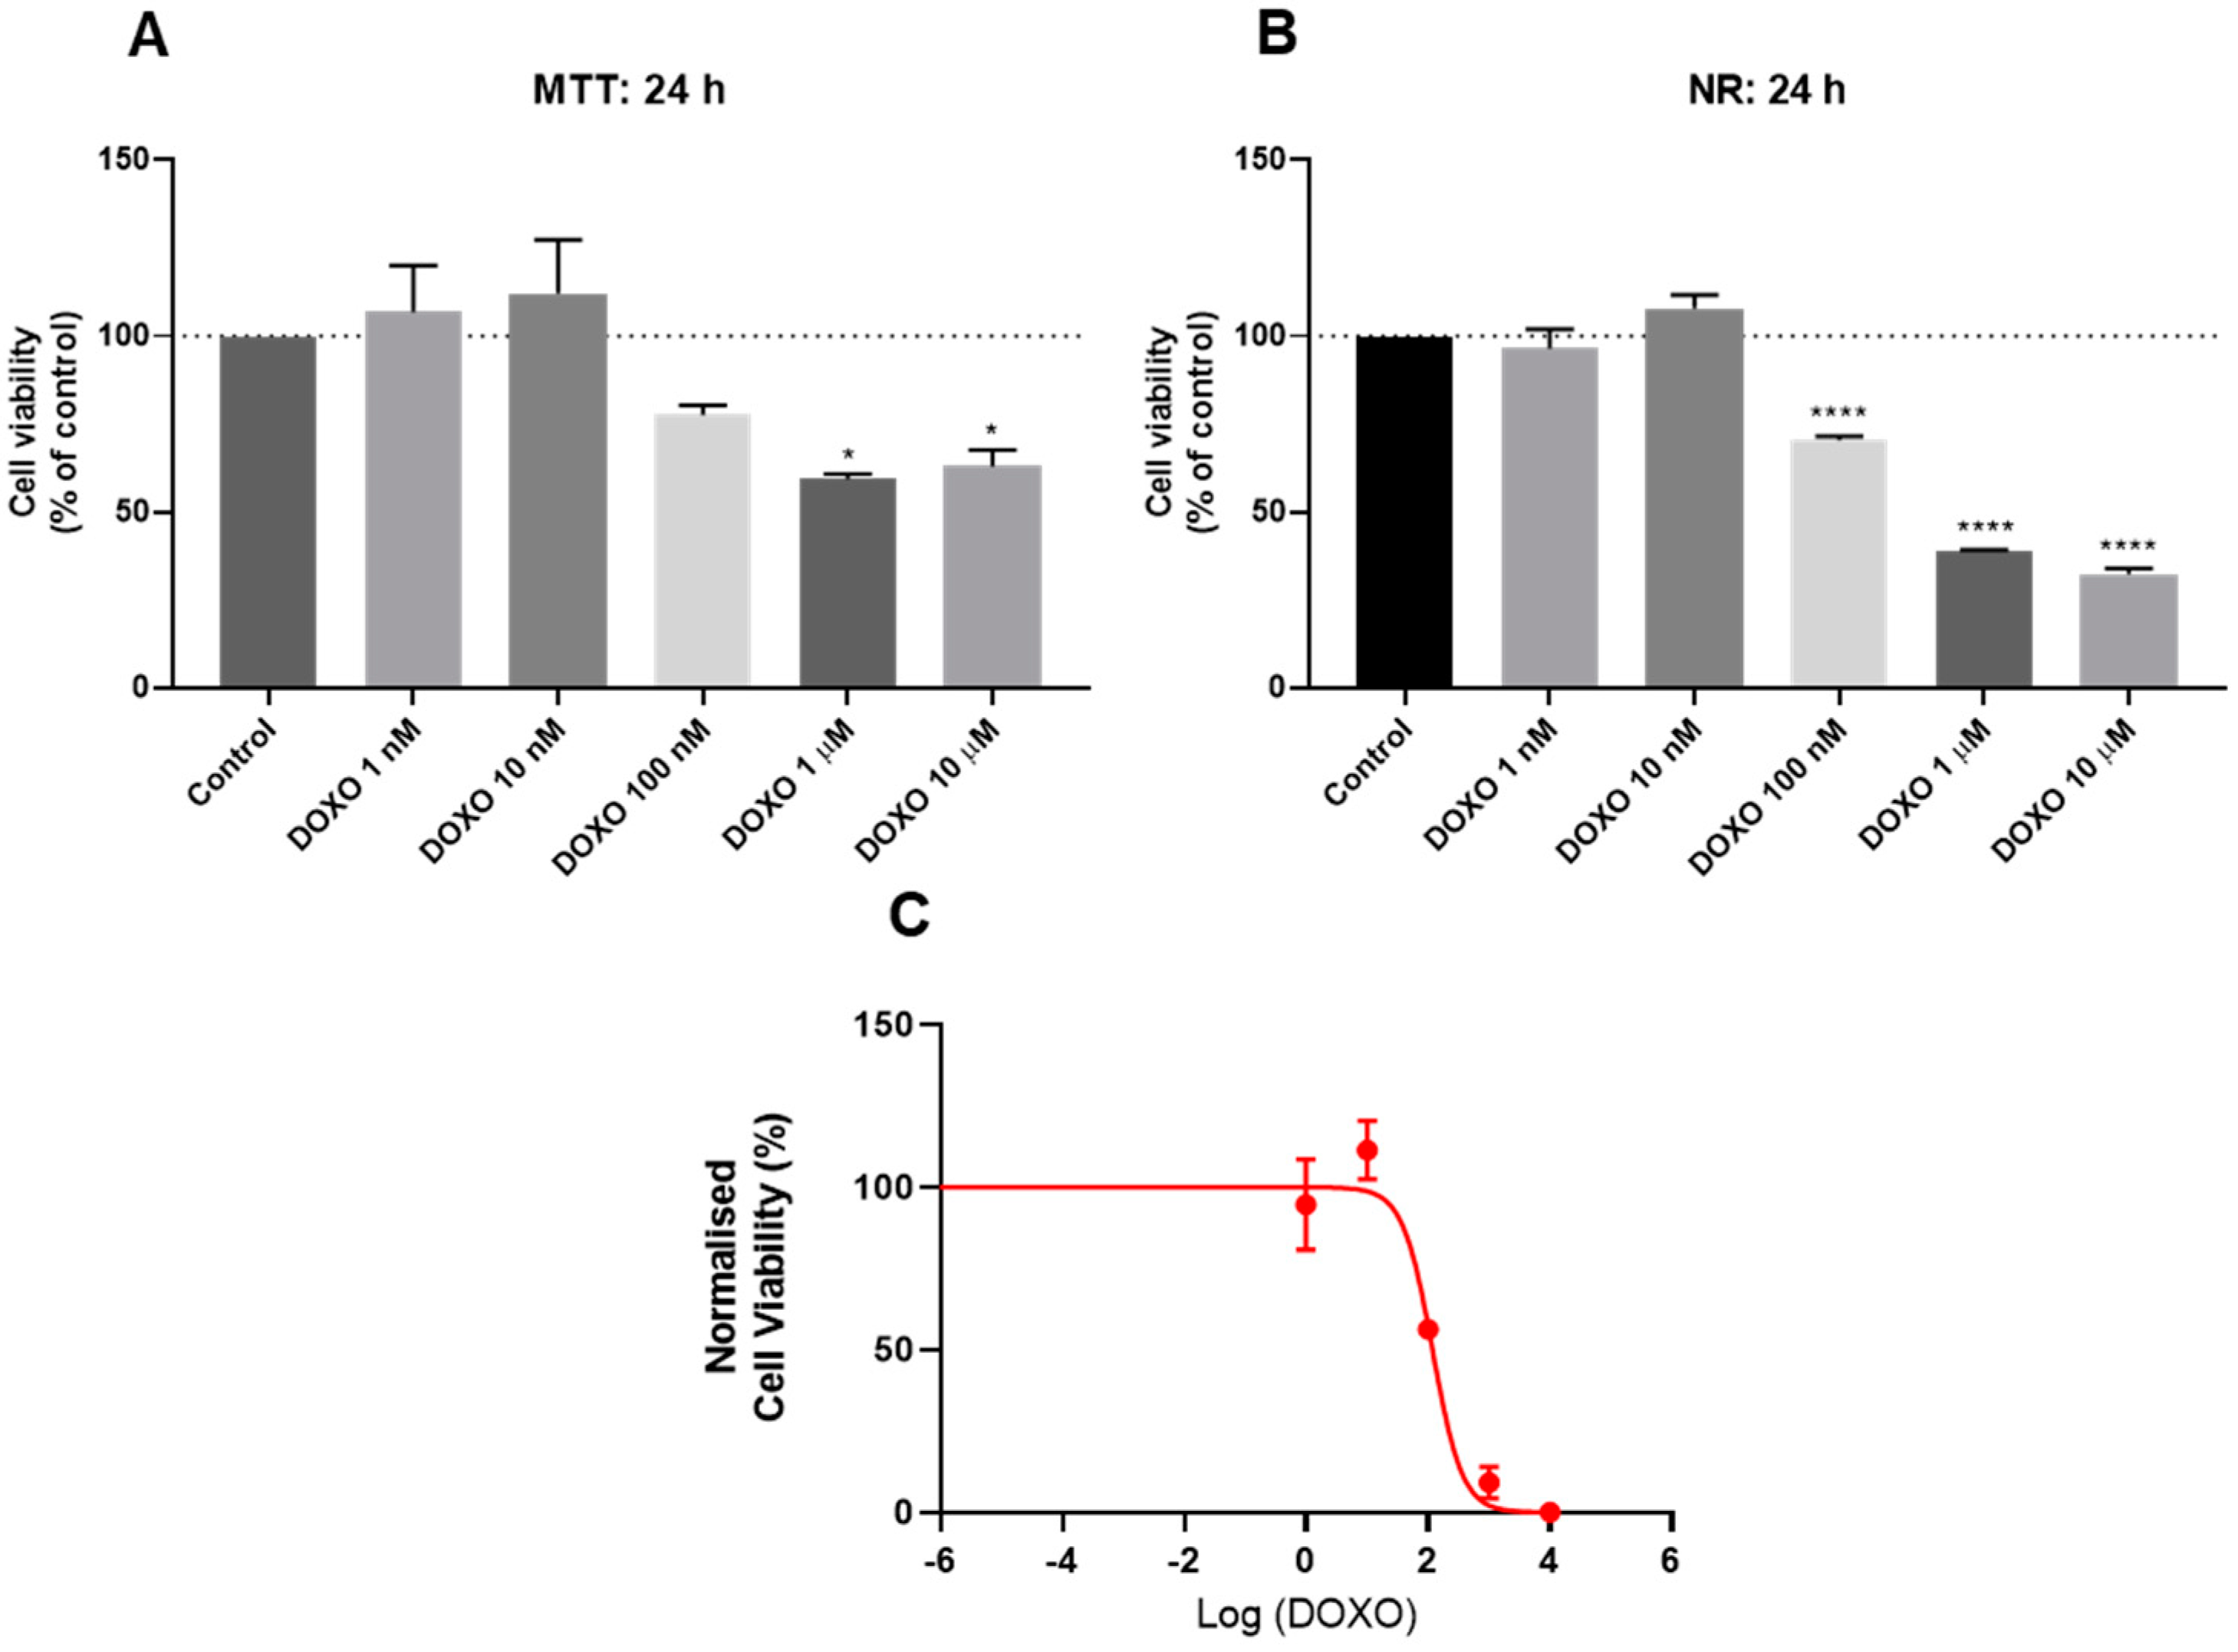
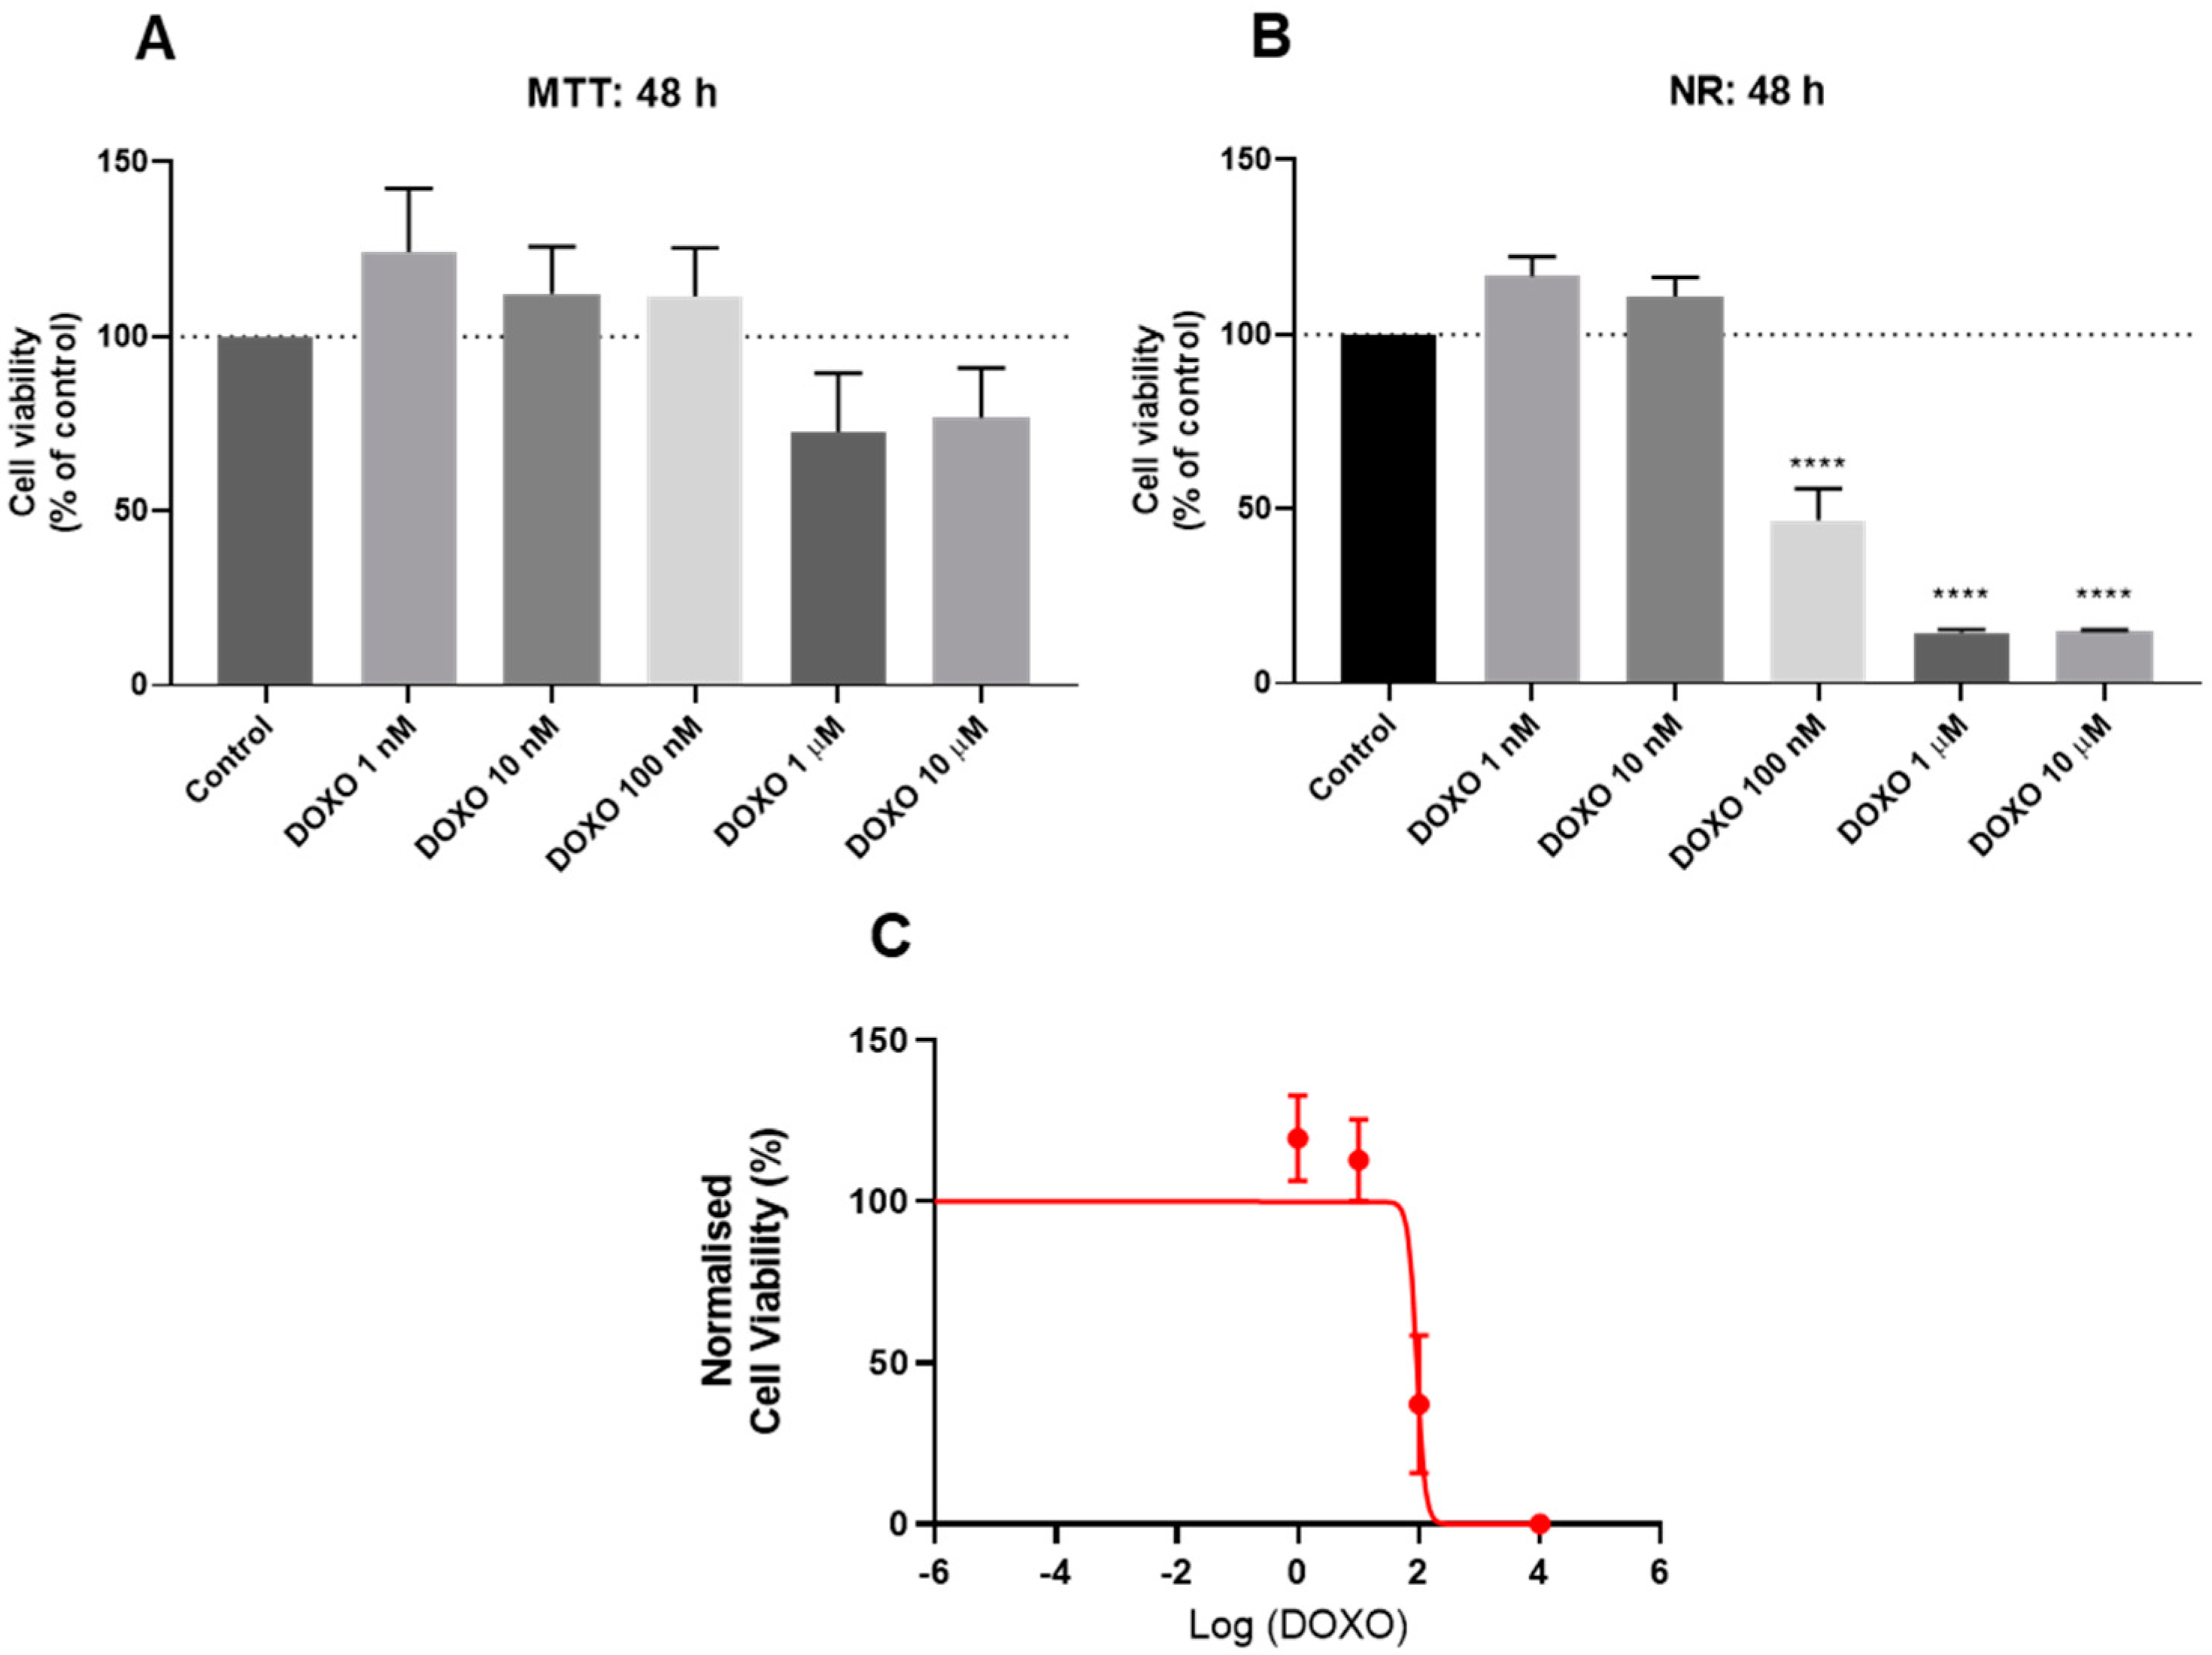
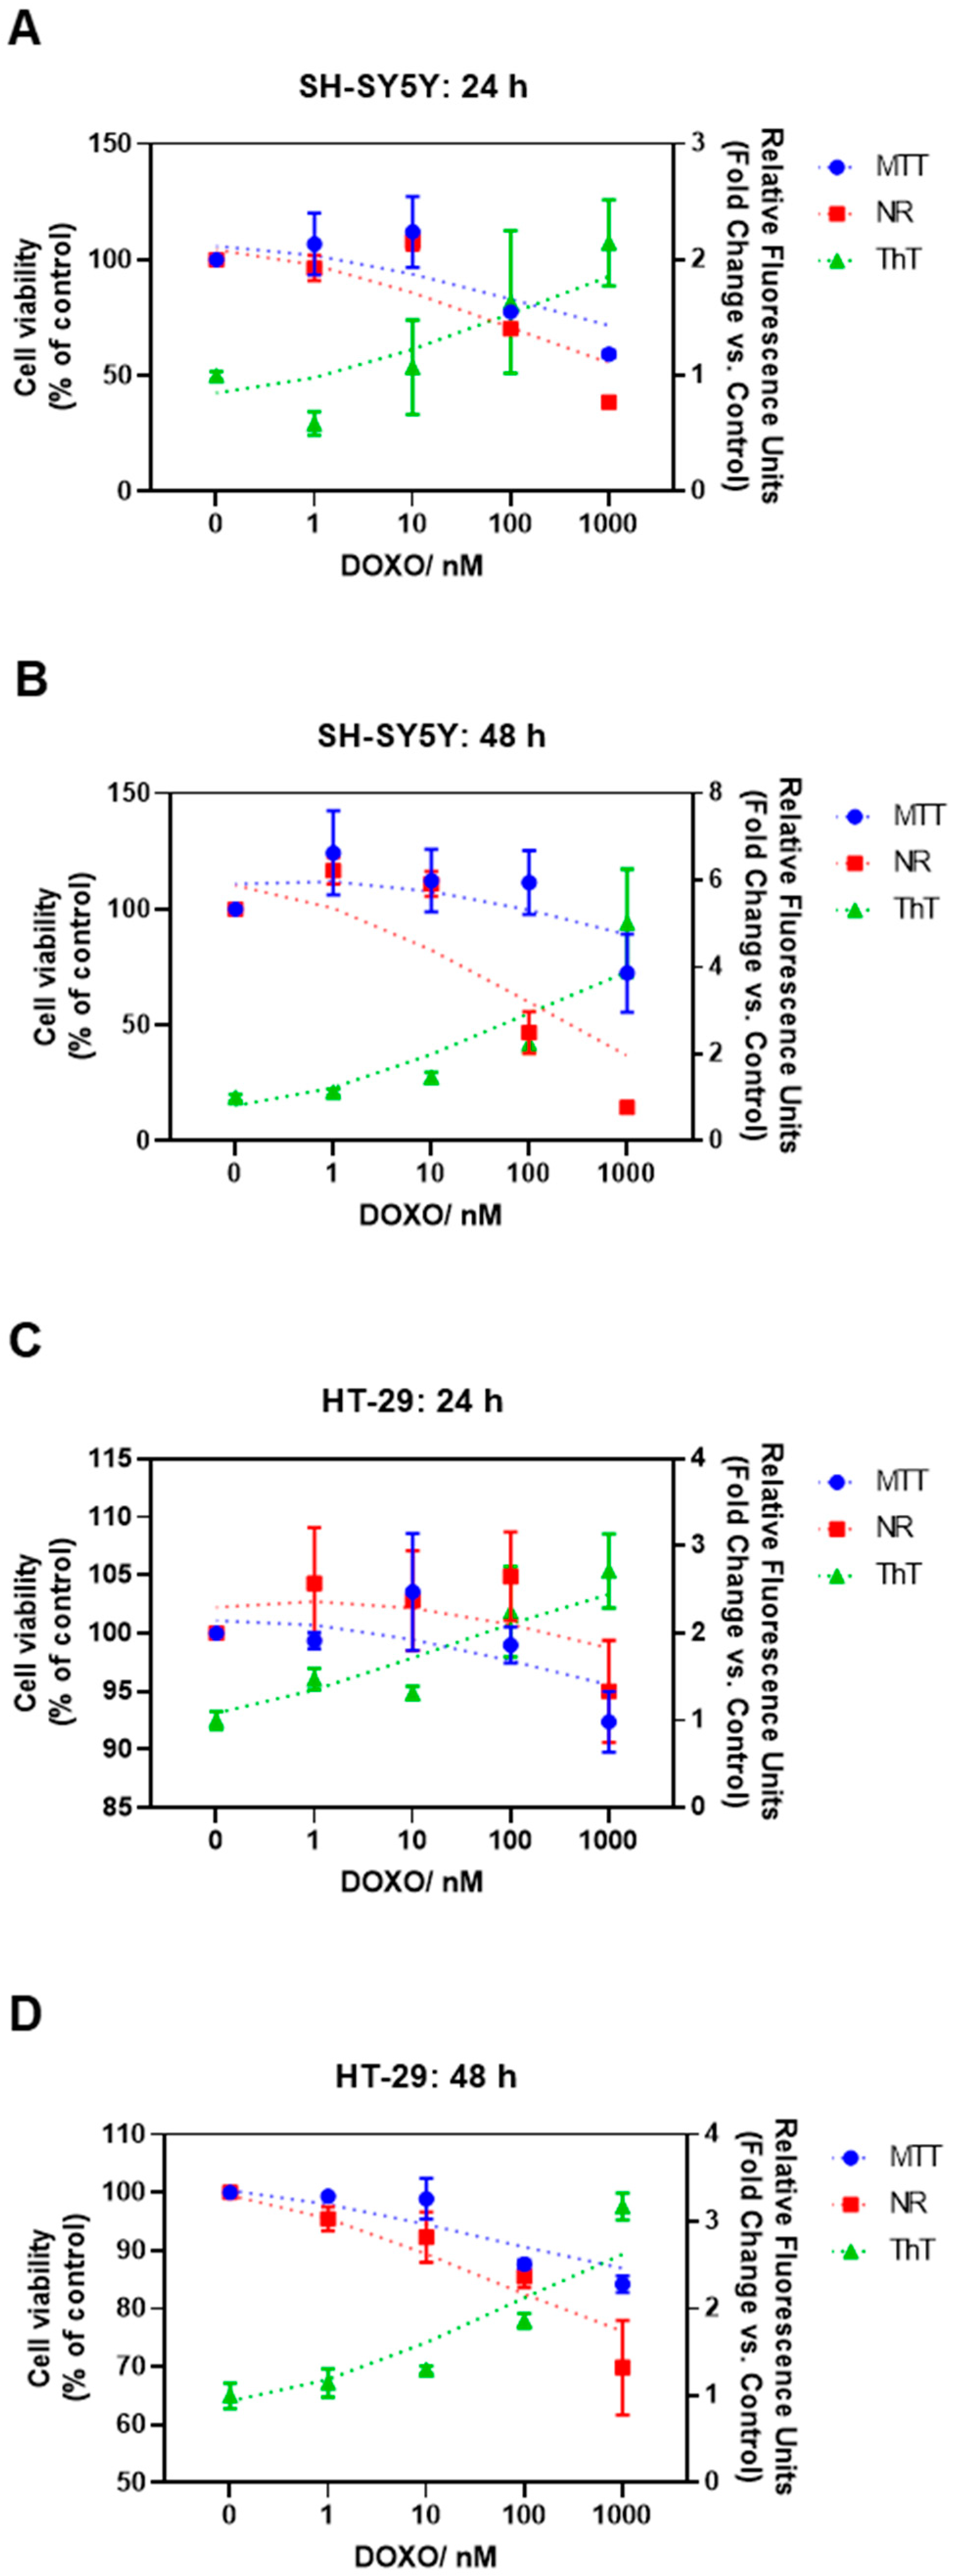
3.2. Effect of Doxorubicin on the Viability of HT-29 and SH-SY5Y Cells
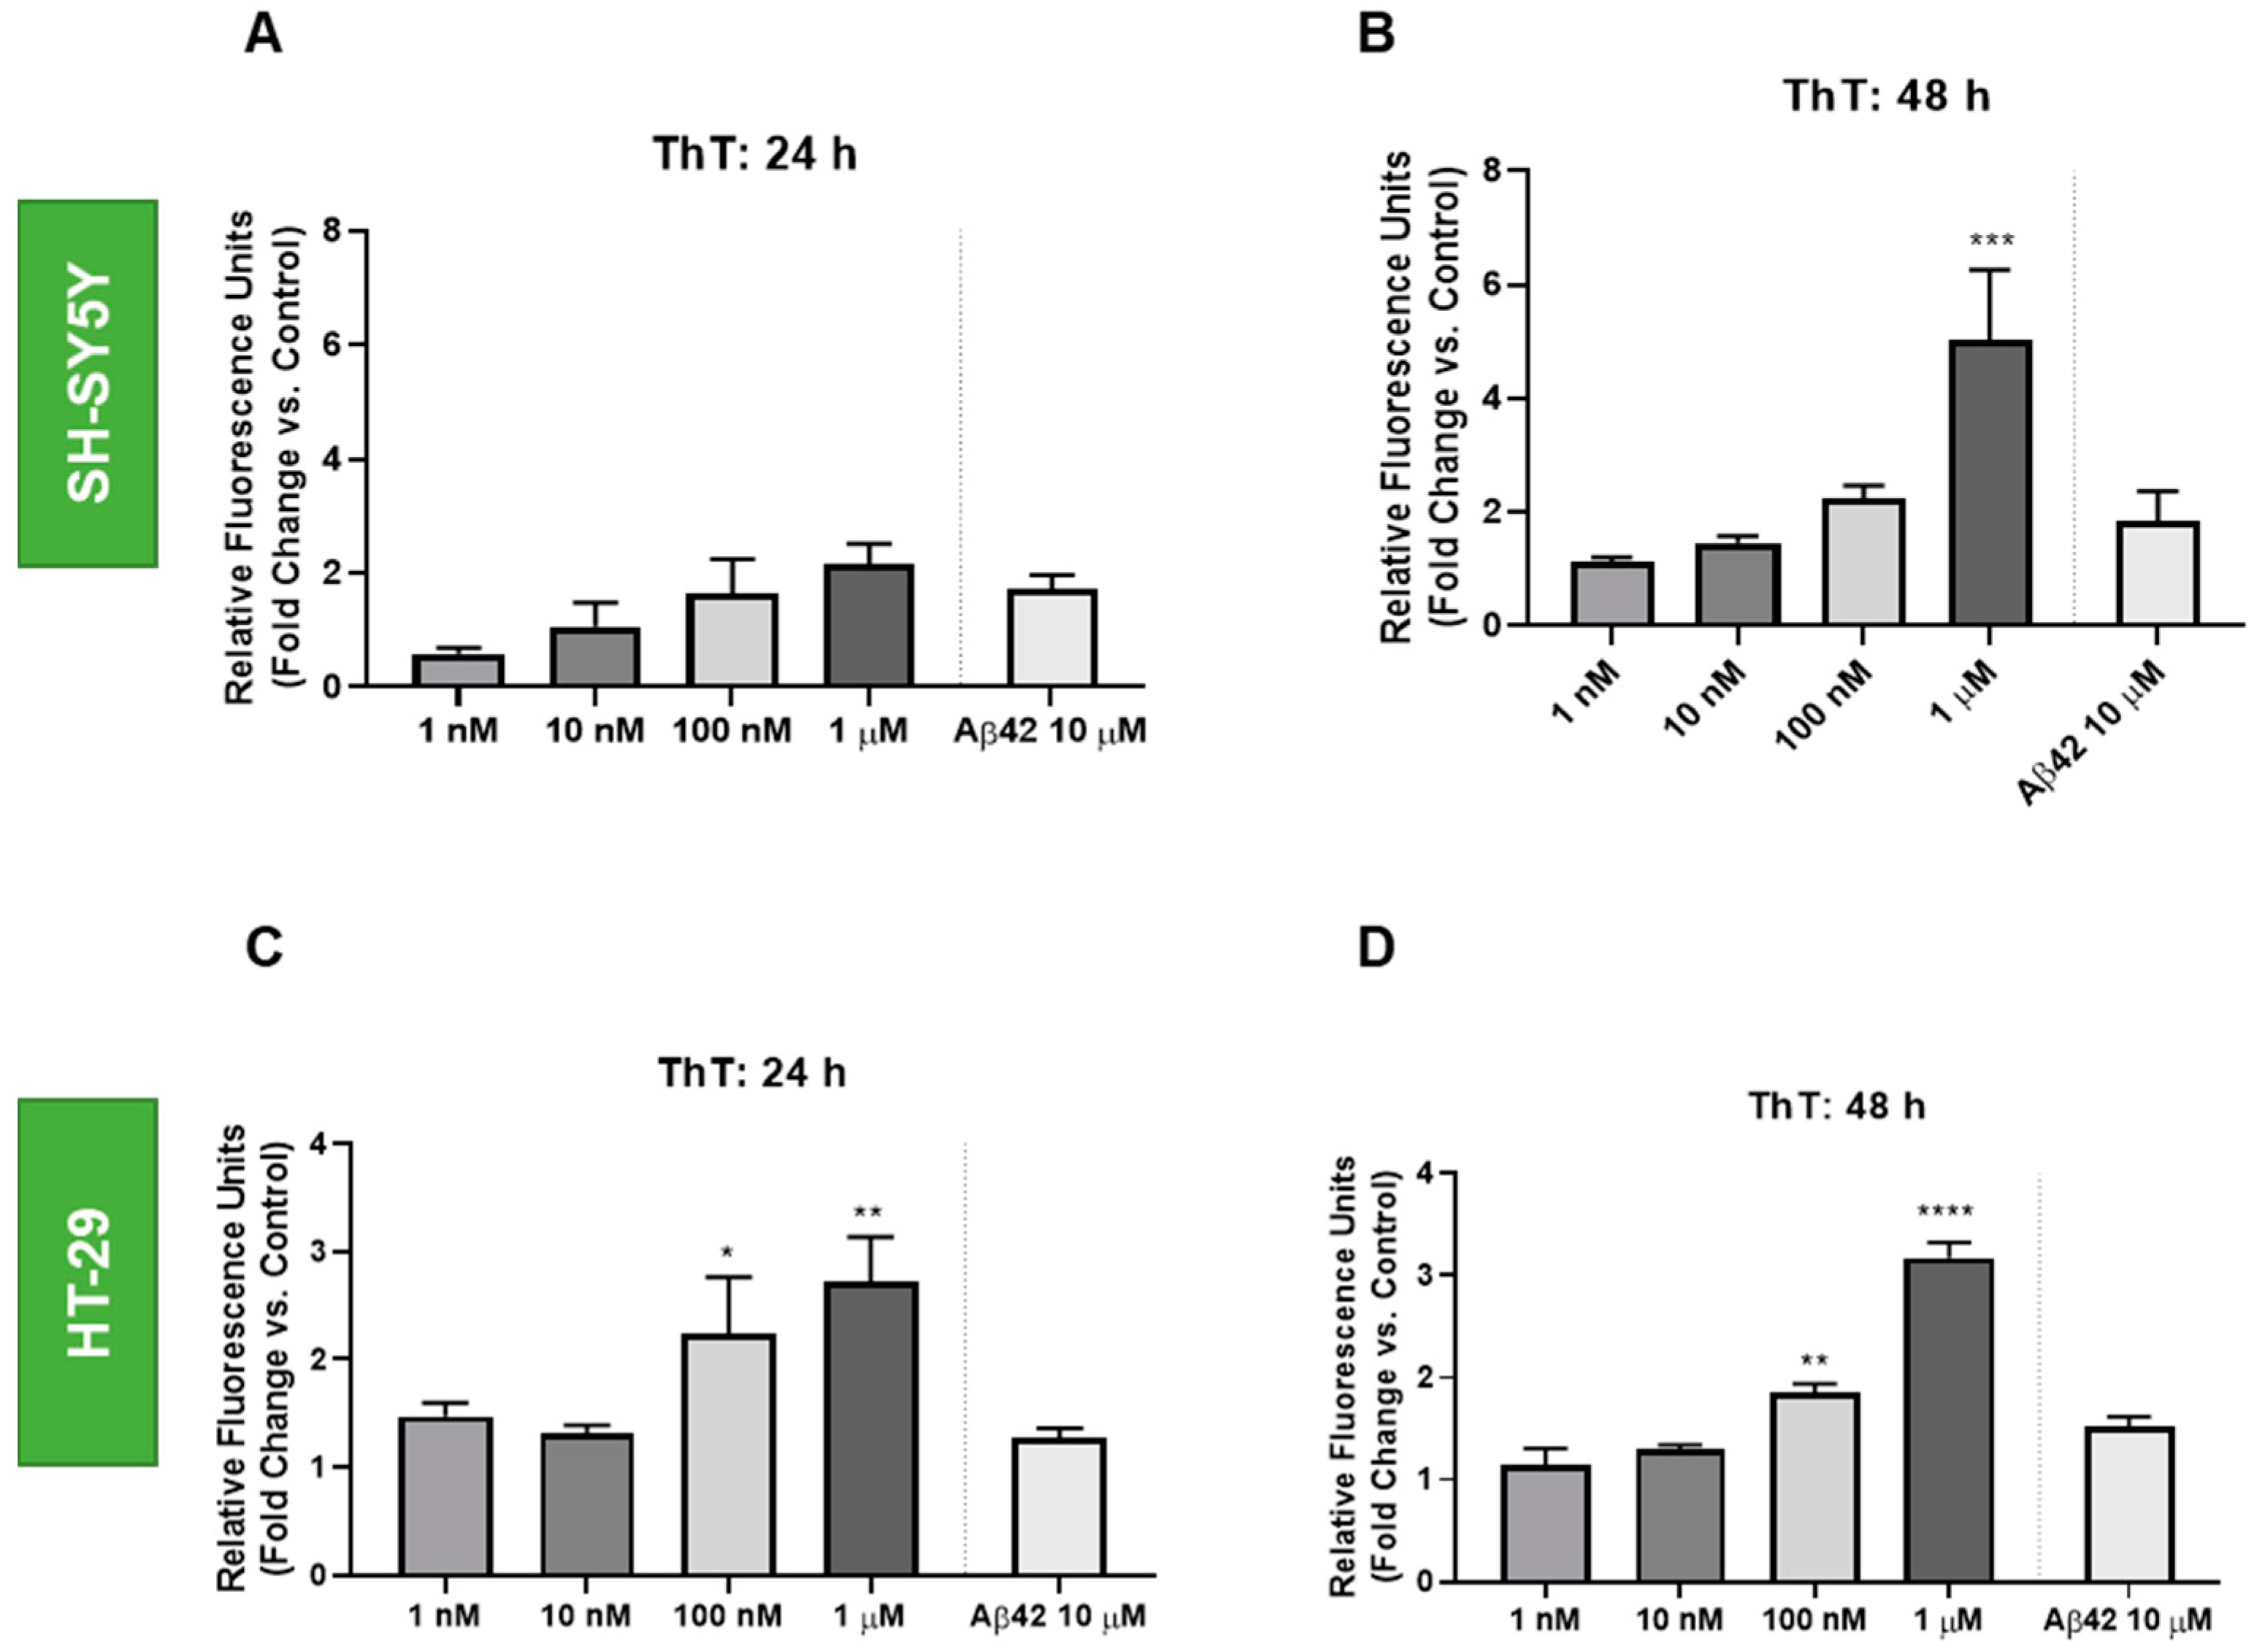
3.3. Effect of Doxorubicin on the Thioflavin T Staining of HT-29 and SH-SY5Y Cells
4. Conclusions
Supplementary Materials
Author Contributions
Funding
Institutional Review Board Statement
Informed Consent Statement
Data Availability Statement
Acknowledgments
Conflicts of Interest
References
- Xue, C.; Lin, T.Y.; Chang, D.; Guo, Z. Thioflavin T as an amyloid dye: Fibril quantification, optimal concentration and effect on aggregation. R. Soc. Open Sci. 2017, 4, 160696. [Google Scholar] [CrossRef] [Green Version]
- Mohanty, J.; Barooah, N.; Dhamodharan, V.; Harikrishna, S.; Pradeepkumar, P.I.; Bhasikuttan, A.C. Thioflavin T as an efficient inducer and selective fluorescent sensor for the human telomeric G-quadruplex DNA. J. Am. Chem. Soc. 2013, 135, 367–376. [Google Scholar] [CrossRef]
- Harel, M.; Sonoda, L.K.; Silman, I.; Sussman, J.L.; Rosenberry, T.L. Crystal Structure of Thioflavin T Bound to the Peripheral Site of Torpedo californica Acetylcholinesterase Reveals How Thioflavin T Acts as a Sensitive Fluorescent Reporter of Ligand Binding to the Acylation Site. J. Am. Chem. Soc. 2008, 130, 7856–7861. [Google Scholar] [CrossRef] [Green Version]
- LeVine, H. Quantification of β-sheet amyloid fibril structures with thioflavin T. In Methods in Enzymology; Academic Press Inc.: Cambridge, MA, USA, 1999; Volume 309, pp. 274–284. [Google Scholar]
- Takamatsu, Y.; Ho, G.; Hashimoto, M. Amyloid Evolvability and Cancer. Trends Cancer 2020, 6, 624–627. [Google Scholar] [CrossRef]
- Yang-Hartwich, Y.; Bingham, J.; Garofalo, F.; Alvero, A.B.; Mor, G. Detection of p53 Protein Aggregation in Cancer Cell Lines and Tumor Samples. In Methods in Molecular Biology; Humana Press Inc.: Totowa, NJ, USA, 2015; Volume 1219, pp. 75–86. [Google Scholar]
- Biel, T.G.; Aryal, B.; Gerber, M.H.; Trevino, J.G.; Mizuno, N.; Rao, V.A. Mitochondrial dysfunction generates aggregates that resist lysosomal degradation in human breast cancer cells. Cell Death Dis. 2020, 11, 460. [Google Scholar] [CrossRef] [PubMed]
- Yeasmin Khusbu, F.; Zhou, X.; Chen, H.; Ma, C.; Wang, K. Thioflavin T as a fluorescence probe for biosensing applications. TrAC Trends Anal. Chem. 2018, 109, 1–18. [Google Scholar] [CrossRef]
- Fan, T.; Mao, Y.; Liu, F.; Zhang, W.; Yin, J.; Jiang, Y. Dual signal amplification strategy for specific detection of Circulating microRNAs based on Thioflavin T. Sens. Actuators B Chem. 2017, 249, 1–7. [Google Scholar] [CrossRef]
- Zatsepina, O.G.; Kechko, O.I.; Mitkevich, V.A.; Kozin, S.A.; Yurinskaya, M.M.; Vinokurov, M.G.; Serebryakova, M.V.; Rezvykh, A.P.; Evgen’Ev, M.B.; Makarov, A.A. Amyloid-β with isomerized Asp7 cytotoxicity is coupled to protein phosphorylation. Sci. Rep. 2018, 8, 3518. [Google Scholar] [CrossRef]
- Gibbs, E.; Silverman, J.M.; Zhao, B.; Peng, X.; Wang, J.; Wellington, C.L.; Mackenzie, I.R.; Plotkin, S.S.; Kaplan, J.M.; Cashman, N.R. A Rationally Designed Humanized Antibody Selective for Amyloid Beta Oligomers in Alzheimer’s Disease. Sci. Rep. 2019, 9, 9870. [Google Scholar] [CrossRef] [Green Version]
- Oehlke, J.; Scheller, A.; Wiesner, B.; Krause, E.; Beyermann, M.; Klauschenz, E.; Melzig, M.; Bienert, M. Cellular uptake of an α-helical amphipathic model peptide with the potential to deliver polar compounds into the cell interior non-endocytically. Biochim. Biophys. Acta-Biomembr. 1998, 1414, 127–139. [Google Scholar] [CrossRef] [Green Version]
- Oehlke, J.; Wallukat, G.; Wolf, Y.; Ehrlich, A.; Wiesner, B.; Berger, H.; Bienert, M. Enhancement of intracellular concentration and biological activity of PNA after conjugation with a cell-penetrating synthetic model peptide. Eur. J. Biochem. 2004, 271, 3043–3049. [Google Scholar] [CrossRef]
- Kenien, R.; Shen, W.-C.; Zaro, J.L. Vesicle-to-cytosol transport of disulfide-linked cargo mediated by an amphipathic cell-penetrating peptide. J. Drug Target. 2012, 20, 793–800. [Google Scholar] [CrossRef] [PubMed]
- Scheller, A.; Melzig, M.; Oehlke, J. Induction of caspase-8 in human cells by the extracellular administration of peptides containing a C-terminal SLV sequence. Lett. Pept. Sci. 2001, 8, 29–34. [Google Scholar] [CrossRef]
- Hällbrink, M.; Florén, A.; Elmquist, A.; Pooga, M.; Bartfai, T.; Langel, Ü. Cargo delivery kinetics of cell-penetrating peptides. Biochim. Biophys. Acta-Biomembr. 2001, 1515, 101–109. [Google Scholar] [CrossRef] [Green Version]
- Silva, S.; Alves, C.; Duarte, D.; Costa, A.; Sarmento, B.; Almeida, A.J.; Gomes, P.; Vale, N. Model Amphipathic Peptide Coupled with Tacrine to Improve Its Antiproliferative Activity. Int. J. Mol. Sci. 2021, 22, 242. [Google Scholar] [CrossRef]
- Yang, V.; Pedrosa, S.S.; Fernandes, R.; Maurício, A.C.; Koksch, B.; Gärtner, F.; Amorim, I.; Vale, N. Synthesis of PEGylated methotrexate conjugated with a novel CPP6, in sillico structural insights and activity in MCF-7 cells. J. Mol. Struct. 2019, 1192, 201–207. [Google Scholar] [CrossRef]
- Silva, S.; Santos-Silva, A.; da Costa, J.M.C.; Vale, N. Potent cationic antimicrobial peptides against Mycobacterium tuberculosis in vitro. J. Glob. Antimicrob. Resist. 2019, 19, 132–135. [Google Scholar] [CrossRef]
- Duarte, D.; Fraga, A.G.; Pedrosa, J.; Martel, F.; Vale, N. Increasing the potential of cell-penetrating peptides for cancer therapy using a new pentagonal scaffold. Eur. J. Pharmacol. 2019, 860, 172554. [Google Scholar] [CrossRef]
- Ferreira, A.; Lapa, R.; Vale, N. Combination of Gemcitabine with Cell-Penetrating Peptides: A Pharmacokinetic Approach Using In Silico Tools. Biomolecules 2019, 9, 693. [Google Scholar] [CrossRef] [Green Version]
- Correia, C.; Xavier, C.P.R.R.; Duarte, D.; Ferreira, A.; Moreira, S.; Vasconcelos, M.H.; Vale, N. Development of potent CPP6–gemcitabine conjugates against human prostate cancer cell line (PC-3). RSC Med. Chem. 2020, 11, 268–273. [Google Scholar] [CrossRef]
- Silva, S.; Marto, J.; Gonçalves, L.; Almeida, A.J.; Vale, N. Formulation, Characterization and Evaluation against SH-SY5Y Cells of New Tacrine and Tacrine-MAP Loaded with Lipid Nanoparticles. Nanomaterials 2020, 10, 2089. [Google Scholar] [CrossRef]
- Bourhim, M.; Kruzel, M.; Srikrishnan, T.; Nicotera, T. Linear quantitation of Aβ aggregation using Thioflavin T: Reduction in fibril formation by colostrinin. J. Neurosci. Methods 2007, 160, 264–268. [Google Scholar] [CrossRef] [PubMed]
- PepCalc.com-Peptide Calculator. Available online: https://pepcalc.com/ (accessed on 14 September 2021).
- Peptide Calculator. Available online: https://www.bachem.com/knowledge-center/peptide-calculator/ (accessed on 14 September 2021).
- Han, X.-J.; Hu, Y.-Y.; Yang, Z.-J.; Jiang, L.-P.; Shi, S.-L.; Li, Y.-R.; Guo, M.-Y.; Wu, H.-L.; Wan, Y.-Y. Amyloid β-42 induces neuronal apoptosis by targeting mitochondria. Mol. Med. Rep. 2017, 16, 4521–4528. [Google Scholar] [CrossRef] [PubMed] [Green Version]
- Garg, A.; Sinha, S. Doxorubicin induces Aberrant Self-Assembly of P53 by Phase Separation. Biophys. J. 2021, 120, 28a. [Google Scholar] [CrossRef]


| Peptide | Aβ42 (Beta-Amyloid Peptide (1–42) (Human)) |
|---|---|
| Sequence | DAEFRHDSGYEVHHQKLVFFAEDVGSNKGAIIGLMVGGVVIA (COOH) |
| Number of residues | 42 |
| Molecular weight | 4514.04 g/mol |
| Extinction coefficient | 1280 M−1 cm−1 |
| Isoelectric point | pH 5.17 |
| Net charge at pH 7 | −2.7 |
| Average hydrophilicity | −0.1 |
| Ratio of hydrophilic residues/total number of residues | 31% |
Publisher’s Note: MDPI stays neutral with regard to jurisdictional claims in published maps and institutional affiliations. |
© 2022 by the authors. Licensee MDPI, Basel, Switzerland. This article is an open access article distributed under the terms and conditions of the Creative Commons Attribution (CC BY) license (https://creativecommons.org/licenses/by/4.0/).
Share and Cite
Correia, A.S.; Duarte, D.; Miranda-Gonçalves, V.; Vale, N. Potential Translational Thioflavin T Methodology as a Complement of Cell-Based Assays and after Drug Exposition. Int. J. Transl. Med. 2022, 2, 134-147. https://doi.org/10.3390/ijtm2020011
Correia AS, Duarte D, Miranda-Gonçalves V, Vale N. Potential Translational Thioflavin T Methodology as a Complement of Cell-Based Assays and after Drug Exposition. International Journal of Translational Medicine. 2022; 2(2):134-147. https://doi.org/10.3390/ijtm2020011
Chicago/Turabian StyleCorreia, Ana Salomé, Diana Duarte, Vera Miranda-Gonçalves, and Nuno Vale. 2022. "Potential Translational Thioflavin T Methodology as a Complement of Cell-Based Assays and after Drug Exposition" International Journal of Translational Medicine 2, no. 2: 134-147. https://doi.org/10.3390/ijtm2020011