Article

A Multimodal Omics Exploration of the Motor and Non-Motor Symptoms of Parkinson’s Disease

1
Paris Brain Institute (ICM), Sorbonne Université, Assistance Publique-Hôpitaux de Paris (AP-HP), Inserm U 1127, CNRS UMR 7225, Pitié-Salpêtrière University Hospital, 75013 Paris, France
2
Paris Brain Institute’s Data Analysis Core, Pitié-Salpêtrière University Hospital, 75013 Paris, France
3
ICAN Omics, Foundation for Innovation in Cardiometabolism and Nutrition (IHU-ICAN), 75013 Paris, France
4
Département Médicaments et Technologies pour la Santé (MTS), Université Paris-Saclay, Commissariat à l’Energie Atomique et aux Energies Alternatives (CEA), Institut National de Recherche pour l’Agriculture, l’alimentation et l’Environnement (INRAE), MetaboHUB, 91191 Gif-sur-Yvette, France
5
Centre National de Recherche en Génomique Humaine (CNRGH), Université Paris-Saclay, CEA, 91057 Evry, France
6
Omics Services, 75007 Paris, France
7
Laboratoire des Signaux et Systèmes (L2S), Université Paris-Saclay, CentraleSupélec, CNRS UMR 8506, 91192 Gif-sur-Yvette, France
8
Assistance Publique-Hôpitaux de Paris (AP-HP), Department of Genetics, Pitié-Salpêtrière University Hospital, 75013 Paris, France
9
Assistance Publique-Hôpitaux de Paris (AP-HP), Department of Neurology, Pitié-Salpêtrière University Hospital, 75013 Paris, France
*
Author to whom correspondence should be addressed.
These authors contributed equally to this work.
Int. J. Transl. Med. 2022, 2(1), 97-112; https://doi.org/10.3390/ijtm2010009
Submission received: 17 December 2021 / Revised: 21 February 2022 / Accepted: 4 March 2022 / Published: 8 March 2022
(This article belongs to the Special Issue Biomarker Discovery in Medical and Health Contexts Using Metabolomics)

Abstract

:
Parkinson’s disease (PD) is the second most common neurodegenerative disease clinically characterized by classical motor symptoms and a range of associated non-motor symptoms. Due to the heterogeneity of symptoms and variability in patient prognosis, the discovery of blood biomarkers is of utmost importance to identify the biological mechanisms underlying the different clinical manifestations of PD, monitor its progression and develop personalized treatment strategies. Whereas studies often rely on motor symptoms alone or composite scores, our study focused on finding relevant molecular markers associated with three clinical models describing either motor, cognitive or emotional symptoms. An integrative multiblock approach was performed using regularized generalized canonical correlation analysis to determine specific associations between lipidomics, transcriptomics and clinical data in 48 PD patients. We identified omics signatures confirming that clinical manifestations of PD in our cohort could be classified according to motor, cognition or emotion models. We found that immune-related genes and triglycerides were well-correlated with motor variables, while cognitive variables were linked to triglycerides as well as genes involved in neuronal growth, synaptic plasticity and mitochondrial fatty acid oxidation. Furthermore, emotion variables were associated with phosphatidylcholines, cholesteryl esters and genes related to endoplasmic reticulum stress and cell regulation.

1. Introduction

Parkinson’s disease (PD) is one of the most common neurodegenerative diseases. It is characterized by a motor triad (rest tremor, akinesia, rigidity), which is largely improved by dopamine replacement therapy. However, some axial motor signs, such as postural control impairment or freezing of gait, and non-motor signs, such as sleep, cognitive or mood disorders, are associated with poorer prognosis. It is of utmost importance to identify biomarkers to make early detection of PD phenotypes, help monitor disease staging and ultimately develop personalized treatment strategies. In the Nucleipark study (Pitié-Salpêtrière University Hospital), we made a multimodal investigation of a cohort of PD patients with different phenotypes. We identified alterations of physiological (oculomotor and gait) and imaging parameters, which could be markers of sleep disorders [1,2], poorer gait and gaze control [2,3,4] and cognitive impairment [5]. However, these physiological assessments of gait or gaze, as well as MRI analysis of small deep structures and networks, require much expertise and technical facilities that are not yet readily available to patients.
Therefore, the discovery of blood biomarkers of PD phenotypes and severity is a very important, and yet unsolved, issue. To date, several studies have been undertaken using omics data (e.g., proteomics, transcriptomics or metabolomics/lipidomics) to identify biological changes occurring during the clinical manifestations and progression of PD [6,7]. Their results suggest that holistic and multidisciplinary approaches could bring new insights to the pathogenesis of this complex multisystem neurodegenerative disorder. Despite poor overlap among transcriptomics studies, synaptic vesicle cycling, dopamine receptor signaling, cellular respiration, inflammation and mitochondrial dysfunction appeared as the main pathways altered in PD [8,9,10]. Recent works have also established that lipids play a key role in these biological processes and pathways associated with PD [11,12,13]. Lipids include a broad range of organic molecules insoluble in water classified as glycerolipids, glycerophospholipids, sphingolipids, sterols and fatty acyls, and this field has become a major research target to understand PD pathogenesis [14,15,16]. Indeed, lipids play a central role in cytotoxic interactions with α-synuclein (α-syn), oxidative stress, inflammation, signaling and transport of molecules [17,18]. Likewise, being a carrier of a mutation in the GBA1 gene constitutes the first risk factor of PD identified so far, through reduced activity of the lysosomal glucocerebrosidase and accumulation of sphingolipids that favors the oligomerization of α-syn [19].
A common approach to stratify subjects is to examine correlations between biological measures (e.g., gene expression or metabolite concentrations) and clinical scores. Due to the important clinical heterogeneity in PD, a supervised approach using observed clinical response (involving one or more variables combined), rather than an overall clinical score, such as the Unified Parkinson’s Disease Rating Scale (UPDRS) [20], could lead to targeting the most relevant biomarker candidates. In our study, particular attention was given to the choice of clinical outcomes in order to achieve a fine-grained selection of biomarkers. This approach allows to find only relevant and specific signatures associated with the sub-clinical manifestation of PD. The clinical variables were thus carefully pre-selected, taking into account the characteristics of the Nucleipark study subjects [2], with the aim of identifying lipid and gene biomarkers related to models involving primarily motor, cognitive or emotional symptoms. Likewise, we performed three separate multimodal integrative analyses to determine associations between omics data (metabolomic, lipidomic and transcriptomic) and three sets of clinical variables that were pre-selected to be the most representative of either motor, cognitive or emotional symptoms. Note that the term “multimodal” refers in this work to the use of multiple and heterogeneous data acquired from different technologies on the same study subjects, as detailed in our previous work [21].
To this end, we employed regularized generalized canonical correlation analyses (RGCCA) [22], a method that we have already used successfully to study omics and imaging data in spinocerebellar ataxias [21], and subjects at risk of Alzheimer’s disease [23]. In this study, we included a sparse variable selection procedure [24] allowing the selection of the most relevant candidate markers in the omics data to explain sub-phenotypic (clinical) traits of interest.

2. Materials and Methods

2.1. Design and Participants

Data were obtained from a clinical study (Nucleipark) investigating the disease severity and progression in idiopathic PD patients [25] recruited in the movement disorders clinic of Pitié-Salpêtrière Hospital between April 2010 and September 2012. Patients had different levels of motor, emotion and cognition impairments. Postural instability was defined as a retropulsion pull test score of 2 (item 30 of the UPDRS-III; score range, 0–4) in the “best-on” condition (1 h after the usual morning levodopa equivalent dose of 150 mg). As our work was focused on finding prognostic signatures associated with PD sub-phenotypes, no healthy volunteers were included in our study design. The exclusion criteria were any additional neurological disorder and a mechanical cause of gait disorders.
Baseline demographic and clinical characteristics for the PD patients were reported for sex, age, duration since PD diagnosis, height, weight, body mass index (BMI) and UPDRS-III (motor) [20] in both off- and on-medication states, and Hoehn and Yahr (HY) stages [26]. Data were summarized as n (number of available values), mean ± standard deviation (SD) and range (minimum and maximum) for quantitative variables and frequency counts and percentages for categorical variables. In our statistical analyses, only UPDRS-III OFF were used to probe the disease severity of PD patients. Clinical variables were pre-selected by a PD clinical expert (C.E.) and grouped into three blocks respectively describing the motor, cognitive and emotional status of the PD patients. Details about the selected clinical variables are reported in Section 2.5.
The entire analysis was conducted on a total of 48 PD patients for whom both blood samples and clinical testing were available. Of these 48 PD patients, transcriptome profiles from RNA sequencing (RNA-seq) were available for 31 patients, and plasma metabolite and lipid profiles were respectively available for 48 and 47 patients, with an overlap of 30 patients for whom all three types of omics data were available.

2.2. RNA-Sequencing from Monocyte Samples

Thirty-one patients were studied from the Nucleipark cohort. Monocyte cells were purified from peripheral blood mononuclear cells (PBMCs). More than 106 monocyte cells were stored at −80 °C. RNA was extracted from monocyte cells using the AllPrep DNA/RNA/miRNA Universal Kit (Qiagen GmbH, Hilden, Germany), following the manufacturer’s instructions for RNA elution. RNA samples were quantified using NanoDrop (Thermo Fisher Scientific, Villebon-sur-Yvette, France) and the RIN was evaluated using Agilent RNA 6000 Nano kit on Agilent 2100 Bioanalyzer (Agilent Technologies, Les Ulis, France). Library preparation was performed starting with one µg of RNA and using TruSeq v3 Stranded mRNA Library Prep Kit (Illumina, San Diego, CA, USA) according to the manufacturer’s protocol. They were equimolarity pooled in 4-plex per lane and they were sequenced in paired-end reads (2 × 100 bases) on an Illumina HiSeq2000 platform. After sequencing, the read quality was checked with fastQ software (version 0.11.3) (http://www.bioinformatics.babraham.ac.uk/projects/fastqc/) and trimmed with a quality threshold of 30 using trimmomatic (version 0.39) [27]. The reads were then aligned against the Ensembl human reference genome GRCh37 with Tophat2 (version 2.0.13) [28]. We used Picard-Tools CollectRNASeqMetrics (version 2.6.0) [29] to calculate the mapping rate, the duplication rate and the average insert size. Finally, we used htseq-count (version 0.9.1) [30] to assign and count the reads for all of the Ensembl GRCh37 gene models. RPKM were calculated using an in-house R script based on reference GRCh19 [31].

2.3. Metabolomics and Lipidomics

Reagents and sample preparation of human plasma are detailed in the Supplementary Materials (File S1). Metabolomics were performed using a “PFP column” (Discovery HS F5 3 µm, 2.1 mm × 150 mm Sigma, Saint Quentin Fallavier, France), a hydrophilic interaction liquid chromatography column (ZIC-pHILIC 5 µm, 2.1 mm × 150 mm; Merck, Darmstadt, Germany) and an Acquity ultra-performance liquid chromatography column (Waters Corp, Saint-Quentin-en-Yvelines, France) coupled to a Q-Exactive mass spectrometer (Thermo Fisher Scientific, San Jose, CA, USA). Lipidomics experiments were performed using a reverse phase chromatographic column, a kinetex reverse phase C8 2.6 µm, 2.1 mm × 150 mm (Phenomenex, Sydney, NSW, Australia), and a Q-Exactive plus mass spectrometers (Thermo Scientific, San Jose, CA, USA). Experimental settings for metabolomics and lipidomics global approaches by LC-HRMS were carried out as detailed in Garali et al., 2017 [21]. All processing steps were carried out using the R software version 3.6.1 (R Development Core Team, 2019; https://www.R-project.org/). First, LC-MS raw data were converted into mzXML format using the MSconvert tool [32]. Peak detection, correction, alignment and integration were then undertaken using the Workflow4metabolomics platforms built on the Galaxy environment [33] (https://workflow4metabolomics.usegalaxy.fr (accessed on 25 July 2018)). The resulting datasets were log10-normalized, filtered and cleaned based on quality control (QC) samples as described in Dunn et al., 2011 [34]. Lipidomic features were annotated thanks to an in silico lipid database and based on accurate measured masses, retention time windows and relative isotopic abundance (RIA) of lipid species as described in Seyer et al., 2016 [35]. All statistical analyses were performed using R version 3.6.1 (R Development Core Team, 2019; https://www.R-project.org/), and plots were generated with the ggplot2 R package (v3.3.0) [36].

2.4. Integrative Analysis

Due to a major treatment effect in the metabolomic data (Figure S1), the study was carried out only on transcriptomic and lipidomic data where the medication effect was less noticeable. Integration of omics (transcriptomic and lipidomic) and clinical data was conducted to identify the subsets of lipids and genes associated with three categories of PD symptoms. As mentioned previously, the clinical variables were pre-selected by a PD clinical expert (C.E.) and grouped into three blocks describing the motor (five variables), cognitive (five variables) and emotional (three variables) status of the PD patients. These clinical variables were classified in clinical models allowing biological relevant association with our omics data. The following parameters were retained for assessing the motor state: anticipatory postural adjustments (APAs) in the mediolateral (APAx) and anteroposterior (APAy) directions (recorded on a force platform), both axial (nuchal rigidity, posture, gait, postural stability, speech) and appendicular (UPDRS-III minus the axial items) subscores of the UPDRS-III evaluated in the “on” state, and a computed axial score based on the Gait and Balance Scale (GABS) [37]. The cognition was assessed based on the Mini Mental State Examination (MMSE) [38] and the Mattis Dementia Rating Scale (MDRS) [39]; and the use of three neuropsychological tests including the Stroop color-word interference test [40] for selective attention and cognitive flexibility, the Trail Making Test for the (B-A) difference (TMT B-A) [41,42] for executive function, and the 16-item free and cued recall test (FCRT) for episodic memory. Emotional disorders regarding anxiety, apathy and depression were evaluated using the Brief Anxiety Scale (BAS), the Starkstein Apathy Scale (SAS) [43] and the Montgomery and Åsberg Depression Rating Scale (MADRS) [44].

2.5. Data Pre-Processing

Prior to integrative analysis, omics and clinical data were organized into three blocks of variables with matching rows for the same PD patients: one “lipidomic” block for the log10-transformed lipid concentrations (1019 lipids), one “transcriptomic” block for the rlog (regularized log) expression values (10,716 genes), and one response block for each of the categories of clinical variables (motor, cognitive and emotional). All blocks were corrected for the covariates of sex, age and body mass index at baseline using multivariate linear regressions. The rlog expression data were obtained with the DESeq2 R package (v1.26.0) [31] after a filtering step using the genefilter R/Bioconductor package (v1.70.0) to exclude 25% of genes with the lowest variances.

2.6. Multiblock Data Analysis

Investigation of the relationships between the omics and clinical data was conducted using regularized generalized canonical correlation analysis (RGCCA) [22] (Figure 1). Based on three blocks, the relationships between omics and clinical data were modeled using the “rgcca” function in the RGCCA R package (v3.0, https://github.com/rgcca-factory/RGCCA) by calculating three linear combinations (one for each of the clinical, lipidomic and transcriptomic blocks). These combinations, hereafter called components, were built to adequately summarize their own block, while maximizing covariance-based criteria between the three blocks. Entire rows of missing values in the transcriptomic block for 17 PD patients with no data at baseline were handled by the Nonlinear Iterative Partial Least Squares (NIPALS) algorithm. Thus, by running RGCCA with NIPALS, the calculation of the components was performed using all of the available information from each block without the need to impute the missing data. Since we only focused on the relationship between the omics blocks and the clinical block, the mutual relationship between the two omics blocks was not taken into consideration. The block components were extracted from a maximization criterion defined by the sum of the two squared covariances between the first component of the omics blocks and the first component of the clinical block. To address feature selection, the “rgcca” function was used with its sparsity-integrated method [24], which allowed us to select the most relevant lipids and genes for explaining the clinical categories of symptoms. In this regard, the fine-tuning of the sparsity coefficients (one coefficient for each omics block) is a key step of the modeling to determine the weights that should be set to zero for the less important variables (or alternatively the numbers of lipids and genes to be retained). Optimization of the sparsity was achieved using several runs of “rgcca” covering different combinations of candidate values of the sparse coefficients (s) for the two omics block, ranging from 1 / n v a r b l o c k (highest level of selection for the block) to 1 (no selection), with nvarblock denoting the number of variables of the block. Finally, the best model was the one that gave the maximum R-squared value (R²) from leave-one-out cross-validation in the linear regression of the clinical component as a dependent variable, and both lipidomic and transcriptomic components as independent variables. Moreover, to determine which omics best explained the clinical category of symptoms, the effect sizes were compared using the standardized regression coefficients (t values) of the regression as a measure of the strength of association with the clinical component. For each model, PD patients were represented using the first two clinical components on an X–Y plot, and the values of the UPDRS-III OFF were indicated on a color gradient (varying on a blue-red scale). Although not included in the integrative model, the global UPDRS-III OFF was used as a reference score to indicate the severity of dopaminergic or non-dopaminergic motor impairment in the Nucleipark patients. Omics features selected by the clinical models were plotted in correlation circles and in horizontal barplots sorted by decreasing values of their weights (loadings) on the omics components.

2.7. Stability of the Omics Selections

To study the biological processes associated with the clinical models, extensive lists of genes and lipids were extracted by bootstrap analysis. Based on 1000 bootstrap replications of the blocks, the variables most frequently retained by the RGCCA models were selected with the previously optimized sparse coefficients in a robust approach taking into account subject variability. As the frequency of a selected feature may depend on both the level of sparsity and the total number of variables in each omics block, an additional binomial test was applied. The most robust features were then assessed based on a binomial distribution B(n,p), with n denoting the number of bootstraps and p the average number of selected features in the bootstraps divided by the total number of variables in the block (nvarblock). All omics whose frequency of selection in the bootstraps exceeded the (1–0.05/nvarblock)-th quantile of B(n,p) were considered as candidate genes or lipids for further biological process analyses. Finally, for each category of PD symptoms, this step allowed the extraction of two lists of omics (one list of genes and one list of lipids) that were found to be the most closely linked with the clinical data.

2.8. Biological Processes

Gene ontology (GO) and Kyoto Encyclopedia of Genes and Genomes (KEGG) pathway enrichment analyses were conducted on the selected genes using the clusterProfiler R/Bioconductor package (v3.14.3) [45]. Redundant GO terms were removed using the compEpiTools R/Bioconductor package (v1.20.0) [46]. GO and KEGG terms with adjusted p-values < 0.05 (by the Benjamini–Hochberg method) were considered to be significantly enriched. Information from the selected lipids was extracted according to the distribution of six lipid classes from the LIPID MAPS Structure Database (LMSD) [47] (https://www.lipidmaps.org (accessed on 4 November 2021)): fatty acyls, glycerolipids, glycerophospholipids, sphingolipids, sterols (cholesteryl ester, steroids) and miscellaneous (free base). Comparisons for the lipid classes distributions between the three clinical models (motor, cognition and emotion) were represented by stacked barplots showing the cumulative percentages of the classes for each clinical model, and differences in proportions were evaluated using chi-squared tests at a significance level of p < 0.05.

3. Results

3.1. Patient Characteristics

The 48 PD patients had a mean age ± standard deviation (SD) of 61.5 ± 7.9 years (range 45.6–81.1), with 14 women (29.2%) and 34 men (70.8%), and a mean body mass index (BMI) of 25.3 ± 3.2 (18.9–33.4). The mean age at disease onset was 52.3 ± 9.4 years (25–73) with a mean disease duration of 8.9 years ± 3.6 (2–23). The diversity of the disease progression was indicated by a mean UPDRS-III motor scores of 29.6 ± 10 (8–50) in the off-medication condition and of 15.7 ± 8.9 (2–39) in the on-medication condition, and by a median Hoehn and Yahr stage of 2 (n = 47, interquartile range 2–2.5, range 1–3). More detailed description of the clinical assessments is reported in Table S1.

3.2. Omics Analyses

Peripheral blood samples were collected from all 48 PD patients at baseline for transcriptomic (RNA-seq), metabolomic and lipidomic analyses. From these samples, quantitative data of 10,716 genes (31 patients), 3847 metabolomic (48 patients) and 1019 lipidomic (47 patients) features were extracted to study their associations with clinical variables. In previous studies of the Nucleipark cohort, grouping individuals into three clinical classes indicating either impaired postural control, combined (14 patients) or not (13 patients) with rapid eye movement sleep behavior disorder (RBD), or the presence of RBD without impaired postural control (21 patients), was successfully used to identify imaging markers and brain regions associated with patients’ clinical features [2,47,48]. Conversely, here, the differential analyses of omics data conducted with these clinical groups did not allow identifying discriminating variables. In addition, analysis of the metabolomics data showed a large effect of dopaminergic treatments (Figures S1 and S2). A significant change from the aromatic amino acids metabolism, such as tyrosine pathways, was indeed found to be the main discriminating factor between two classes of patients, subsequently characterized by their treatment difference (Figure S2). Note that no drug effect was found in transcriptomic and lipidomic data (Figure S1). Consequently, our integrative analysis was performed using only transcriptomic and lipidomic data to prevent treatment interference in the integrative analysis. The used clinical scores were selected to reflect motor (five variables), cognitive (five variables) and emotional (three variables) symptoms of patients at baseline as explained in the Materials and Methods section.

3.3. Multiblock Models for Omics–Clinical Associations

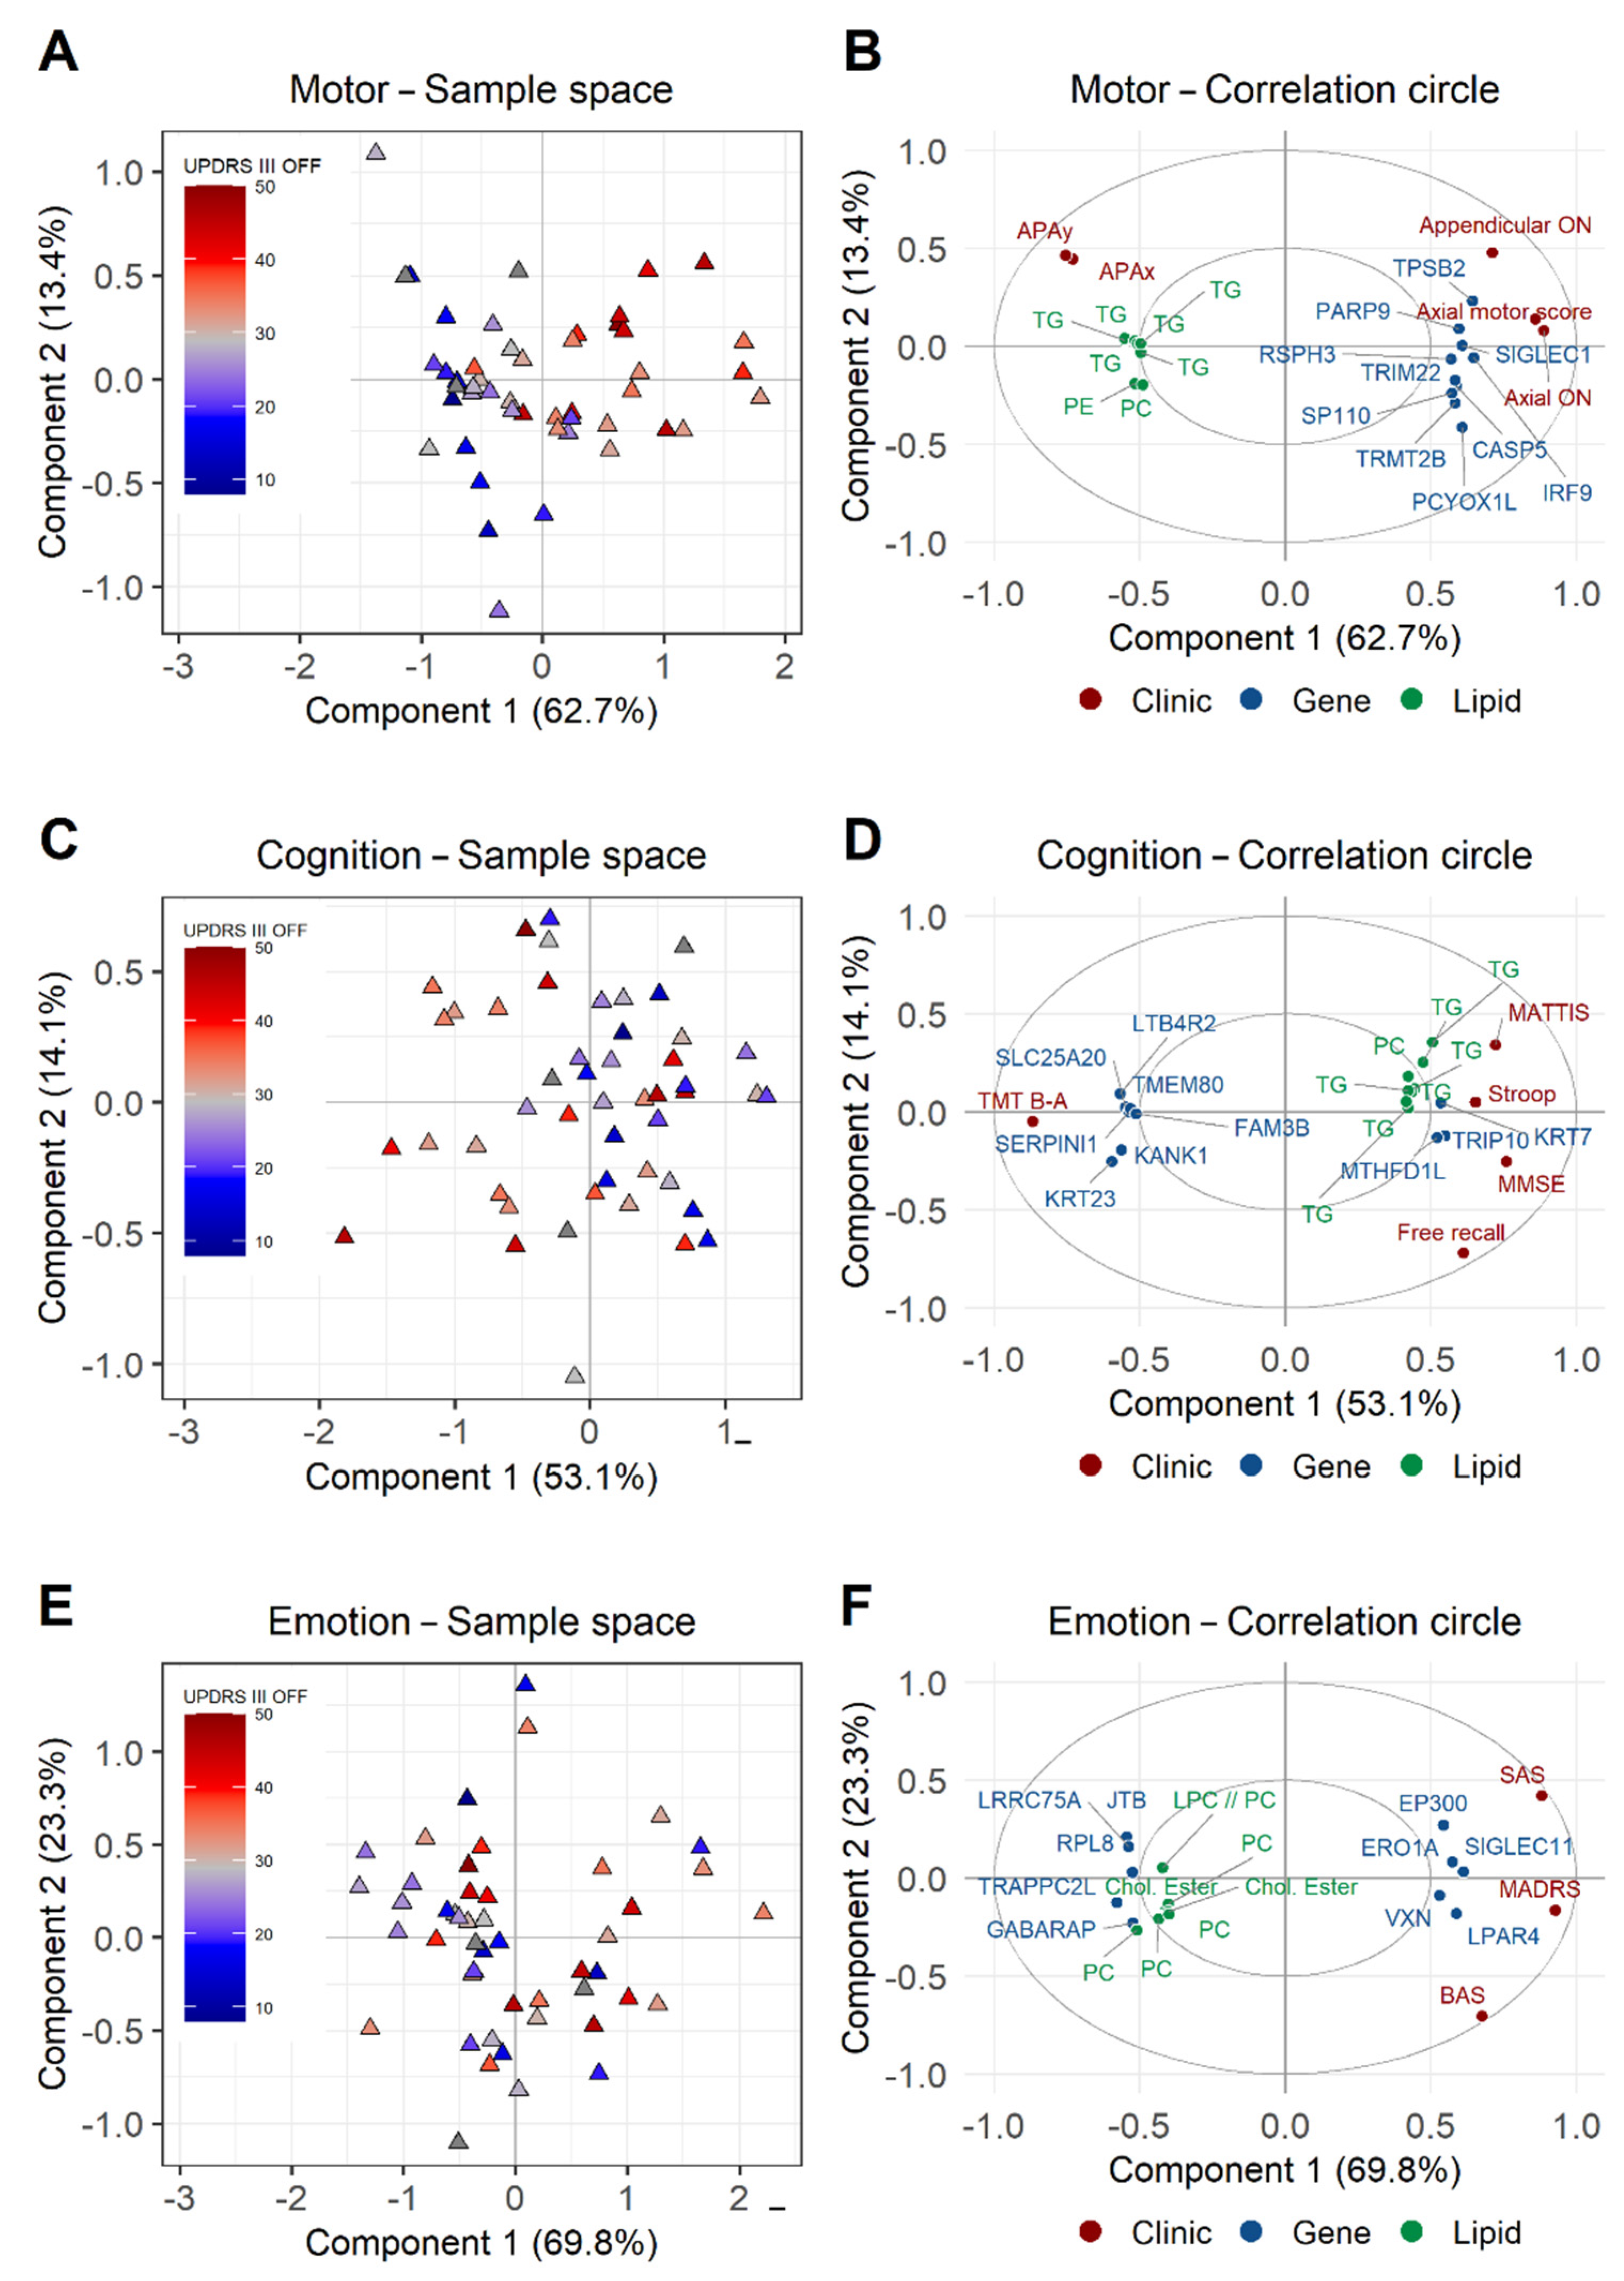
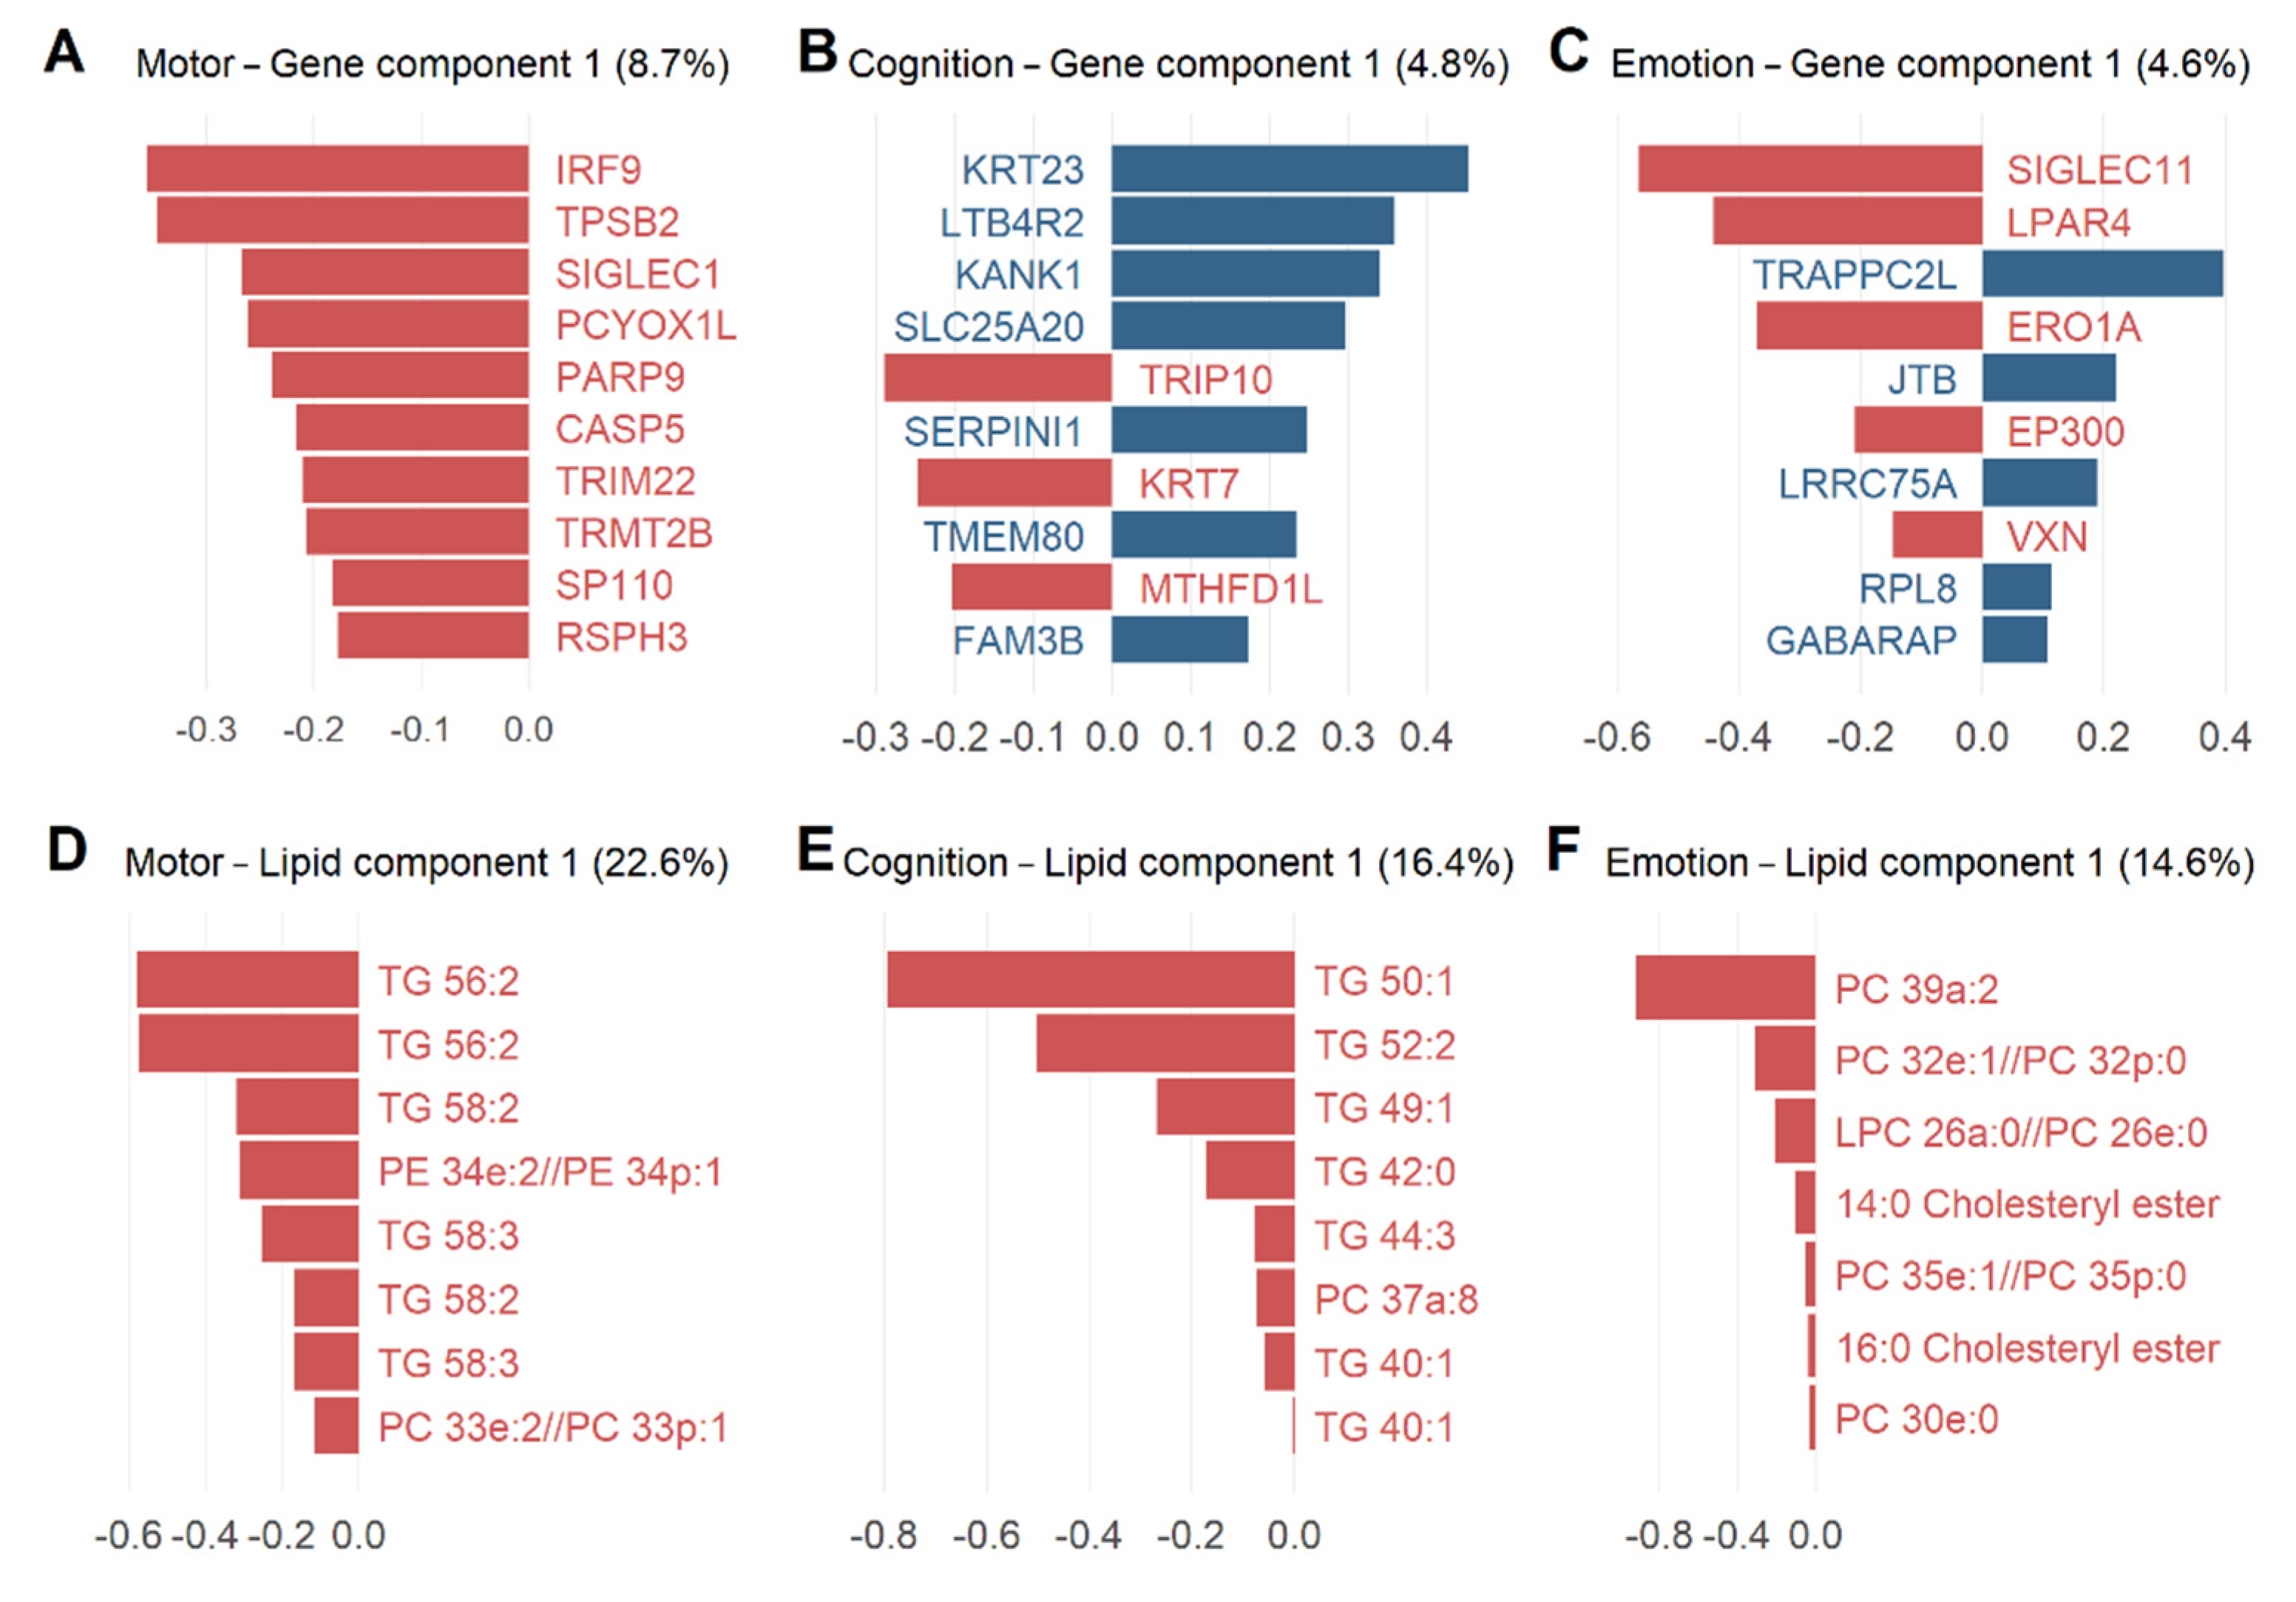
In our notation, the subscripts l and g are used for lipids and genes. Based on omics and clinical data (adjusted for BMI, age and sex), correlations between lipids, genes and clinical variables were identified in three separate models for motor, cognitive and emotional symptoms (Figure 2). The variable selection was performed using the following sparsity parameters (s) in RGCCA that were optimized with respect to the highest R-squared values (R²): sl = 0.078, sg = 0.059 and R² = 0.63 for the motor model; sl = 0.061, sg = 0.038 and R² = 0.65 for the cognition model; and sl = 0.052, sg = 0.029 and R² = 0.60 for the emotion model. The s values were close to the theoretical minimum for a high level of selection, suggesting that the models were built with a rather small number of genes and lipids selected for their association with clinical data. With these s values, the number of lipids and genes retained by the two omics components in each model were nl = 8 and ng = 62 (motor), nl = 8 and ng = 22 (cognition) and nl = 7 and ng = 17 (emotion). Based on the R² values, we found that omics data better explained cognitive variables, followed by motor and emotional variables. For the t values, we also found a higher effect size of the transcriptomic component compared to the lipidomic component in all models (motor: tl = 3.59 vs. tg = −5.68; cognition: tl = −3.24 vs. tg = −6.52; emotion: tl = 3.80 vs. tg = −5.63). The first 10 genes and lipids that contributed to the construction of these omics’ components are reported in increasing order of weights in the loading plots (Figure 3).
For data visualization, individuals and variables were represented in a common space defined by the two clinical components that were found to be the most correlated with the omics’ components (Figure 2). For each clinical model, the different clinical profiles of the cohort were plotted in the sample spaces (Figure 2A,C,E) and associated in the correlation circles with the most important omics variables retained by the clinical models (Figure 2B,D,F, only including the top 10 gene and lipid loadings to ease visualization). In sample spaces, individuals were displayed in a blue-to-red color gradient to compare the clinical signs with increasing severity of motor impairment (UPDRS-III OFF). This revealed an association between UPDRS-III OFF with the component 1 of the motor (Figure 2A, Pearson correlation coefficient: r = 0.64) and cognitive (Figure 2C, r = −0.39) models, while there was no association with the emotion model (Figure 2E, r = 0.16). In correlation circles, the top 10 genes and lipids were shown with the clinical variables used in the motor, cognition and emotion models (Figure 2B,D,F).
Within the motor model, we found a positive correlation of the clinical component 1 with gene expression (blue) and a negative correlation with lipid levels (green) with increasing UPDRS-III OFF values (Figure 2A). All of the plotted genes showed positive correlations with UPDRS-III OFF and the axial and appendicular motor scores, and negative correlations with impairments of APAx and APAy (top five genes: IRF9, TPSB2, SIGLEC1, PCYOX1L and PARP9). Conversely, there were six lipids, all triglycerides (TG) negatively correlated with the motor model (Figure 2B). Within the cognition model, we also found an association between the omics and UPDRS-III OFF scores. We identified four genes (KRT23, LTB4R2, KANK1 and SLC25A20) whose expression positively correlated with increasing UPDRS-III OFF scores and TMT B-A, but negatively correlated with MATTIS, MMSE, Stroop and Free Recall. With an opposite pattern, cognitive variables were associated with one gene (TRIP10), several TGs and phosphatidylcholines (PC) (Figure 2D). Within the emotion model, three genes (SIGLEC11, LPAR4 and ERO1A) were positively correlated with SAS, MADRS and BAS. Two genes (JTB and TRAPPC2L) were negatively correlated with emotional variables alongside top lipids from PC (five lipids) and cholesteryl esters (CE) (two lipids) (Figure 2F).

3.4. Consensus Integrative Analysis

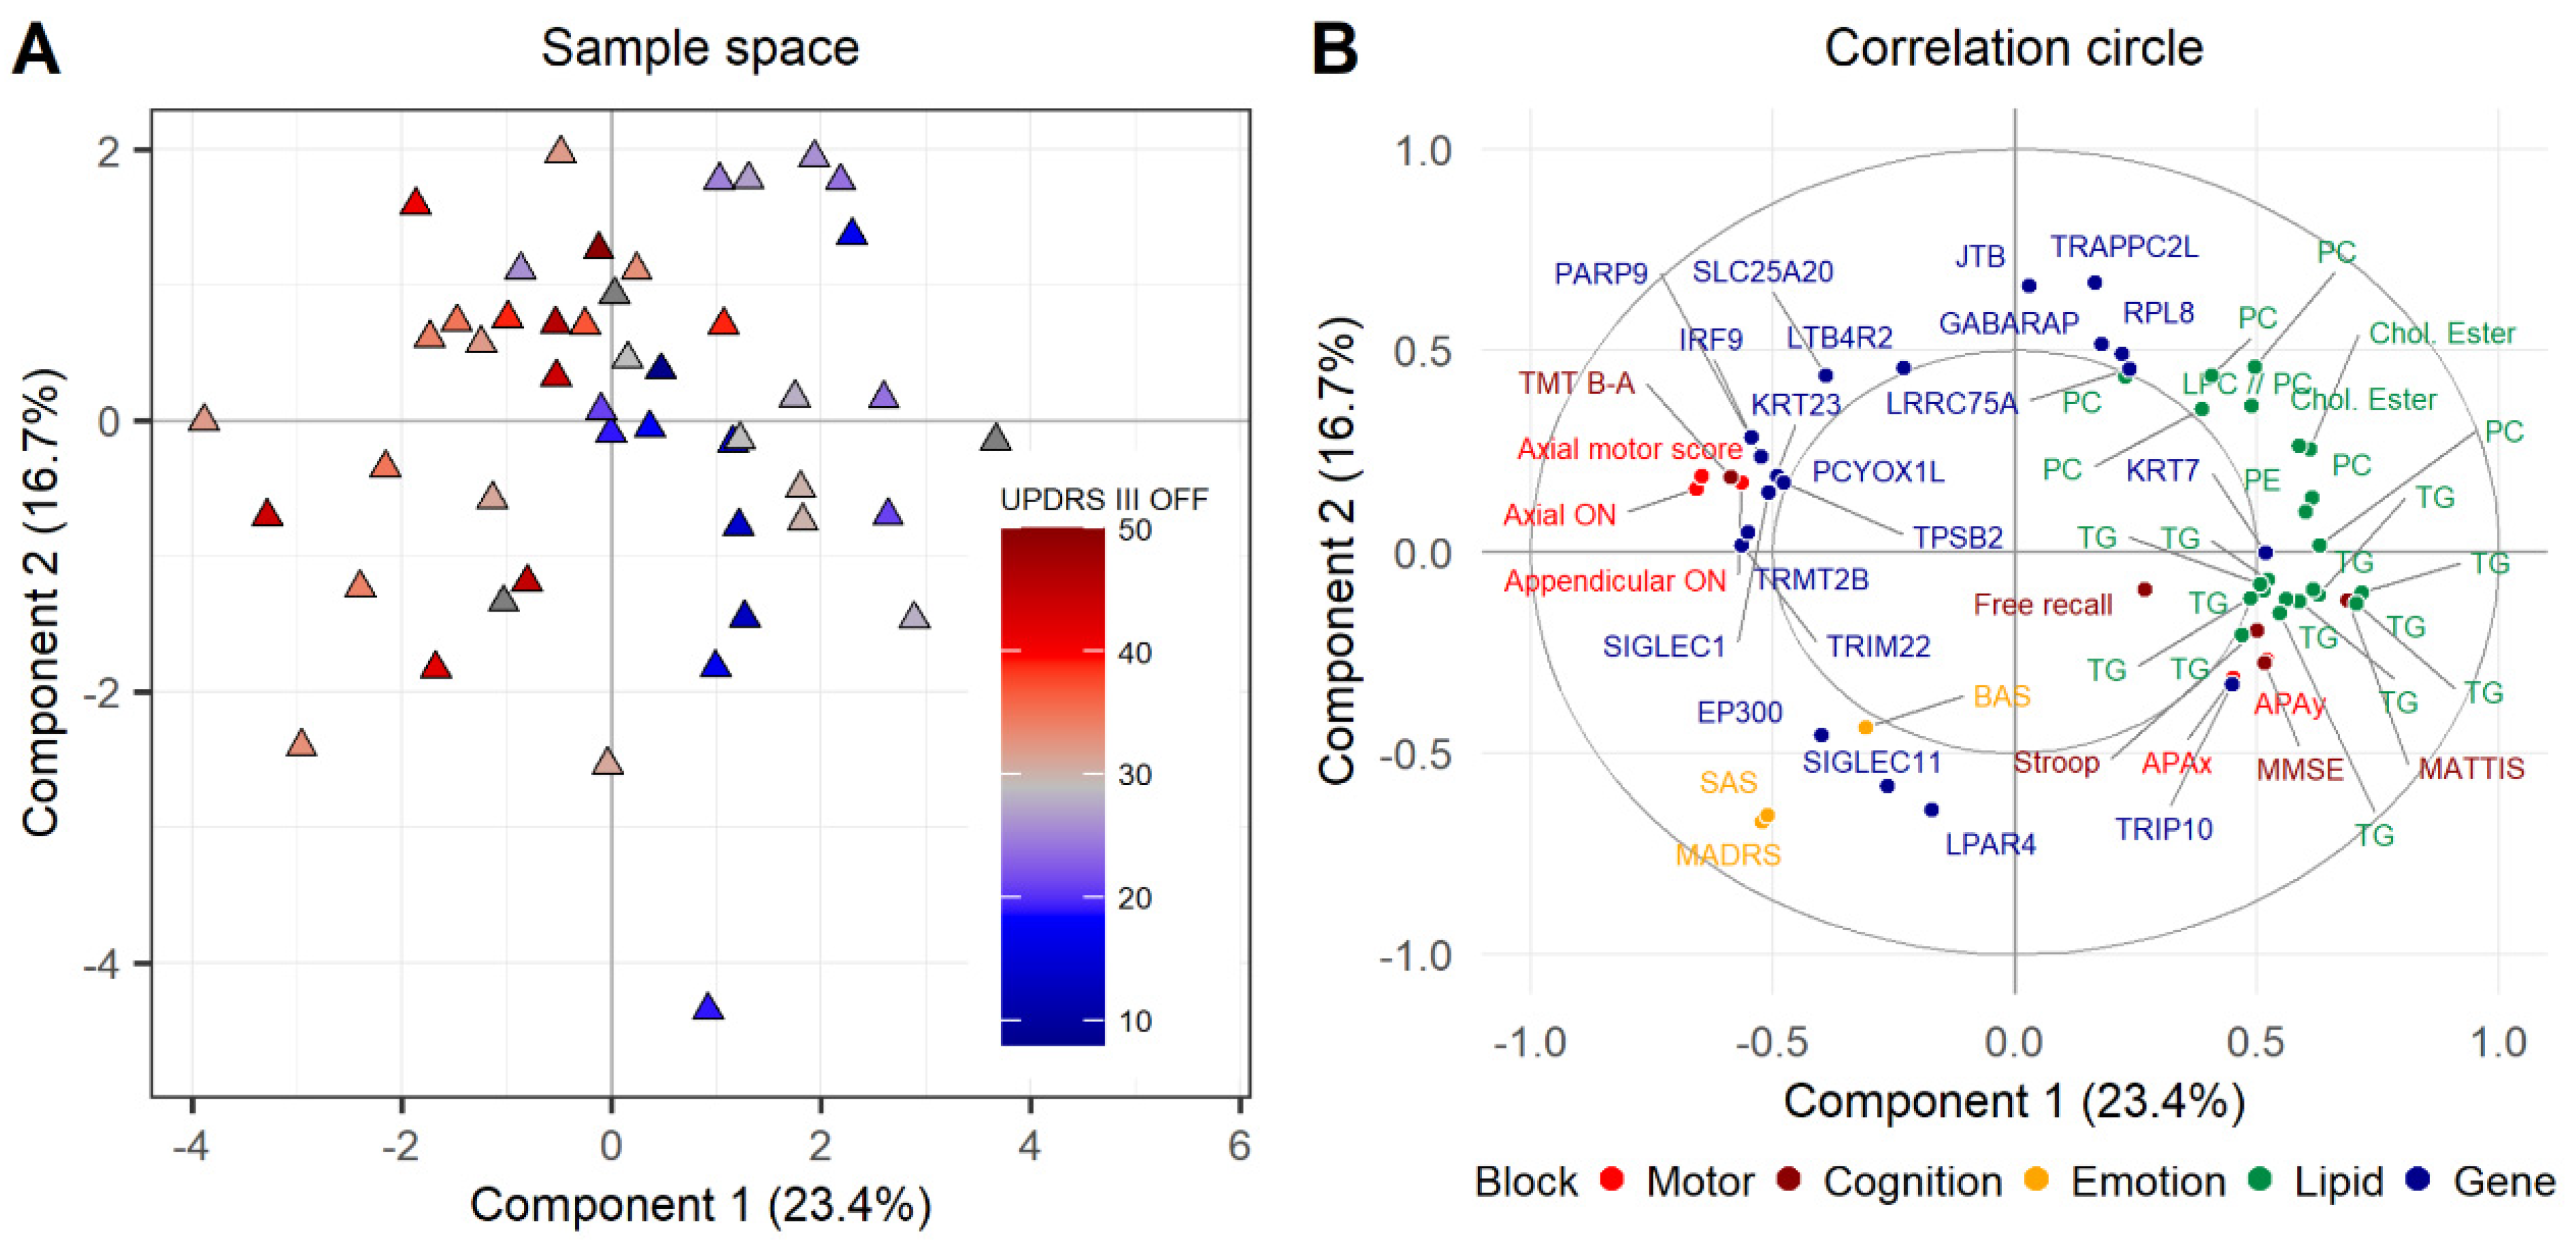
To obtain a synthetic view of our analyses, we merged the clinical and omics components of the three clinical models into a “super-block”, thus combining all lipids and genes used to build the three clinical models (Figure 4). Then, a principal component analysis was performed to extract the two first components of the super-block. These components allowed PD patients to be represented in a global space synthesizing the relationships between the clinical and omics variables of the clinical models. For motor signs, component 1 was the most correlated with UPDRS-III OFF (r = −0.57) compared to component 2 (r = 0.18). The circle of correlations characterized component 1 mainly by motor and cognitive variables, whereas component 2 was rather driven by emotional variables.

3.5. Potential Candidate Lipids and Genes Associated with Clinical Models

Investigation of biological processes associated with the clinical models identified large lists of candidate genes and lipids. The most stable omics features were determined based on 1000 bootstrap resampling indicating the frequency of omics selection for each clinical model. The selection criterion based on a binomial test allowed us to obtain list of the most represented genes and lipids: nl = 132 and ng = 140 (motor), nl = 135 and ng = 132 (cognition) and nl = 146 and ng = 157 (emotion). These lists ranked by selection frequency are provided in Table S2, and have been used to study their distribution in KEGG, GO or lipid class annotation databases.
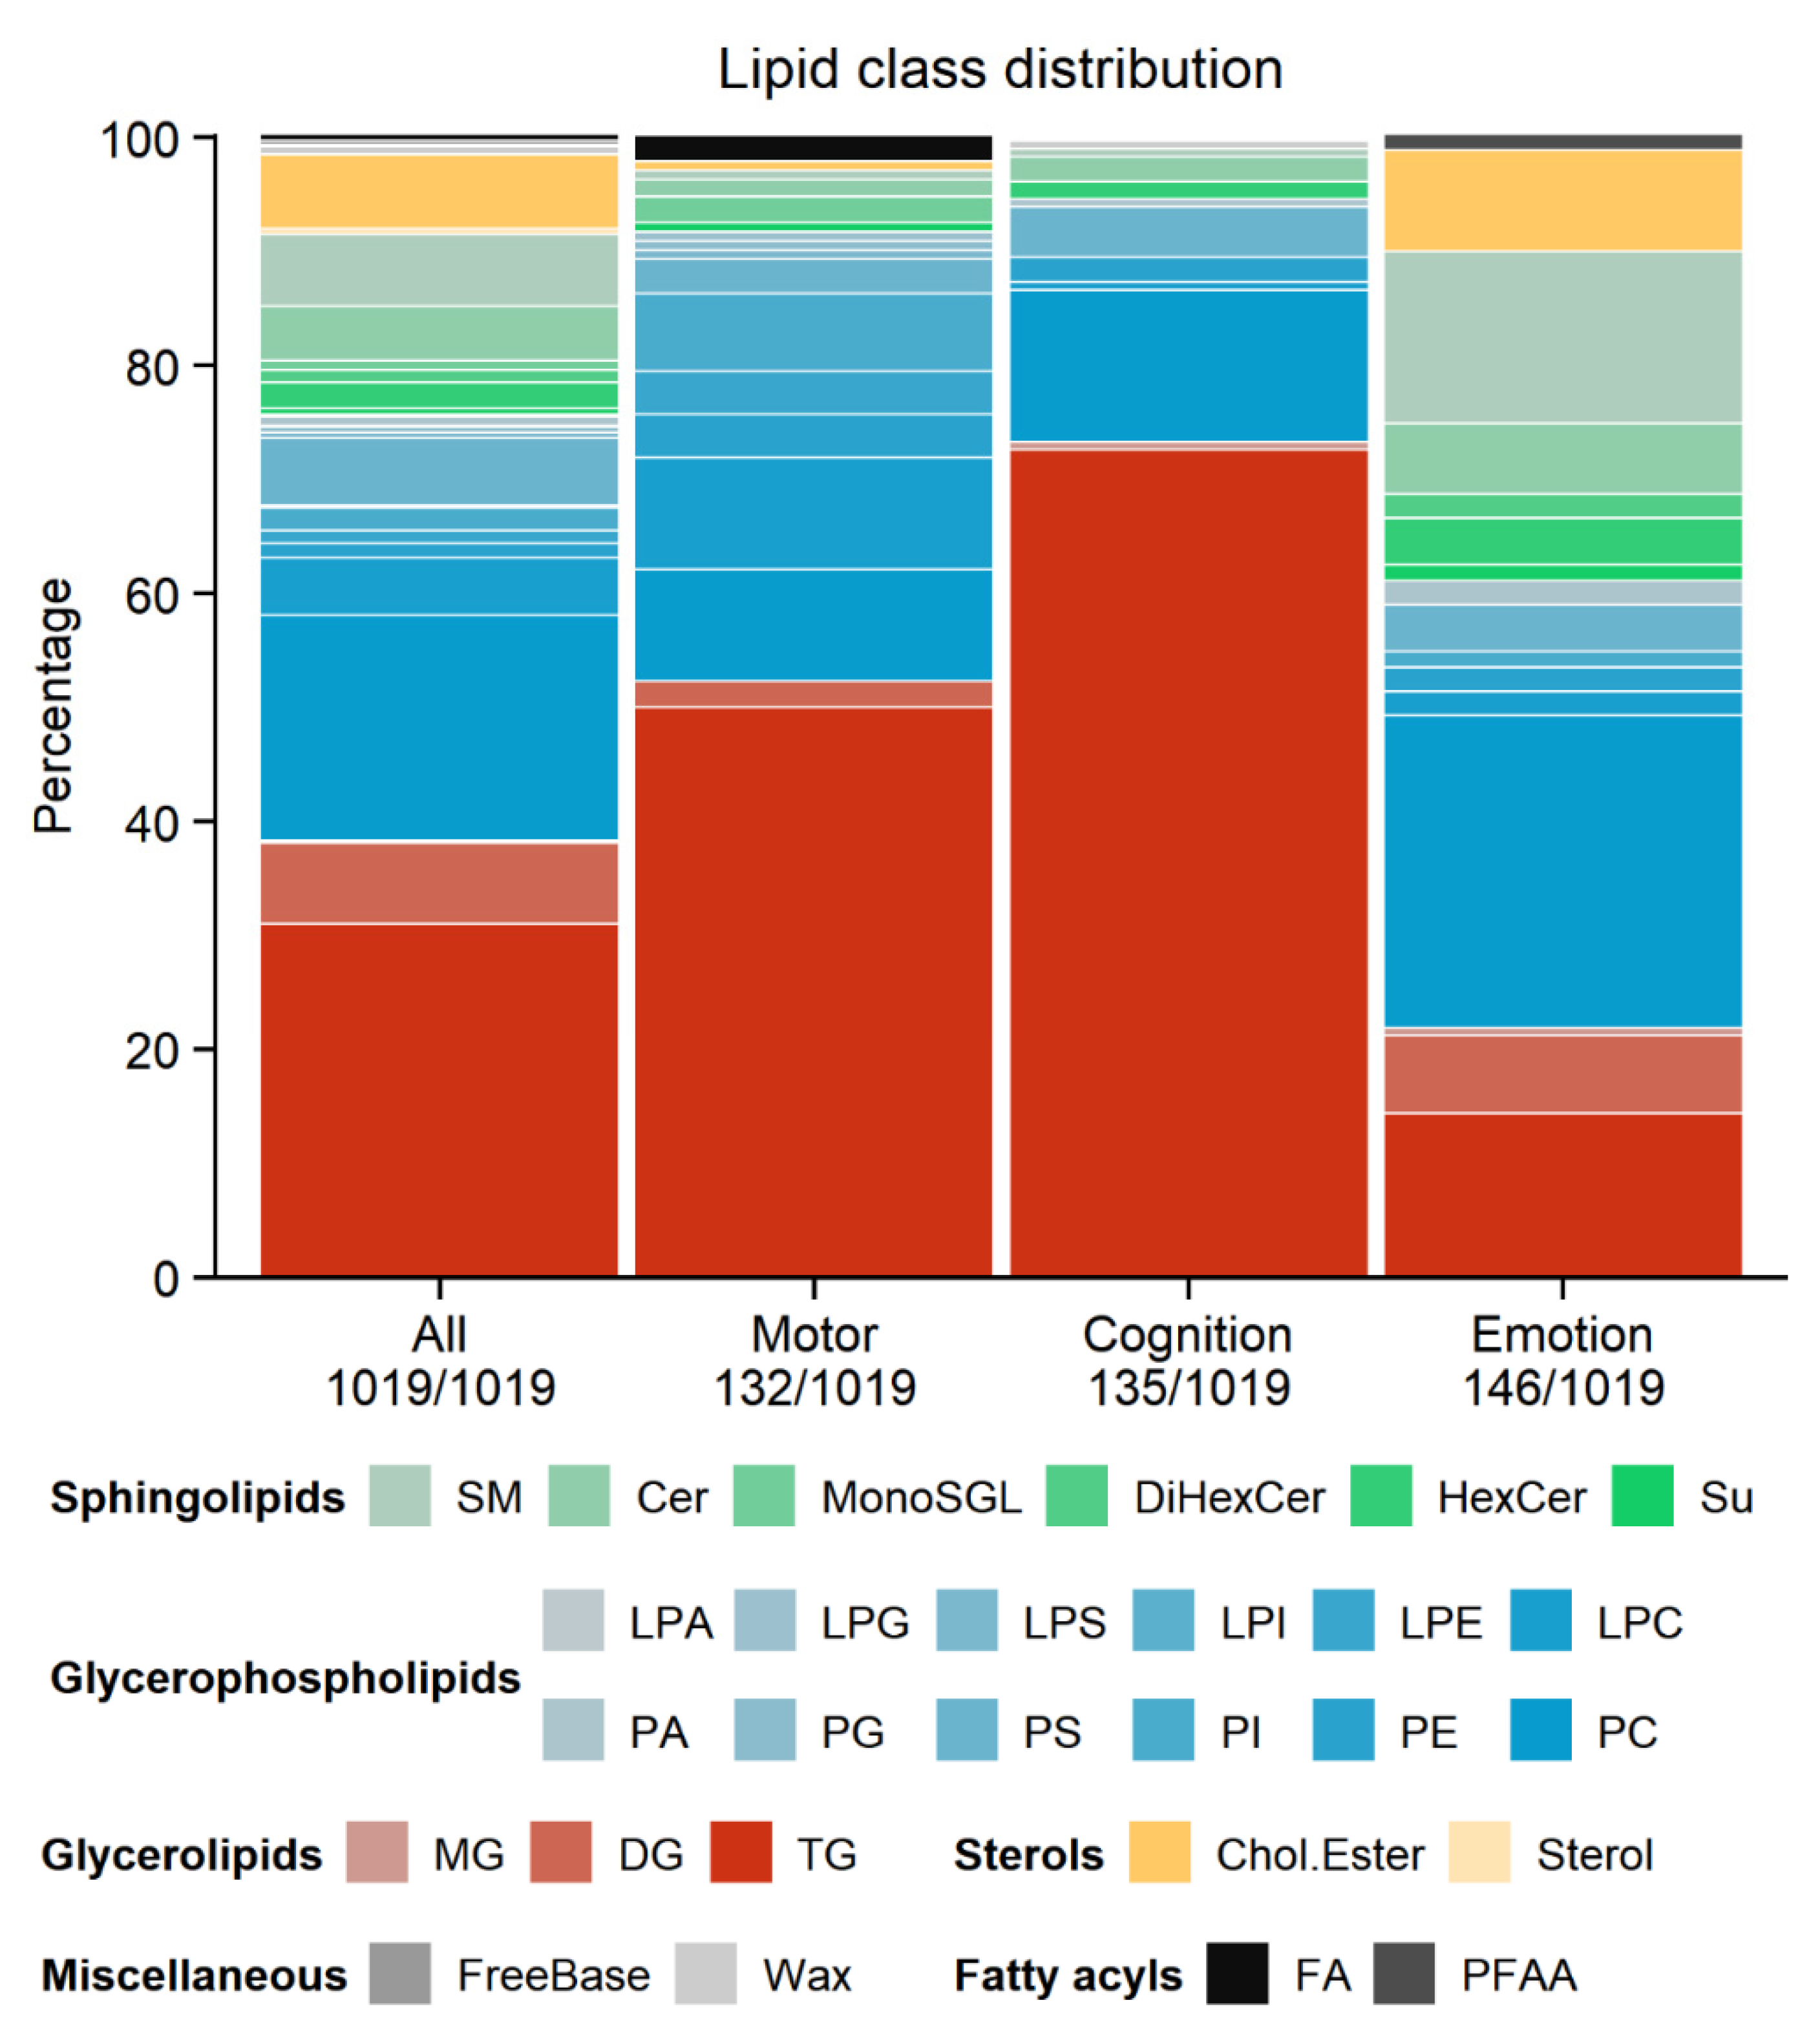
Among lipids, the proportion of associated lipid classes and sub-classes varied depending on the clinical models (Figure 5). We found that 132, 135 and 146 species were associated with the motor, cognition and emotion models, respectively. Interestingly, we obtained a similar number of individual lipids associated with the clinical models. The main difference came from the distribution among lipid classes and sub-classes. In motor and cognition models, glycerolipids were the major fraction compared to other lipid classes (chi-squared test for equality of proportion: cognition 73.3% > motor 52.3% > emotion 21.9%, p < 0.0001). Notably, 73.3% of lipid species associated with cognition were TG. Other lipid classes varied as well, such as sterol lipids (CE and sterols), which were not associated with cognition but with motor variables. Glycerophospholipids were equally represented in motor and emotion models with a percentage of 39%, whereas only 21% were associated with the cognition model (cognition 21.5% < motor 39.4% and emotion 39.0%, p = 0.002). However, glycerophospholipids were not distributed in the same proportion within the motor and emotion models. PC and lysophosphatidylcholine were more significantly associated with the emotion model. Sphingolipids (SM, Cer, MonoSGL, DiHexCer, HexCer, Su) and sterols were also mainly represented in the emotion model while they were almost nonexistent in the motor and cognition models.
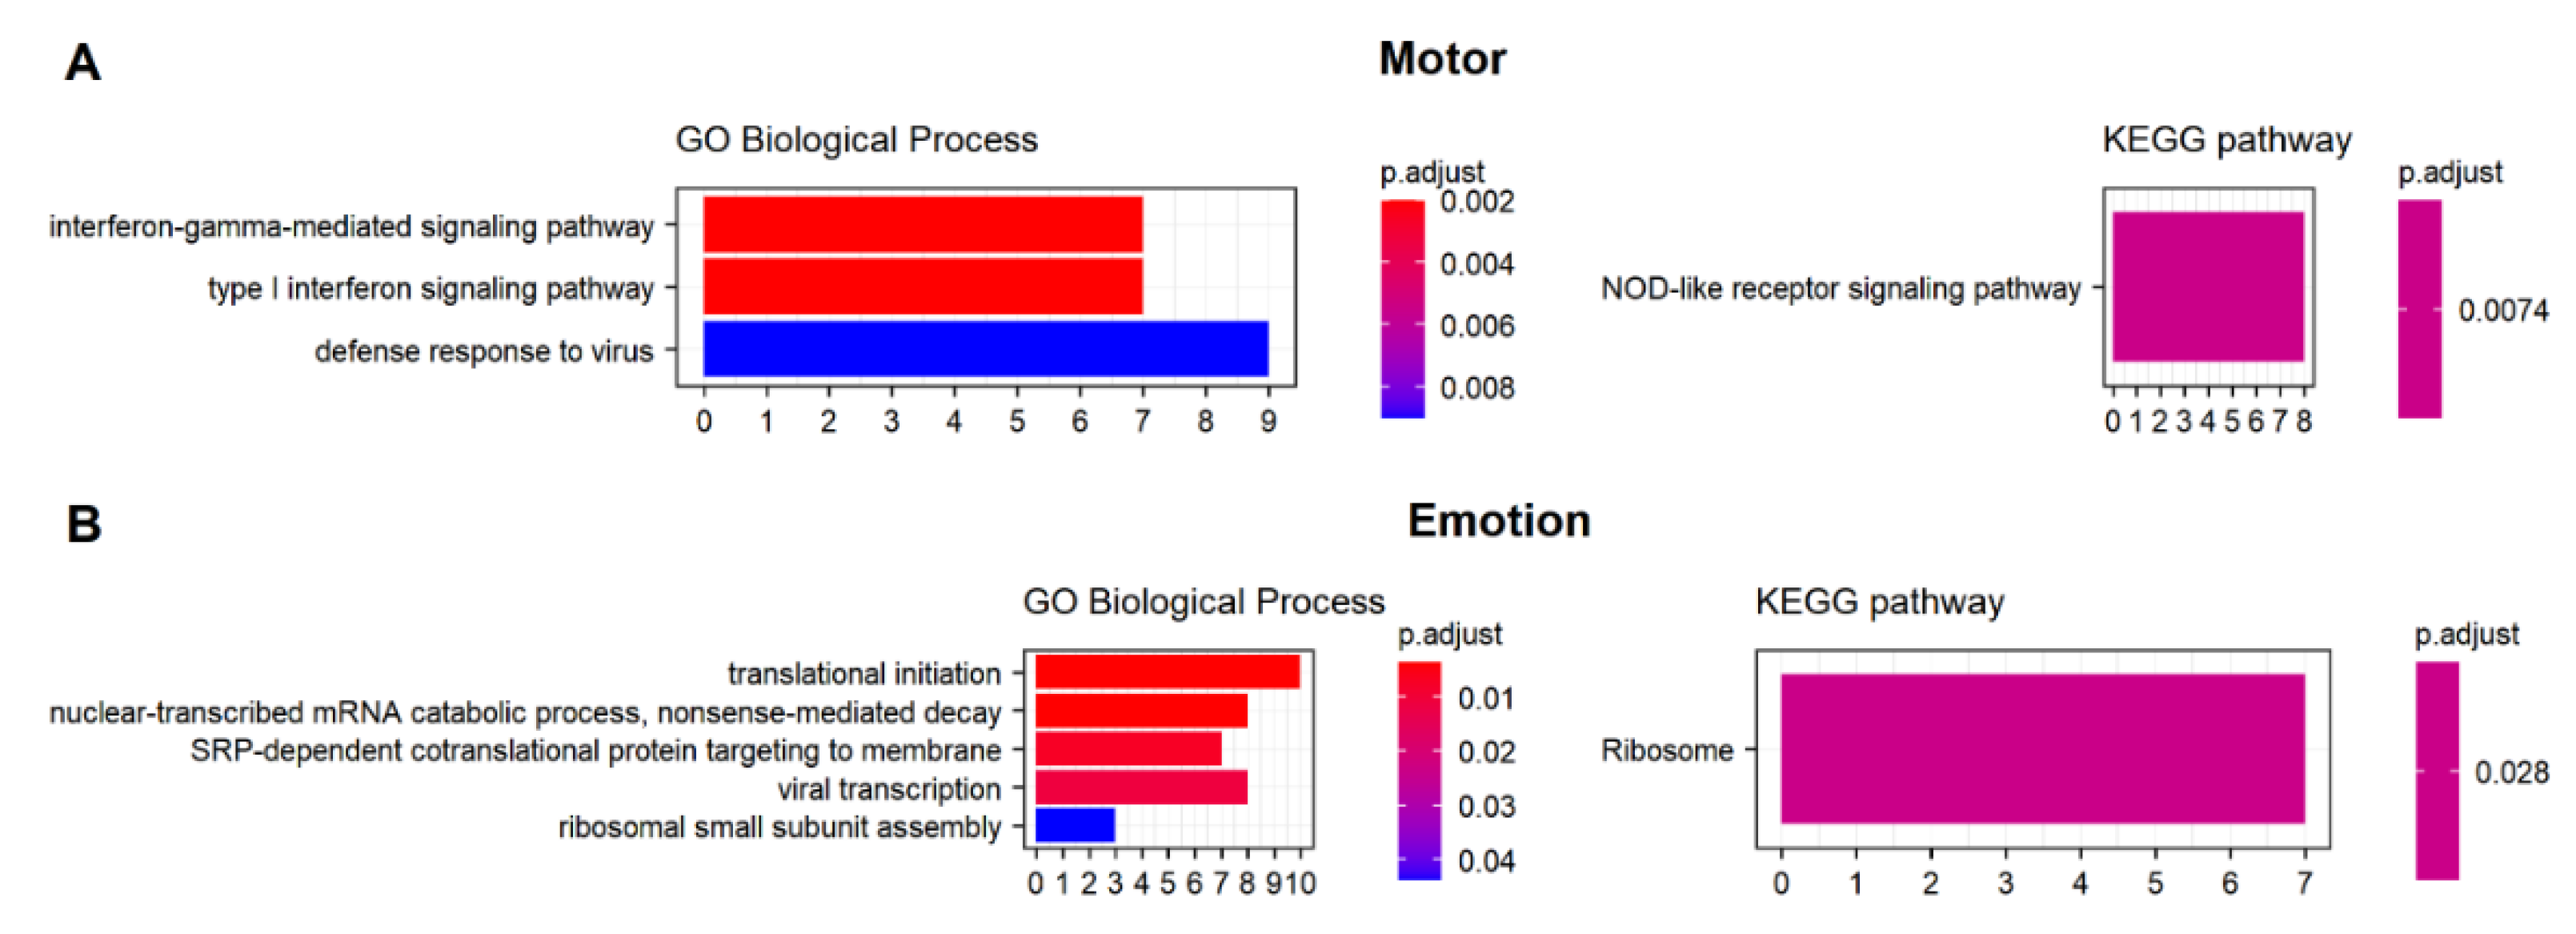
From the list of top genes pointed out by the bootstrap analysis, enrichment analyses of GO terms (Biological Process, BP) and KEGG pathways mainly revealed an association of motor variables with inflammatory markers (Figure 6A). Furthermore, GO analysis showed that most of the relevant genes in the motor model were related to pro-inflammatory cytokines and interferon-gamma (IFN-ɣ) pathways (clusterProfiler: seven genes, IRF9, TRIM22, SP100, PARP9, IRF7, GBP1, GBP2, adjusted p = 0.002), whereas KEGG analysis showed an enrichment of the Nod-like receptor signaling pathway (eight genes: IRF9, STAT2, CASP5, GBP5, IRF7, NOD2, GBP1, GBP2, adjusted p = 0.007). The emotion model showed an enrichment for the KEGG ribosome pathway (seven genes: RPL8, RPSA, RPS14, UBA52, RPLP2, RPS10, RPL13A, adjusted p = 0.03), while the top five GO BP mainly indicated enrichment for translational processes through ribosomal subunits, and for (viral) transcription (annotations common to all three genes: RPSA, RPS14, RPS10, all adjusted p < 0.04) (Figure 6B).

4. Discussion

Our multimodal approach identified several associations between lipids, genes and clinical models of PD. Likewise, we identified distinct blood signatures associated with motor, cognition and emotion symptoms of PD, suggesting that different pathophysiological pathways are involved in PD sub-phenotypes (motor, cognitive, emotional). Using both omics block-oriented and integrative approaches, our study identified candidate lipids and genes associated with our clinical models. We applied both approaches to identify a biological signature based on lipid or gene sets and a consensus signature integrating all omics data.
For lipidomics analyses, we observed that 52% and 73% of lipid species were associated with the motor and cognition models, respectively, were glycerolipids. Glycerolipids were the main lipid class altered in our PD study. This lipid class is synthetized by the esterification of one, two and/or three fatty acyls with one glycerol, giving rise to monoglyceride (MG), diglyceride (DG) and TG, respectively. Interestingly, DG was found to be involved in the synaptic vesicle recycling [48] and in cellular signalization as secondary lipid messenger [49]. A recent study in yeast and iPSC-derived neurons also found that α-syn triggers the formation of DG in PD. In this same study, authors found that TG has a protector effect against α-syn neurotoxicity and DG accumulation [18]. TG is well-known and was described as the main storage molecule in adipose tissue [50]. However, several studies indicated that TG levels were decreased in the plasma of PD patients and higher serum levels were also associated with a low risk of development of idiopathic PD [51,52]. Our multi-omics approach supports this hypothesis. We found that the top 10 lipids were mainly TG and were negatively correlated with motor impairment (UPDRS-III OFF). Recent studies showed that the reduced level of TG in systemic blood could be explained by its link to the activity of α-syn [18,53]. TG-rich lipid droplets formed during the intracellular deposition can be bound by α-syn. In the mouse model, overexpression of α-syn A53T has been associated with an increase of TG production and lipid droplet content. This alteration reduces the turnover of stored TG, favoring α-syn aggregation [53,54]. Glycerophospholipids and sterols were the other main species found correlated with our clinical models and within the top 10 features. PC and phosphatidylethanolamines (PE) were also species negatively correlated with UPDRS-III OFF as well as motor and cognition parameters, such as appendicular ON, axial score ON or TMT-BA. The same findings were reported with decreased levels of PC and PE [55]. Additionally, sterols and specially CE were mostly changed within the emotion model. The loading plot confirmed the significant contribution of both cholesteryl ester C14:0 and C16:0 to explain the lipid component 1. CE, found in lipid droplets to store and transport cholesterol to the brain, were associated with abnormal activity of lipid droplets and α-syn expression like the other neutral lipid TG. Both TG and CE levels were increased in PD due to the overexpression of α-syn and lipid droplets in cells [53].
Transcriptomics analyses identified the same number of genes in each clinical model. Within the motor model, interferon regulatory factor 9 (IRF9), a transcription factor that regulates innate immune responses, and tryptase beta-2 (TPSB2), a transcription factor coding for a neutral protease present in mast cells, displayed the highest weight in component 1 of the loading plot. Both IRF9 and TPSB2 overexpression were associated with UPDRS-III OFF. Other overexpressed genes in the motor model have been involved in PD, such as TRIM22 [56] and SP110 [57]. Among the top 10 genes, we mainly found immune-related genes, suggesting that overexpression of these genes in systemic blood leads to the increasing severity of motor impairment. Our findings were in agreement with works studying the role of neuroinflammation in PD progression [58]. Within the cognition model, keratin 23 (KRT23), leukotriene B4 receptor 2 (LTB4R2), KN motif and ankyrin repeat domains 1 (KANK1), solute carrier family 25 member 20 (SLC25A20) and serpin family I member 1 (SERPINI1) were positively correlated with UPDRS-III OFF. We found that only the thyroid hormone receptor interactor 10 (TRIP10) was negatively correlated with UPDRS-III OFF while it was positively correlated with MATTIS, Stroop, MMSE and free recall clinical scores. LTB4R2 is an important gene in innate immunity and is associated with PD patients with GBA mutations [59]. Furthermore, KANK1 was associated with the risk of idiopathic PD within both the Norwegian ParkWest cohort and the cohort of the North American Parkinson’s Progression Markers Initiative [60]. Within the emotion model, among the top 10 genes, sialic acid binding Ig like lectin 11 (SIGLEC11), lysophosphatidic acid receptor 4 (LPAR4), endoplasmic reticulum oxidoreductase 1 alpha (ERO1A), and E1A binding protein P300 (EP300) were positively correlated with UPDRS-III OFF while the opposite correlation was found for trafficking protein particle complex subunit 2L (TRAPPC2L) and jumping translocation breakpoint (JTB). For motor and emotion models, network analysis identified enrichment of five biological processes. Within the motor model, we confirmed that immune-related genes were involved in biological processes and pathways mainly linked to severity of motor impairment, while the emotion model was rather associated with translation and protein formation carried out by ribosomes.
Overall, our results support the idea that lipid metabolism seems implicated in four key biological processes (oxidative stress response, endosomal-lysosomal functioning, endoplasmic reticulum stress response and immune response activation) involved in PD pathogenesis [11]. Indeed, we found that immune-related genes and TG were well-correlated with the motor model while the cognitive model was linked to TG as well and specific genes related to neuronal growth, synaptic plasticity and mitochondrial fatty acid oxidation process. Instead, PC, CE and genes related to endoplasmic reticulum stress and cell regulation were associated with the emotion model. Our integrative approaches confirmed this signature. Among all candidate markers, the top 10 lipid and gene features were used to build our integrative approach for our motor, cognition and emotion models. Most of the genes and lipids were positioned at the opposite side of the correlation circles. PD patients with a severe UPDRS-III OFF correlated positively with most clinical parameters and gene expressions except for cognition variables. Instead, lipids negatively correlated with UPDRS-III OFF. TG were the main lipid class that contributed to this correlation and seem key in the development of motor impairment in PD. However further analyses are required to confirm these signatures on larger cohorts of patients.

Supplementary Materials

The following are available online at https://www.mdpi.com/article/10.3390/ijtm2010009/s1. File S1: Chemical reagents and sample preparation for lipidomics and metabolomics [35]. Figure S1: Principal component analysis (PCA) of omics datasets. The individuals in black represent patients treated with no drug, Azilect, Sifrol or Sinemet (treatment group A); while the individuals in red were patients with a specific treatment combining Stalevo and/or Sifrol with Modopar (treatment group B). PCA plot of metabolomic data (A) shows a distinct separation between the two treatment groups; whereas no drug effect is observed in the lipidomic data (B) and transcriptomic data (C). Figure S2: Venn diagram of the distribution of the five main drugs (Azilect, Modopar, Sifrol, Stalevo, Sinemet) for the 48 PD patients. Table S1: Baseline demographic and clinical characteristics of the 48 PD patients included in the study. Table S2: Lists of the most stable genes and lipids selected for each clinical model by 1000 bootstrap samples.

Author Contributions

Data acquisition, F.I., B.C., F.M. (Florence Mauger), J.-F.D. and C.E.; design/conceptualisation, I.M., C.E., M.V. and F.M. (Fanny Mochel); statistical analysis, F.-X.L., E.C., C.P., E.G., M.P.-J., E.L.F., V.S. and A.T.; execution of the study, data analysis and writing of the first draft, F.-X.L., F.I., E.C., C.E. and F.M. (Fanny Mochel). All authors contributed to the writing and revisions of the paper and approved the final version. All authors have read and agreed to the published version of the manuscript.

Funding

Funding was granted from the Agence Nationale de la Recherche (ANRMNP 2009, Nucleipark), DHOS-Inserm (2010, Nucleipark), France Parkinson (2008), Ecole Neuroscience de Paris, and “Investissements d’avenir” (grants ANR-10-IAIHU-06 and ANR-11-INBS-0006), Fondation pour la Recherche Médicale (Programme “Espoirs de la recherche”). This research was also funded by the institutional budget of the Centre National de Recherche en Génomique Humaine (CNRGH).

Institutional Review Board Statement

The study was approved by the local ethics committee (CPP Paris VI, RCB: 2009-A00922-55) and took place in the Pitié-Salpêtrière University Hospital (Paris, France) from April 2010 through December 2012.

Informed Consent Statement

All participants gave their written informed consent.

Acknowledgments

We are grateful to all patients, relatives, and healthcare staff that were involved in the study.

Conflicts of Interest

The authors declare no conflict of interest.

References

  1. García-Lorenzo, D.; Longo-Dos Santos, C.; Ewenczyk, C.; Leu-Semenescu, S.; Gallea, C.; Quattrocchi, G.; Pita Lobo, P.; Poupon, C.; Benali, H.; Arnulf, I.; et al. The Coeruleus/Subcoeruleus Complex in Rapid Eye Movement Sleep Behaviour Disorders in Parkinson’s Disease. Brain 2013, 136, 2120–2129. [Google Scholar] [CrossRef] [PubMed]
  2. Gallea, C.; Ewenczyk, C.; Degos, B.; Welter, M.L.; Grabli, D.; Leu-Semenescu, S.; Valabregue, R.; Berroir, P.; Yahia-Cherif, L.; Bertasi, E.; et al. Pedunculopontine Network Dysfunction in Parkinson’s Disease with Postural Control and Sleep Disorders. Mov. Disord. Off. J. Mov. Disord. Soc. 2017, 32, 693–704. [Google Scholar] [CrossRef] [PubMed]
  3. Ewenczyk, C.; Mesmoudi, S.; Gallea, C.; Welter, M.L.; Gaymard, B.; Demain, A.; Yahia Cherif, L.; Degos, B.; Benali, H.; Pouget, P.; et al. Antisaccades in Parkinson Disease: A New Marker of Postural Control? Neurology 2017, 88, 853–861. [Google Scholar] [CrossRef] [PubMed]
  4. Gallea, C.; Wicki, B.; Ewenczyk, C.; Rivaud-Péchoux, S.; Yahia-Cherif, L.; Pouget, P.; Vidailhet, M.; Hainque, E. Antisaccade, a Predictive Marker for Freezing of Gait in Parkinson’s Disease and Gait/Gaze Network Connectivity. Brain J. Neurol. 2021, 144, 504–514. [Google Scholar] [CrossRef]
  5. Gargouri, F.; Gallea, C.; Mongin, M.; Pyatigorskaya, N.; Valabregue, R.; Ewenczyk, C.; Sarazin, M.; Yahia-Cherif, L.; Vidailhet, M.; Lehéricy, S. Multimodal Magnetic Resonance Imaging Investigation of Basal Forebrain Damage and Cognitive Deficits in Parkinson’s Disease. Mov. Disord. Off. J. Mov. Disord. Soc. 2019, 34, 516–525. [Google Scholar] [CrossRef] [Green Version]
  6. Redenšek, S.; Dolžan, V.; Kunej, T. From Genomics to Omics Landscapes of Parkinson’s Disease: Revealing the Molecular Mechanisms. Omics J. Integr. Biol. 2018, 22, 1–16. [Google Scholar] [CrossRef] [Green Version]
  7. Borrageiro, G.; Haylett, W.; Seedat, S.; Kuivaniemi, H.; Bardien, S. A Review of Genome-Wide Transcriptomics Studies in Parkinson’s Disease. Eur. J. Neurosci. 2018, 47, 1–16. [Google Scholar] [CrossRef]
  8. Soreq, L.; Ben-Shaul, Y.; Israel, Z.; Bergman, H.Z.; Soreq, H. Meta-Analysis of Genetic and Environmental Parkinson’s Disease Models Reveals a Common Role of Mitochondrial Protection Pathways. Neurobiol. Dis. 2012, 45, 1018–1030. [Google Scholar] [CrossRef] [PubMed]
  9. Su, L.; Wang, C.; Zheng, C.; Wei, H.; Song, X. A Meta-Analysis of Public Microarray Data Identifies Biological Regulatory Networks in Parkinson’s Disease. BMC Med. Genomics 2018, 11, 40. [Google Scholar] [CrossRef] [Green Version]
  10. Glaab, E.; Schneider, R. Comparative Pathway and Network Analysis of Brain Transcriptome Changes during Adult Aging and in Parkinson’s Disease. Neurobiol. Dis. 2015, 74, 1–13. [Google Scholar] [CrossRef] [Green Version]
  11. Klemann, C.J.H.M.; Martens, G.J.M.; Sharma, M.; Martens, M.B.; Isacson, O.; Gasser, T.; Visser, J.E.; Poelmans, G. Integrated Molecular Landscape of Parkinson’s Disease. NPJ Park. Dis. 2017, 3, 14. [Google Scholar] [CrossRef] [PubMed]
  12. Xicoy, H.; Wieringa, B.; Martens, G.J.M. The Role of Lipids in Parkinson’s Disease. Cells 2019, 8, 27. [Google Scholar] [CrossRef] [PubMed] [Green Version]
  13. Fanning, S.; Selkoe, D.; Dettmer, U. Parkinson’s Disease: Proteinopathy or Lipidopathy? NPJ Park. Dis. 2020, 6, 3. [Google Scholar] [CrossRef] [Green Version]
  14. Avisar, H.; Guardia-Laguarta, C.; Area-Gomez, E.; Surface, M.; Chan, A.; Alcalay, R.N.; Lerner, B. Lipidomics Prediction of Parkinson’s Disease Severity: A Machine-Learning Analysis. J. Park. Dis. 2021, 11, 1141–1155. [Google Scholar] [CrossRef] [PubMed]
  15. Zardini Buzatto, A.; Tatlay, J.; Bajwa, B.; Mung, D.; Camicioli, R.; Dixon, R.A.; Li, L. Comprehensive Serum Lipidomics for Detecting Incipient Dementia in Parkinson’s Disease. J. Proteome Res. 2021, 20, 4053–4067. [Google Scholar] [CrossRef]
  16. Chan, R.B.; Perotte, A.J.; Zhou, B.; Liong, C.; Shorr, E.J.; Marder, K.S.; Kang, U.J.; Waters, C.H.; Levy, O.A.; Xu, Y.; et al. Elevated GM3 Plasma Concentration in Idiopathic Parkinson’s Disease: A Lipidomic Analysis. PLoS ONE 2017, 12, e0172348. [Google Scholar] [CrossRef] [PubMed]
  17. Alecu, I.; Bennett, S.A.L. Dysregulated Lipid Metabolism and Its Role in α-Synucleinopathy in Parkinson’s Disease. Front. Neurosci. 2019, 13, 328. [Google Scholar] [CrossRef] [PubMed]
  18. Fanning, S.; Haque, A.; Imberdis, T.; Baru, V.; Barrasa, M.I.; Nuber, S.; Termine, D.; Ramalingam, N.; Ho, G.P.H.; Noble, T.; et al. Lipidomic Analysis of α-Synuclein Neurotoxicity Identifies Stearoyl CoA Desaturase as a Target for Parkinson Treatment. Mol. Cell 2019, 73, 1001–1014.e8. [Google Scholar] [CrossRef] [Green Version]
  19. Sardi, S.P.; Viel, C.; Clarke, J.; Treleaven, C.M.; Richards, A.M.; Park, H.; Olszewski, M.A.; Dodge, J.; Marshall, J.; Makino, E.; et al. Glucosylceramide Synthase Inhibition Alleviates Aberrations in Synucleinopathy Models. Proc. Natl. Acad. Sci. USA. 2017, 114, 2699–2704. [Google Scholar] [CrossRef] [Green Version]
  20. Fahn, S.; Elton, R.L. Members of the UPDRS Development Committee Unified Parkinson’s Disease Rating Scale. In Recent Developments in Parkinsons Disease; Fahn, S., Marsden, C.D., Calne, D.B., Goldstein, M., Eds.; Macmillan Healthcare Information: Florham Park, NJ, USA, 1987; Volume 2, pp. 153–163, 293–304. [Google Scholar]
  21. Garali, I.; Adanyeguh, I.M.; Ichou, F.; Perlbarg, V.; Seyer, A.; Colsch, B.; Moszer, I.; Guillemot, V.; Durr, A.; Mochel, F.; et al. A Strategy for Multimodal Data Integration: Application to Biomarkers Identification in Spinocerebellar Ataxia. Brief. Bioinform. 2018, 19, 1356–1369. [Google Scholar] [CrossRef]
  22. Tenenhaus, A.; Tenenhaus, M. Regularized Generalized Canonical Correlation Analysis. Psychometrika 2011, 76, 257. [Google Scholar] [CrossRef] [Green Version]
  23. Xicota, L.; Ichou, F.; Lejeune, F.X.; Colsch, B.; Tenenhaus, A.; Leroy, I.; Fontaine, G.; Lhomme, M.; Bertin, H.; Habert, M.O.; et al. Multi-Omics Signature of Brain Amyloid Deposition in Asymptomatic Individuals at-Risk for Alzheimer’s Disease: The INSIGHT-PreAD Study. eBioMedicine 2019, 47, 518–528. [Google Scholar] [CrossRef] [PubMed] [Green Version]
  24. Tenenhaus, A.; Philippe, C.; Guillemot, V.; Le Cao, K.A.; Grill, J.; Frouin, V. Variable Selection for Generalized Canonical Correlation Analysis. Biostat. Oxf. Engl. 2014, 15, 569–583. [Google Scholar] [CrossRef] [PubMed] [Green Version]
  25. Hughes, A.J.; Daniel, S.E.; Kilford, L.; Lees, A.J. Accuracy of Clinical Diagnosis of Idiopathic Parkinson’s Disease: A Clinico-Pathological Study of 100 Cases. J. Neurol. Neurosurg. Psychiatry 1992, 55, 181–184. [Google Scholar] [CrossRef] [PubMed] [Green Version]
  26. Hoehn, M.M.; Yahr, M.D. Parkinsonism: Onset, Progression, and Mortality. Neurology 1967, 17, 427. [Google Scholar] [CrossRef] [Green Version]
  27. Bolger, A.M.; Lohse, M.; Usadel, B. Trimmomatic: A Flexible Trimmer for Illumina Sequence Data. Bioinformatics 2014, 30, 2114–2120. [Google Scholar] [CrossRef] [Green Version]
  28. Kim, D.; Pertea, G.; Trapnell, C.; Pimentel, H.; Kelley, R.; Salzberg, S.L. TopHat2: Accurate Alignment of Transcriptomes in the Presence of Insertions, Deletions and Gene Fusions. Genome Biol. 2013, 14, R36. [Google Scholar] [CrossRef] [Green Version]
  29. McKenna, A.; Hanna, M.; Banks, E.; Sivachenko, A.; Cibulskis, K.; Kernytsky, A.; Garimella, K.; Altshuler, D.; Gabriel, S.; Daly, M.; et al. The Genome Analysis Toolkit: A MapReduce Framework for Analyzing next-Generation DNA Sequencing Data. Genome Res. 2010, 20, 1297–1303. [Google Scholar] [CrossRef] [Green Version]
  30. Anders, S.; Pyl, P.T.; Huber, W. HTSeq—A Python Framework to Work with High-Throughput Sequencing Data. Bioinformatics 2015, 31, 166–169. [Google Scholar] [CrossRef]
  31. Love, M.I.; Huber, W.; Anders, S. Moderated Estimation of Fold Change and Dispersion for RNA-Seq Data with DESeq2. Genome Biol. 2014, 15, 550. [Google Scholar] [CrossRef] [Green Version]
  32. Kessner, D.; Chambers, M.; Burke, R.; Agus, D.; Mallick, P. ProteoWizard: Open Source Software for Rapid Proteomics Tools Development. Bioinformatics 2008, 24, 2534–2536. [Google Scholar] [CrossRef] [PubMed]
  33. Giacomoni, F.; Le Corguillé, G.; Monsoor, M.; Landi, M.; Pericard, P.; Pétéra, M.; Duperier, C.; Tremblay-Franco, M.; Martin, J.F.; Jacob, D.; et al. Workflow4Metabolomics: A Collaborative Research Infrastructure for Computational Metabolomics. Bioinformatics 2015, 31, 1493–1495. [Google Scholar] [CrossRef] [PubMed] [Green Version]
  34. Dunn, W.B.; Broadhurst, D.; Begley, P.; Zelena, E.; Francis-McIntyre, S.; Anderson, N.; Brown, M.; Knowles, J.D.; Halsall, A.; Haselden, J.N.; et al. Procedures for Large-Scale Metabolic Profiling of Serum and Plasma Using Gas Chromatography and Liquid Chromatography Coupled to Mass Spectrometry. Nat. Protoc. 2011, 6, 1060–1083. [Google Scholar] [CrossRef] [PubMed]
  35. Seyer, A.; Boudah, S.; Broudin, S.; Junot, C.; Colsch, B. Annotation of the Human Cerebrospinal Fluid Lipidome Using High Resolution Mass Spectrometry and a Dedicated Data Processing Workflow. Metabolomics Off. J. Metabolomic Soc. 2016, 12, 91. [Google Scholar] [CrossRef] [PubMed] [Green Version]
  36. Wickham, H. Ggplot2; Springer New York: New York, NY, USA, 2009. [Google Scholar]
  37. Thomas, M.; Jankovic, J.; Suteerawattananon, M.; Wankadia, S.; Caroline, K.S.; Vuong, K.D.; Protas, E. Clinical Gait and Balance Scale (GABS): Validation and Utilization. J. Neurol. Sci. 2004, 217, 89–99. [Google Scholar] [CrossRef]
  38. Folstein, M.F.; Folstein, S.E.; McHugh, P.R. “Mini-Mental State”. A Practical Method for Grading the Cognitive State of Patients for the Clinician. J. Psychiatr. Res. 1975, 12, 189–198. [Google Scholar] [CrossRef]
  39. Mattis, S. Mental Status Examination for Organic Mental Syndrome in the Elderly Patient; Bellack, L., Karusu, T.B., Eds.; Geriatric Psychiatry, Grune & Stratton: New York, NY, USA, 1976; pp. 77–121. [Google Scholar]
  40. Stroop, J.R. Studies of Interference in Serial Verbal Reactions. J. Exp. Psychol. 1935, 18, 643–662. [Google Scholar] [CrossRef]
  41. Reitan, R.M. Validity of the Trail Making Test as an Indicator of Organic Brain Damage. Percept. Mot. Skills 1958, 8, 271–276. [Google Scholar] [CrossRef]
  42. Corrigan, J.D.; Hinkeldey, N.S. Relationships between Parts A and B of the Trail Making Test. J. Clin. Psychol. 1987, 43, 402–409. [Google Scholar] [CrossRef]
  43. Starkstein, S.E.; Mayberg, H.S.; Preziosi, T.J.; Andrezejewski, P.; Leiguarda, R.; Robinson, R.G. Reliability, Validity, and Clinical Correlates of Apathy in Parkinson’s Disease. J. Neuropsychiatry Clin. Neurosci. 1992, 4, 134–139. [Google Scholar] [CrossRef]
  44. Montgomery, S.A.; Asberg, M. A New Depression Scale Designed to Be Sensitive to Change. Br. J. Psychiatry J. Ment. Sci. 1979, 134, 382–389. [Google Scholar] [CrossRef] [PubMed]
  45. Yu, G.; Wang, L.G.; Han, Y.; He, Q.Y. ClusterProfiler: An R Package for Comparing Biological Themes among Gene Clusters. Omics J. Integr. Biol. 2012, 16, 284–287. [Google Scholar] [CrossRef] [PubMed]
  46. Kishore, K.; de Pretis, S.; Lister, R.; Morelli, M.J.; Bianchi, V.; Amati, B.; Ecker, J.R.; Pelizzola, M. MethylPipe and CompEpiTools: A Suite of R Packages for the Integrative Analysis of Epigenomics Data. BMC Bioinform. 2015, 16, 313. [Google Scholar] [CrossRef] [PubMed] [Green Version]
  47. Fahy, E.; Subramaniam, S.; Murphy, R.C.; Nishijima, M.; Raetz, C.R.H.; Shimizu, T.; Spener, F.; van Meer, G.; Wakelam, M.J.O.; Dennis, E.A. Update of the LIPID MAPS Comprehensive Classification System for Lipids. J. Lipid Res. 2009, 50, S9–S14. [Google Scholar] [CrossRef] [PubMed] [Green Version]
  48. Tu-Sekine, B.; Goldschmidt, H.; Raben, D.M. Diacylglycerol, Phosphatidic Acid, and Their Metabolic Enzymes in Synaptic Vesicle Recycling. Adv. Biol. Regul. 2015, 57, 147–152. [Google Scholar] [CrossRef] [Green Version]
  49. Ohanian, J.; Ohanian, V. Lipid Second Messenger Regulation: The Role of Diacylglycerol Kinases and Their Relevance to Hypertension. J. Hum. Hypertens. 2001, 15, 93–98. [Google Scholar] [CrossRef] [Green Version]
  50. Li, N.; Sancak, Y.; Frasor, J.; Atilla-Gokcumen, G.E. A Protective Role for Triacylglycerols during Apoptosis. Biochemistry 2018, 57, 72–80. [Google Scholar] [CrossRef]
  51. Guo, X.; Song, W.; Chen, K.; Chen, X.; Zheng, Z.; Cao, B.; Huang, R.; Zhao, B.; Wu, Y.; Shang, H.F. The Serum Lipid Profile of Parkinson’s Disease Patients: A Study from China. Int. J. Neurosci. 2015, 125, 838–844. [Google Scholar] [CrossRef]
  52. Wei, Q.; Wang, H.; Tian, Y.; Xu, F.; Chen, X.; Wang, K. Reduced Serum Levels of Triglyceride, Very Low Density Lipoprotein Cholesterol and Apolipoprotein B in Parkinson’s Disease Patients. PLoS ONE 2013, 8, e75743. [Google Scholar] [CrossRef] [Green Version]
  53. Alza, N.P.; Conde, M.A.; Scodelaro-Bilbao, P.G.; Salvador, G.A. Neutral Lipids as Early Biomarkers of Cellular Fate: The Case of α-Synuclein Overexpression. Cell Death Dis. 2021, 12, 52. [Google Scholar] [CrossRef]
  54. Sánchez Campos, S.; Alza, N.P.; Salvador, G.A. Lipid Metabolism Alterations in the Neuronal Response to A53T α-Synuclein and Fe-Induced Injury. Arch. Biochem. Biophys. 2018, 655, 43–54. [Google Scholar] [CrossRef] [PubMed] [Green Version]
  55. Zhang, J.; Zhang, X.; Wang, L.; Yang, C. High Performance Liquid Chromatography-Mass Spectrometry (LC-MS) Based Quantitative Lipidomics Study of Ganglioside-NANA-3 Plasma to Establish Its Association with Parkinson’s Disease Patients. Med. Sci. Monit. Int. Med. J. Exp. Clin. Res. 2017, 23, 5345–5353. [Google Scholar] [CrossRef] [PubMed]
  56. Pavlou, M.A.S.; Colombo, N.; Fuertes-Alvarez, S.; Nicklas, S.; Cano, L.G.; Marín, M.; Goncalves, J.; Schwamborn, J.C. Expression of the Parkinson’s Disease-Associated Gene Alpha-Synuclein Is Regulated by the Neuronal Cell Fate Determinant TRIM32. Mol. Neurobiol. 2017, 54, 4257–4270. [Google Scholar] [CrossRef] [PubMed]
  57. Kozina, E.; Sadasivan, S.; Jiao, Y.; Dou, Y.; Ma, Z.; Tan, H.; Kodali, K.; Shaw, T.; Peng, J.; Smeyne, R.J. Mutant LRRK2 Mediates Peripheral and Central Immune Responses Leading to Neurodegeneration in Vivo. Brain J. Neurol. 2018, 141, 1753–1769. [Google Scholar] [CrossRef] [PubMed]
  58. Tan, E.K.; Chao, Y.X.; West, A.; Chan, L.L.; Poewe, W.; Jankovic, J. Parkinson Disease and the Immune System—Associations, Mechanisms and Therapeutics. Nat. Rev. Neurol. 2020, 16, 303–318. [Google Scholar] [CrossRef] [PubMed]
  59. Xu, D.D.; Li, G.Q.; Wu, Z.S.; Liu, X.Q.; Yang, X.X.; Wang, J.H. Bioinformatics Analysis and Identification of Genes and Molecular Pathways Involved in Parkinson’s Disease in Patients with Mutations in the Glucocerebrosidase Gene. Neuroreport 2021, 32, 918–924. [Google Scholar] [CrossRef]
  60. Gaare, J.J.; Nido, G.S.; Sztromwasser, P.; Knappskog, P.M.; Dahl, O.; Lund-Johansen, M.; Maple-Grødem, J.; Alves, G.; Tysnes, O.B.; Johansson, S.; et al. Rare Genetic Variation in Mitochondrial Pathways Influences the Risk for Parkinson’s Disease. Mov. Disord. Off. J. Mov. Disord. Soc. 2018, 33, 1591–1600. [Google Scholar] [CrossRef]
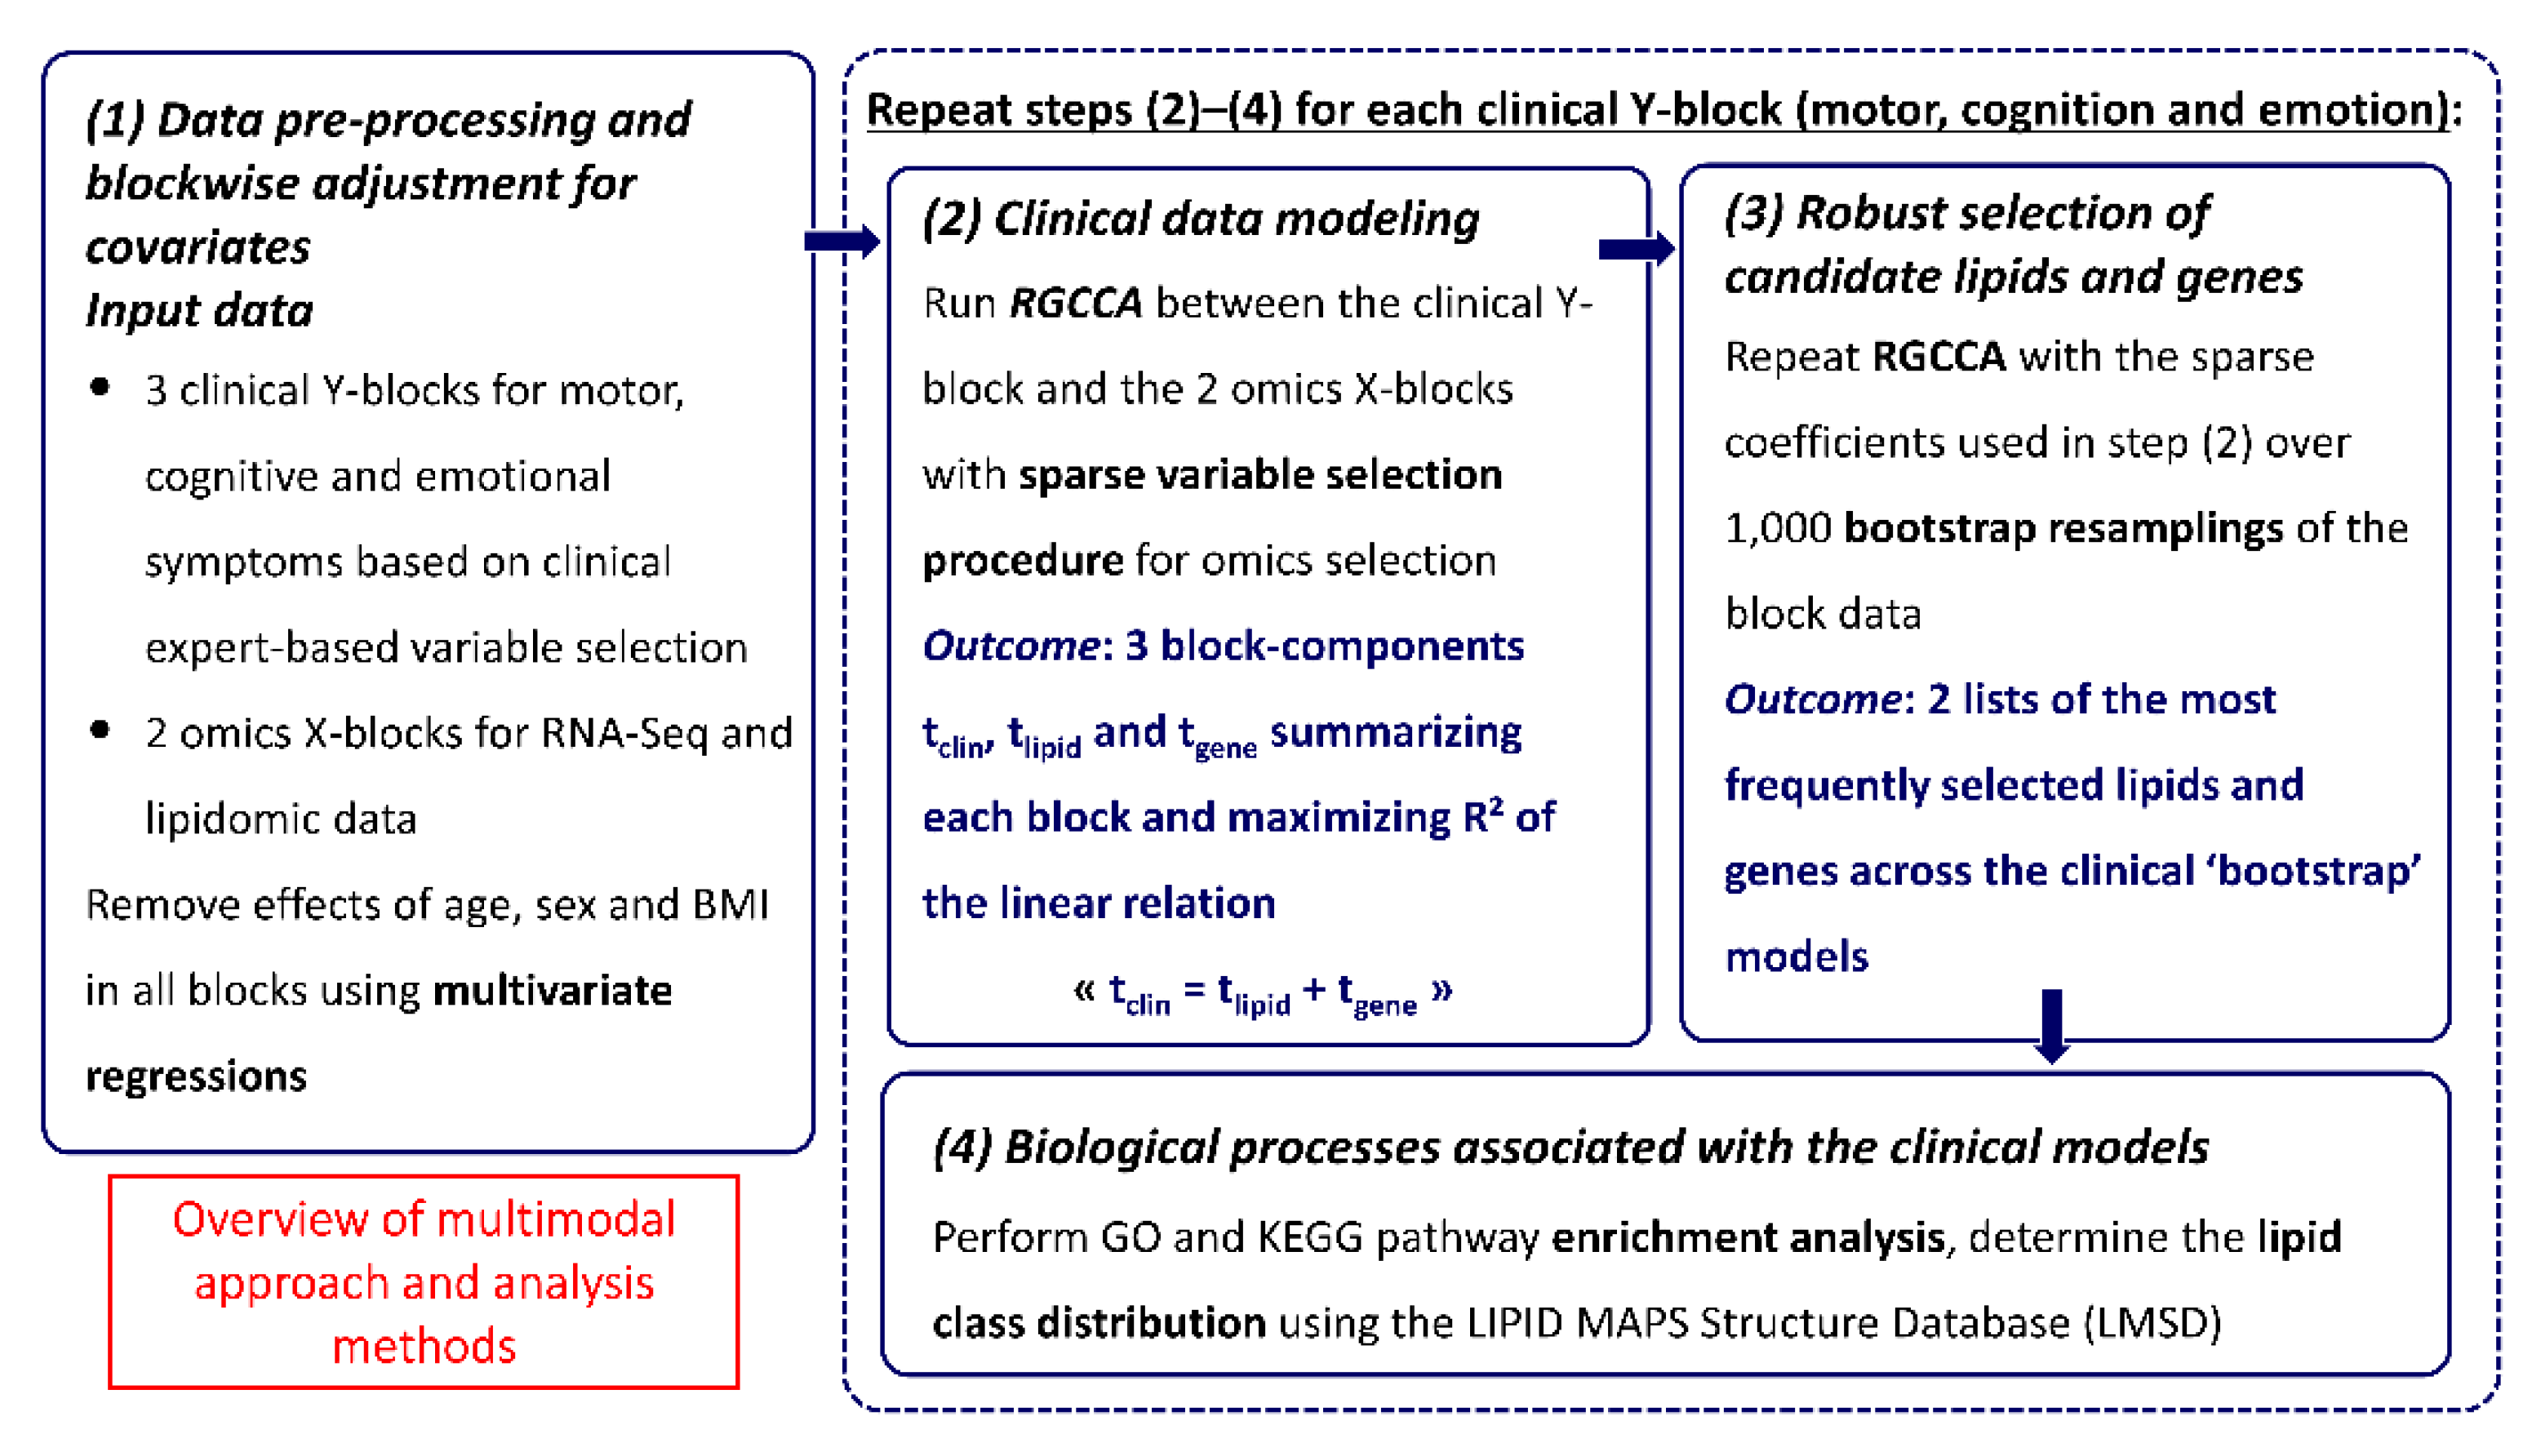
Figure 1. Workflow of the multi-omics data integration approach using RGCCA.
Ijtm 02 00009 g001
Figure 2. Sample space (left: A,C,E) and correlation circle (right: B,D,F) plots of the multimodal signature of lipids, genes and clinical features for each clinical model: motor (A,B), cognition (C,D) and emotion (E,F). The blue-to-red color gradient applied to the sample spaces is indicative of the increasing severity of motor impairment (UPDRS-III OFF) of the PD patients. The most relevant lipids are represented in green, genes in blue and clinical features in red. The percentages of variance on the components are indicated in parentheses.
Ijtm 02 00009 g002
Figure 3. Loading plots indicating the importance of each variable to define the principal component. The weights of the top 10 genes (AC) and lipids (DF) were represented are a positive (in blue) and negative (in red) correlation for the motor, cognitive and emotion models.
Ijtm 02 00009 g003
Figure 4. Sample space (A) and correlation circle (B) plots of the multimodal signature of lipids, genes and clinical features integrating the three clinical models (motor, cognition and emotion). The color gradient applied to the sample space indicates the increasing severity of motor impairment (UPDRS-III OFF) of PD patients. The top 10 relevant lipids are represented in green, genes in blue and clinical features in red. The percentages of variance on the components are indicated in parentheses.
Ijtm 02 00009 g004
Figure 5. Distribution of lipid classes and subclasses for the selected lipids within each clinical model (motor, cognition and emotion).
Ijtm 02 00009 g005
Figure 6. GO (biological process) and KEGG pathway enrichment analyses for the selected genes of the motor (A) and emotion (B) models. No enrichment was found in the cognition model. ClusterProfiler analysis with BH-adjusted p-values < 0.05.
Ijtm 02 00009 g006
Publisher’s Note: MDPI stays neutral with regard to jurisdictional claims in published maps and institutional affiliations.