Article

Regional Differences in Gene Expression of Proliferating Human Choroidal Endothelial Cells

by
Andrew C. Browning
1,
Eugene P. Halligan
2,
Elizabeth A. Stewart
1,
Daniel C. Swan
3,
Simon J. Cockell
3 and
Winfried M. Amoaku
1,*
1
Academic Ophthalmology, Queen’s Medical Centre, Division of Clinical Neurosciences, University of Nottingham, Nottingham NG7 2UH, UK
2
Department of Infection and Immunology, 5th Floor, North Wing, St Thomas’s Hospital, London SE1 7EH, UK
3
Bioinformatics Support Unit, Institute of Cell and Molecular Biosciences, Newcastle University, Newcastle upon Tyne NE2 4HH, UK
*
Author to whom correspondence should be addressed.
Int. J. Transl. Med. 2021, 1(2), 83-100; https://doi.org/10.3390/ijtm1020007
Submission received: 19 April 2021 / Revised: 1 June 2021 / Accepted: 2 June 2021 / Published: 1 July 2021

Abstract

:
Choroidal diseases including inflammation and neovascularization seem to have predilection for different vascular beds. In order to improve our understanding of human macular choroidal angiogenic diseases, we investigate the differences in gene expression between matched human macular and peripheral inner choroidal endothelial cells (CEC) and matched human macular inner and outer CEC. The gene expression profiles of matched, unpassaged human macular and peripheral inner CEC and matched human unpassaged macular inner and outer CEC were conducted using Affymetrix GeneChip arrays. Selected differences in gene expression were validated by real-time-PCR and immunohistochemistry. No differences in probeset expression were demonstrated between inner CECs compared with peripheral inner CECs. In comparison, there was a difference of 1.6% of probesets when matched, unpassaged proliferating human macular inner CEC and macular outer CEC from the same donors were compared. Macular inner CECs demonstrated up-regulation of probesets involved in nervous system development, growth factors, PLVAP, and collagen XVI, while macular outer CECs demonstrated up-regulation of probesets involved in immune function and intracellular signalling. There was a marked homogeneity of human macular and peripheral inner CECs. This suggests that gene expression differences in inner CECs are not responsible for the site specific selectivity of choroidal neovascularisation. Variability was noted, however, in the gene expression of matched macular inner and outer CECs. This could be explained by the differences in the roles and microenvironments of the inner and outer choroid.

1. Introduction

The human macula appears predisposed to a wide range of different sight threatening disorders, particularly, choroidal neovascularisation (CNV). The reason(s) for this predisposition remain largely unknown; however, it has been well recognised for many years that the ultrastructure of the macula area is different from the more peripheral areas of the posterior segment. More recently, investigators have examined the gene expression within different structures of the macula and compared it with their more peripheral counterparts in an attempt to explain this paradox [1,2,3,4].
Within the retina, there is a variable distribution of rods and cones across the posterior segment. Although the macula only occupies 1.4% of the retinal area, it contains 8.4% of all retinal cone figures and 3.4% of rods and 60% of ganglion cells [5]. Not surprisingly, comparison of gene expression between macular and peripheral retina found a number of genes preferentially expressed in the macula that were highly expressed in cones and axons, while the retinal periphery appeared enriched for rod specific genes [1,6,7]. Whilst these differences in the gene expression within the neurosensory retina are associated with well documented and understood physiological functions, differences in the topographic distribution in sub-retinal cells and structures are less well understood. Ultrastructurally, retinal pigment epithelial (RPE) cells from the macula and the periphery differ in appearance, with those from the macula being more columnar [8] and containing more melanin than those in the periphery [2,9]. Several studies have investigated the variation in RPE gene expression across the posterior segment. [2,4]. Using laser microdissection to harvest areas of macular RPE and choroid in human donor eyes, Ishibashi [2] and Van Soest [4] independently identified a small number of genes that were differentially upregulated the macula. These authors suggested that this may represent a role for the RPE in Bruch’s membrane turnover, and may contribute to the topographical differences found by other investigators in the composition and physical properties of Bruch’s membrane and which in turn may lead to the increased disease susceptibility of the macula [10,11,12].
The ultrastructure of the choroid is well described, being composed of three distinct layers: an outer layer of large vessels (Haller’s layer), a middle layer of medium sized vessels (Sattler’s layer) and an internal layer adjacent to Bruch’s Membrane composed of capillary vessels (choriocapillaris). Less is known regarding the heterogeneity of choroidal endothelial cells (CECs) and the role that this may play in the predisposition and pathogenesis of various choroidal disorders. As an example, the CNV seen in neovascular age-related macular degeneration (nAMD) usually begins within the inner choroid and almost always occurs within the macular area [13,14]. It is not known if the CECs in this sub-macular area are different to those in the periphery, thereby making them more susceptible to certain diseases, and whether they may respond differently to selective treatments. Alternatively, it may be that that the CECs are all the same and they are simply responding to secondary events brought about by the topographical differences of other cell types (retinal and RPE), structure (Bruch’s membrane) or insults (UV light damage or trauma) that in turn brings about the site specificity of the disease.
The aim of this study was to compare the gene expression profiles of proliferating matched human sub-macular inner and outer CECs, and matched human sub-macular and peripheral inner CECs to determine whether gene expression profiles are localised to cells within different areas of the human choroid. Differences in gene expression would elucidate differences in the roles of ECs and microenvironments of the inner and outer choroid. These findings may help explain the topographical selectivity and mechanisms of choroidal neovascularization, and perhaps lead to the development of site specific treatments for choroidal vascular diseases including nAMD.

2. Materials and Methods

2.1. Isolation of CEC

The technique for the isolation of human macular inner CECs has been described previously [15]. For this investigation, matched 6 mm diameter samples of peripheral inner choroid (peripheral area nasal to the optic disc) and macular outer choroidal tissue were dissected, collected and treated in the same manner as described previously for the macular inner choroidal samples [15]. Briefly, 6 mm samples were removed from the appropriate areas of the posterior segments and transferred to Petri dishes where the retina was discarded and the retinal pigment epithelium (RPE) was removed by gentle brushing with a sterile spatula and by irrigation with sterile phosphate buffered saline (PBS). The choroid was the teased from the attached sclera and turned upside down. With the use of a dissecting microscope, the large outer choroidal vessels along with the adherent fibrous tissue were peeled off and placed in PBS. The remaining, relatively non-pigmented inner choroidal tissue was also placed in PBS. The samples were then cut into 1 mm pieces and washed 3 times in minimum essential medium (MEM) containing 30 mM HEPES, 0.25 µg/mL amphotericin B, 100 µg/mL streptomycin, 50 µg/mL kanamycin and 30 µg/mL penicillin (isolation medium. The pieces were then incubated in 0.1% collagenase I (Sigma-Aldrich, St. Louis, MO, USA) in MEM for 2 h at 37 °C with frequent agitation. The collagenase was neutralized with MEM containing 10% foetal calf serum (Invitrogen, Paisley, UK) and the mixture was filtered through sterile 40 µm and then 20 µm filters (Millipore Ltd., Watford, UK). The eluate was centrifuged (75 g) and washed 3 times in isolated medium and resuspended in 1 mL of PBS/0.1%BSA. The endothelial cells were then isolated using anti-CD31 coated Dynabeads using the manufacturer’s instructions (Dynal Ltd., Wirral, UK). The Dynabeads were resuspended in endothelial growth medium (EGM2-MV with hydrocortisone omitted) (Cambrex Biosciences, Wokingham, Berks, UK) and seeded onto fibronectin coated 35 mm culture dishes (Beckton Dickinson, Oxford, UK). The unpassaged cells were grown to 80% confluence before a small sample was removed for confirmation of purity or RNA extraction using a Qiagen RNeasy minikit (Qiagen, Crawley, UK) by following the manufacturer’s instructions. The RNA was stored at −80 °C in microcentrifuge tubes until required for subsequent analysis. The research had the approval of the local research ethics committee (Nottingham Q1060301) and complied with the tenets of Helsinki Declaration for medical research involving humans.

2.2. Confirmation of EC Purity

The identity and purity of cells used in the microarray assays was confirmed prior to RNA extraction by demonstrating that greater than 99.5% of cells stained positive for factor VIII and CD31, and negatively stained with anti-rat alpha smooth muscle actin (aSMA) or fibroblast surface protein as previously described [15]. Briefly, samples of choroidal endothelial cells to be used for microarray analysis were taken and grown on 1% gelatin coated glass cover slips and then fixed in ice cold methanol at −20 °C for 20 min. A standard two stage immunofluorescence technique was applied by incubating the cells with primary antibodies against CD31 and vWF (Dako, Cambridgeshire, UK) for 4 h followed by secondary antibody after washing with PBS. The secondary antibody was rabbit anti-mouse F(ab’)2 fragment, FITC conjugated (1:20 dilution) for the CD31 stain and swine anti-rabbit F(ab’)2 fragment, FITC conjugate (1:20 dilution) for the vWF stain (Dako, Cambridgeshire, UK). The slides were mounted in glycerol containing DABCO (Sigma-Aldrich, St. Louis, MO, USA) and observed by confocal fluorescence microscopy (Leica TCS40D, Leica, Milton Keynes, UK).

2.3. RNA Extraction

The isolated endothelial cells from the 3 different intra-choroidal locations were propagated under identical conditions. The total RNA was extracted from primary cultures when they had reached approximately 80% confluence, using the Qiagen RNeasy minikit as directed (Qiagen, Crawley, UK). RNA integrity and quality was assessed using an Agilent 2100 Bioanalyser and RNA 6000 Nano kit (Agilent Technologies, Santa Clara, CA, USA). Total RNA was extracted from primary cultures of unpassaged unmatched endothelial cells when they had reached approximately 80% confluence, using the Qiagen RNeasy minikit as directed (Qiagen, Crawley, UK). Approximately 5 µg of total RNA was obtained from each 35 mm culture plate.

2.4. Microarray Analysis

Microarray analysis was performed using Affymetrix GeneChip® Human Genome U133 Plus 2.0 arrays (Affymetrix, High Wycombe, Bucks, UK) as previously described [16]. Briefly, the previously stored RNA was thawed, the concentration rechecked using the Nanodrop ND-1000 spectrophotometer. The RNA integrity and quality was assessed using an Agilent 2100 Bioanalyser and RNA 6000 nanokit (Agilent Technologies, Santa Clara, CA, USA) by following the manufacturer’s instructions. A sample needed an RNA integrity index (RIN) greater than 8 to be taken forward for analysis. Biotinylated complementary RNA probes were prepared from the total RNA samples (1 µg) using the microarray target amplification kit and the microarray target RNA synthesis kit (both Roche Applied Sciences, Burgess Hill, UK) following the manufacturer’s instructions. Samples of fragmented cRNA were hybridized onto Affymetrix GeneChip human genome U133plus 2.0 arrays (Affymetrix, High Wycombe, Bucks, UK) along with control oligo B2 and eukaryotic hybridisation controls (bioB, bioC, bioD and cre) at 45 °C for 16 h. This was followed by the washing, staining and scanning of the arrays using a Fluidics Station 450, Affymetrix scanner 3000 and GCOS software (Affymetrix GeneChip protocols). The GCOS software (Affymetrix, Santa Clara, CA, USA) was used to monitor scanning and to convert the raw image files into intensity files (‘.CEL’).

2.5. Data Analysis

Affymetrix CEL files were imported into GeneSpring GX 11.0.1 and processed with the MAS5 algorithm for probe level quality control. Data was then normalized with GC-RMA to provide expression values. To identify differentially expressed genes between cell groups, a one way ANOVA was performed with Tukey-HSD post hoc testing, where the 3 unique regions were considered to be levels of the same factor. Benjamini–Hochberg false discovery rate control was applied to all probesets. Due to the small sample size (3 samples at each intra ocular location), the data was also subject to rank products analysis [17]. A difference in expression between probesets (macular inner choroidal ECs vs. macular outer choroidal ECs) with a corrected p-value of <0.05 and a fold change of greater than 2 in all samples from a particular location were considered to be statistically significant. The genes demonstrating significant differences between the datasets (macular inner vs. macular outer CECs) were exported directly to Ingenuity Pathway Analysis for canonical pathways was done using the following parameters: human genes, metabolic pathways, cell signaling, nervous system development, cellular growth and proliferation, immune response and cell morphology.

2.6. QPCR

Expression data from the microarray experiments was validated by TaqMan real-time PCR using the same samples as those used in the microarray experiments [16]. Genes with transcripts that demonstrated at least a 2-fold differential expression between ECs from the various sources on microarray were selected. Furthermore, selected probesets were thought to be relevant to a range of EC functions, including cell signaling, cell morphology, nervous system development, cell growth and proliferation, and miscellaneous functions. Briefly, cDNA from each of the samples was generated from 50 ng of total RNA using the Superscript III first strand synthesis system (Invitrogen). The resulting cDNA was subjected to real-time PCR reactions in triplicate using the manufacturer’s TaqMan Universal mastermix kit protocol and the ABI PRISM 7000 sequence detection system. The expression of hypoxanthine–guanine phosphoribosyltransferase (HPRT) was chosen for normalisation. Analysis of the relative gene expression data was performed using the ΔΔ Ct method. The crossing point or threshold (Ct) of each target gene was normalized against the HPRT housekeeping gene before the fold change was calculated, relative to the target gene expression in a different anatomical location.

2.7. Immunohistochemistry

Immunohistochemical validation of the results was undertaken by staining sections of choroid with relevant antibodies to a selection of proteins found to be upregulated at the gene expression level by microarray analysis. A 5 mm biopsy punch was used to remove cores of macula and peripheral choroid, retina was removed and the choroid/sclera core embedded in optimal cutting temperature (OCT) freezing compound (Leica, Germany) and frozen using liquid nitrogen. Using a cryostat (Leica), 7 µm sections were prepared and fixed with 100% acetone. Sections were blocked with 3% (w/v) bovine serum albumin (BSA) in phosphate buffered saline (PBS) and stained with primary antibodies targeted to brain derived neurotrophic factor [BDNF] (Abcam, Cambridge, UK; ab108383) or plasmalemma vesicle associated protein [PLVAP] (Abcam, ab81719), overnight, at 4 °C. Primary antibodies were visualised using the appropriate secondary antibody conjugated to tetramethyl rhodamine iso-thiocyanate (TRITC) at 1:400 for 1 h at room temperature. Slides were counterstained with 4′,6-Diamidino-2-phenylindole (DAPI; 5 µg/mL; Santa Cruz Biotechnology Inc, Heidelberg, Germany) and examined on a fluorescence microscope (Olympus BX51) and imaged using Cell^F software (Olympus, Southend-on-Sea, UK). Each experiment was performed on multiple sections from at least 2 donors and comparative fluorescence was detected using the same settings. For haematoxylin and eosin (HE) staining serial 7 µm sections were fixed with 3% (v/v) acetic alcohol, washed in TBS then stained in haematoxylin for 1–2 min, washed in tap water for 1 min, Scott’s Tap water for 1 min, then distilled water for 1 min. Sections were then stained with eosin Y for 1 min, then washed in tap water for 1 min, Sections were visualised used a Nikon TS100 light microscope and digital camera.

3. Results

Nine matched, un-passaged EC samples, representing 3 different intra-choroidal locations from three different donors were propagated under identical conditions. The 3 choroidal areas represented by the matched samples were: macular inner CEC, macular outer CEC and peripheral inner CEC (peripheral area nasal to the optic disc). The age, sex and time from death to the cells being placed in culture medium were as follows: 58, male, 28 h: 42, male, 43 h: 62, female, 36 h. All eyes were free of ocular disease, in particular, the macula, on examination with the dissecting microscope.

3.1. Confirmation of Human Endothelial Cell Identity

Samples of cells from all locations displayed a homogeneous cobblestone morphology with no evidence of cell contamination. Greater than 99.5% of the EC from each site demonstrated staining for factor VIII and CD31 prior to their use in the aforementioned experiments, confirming their identity as EC and their purity (Figure 1).

3.2. Overview of Gene Expression Patterns

A total of 1.5–3.4 µg RNA was isolated from each 35 mm plate. All samples analysed had a RIN of between 9.5 and 9.Biotinylated cRNA probes were hybridised to Affymetrix GeneChip® Human Genome U133 Plus 2.0 arrays containing 47,000 transcripts, of which 38,500 were well characterised human genes. A total of 23,636 probesets passed quality control testing during analysis. Complete data is available at http://www.ncbi.nlm.nih.gov/geo/query/acc.cgi?token=gnavimkwbrarxqf&acc=GSE51246 (accessed on 27 September 2013).
Supplementary Figure S1 shows an RNA degradation plot for the nine individual arrays. While RNA degradation was evident, it was similar for all nine arrays. Supplementary Figure S2 shows the nine arrays plotted along the first and second principle components. The plot shows that the macula outer CECs from all three donors are grouped together, while the macular and peripheral inner CECs from each individual donor are positioned close together.

3.3. Proliferating Human Macular Inner CEC Versus Peripheral Inner CEC

Comparison of matched, un-passaged proliferating human macular inner CECs with peripheral inner CECs did not demonstrate any difference in gene expression. This study, therefore, demonstrated a striking homogeneity of gene expression between matched inner CECs derived from the macula and periphery.

3.4. Proliferating Human Macular Inner CEC Versus Macular Outer CEC

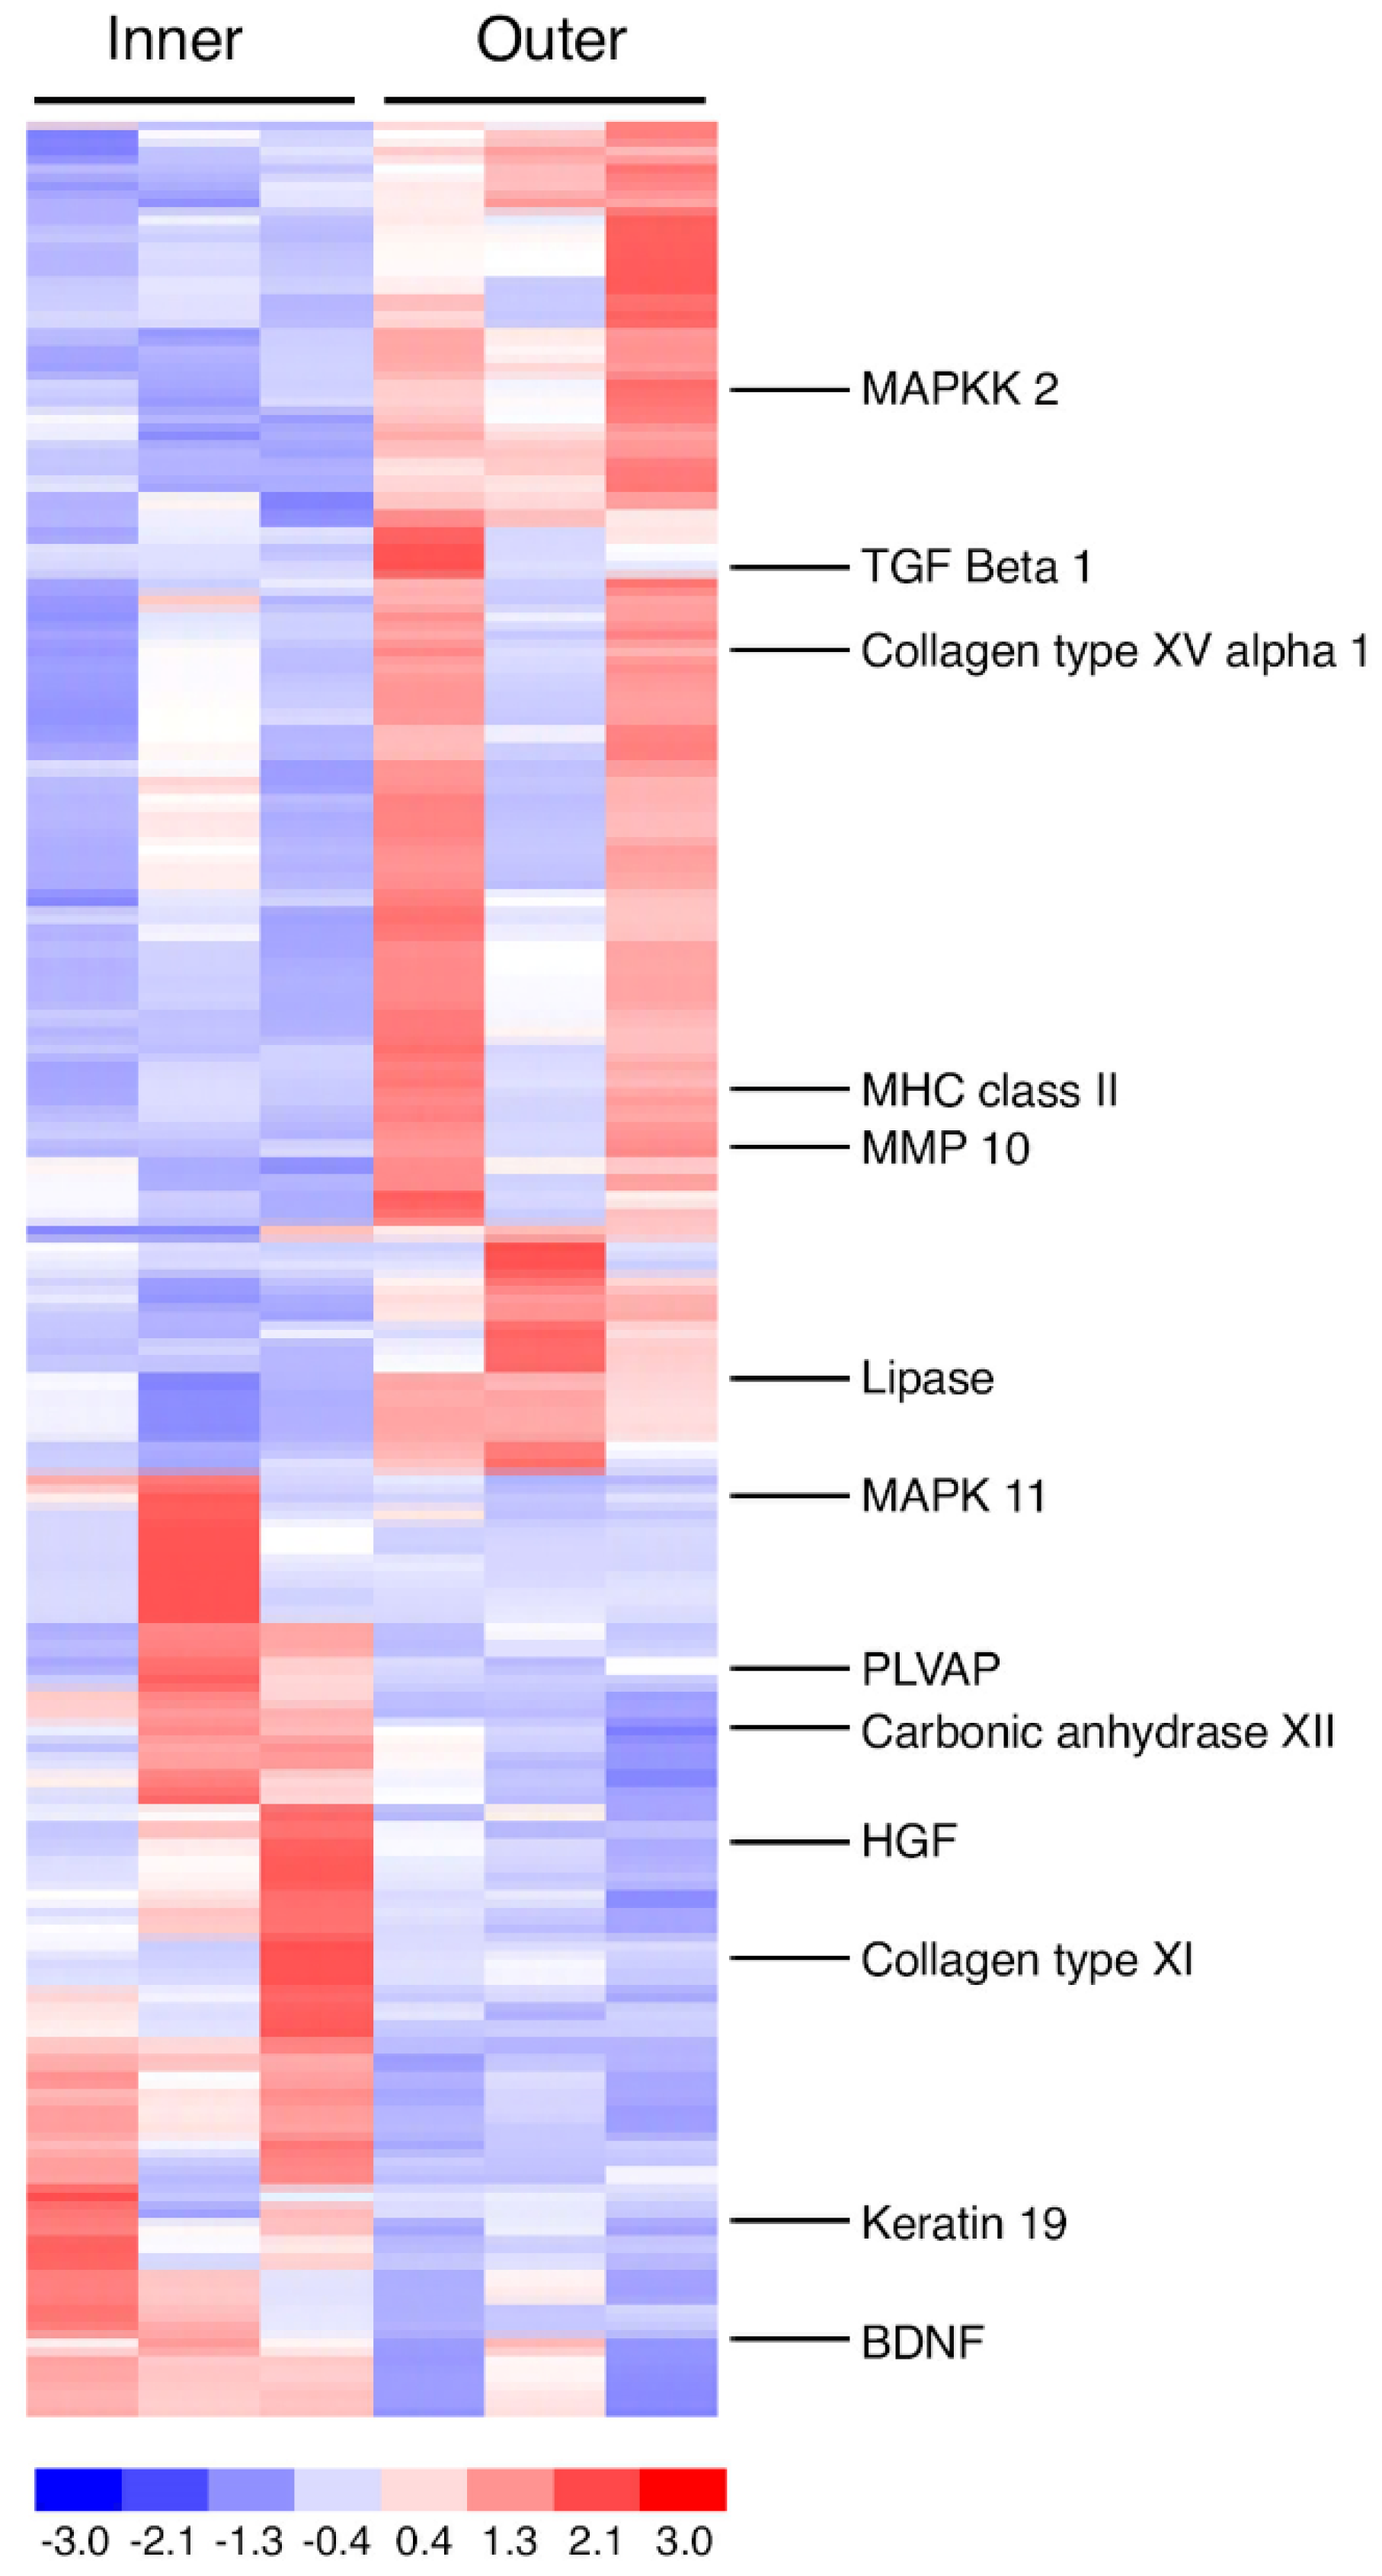
Comparison of matched, un-passaged proliferating human macular inner CEC with macular outer CEC revealed 386 probesets that were differentially expressed between the two cell types (1.6%). Of the 386 probesets, 151 were up-regulated in macular inner CEC, and 235 were up-regulated in macular outer CEC. Probesets for a diverse range of functions including nervous system development (BDNF, Neurofilament light and medium polypeptides), cell signalling (MAPK 11, Apelin receptor, Parvin beta, diacylglycerol kinase and MAPK binding protein 1 and WNT5A), cellular growth and proliferation (VEGF, HGF, CXCL12, TGF Beta1 and MMP10), immune response (MHC class II alpha and HLA DR B1 and CD200) and cell morphology (Keratin 19, Collagen 11 alpha subunit and Collagen 15 alpha subunit and PLVAP) were found to be differentially expressed. Lists of the most highly expressed probesets reaching statistical significance are shown in Table 1 and Table 2, and Figure 2 shows a heat map of the differential probeset expression reaching statistical significance with reference to human macular inner and outer CEC.

3.5. Real-Time PCR

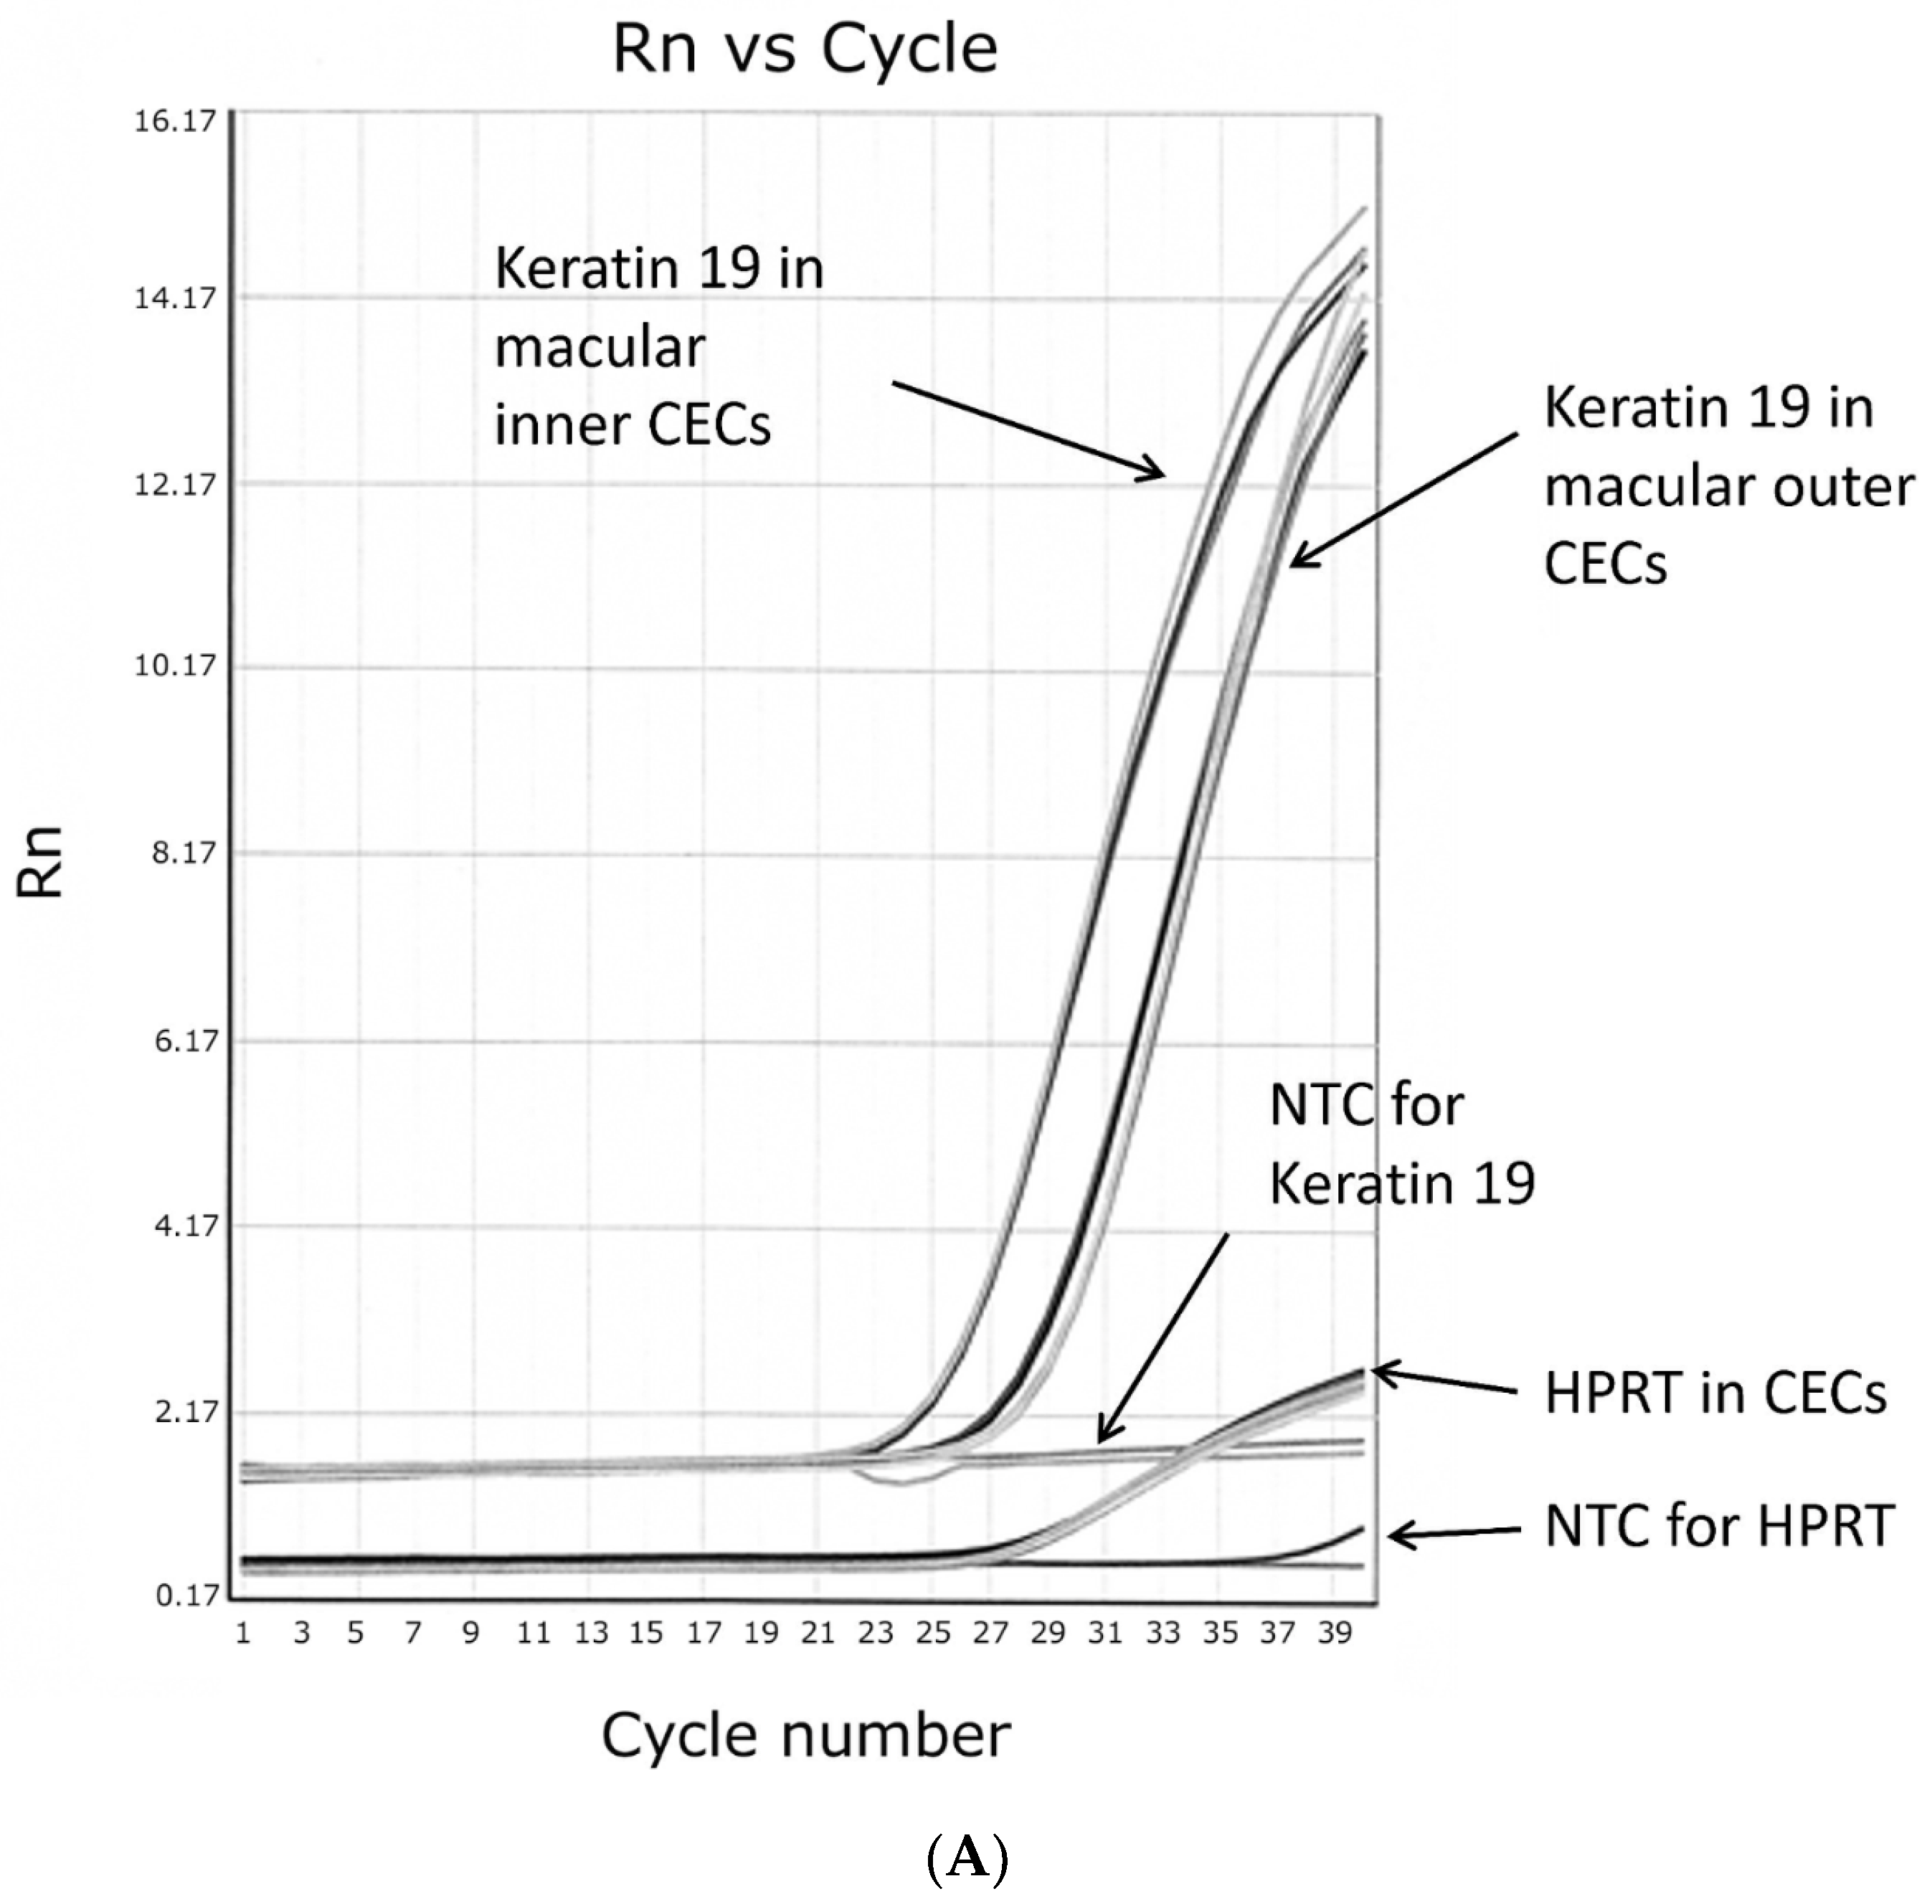
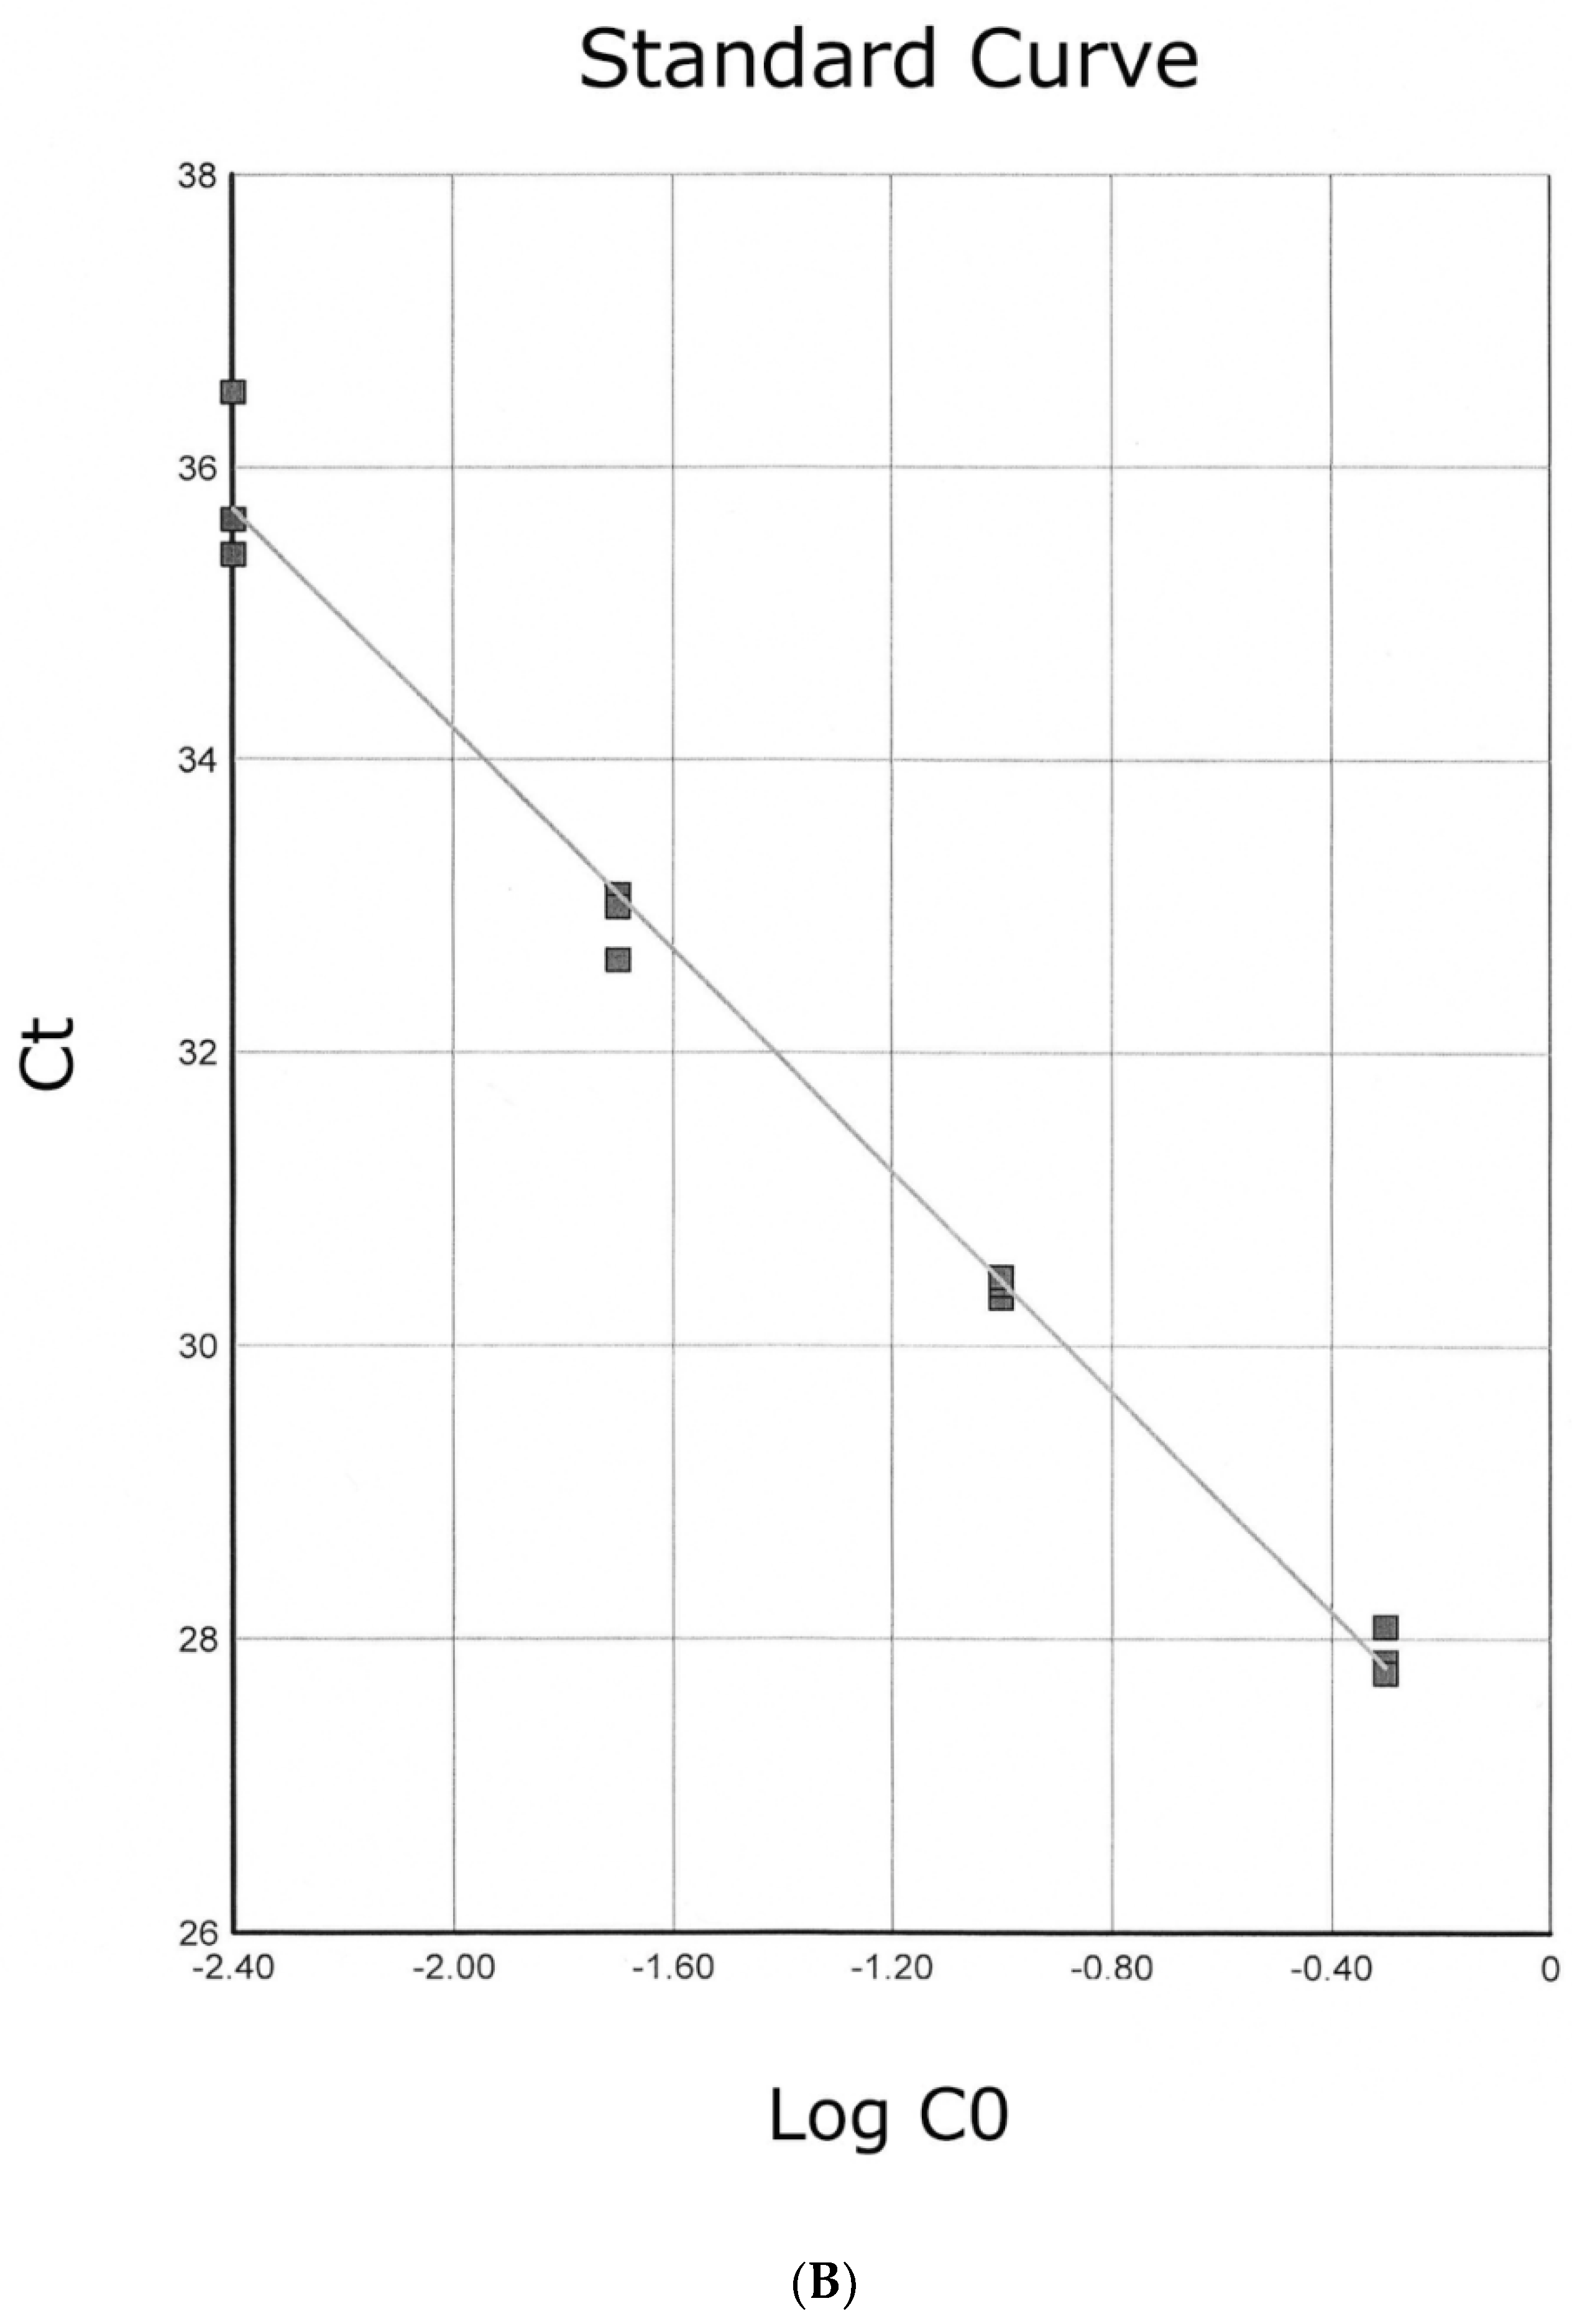
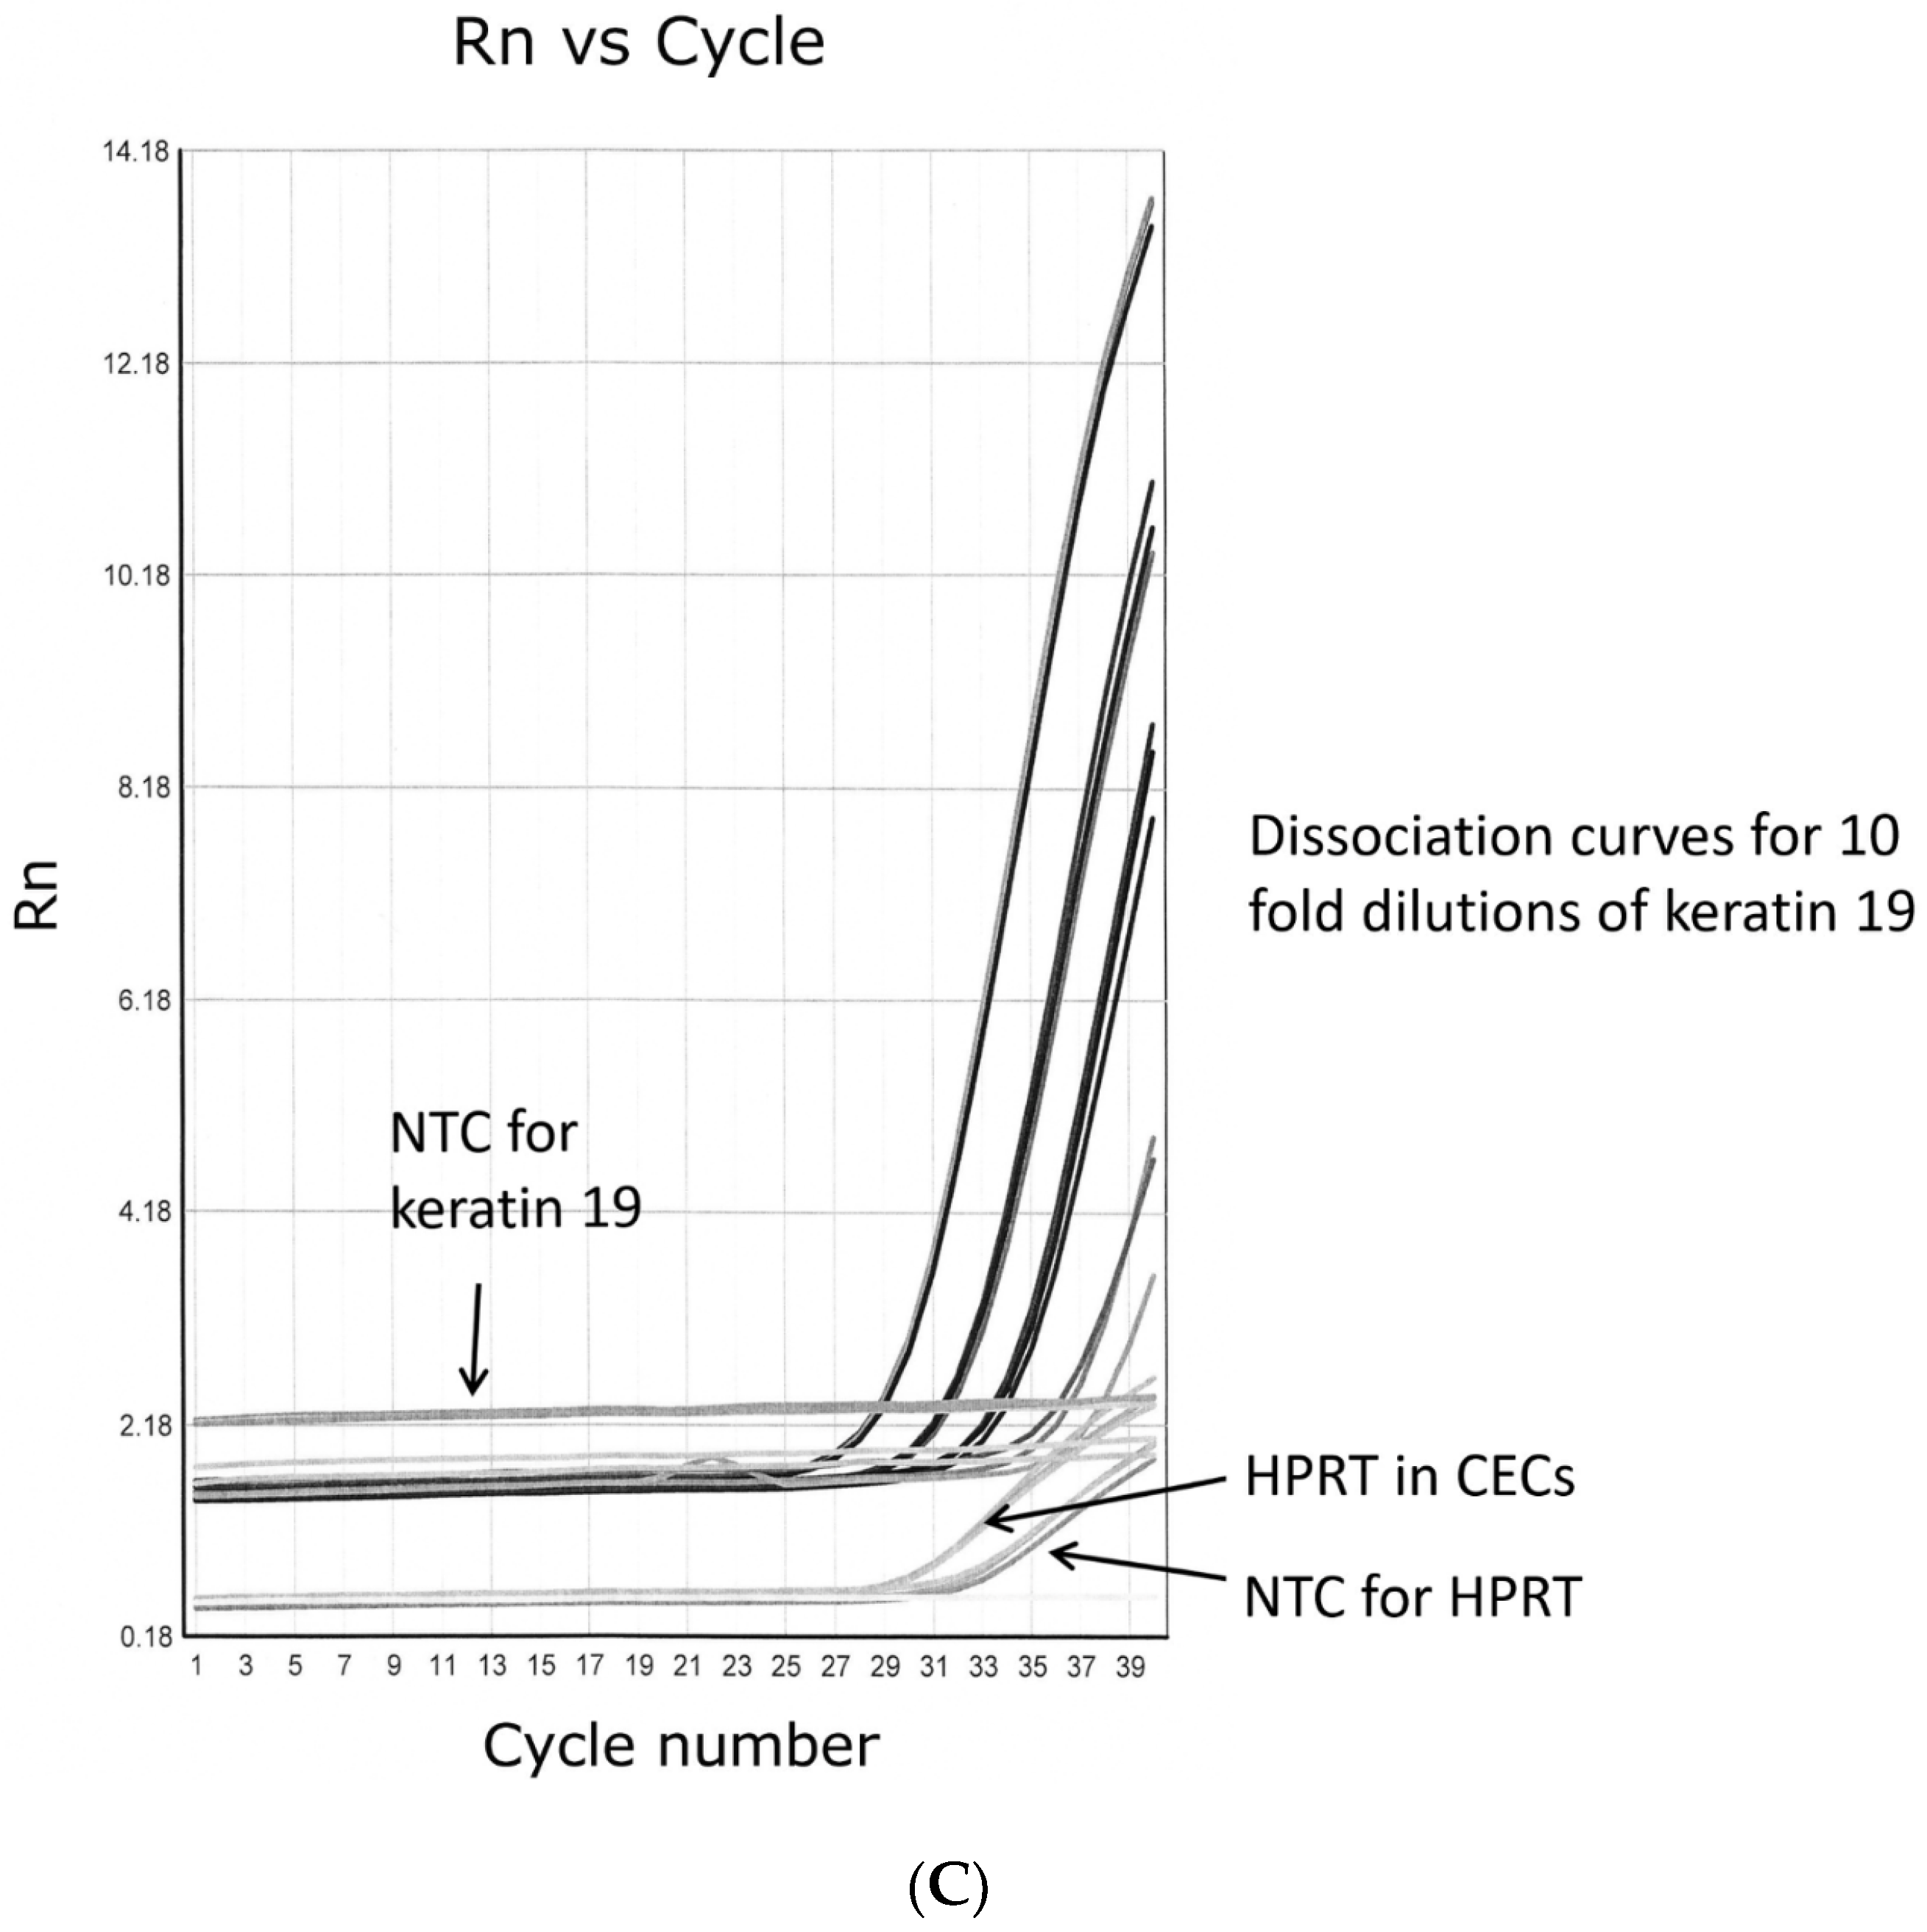
Real-time PCR was used to validate the differences in gene expression between proliferating human inner and outer CEC. Four transcripts were chosen that demonstrated at least a 2-fold differential expression between the EC on microarray analysis and were thought to be relevant to a range of different EC attributes such as the cytoskeleton, intracellular signaling, growth factor and chemokine production. The chosen transcripts were: Keratin 19, BDNF, CXCL 12, and MAPK. Figure 3 demonstrates examples of RT-PCR dissociation curves for Keratin 19 in peripheral inner choroidal, macular inner and macular outer choroidal ECs. The differences in expression between the microarray and real-time PCR techniques were similar for all four transcripts evaluated (Table 3) and demonstrated no significant difference between the results of the two methods for each gene and confirm the overall reliability of the results obtained by the Affymetrix microarray technique.
Ct is the crossing point or threshold at which fluorescence can be detected and log C0 is the log of the relative standard concentration (chosen to correspond to the expected relative concentration of probeset in the samples).

3.6. Immunohistochemistry

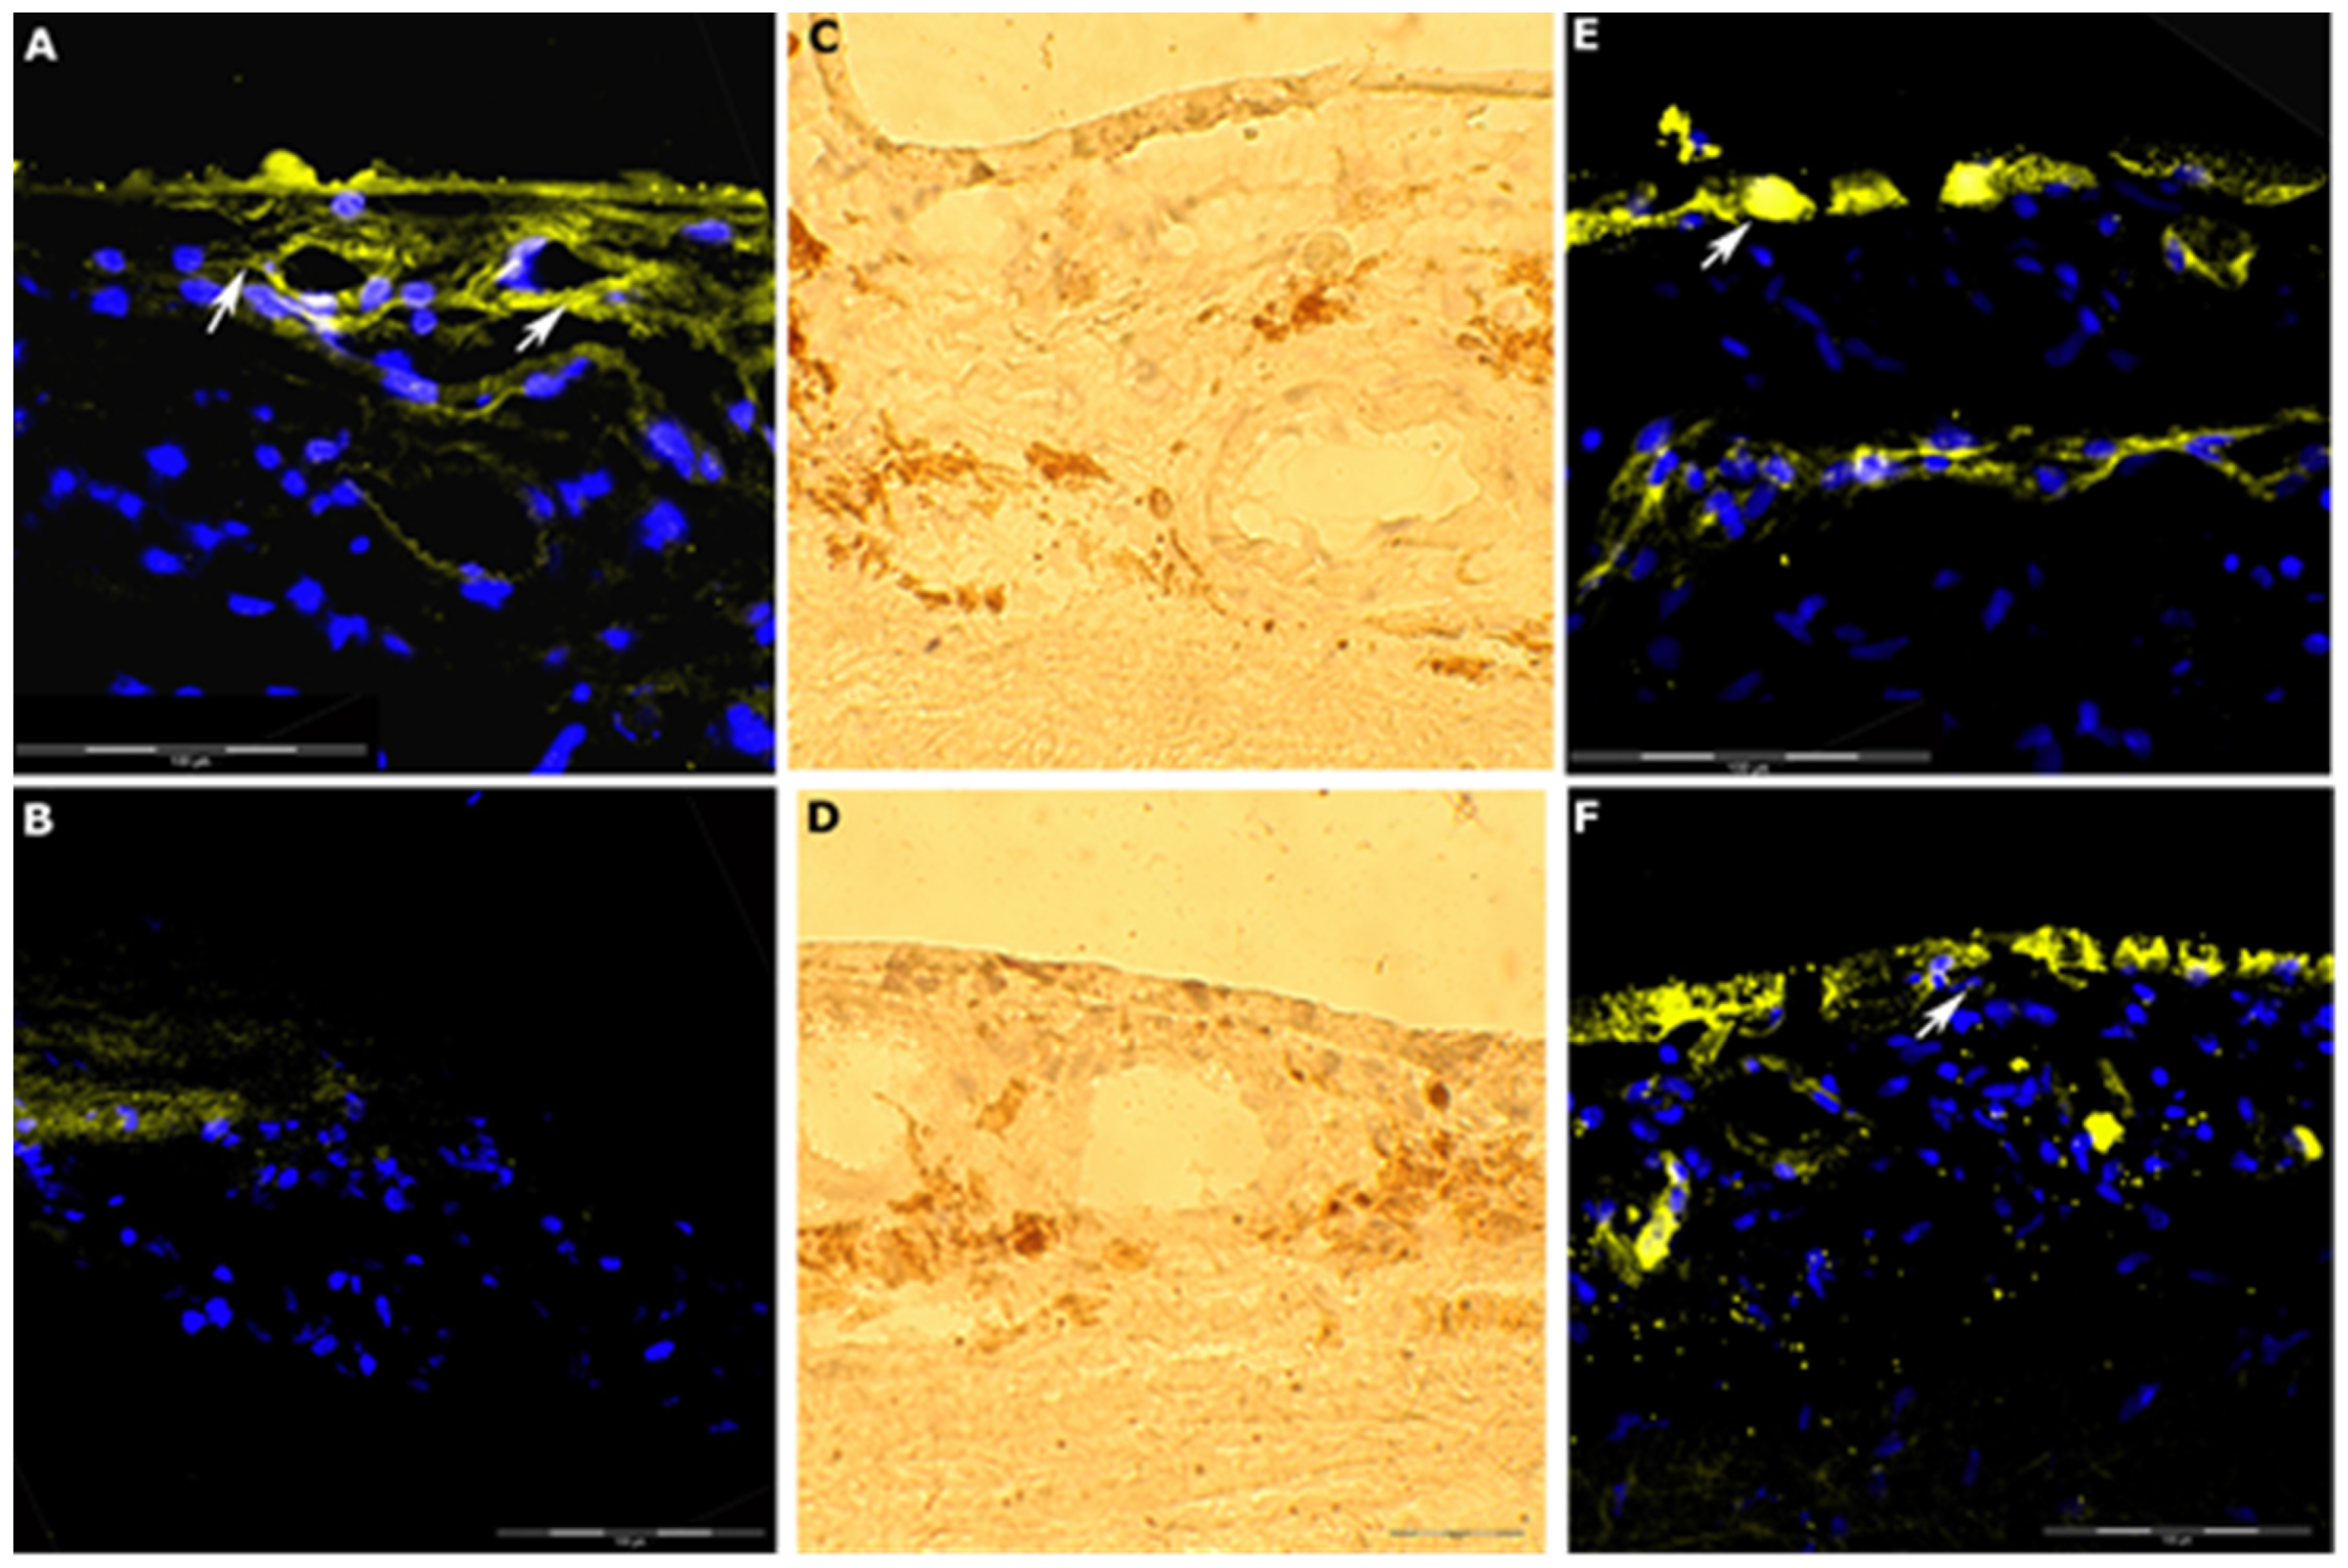
The expression of BDNF and PLVAP were compared between inner and outer choroid using immunofluorescent staining with specific antibodies. When visualised using the same microscope imaging settings increased BDNF expression could be seen in inner macula choroid compared to outer, as indicated by arrows (Figure 4A). Increased staining was also seen in inner macula choroid with PLVAP antibodies (Figure 4E) and this appeared consistently in both macula and peripheral choroid (Figure 4E,F). These results are consistent with the microarray analysis showing that both genes are upregulated in the inner macular CECs.

4. Discussion

It still remains a mystery as to why different ocular posterior segment disorders demonstrate exquisite topographic selectivity for the choroidal vascular bed. Similarly important is the quest for treatments that are selective for the cells involved in the pathological process but which leave normal, juxtaposed cells unaffected—the so-called magic bullet. In the case of wet (neovascular) macular degeneration, this would involve a treatment that specifically targets the proliferating EC of the inner choroid of the macula. While the propensity of the macular for choroidal neovascularisation is unexplained, an animal model of nAMD, using focal laser to apply identical burns to the extra-macular areas, was relatively ineffective at stimulating CNV compared with those placed in the macula, suggesting a predilection of the macula for CNV formation [18].
Over the years, a number of theories have been proposed as to why the human macula is predisposed to choroidal neovacularisation. These include: increased free radical production at the macula caused by the eye’s inherent focusing of ultra-violet or visible light at this location [19,20,21,22] although the majority of large scale epidemiological studies have failed to demonstrate an association [23,24,25], and a localised immune response to preferential drusen deposition at the macula, causing secondary angiogenic events [26]. This latter theory is given weight after Mullins et al. Described differences in the distribution of ICAM 1, a cell surface molecule important in immune response and MHC class I, across the choriocapillaris and retina, with labelling being strongest in the macular area [27,28]. Other hypotheses rely on local differences in Bruch’s membrane structure or the thickness of the elastic layer of Bruch’s membrane in the macular area which is up to six times thinner and up to five times less abundant than in the periphery [10,11,12], or local structural differences in the choroid.
While there have been reports on the morphological and gene expression differences in human RPE cells to explain the difference in disease site specificity [2,3,4], little is known regarding differences in gene expression between peripheral and macular CECs. A number of researchers have used a range of techniques such as microarrays, single cell or localised RNA sequencing and proteomic analysis to establish local gene expression of topographical RPE/choroid complexes or of isolated single cells [29,30,31,32]. In 2007, Radeke et al. studied the topographic differences using microarrays, between macular and peripheral choroid/RPE complexes [29] and this demonstrated a difference in 76 probesets Of significance were a number of inflammation related genes such as CXCL14, CCL19 and CCL26 that were significantly up-regulated in the macula. In 2014, Whitmore used RNA sequencing to study the transcriptome of macular, nasal and temporal PE/choroidal complexes and found distinct differences in the expression of a small number of RPE and endothelial genes [30], while Skeie undertook proteomic analysis of macular and peripheral RPE/choroid complexes and found differences in protein expression between the two [31]. The macula demonstrated increased expression of complement and inflammatory proteins while cells in the periphery show increased expression of anti-oxidants. Unfortunately, all of the samples in these three studies were a homogenates of choroid and RPE and any differences observed could not be ascribed solely to the choroid or, more specifically, the choroidal endothelial cell. In 2019, Voigt used single cell RNA sequencing of CECs in surgically excised choroidal neovascular membranes and found increased expression of the regulator of cell cycle gene (RGCC), carbonic anhydrase 4 (CA4) and PLVAP [32].
The current study did not demonstrate any differences in gene expression between matched human macular and peripheral CEC. This confirms that despite the macular and peripheral choriocapillaris having different ultra-structural appearances, the lining endothelium appears to exhibit the same gene expression generally. This would suggest that the propensity of the macula to suffer CNV is not due to topographical differences in endothelial cells, and that any treatment designed to target proliferating inner CEC is just as likely to affect peripheral ECs as it is the macula. The corollary to this is that treatments that are effective for choroidal vascular disease within the macula area must also be effective in similar diseases occurring in the inner choroid, outside the macula, such as peripapillary and extramacular CNV.
By comparison, greater differences were found between matched inner and outer macular CEC, with 1.6% of probesets showing a significant difference. While no major differences in canonical pathways were discovered and many of the probesets remain unclassified, differences in functional pathways such as nervous system development, cell signalling, immune functions and cell morphology were represented. These differences are likely to be related to their different functions within the choroidal vascular unit.
Perhaps one of the most important probesets found to be differentially expressed is that of PVLAP which was up-regulated in macular inner CECs. PVLAP is a major structural protein known to be associated with fenestrations. The choriocapillaris, which is where macular inner CECs reside is known to be fenestrated, whilst the larger calibre outer choroidal vasculature (where macular outer CECs are found) is not. Interestingly, not all fenestrated ECs express PLVAP, with those of the liver and the glomerulus showing negative expression [33]. BDNF is a member of a group of proteins called neurotrophins which promote growth, survival and differentiation of neurones in the central and peripheral nervous system. Within the eye, BDNF is known to be secreted by RPE cells, photoreceptors and Muller cells and has been shown experimentally to prevent ischaemic ganglion cell death, and protect photoreceptors from light induced toxicity [34]. Recently, BDNF has been found to be secreted by vascular ECs and may be responsible for the levels of the growth factor detected in serum. However, its role outside the central and peripheral nervous system remains unknown [35]. In the current study, BDNF was found to be upregulated 9-fold in macular inner CEC compared with matched outer macular EC. Potential roles for BDNF secretion in this location include its involvement in the maintenance and function of neurones within the choroid, which in turn are involved in regulation of choriocapillaris blood flow, or involvement in outer photoreceptor function by the passage of BDNF across Bruch’s membrane.
Interestingly, inner and outer macular CECs appear to demonstrate preferential up-regulation of collagen types XI and XV, respectively. Collagen XI is a fibrillar collagen, mutations in which, have been found in Stickler’s syndrome. Collagen XV is a non-fibrillar type of collagen which is found in some EC basement membranes and is thought to facilitate binding to surrounding connective tissue [36]. This would suggest that the basement membranes of the inner and outer CECs are different and are perhaps a reflection of their different roles.
The study shows up-regulation of VEGF and HGF expression by macular inner CEC compared to the outer CEC. This may be important because VEGF is required to maintain the specialised phenotype of EC within the choriocapillaris (fenestrations). Hepatocyte growth factor (HGF) is another potent endothelial mitogen secreted by cells of mesenchymal origin, including vascular ECs and macrophages. Its structure, very similar to that of plasminogen, contains a heparin binding domain and is secreted by cells in an inactive form [37]. It relies on the action of serine proteases for activation, and activates cells via the c-met receptor. In the eye, it is thought to play a role in corneal development and maintenance of normal corneal structure, and in the maintenance of trabecular meshwork structure [37]. High levels of HGF and its receptor have been demonstrated in the posterior segment of the eye [38,39,40]. Elevated levels are also found in the vitreous of diabetics and it has been shown to be a potent angiogenic growth factor (greater than VEGF) and may therefore play a role in proliferative diabetic eye disease [41,42]. While there is a large body of evidence regarding the effect of HGF in retinal neovascularisation, its role in choroidal homeostasis and neovascularisation is less well understood. In a rat laser model of CNV, HGF was found to be up-regulated early on in the angiogenic process within the choroid [43]. To the best of our knowledge, no studies on HGF in human choroid, either normal or those with CNV, have been conducted.
In contrast, macular outer choroidal EC demonstrated up-regulation of probesets for the growth factors CXCL12 (stromal cell derived factor 1 [SDF-1]) and TGF-Beta SDF-1 is a known mitogen for ECs. It is also involved in the attraction of endothelial progenitor cells to areas of neovascularisation and has been found on histological examination of excised CNV membranes. Bhutto et al. [44] demonstrated expression of SDF-1 and its receptor within the choroidal stroma (as well as the RPE) and suggested that they may be involved in the recruitment of leukocytes and other inflammatory cells to the choroidal stroma as well of endothelial progenitor cells during local wound healing responses, i.e., angiogenesis. However, its differential expression by macular outer CEC was previously unknown.
While this study describes a number of novel findings regarding choroidal endothelial cells, it does have a number of limitations, largely as a consequence of the availability of suitable donor tissue and the difficulty in maintaining parallel cultures of endothelial cells derived from different sites from the same donors. It is recognised that age can have an effect on the differential gene expression of certain ocular tissues such as the retina [45]. While using donors of similar age may allow this effect to be reduced as a cause of variability, using donors with a range of ages from 42 to 62 is important because choroidal neovascularisation can occur at almost any age. In our experiments, the effect of age was reduced by only selecting those genes for further investigation that were significantly upregulated in all donors.

5. Conclusions

In summary, this study has demonstrated small, subtle but important differences between matched proliferating human macular inner and outer CEC; however, no significant differences in canonical or functional pathways were found between macular and peripheral inner CEC. This suggests that the small topographical differences in proliferating inner CEC is probably not the cause of the site specific selectivity of neovascular AMD and that this phenomenon is more likely to be due to topographical differences in other ocular cell types or to selective exposure of the macula to a disease causing agent. A higher level of variability was noted, however, in the gene expression of matched macular inner and outer CEC. This differential gene expression would suggest subtle differences in the roles and microenvironments of the two cell types commensurate with the different structures and functions of the inner and outer choroid. These observed differences may assist us in understanding some of the underlying mechanisms of choroidal neovascularisation and provide potential routes for selective intervention to treat the disease.

Supplementary Materials

The following are available online at https://www.mdpi.com/article/10.3390/ijtm1020007/s1. Figure S1. RNA degradation plot for the 9 individual arrays. Figure S2. Plot showing the 9 arrays plotted along the first and second principle components. The macula outer CECs from all donors are grouped together, while the macular and peripheral inner CECs from each individual donor are positioned close together.

Author Contributions

Conceptualization, A.C.B. and W.M.A., experimentation, A.C.B., E.P.H., D.C.S., S.J.C. and E.A.S.; data analysis, A.C.B., E.P.H., D.C.S., S.J.C. and E.A.S.; writing—original draft preparation, A.C.B. and W.M.A.; writing—review and editing, A.C.B. and W.M.A.; funding acquisition, W.M.A. and A.C.B. All authors have read and agreed to the published version of the manuscript.

Funding

This research was funded by a research grant from The British Eye Research Foundation (Fight for Sight UK), grant number BERF 0406, and an unrestricted research grant from Novartis Pharma, grant number GGM13-EO14. The funders had no role in the design of the study; in the collection, analyses, or interpretation of data; in the writing of the manuscript, or in the decision to publish the results.

Institutional Review Board Statement

This study was conducted according to the guidelines of the Declaration of Helsinki, and had the approval of the local research ethics committee (Nottingham Q1060301).

Informed Consent Statement

Not applicable.

Data Availability Statement

Complete data is available at http://www.ncbi.nlm.nih.gov/geo/query/acc.cgi?token=gnavimkwbrarxqf&acc=GSE51246 (accessed on 1 January 2021).

Acknowledgments

This research was supported by a research grant from Fight for Sight UK, and an unrestricted research grant from Novartis Pharma.

Conflicts of Interest

W.M.A.: Commercial relationships: acted as consultant for Abbvie, Alimera, Allergan Inc, Bayer, Apellis, Novartis, Pfizer, Santen and Thrombogenics, and has undertaken research sponsored by Allergan, Bayer, Boerhinger Ingelheim, No-vartis and Pfizer. He has received speaker fees and travel grants from Allergan, Bausch and Lomb, Bayer, Novartis and Pfizer. All other authors declare no conflict of interest.

References

  1. Sharon, D.; Blackshaw, S.; Cepko, C.L.; Dryja, T.P. Profile of the genes expressed in the human peripheral retina, macula, and retinal pigment epithelium determined through serial analysis of gene expression (SAGE). Proc. Natl. Acad. Sci. USA 2002, 99, 315–320. [Google Scholar] [CrossRef] [PubMed] [Green Version]
  2. Ishibashi, K.; Tian, J.; Handa, J.T. Similarity of mRNA phenotypes of morphologically normal macular and peripheral retinal pigment epithelial cells in older human eyes. Investig. Ophthalmol. Vis. Sci. 2004, 45, 3291–3301. [Google Scholar] [CrossRef]
  3. Bowes Rickman, C.; Ebright, J.N.; Zavodni, Z.J.; Yu, L.; Wang, T.; Daiger, S.P.; Wistow, G.; Boon, K.; Hauser, M.A. Defining the human macula transcriptome and candidate retinal disease genes using EyeSAGE. Investig. Ophthalmol. Vis. Sci. 2006, 47, 2305–2316. [Google Scholar] [CrossRef] [Green Version]
  4. Van Soest, S.S.; de Wit, G.M.; Essing, A.H.; ten Brink, J.B.; Kamphuis, W.; de Jong, P.T.; Bergen, A.A. Comparison of human retinal pigment epithelium gene expression in macula and periphery highlights potential topographic differences in Bruch’s membrane. Mol. Vis. 2007, 13, 1608–1617. [Google Scholar]
  5. Curcio, C.A.; Sloan, K.R.; Kalina, R.E.; Hendrickson, A.E. Human photoreceptor topography. J. Comp. Neurol. 1990, 292, 497–523. [Google Scholar] [CrossRef]
  6. Hornan, D.M.; Peirson, S.N.; Hardcastle, A.J.; Molday, R.S.; Cheetham, M.E.; Webster, A.R. Novel retinal and cone photoreceptor transcripts revealed by human macular expression profiling. Investig. Ophthalmol. Vis. Sci. 2007, 48, 5388–5396. [Google Scholar] [CrossRef] [Green Version]
  7. Bernstein, S.L.; Wong, P. Regional expression of disease-related genes in human and monkey retina. Mol. Vis. 1998, 4, 24. [Google Scholar]
  8. Bron, A.J.; Tripathi, R.C.; Tripathi, B.J. Wolff’s Anatomy of the Eye and Orbit; Chapman and Hall: London, UK, 1997; pp. 460–465. [Google Scholar]
  9. Keilhauer, C.N.; Delori, F.C. Near-infrared autofluorescence imaging of the fundus: Visualization of ocular melanin. Investig. Ophthalmol. Vis. Sci. 2006, 47, 3556–3564. [Google Scholar] [CrossRef]
  10. Ramrattan, R.S.; van der Schaft, T.L.; Mooy, C.M.; de Bruijn, W.C.; Mulder, P.G.; de Jong, P.T. Morphometric analysis of Bruch’s membrane, the choriocapillaris, and the choroid in aging. Investig. Ophthalmol. Vis. Sci. 1994, 35, 2857–2864. [Google Scholar]
  11. Okubo, A.; Rosa, R.H., Jr.; Bunce, C.V.; Alexander, R.A.; Fan, J.T.; Bird, A.C.; Luthert, P.J. The relationships of age changes in retinal pigment epithelium and Bruch’s membrane. Investig. Ophthalmol. Vis. Sci. 1999, 40, 443–449. [Google Scholar]
  12. Chong, N.H.; Keonin, J.; Luthert, P.J.; Frennesson, C.I.; Weingeist, D.M.; Wolf, R.L.; Mullins, R.F.; Hageman, G.S. Decreased thickness and integrity of the macular elastic layer of Bruch’s membrane correspond to the distribution of lesions associated with age-related macular degeneration. Am. J. Pathol. 2005, 166, 241–251. [Google Scholar] [CrossRef]
  13. Killingsworth, M.C. Angiogenesis in early choroidal neovascularization secondary to age-related macular degeneration. Graefes Arch. Clin. Exp. Ophthalmol. 1995, 233, 313–323. [Google Scholar] [CrossRef] [PubMed]
  14. Sarks, J.P.; Sarks, S.H.; Killingsworth, M.C. Morphology of early choroidal neovascularisation in age-related macular degeneration: Correlation with activity. Eye 1997, 11, 515–522. [Google Scholar] [CrossRef] [PubMed] [Green Version]
  15. Browning, A.C.; Gray, T.; Amoaku, W.M. Isolation, culture, and characterisation of human macular inner choroidal microvascular endothelial cells. Br. J. Ophthalmol. 2005, 89, 1343–1347. [Google Scholar] [CrossRef] [Green Version]
  16. Browning, A.C.; Halligan, E.P.; Stewart, E.A.; Swan, D.C.; Dove, R.; Samaranayake, G.J.; Amoaku, W.M. Comparative gene expression profiling of human umbilical vein endothelial cells and ocular vascular endothelial cells. Br. J. Ophthalmol. 2012, 96, 128–132. [Google Scholar] [CrossRef]
  17. Breitling, R.; Armengaud, P.; Amtmann, A.; Herzyk, P. Rank products: A simple, yet powerful, new method to detect differentially regulated genes in replicated microarray experiments. FEBS Lett. 2004, 573, 83–92. [Google Scholar] [CrossRef]
  18. Shen, W.Y.; Lee, S.Y.; Yeo, I.; Lai, C.; Mathur, R.; Tan, D.; Constable, I.J.; Rakoczy, P.E. Predilection of the macular region to high incidence of choroidal neovascularization after intense laser photocoagulation in the monkey. Arch. Ophthalmol. 2004, 122, 353–360. [Google Scholar] [CrossRef] [Green Version]
  19. Cruickshanks, K.J.; Klein, R.; Klein, B.E.; Nondahl, D.M. Sunlight and the 5-year incidence of early age-related maculopathy: The beaver dam eye study. Arch. Ophthalmol. 2001, 119, 246–250. [Google Scholar]
  20. Tomany, S.C.; Cruickshanks, K.J.; Klein, R.; Klein, B.E.; Knudtson, M.D. Sunlight and the 10-year incidence of age-related maculopathy: The Beaver Dam Eye Study. Arch. Ophthalmol. 2004, 122, 750–757. [Google Scholar] [CrossRef] [Green Version]
  21. Grimm, C.; Wenzel, A.; Williams, T.; Rol, P.; Hafezi, F.; Reme, C. Rhodopsin-mediated blue-light damage to the rat retina: Effect of photoreversal of bleaching. Investig. Ophthalmol. Vis. Sci. 2001, 42, 497–505. [Google Scholar]
  22. Hafezi, F.; Marti, A.; Munz, K.; Reme, C.E. Light-induced apoptosis: Differential timing in the retina and pigment epithelium. Exp. Eye Res. 1997, 64, 963–970. [Google Scholar] [CrossRef] [Green Version]
  23. Delcourt, C.; Carriere, I.; Ponton-Sanchez, A.; Fourrey, S.; Lacroux, A.; Papoz, L. Light exposure and the risk of age-related macular degeneration: The Pathologies Oculaires Liees a l’Age (POLA) study. Arch. Ophthalmol. 2001, 119, 1463–1468. [Google Scholar] [CrossRef]
  24. Darzins, P.; Mitchell, P.; Heller, R.F. Sun exposure and age-related macular degeneration. An Australian case-control study. Ophthalmology 1997, 104, 770–776. [Google Scholar] [CrossRef]
  25. McCarty, C.A.; Mukesh, B.N.; Fu, C.L.; Mitchell, P.; Wang, J.J.; Taylor, H.R. Risk factors for age-related maculopathy: The Visual Impairment Project. Arch. Ophthalmol. 2001, 119, 1455–1462. [Google Scholar] [CrossRef] [PubMed] [Green Version]
  26. Lengyel, I.; Tufail, A.; Hosaini, H.A.; Luthert, P.; Bird, A.C.; Jeffery, G. Association of drusen deposition with choroidal intercapillary pillars in the aging human eye. Investig. Ophthalmol. Vis. Sci. 2004, 45, 2886–2892. [Google Scholar] [CrossRef] [PubMed] [Green Version]
  27. Mullins, R.F.; Skeie, J.M.; Malone, E.A.; Kuehn, M.H. Macular and peripheral distribution of ICAM-1 in the human choriocapillaris and retina. Mol. Vis. 2006, 12, 224–235. [Google Scholar] [PubMed]
  28. Abi-Hanna, D.; Wakefield, D.; Watkins, S. HLA antigens in ocular tissues. I. In vivo expression in human eyes. Transplantation 1988, 45, 610–613. [Google Scholar] [CrossRef]
  29. Radeke, M.J.; Peterson, K.E.; Johnson, L.V.; Anderson, D.H. Disease susceptibility of the human macula: Differential gene transcription in the retinal pigmented epithelium/choroid. Exp. Eye Res. 2007, 85, 366–380. [Google Scholar] [CrossRef]
  30. Whitmore, S.S.; Wagner, A.H.; DeLuca, A.P.; Drack, A.V.; Stone, E.M.; Tucker, B.A.; Zeng, S.; Braun, T.A.; Mullins, R.F.; Scheetz, T.E. Transcriptomic analysis across nasal, temporal, and macular regions of human neural retina and RPE/choroid by RNA-Seq. Exp. Eye Res. 2014, 129, 93–106. [Google Scholar] [CrossRef] [PubMed] [Green Version]
  31. Skeie, J.M.; Mahajan, V.B. Proteomic landscape of the human choroid—Retinal pigment epithelial complex. JAMA Ophthalmol. 2014, 132, 1271–1281. [Google Scholar] [CrossRef] [Green Version]
  32. Voigt, A.P.; Mulfaul, K.; Mullin, N.K.; Flamme-Wiese, M.J.; Giacalone, J.C.; Stone, E.M.; Tucker, B.A.; Scheetz, T.E.; Mullins, R.F. Single-cell transcriptomics of the human retinal pigment epithelium and choroid in health and macular degeneration. Proc. Natl. Acad. Sci. USA 2019, 116, 24100–24107. [Google Scholar] [CrossRef] [Green Version]
  33. Satchell, S.C.; Braet, F. Glomerular endothelial cell fenestrations: An integral component of the glomerular filtration barrier. Am. J. Physiol. Renal Physiol. 2009, 296, F947–F956. [Google Scholar] [CrossRef] [Green Version]
  34. Kano, T.; Abe, T.; Tomita, H.; Sakata, T.; Ishiguro, S.; Tamai, M. Protective effect against ischemia and light damage of iris pigment epithelial cells transfected with the BDNF gene. Investig. Ophthalmol. Vis. Sci. 2002, 43, 3744–3753. [Google Scholar] [PubMed]
  35. Nakahashi, T.; Fujimura, H.; Altar, C.A.; Li, J.; Kambayashi, J.; Tandon, N.N.; Sun, B. Vascular endothelial cells synthesize and secrete brain-derived neurotrophic factor. FEBS Lett. 2000, 470, 113–117. [Google Scholar] [CrossRef] [Green Version]
  36. Amenta, P.S.; Scivoletti, N.A.; Newman, M.D.; Sciancalepore, J.P.; Li, D.; Myers, J.C. Proteoglycan-collagen XV in human tissues is seen linking banded collagen fibers subjacent to the basement membrane. J. Histochem. Cytochem. 2005, 53, 165–176. [Google Scholar] [CrossRef] [PubMed]
  37. Grierson, I.; Heathcote, L.; Hiscott, P.; Hogg, P.; Briggs, M.; Hagan, S. Hepatocyte growth factor/scatter factor in the eye. Prog. Retin. Eye Res. 2000, 19, 779–802. [Google Scholar] [CrossRef]
  38. He, P.M.; He, S.; Garner, J.A.; Ryan, S.J.; Hinton, D.R. Retinal pigment epithelial cells secrete and respond to hepatocyte growth factor. Biochem. Biophys. Res. Commun. 1998, 249, 253–257. [Google Scholar] [CrossRef]
  39. Jin, M.; Barron, E.; He, S.; Ryan, S.J.; Hinton, D.R. Regulation of RPE intercellular junction integrity and function by hepatocyte growth factor. Investig. Ophthalmol. Vis. Sci. 2002, 43, 2782–2790. [Google Scholar]
  40. Jin, M.; Chen, Y.; He, S.; Ryan, S.J.; Hinton, D.R. Hepatocyte growth factor and its role in the pathogenesis of retinal detachment. Investig. Ophthalmol. Vis. Sci. 2004, 45, 323–329. [Google Scholar] [CrossRef] [Green Version]
  41. Nishimura, M.; Ikeda, T.; Ushiyama, M.; Nanbu, A.; Kinoshita, S.; Yoshimura, M. Increased vitreous concentrations of human hepatocyte growth factor in proliferative diabetic retinopathy. J. Clin. Endocrinol. Metab. 1999, 84, 659–662. [Google Scholar] [CrossRef]
  42. Katsura, Y.; Okano, T.; Noritake, M.; Kosano, H.; Nishigori, H.; Kado, S.; Matsuoka, T. Hepatocyte growth factor in vitreous fluid of patients with proliferative diabetic retinopathy and other retinal disorders. Diabetes Care 1998, 21, 1759–1763. [Google Scholar] [CrossRef]
  43. Hu, W.; Criswell, M.H.; Fong, S.L.; Temm, C.J.; Rajashekhar, G.; Cornell, T.L.; Clauss, M.A. Differences in the temporal expression of regulatory growth factors during choroidal neovascular development. Exp. Eye Res. 2009, 88, 79–91. [Google Scholar] [CrossRef] [PubMed]
  44. Bhutto, I.A.; McLeod, D.S.; Merges, C.; Hasegawa, T.; Lutty, G.A. Localisation of SDF-1 and its receptor CXCR4 in retina and choroid of aged human eyes and in eyes with age related macular degeneration. Br. J. Ophthalmol. 2006, 90, 906–910. [Google Scholar] [CrossRef] [PubMed] [Green Version]
  45. Cai, H.; Fields, M.A.; Hoshino, R.; Del Priore, L.V. Effects of aging and anatomical location on gene expression in human retina. Front. Aging Neurosci. 2012, 4, 1–20. [Google Scholar] [CrossRef] [Green Version]
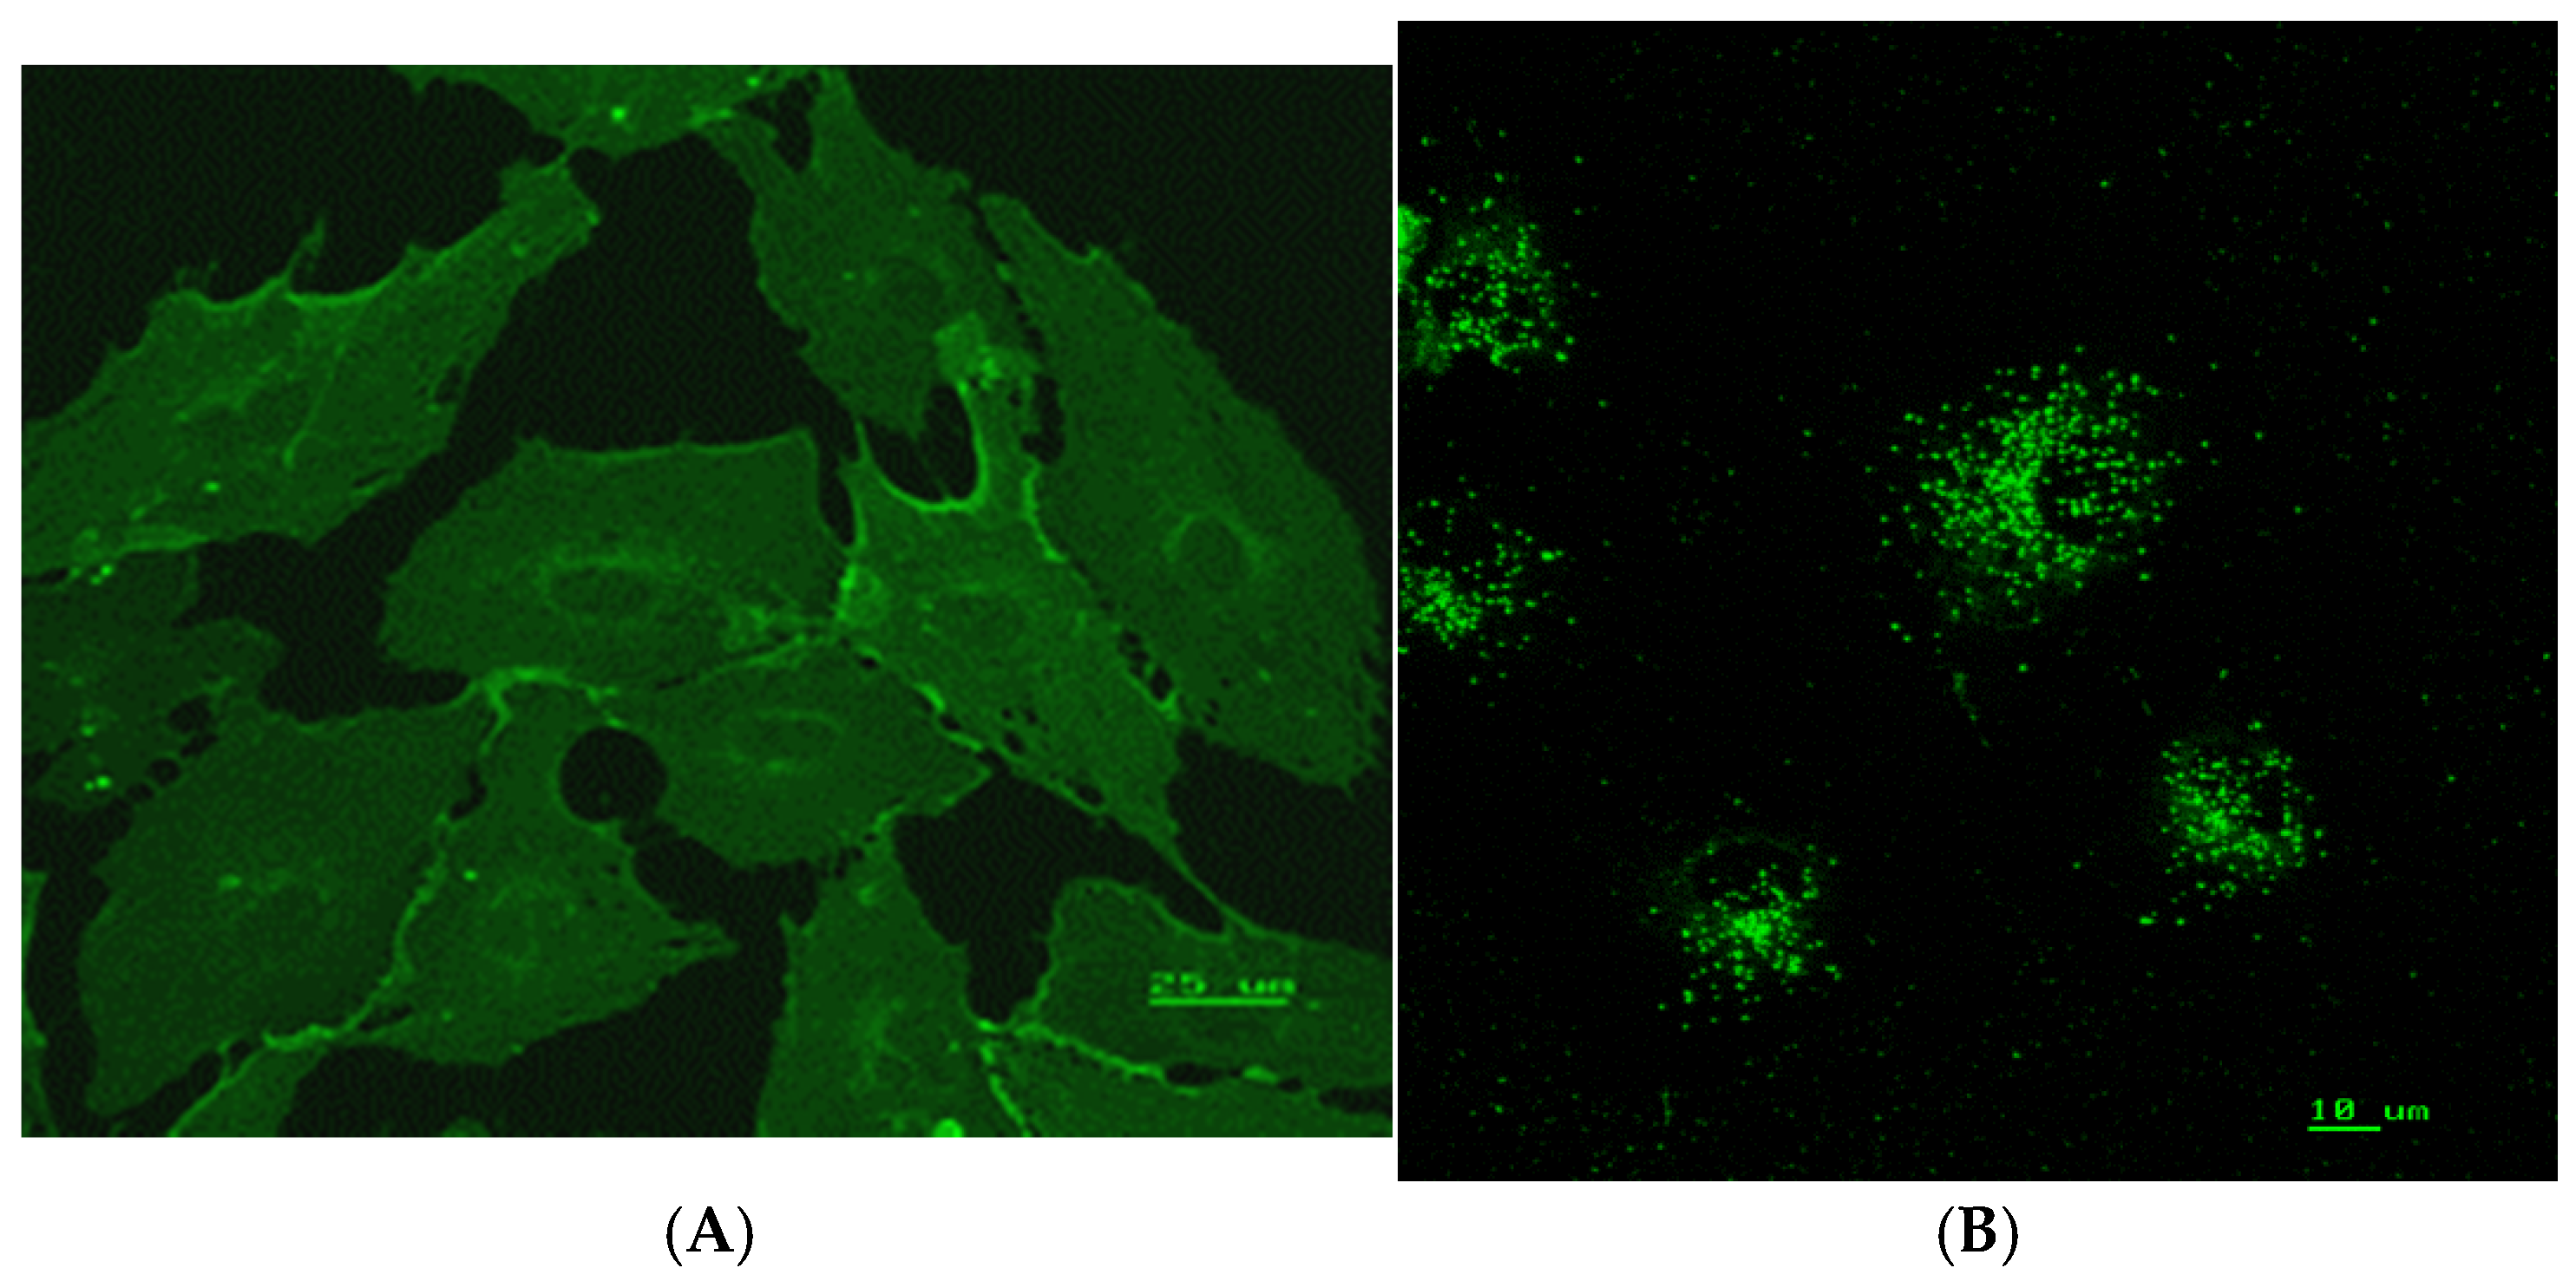
Figure 1. (A) Immunofluorescent photomicrograph of choroidal endothelial cells stained for CD 31. Predominance of staining occurs at the edge of the cells where density of CD31 is known to be highest. (B) Immunofluorescent photo micrograph of human choroidal endothelial cells showing dense staining for vWF.
Ijtm 01 00007 g001
Figure 2. Heatmap of the differential probeset expression between human macular inner and outer choroidal microvascular EC reaching statistical significance (adjusted p < 0.05). Up-regulated probesets are shown in red, down-regulated in blue. A total of 386 different probesets are represented. The positions of selected probesets thought to be important in endothelial cell biology are shown. The scale bar underneath the heatmap represents the log2 fold change from the mean.
Ijtm 01 00007 g002
Figure 3. (A) Examples of the real time PCR dissociation curves for Keratin 19 in the, macular inner and macular outer choroidal ECs. The Y axis depicts the fluorescence of the reporter signal normalised to a reference signal (Rn,) while the X axis depicts the cycle number. The probeset under investigation is represented by all 3 curves of the sample triplicate and also includes a probeset for the reference housekeeping gene, hypoxanthine-guanine phosphoribosyltransferase (HPRT). Additionally represented are the curves of the No Template Control (NTC) (sterile water). (B) represents the calculated standard curve derived from Figure 3a demonstrating its linearity of the range tested. (C) demonstrates the dissociation curves for a series of 10 fold dilutions for Keratin 19 reference sample.
Ijtm 01 00007 g003aIjtm 01 00007 g003bIjtm 01 00007 g003c
Figure 4. Immunofluorescent staining of inner and outer choroid showing increased staining of BDNF and PLVAP. Macula and peripheral choroid sections were immunofluorescently stained with antibodies to BDNF (A,B) and PLVAP (E,F) (yellow). In inner macula choroid ((A) and (E), arrows) staining was increased for both BDNF and PLVAP compared to outer choroid, this was also seen in peripheral choroid with PLVAP but not BDNF. Cell nuclei were counter stained with DAPI (blue). Hematoxylin and Eosin staining of serial sections visualised the tissue structures of macula choroid (C) and peripheral choroid (D).
Ijtm 01 00007 g004
Table 1. The top 100 probesets reaching differential expression of 2.0 or greater and corrected p-value less than 0.05 in human macular inner CEC compared with macular outer CEC.
Gene TitleFold ChangeUncorrected p-ValueCorrected p-Value
insulin-like growth factor binding protein 311.100
neurofilament, medium polypeptide10.400
brain-derived neurotrophic factor8.800
platelet-derived growth factor receptor, alpha polypeptide8.800.0029
keratin 197.300.0033
pleckstrin homology-like domain, family A, member 27.100
solute carrier family 6 (neutral amino acid transporter)6.600
popeye domain containing 36.000.0031
olfactomedin-like 35.900.0038
SIX homeobox 25.600.0035
neurofilament, light polypeptide5.500.0033
adipocyte-specific adhesion molecule5.200.0027
CCAAT/enhancer binding protein (C/EBP), beta5.200.0107
mesoderm specific transcript homolog (mouse)5.100.0036
ADAM metallopeptidase with thrombospondin type 15.100.005
mannosyl (alpha-1,3-)-glycoprotein 5.100.0029
keratin associated protein 2–45.000.0044
chromosome 5 open reading frame 234.900.004
vascular endothelial growth factor A4.900.0197
brain expressed, X-linked 14.800.0113
GLI pathogenesis-related 14.700.0096
lysophosphatidic acid receptor 14.700.0177
Aldehyde dehydrogenase 1 family, member L24.600.0264
collagen, type XI, alpha 14.41.0 × 1040.0388
pleckstrin and Sec7 domain containing 34.400.0037
carbonic anhydrase XII4.41.0 × 1040.0393
procollagen C-endopeptidase enhancer 24.300.0272
ABI family, member 3 (NESH) binding protein4.300.0269
phosphodiesterase 5A, cGMP-specific4.200.0107
PNMA-like 14.100.0205
tissue factor pathway inhibitor 24.11.0 × 1040.0408
glycine receptor, beta4.000.034
fin bud initiation factor homolog (zebrafish)4.000.013
wingless-type MMTV integration site family, member 5A4.000.0038
sphingosine-1-phosphate receptor 34.000.0298
carbonic anhydrase XII3.900.0171
forkhead box F23.900.0321
MSTP1503.92..0 × 1040.0495
Ras-related C3 botulinum toxin substrate 1 3.91.0 × 1040.0406
frequenin homolog (Drosophila)3.800.0207
glycine receptor, beta3.81.0 × 1040.0405
vestigial like 3 (Drosophila)3.800.0259
TP53 regulating kinase3.81.0 × 1040.0421
chromosome 6 open reading frame 1413.800.0095
calmegin3.71.0 × 1040.0359
carbonic anhydrase XII3.700.0152
hypothetical protein LOC1001305063.700.0112
ectonucleotide pyrophosphatase/phosphodiesterase 23.71.0 × 1040.0437
protocadherin 183.600.0295
leucine rich repeat (in FLII) interacting protein 13.600.0155
hepatocyte growth factor (hepapoietin A; scatter factor)3.600.0091
protein phosphatase 1, regulatory (inhibitor) subunit 14B3.61.0 × 1040.0486
golgi autoantigen, golgin subfamily a, 8A3.600.0159
lymphoid-restricted membrane protein3.500.0341
sulfatase 13.41.0 × 1040.0471
dermatan sulfate epimerase-like3.400.0116
secretogranin II (chromogranin C)3.41.0 × 1040.0408
poliovirus receptor-related 33.400.026
metastasis associated lung adenocarcinoma transcript 1 3.400.0205
folate receptor 1 (adult)3.400.021
transforming growth factor, beta receptor 13.41.0 × 1040.0386
spermatogenesis associated 18 homolog (rat)3.41.0 × 1040.0429
tissue factor pathway inhibitor 23.400.0337
emopamil binding protein-like3.41.0 × 1040.0354
aldehyde dehydrogenase 1 family, member A33.400.0283
centromere protein V3.400.0256
interferon-induced protein with tetratricopeptide repeats 13.400.0332
lactamase, beta3.400.0183
5’-nucleotidase, ecto (CD73)3.31.0 × 1040.0426
tumor necrosis factor (ligand) superfamily, member 153.300.0203
mitogen-activated protein kinase kinase kinase kinase 43.31.0 × 1040.0448
chromosome 9 open reading frame 403.300.0319
neuropilin (NRP) and tolloid (TLL)-like 23.31.0 × 1040.0347
family with sequence similarity 13, member B3.31.0 × 1040.041
aspartyl-tRNA synthetase3.200.0195
Chromodomain helicase DNA binding protein 23.21.0 × 1040.0404
paternally expressed 103.200.0311
versican3.100.0298
metastasis associated lung adenocarcinoma transcript 1 3.100.0337
nephronophthisis 3 (adolescent)3.100.0265
carboxymethylenebutenolidase homolog (Pseudomonas)3.100.0293
hypothetical LOC1001288223.11.0 × 1040.0434
phosphoglycolate phosphatase3.100.0262
prostaglandin-endoperoxide synthase 2 3.000.0227
retinol dehydrogenase 14 (all-trans/9-cis/11-cis)3.000.0267
carbohydrate sulfotransferase 73.01.0 × 1040.0444
proline rich 163.02.0 × 1040.0498
transcription factor Dp-13.000.0107
aryl hydrocarbon receptor3.000.0346
glycoprotein (transmembrane) nmb3.000.0295
chromosome 13 open reading frame 153.000.0319
collagen, type I, alpha 23.000.0293
O-linked N-acetylglucosamine (GlcNAc) transferase 3.01.0 × 1040.0419
B-cell translocation gene 1, anti-proliferative3.01.0 × 1040.0424
phosphatidic acid phosphatase type 2B3.000.0339
cyclin-dependent kinase inhibitor 2B (p15, inhibits CDK4)3.000.0342
TAF10 RNA polymerase II, TATA box binding protein 3.01.0 × 1040.0495
serpin peptidase inhibitor, clade E (nexin,2.91.0 × 1040.0453
COMM domain containing 22.91.0 × 1040.0363
transducer of ERBB2, 12.91.0 × 1040.043
Table 2. The top one hundred probesets reaching differential expression of 2.0 or greater and corrected p-value less than 0.05 in human macular outer CEC compared with macular inner CEC.
Gene TitleFold ChangeUncorrected p-ValueCorrected p-Value
histone cluster 1, H3b14.700
LSM4 homolog, U6 small nuclear RNA associated (S. cerevisiae)10.200
translocase of inner mitochondrial membrane 44 homolog (yeast)8.900
chromosome 6 open reading frame 1088.400
fascin homolog 1, actin-bundling protein (Strongylocentrotus purpuratus)7.900
FXYD domain containing ion transport regulator 67.800
leucine rich repeat containing 157.600
translocase of inner mitochondrial membrane 44 homolog (yeast)7.400
RAS and EF-hand domain containing7.400
kinesin light chain 16.900
RAS and EF-hand domain containing6.800
cyclin K6.400
polypyrimidine tract binding protein 16.000.001
valyl-tRNA synthetase5.900.0011
apelin receptor5.400.0024
fascin homolog 1, actin-bundling protein (Strongylocentrotus purpuratus)5.400.003
mitogen-activated protein kinase kinase 25.100.0029
cleft lip and palate associated transmembrane protein 15.100.0018
Hypothetical protein LOC3390474.900.0006
RNA pseudouridylate synthase domain containing 34.700.0024
histone cluster 1, H2bf4.600.0025
transforming growth factor beta 1 induced transcript 14.500.0026
mRNA turnover 4 homolog (S. cerevisiae)4.500.0027
deoxyribonuclease I-like 34.400.0028
RAN binding protein 34.400.0031
histone deacetylase 54.400.0041
cysteine-rich protein 24.100.0023
cell division cycle 34 homolog (S. cerevisiae)4.100.0103
TAO kinase 14.100.0023
dicarbonyl/L-xylulose reductase4.500.0037
collagen, type XV, alpha 13.900.009
coronin, actin binding protein, 1B3.900.0058
mannose receptor, C type 1 /// mannose receptor, C type 1-like 13.900.0076
DEAD (Asp-Glu-Ala-Asp) box polypeptide 543.900.0081
Na+/H+ exchanger domain containing 13.900.0026
sema domain, transmembrane domain (TM) (semaphorin) 6B3.900.0049
coronin, actin binding protein, 1B3.800.0076
carboxypeptidase M3.800.0073
protocadherin 173.700.0086
GINS complex subunit 4 (Sld5 homolog)3.700.0051
guanine nucleotide binding protein-like 3 (nucleolar)-like3.600.0058
leucine rich repeat containing 333.600.0087
protein kinase C and casein kinase substrate in neurons 23.600.0048
thimet oligopeptidase 13.600.0088
major histocompatibility complex, class II, DR beta 13.600.0086
hypothetical LOC6544333.600.0167
zinc finger protein 6883.600.0102
histone cluster 1, H1b3.600.0089
chromosome 1 open reading frame 933.500.0086
SH3KBP1 binding protein 13.500.0088
cleft lip and palate associated transmembrane protein 13.500.0077
Rho GTPase activating protein 293.500.0094
major histocompatibility complex, class II, DR beta 1 3.400.0057
MAD1 mitotic arrest deficient-like 1 (yeast)3.400.0083
exosome component 43.400.0104
YKT6 v-SNARE homolog (S. cerevisiae)3.400.0087
zinc finger CCCH-type containing 7B3.300.0087
ATPase type 13A23.200.0117
RAB GTPase binding effector protein 23.300.0085
hepatoma-derived growth factor-related protein 23.300.01
phosphoglucomutase 53.200.0153
matrix metallopeptidase 10 (stromelysin 2)3.200.009
mitogen-activated protein kinase kinase 23.100.009
endoglin3.11.0 × 10−40.0241
R-spondin 3 homolog (Xenopus laevis)3.11.0 × 10−40.0234
F-box and WD repeat domain containing 53.11.0 × 10−40.0285
carbohydrate (keratan sulfate Gal-6) sulfotransferase 13.100.009
lipase, endothelial3.100.0128
Similar to p403.100.0087
spectrin repeat containing, nuclear envelope 23.11.0 × 10−40.0237
kinesin light chain 13.100.0103
homer homolog 3 (Drosophila)3.100.0102
hypothetical protein LOC2864343.11.0 × 10−40.0208
exosome component 43.100.0146
glucocorticoid receptor DNA binding factor 13.100.0085
WD repeat domain 43.000.0091
cytochrome b5 reductase 33.000.0085
chromosome 21 open reading frame 453.000.0165
cytochrome P450, family 1, subfamily B, polypeptide 13.000.0182
peter pan homolog (Drosophila)3.000.0101
cytochrome P450, family 1, subfamily B, polypeptide 13.000.0167
cyclin D13.01.0 × 10−40.0319
nasal embryonic LHRH factor3.000.0084
zinc finger protein 1603.000.0153
3-hydroxy-3-methylglutaryl-Coenzyme A synthase 1 (soluble)3.000.0102
dipeptidyl-peptidase 93.000.01
small optic lobes homolog (Drosophila)3.000.0179
splicing factor, arginine/serine-rich 8 2.91.0 × 10−40.0211
Wolf-Hirschhorn syndrome candidate 12.92..0 × 10−40.0397
DEAD (Asp-Glu-Ala-Asp) box polypeptide 542.900.0135
dedicator of cytokinesis 62.900.015
lysosomal multispanning membrane protein 52.900.0099
FERM domain containing 32.91.0 × 10−40.0191
ankyrin repeat domain 1 (cardiac muscle)2.91.0 × 10−40.0231
ring finger protein 1252.900.0186
Hypothetical protein LOC2032742.900.0175
sorbitol dehydrogenase2.900.0119
ATPase family, AAA domain containing 3A2.900.01
sparc/osteonectin, cwcv and kazal-like domains proteoglycan (testican) 12.900.0103
Hypothetical protein LOC1001295022.91.0 × 10−40.0209
Table 3. Differences in gene expression of selected genes for proliferating human macular inner and outer CEC according to microarray and RT-PCR.
Difference in Gene Expression (Fold Change)
Gene TranscriptAffy IDFold Change in Gene Expression Relative to Human Macular Inner CECs
Microarray (SD)RT-PCR (SD)(p Value)
Keratin 19201650_at7.3 (1.8)10.5 (2.0)(0.15)
Brain derived Neurotrophic factor206382_s_at8.9 (0.8)7.2 (0.6)(0.34)
CXCL 12203666_at−2.4 (−1.0)−3.6 (−1.0)(0.21)
MAPK 11206040_s_at−2.8 (−0.9)−3.3 (−0.64)(0.52)
Publisher’s Note: MDPI stays neutral with regard to jurisdictional claims in published maps and institutional affiliations.