Article

Detection and Quantification Limits for Polyethylene Particles Combining the Thermal Rock-Eval® Method with a Mathematical Extrapolation Procedure

by
Maria-Fernanda Romero-Sarmiento
*,
Daniela Bauer
and
Sébastien Rohais
Direction Sciences de la Terre et Technologies de l’Environnement, IFP Énergies Nouvelles (IFPEN), CEDEX, 92852 Rueil-Malmaison, France
*
Author to whom correspondence should be addressed.
Microplastics 2025, 4(4), 71; https://doi.org/10.3390/microplastics4040071
Submission received: 31 July 2025 / Revised: 27 August 2025 / Accepted: 26 September 2025 / Published: 2 October 2025

Abstract

The main aim of this work is to define the limits of detection (LOD) and quantification (LOQ) for polyethylene (PE) particles using a pyrolysis and oxidation-based method, the thermal Rock-Eval® device, combined with a mathematical extrapolation procedure. The influences of particle size and shape on the thermal degradation of PE polymers are also investigated in this study. Thermal Total HC and Tpeak parameters, recently used to characterize polymer samples, are evaluated as a function of both polymer grain size and shape. Results indicate a LOD for the investigated PE polymers of around 1.7–2 μg in 60 mg of composite sediment (28–33 ppm). A conservative LOQ for the PE samples ranges between 5 and 6 μg (83–100 ppm). The LOQ is on the same order of magnitude for any size or shape of the studied PE polymers. By contrast, the LOD for the PE samples is slightly affected by both the polymer grain size and shape. Results also demonstrate that it is possible to detect PE nanoparticles of 79 nm in size. Finally, this study provides specific Rock-Eval® parameters, linear regressions, and a mathematical extrapolation procedure that can be used to better quantify very small PE mass contents, including nanoplastics in environmental samples.

1. Introduction

Plastic pollution is a major environmental issue because plastics can fragment throughout their life cycle and thus release very small particles beyond our ability to see them (e.g., microplastics 0.001–5 mm or nanoplastics < 0.001 mm). Today, there is not any compartment of the environment (atmosphere, biosphere, lithosphere, or hydrosphere) that is not contaminated by plastics, ranging from human blood [1] to the Mariana Trench [2] or even the troposphere [3]. The challenge is then to be able to identify microplastics, but above all to quantify them. Quantification can be performed either in number of items (e.g., Raman and FTIR) or in mass, especially with thermal analysis.
Polyethylene (PE) is the most used polymer in the plastic industry, primarily because it is cheap, versatile, durable, chemically resistant, and easy to manufacture and process at large scale. It largely fits the needs of industries ranging from packaging and construction to healthcare and agriculture [4]. Numerous scientific studies have investigated the detection and quantification limits of polyethylene employing various analytical techniques. The sensitivity of these methods varies significantly based on the instrumentation and sample preparation protocols used [5]. Most of these common analytical techniques include thermal extraction desorption–gas chromatography/mass spectrometry (TED-GC/MS), pyrolysis–gas chromatography–mass spectrometry (Py-GC-MS), ultrahigh-performance liquid chromatography (UHPLC), nuclear magnetic resonance (NMR) spectroscopy, and flow cytometry [6,7,8,9,10]. Table 1 summarizes the detection and quantification limits (LOD and LOQ) for polyethylene across these different analytical methods available in the literature. These studies highlight the advancements in analytical techniques for detecting and quantifying polyethylene, with varying degrees of sensitivity and applicability depending on the specific requirements of the analysis. However, it remains unclear to what extent particle size and shape influence the detection and quantification limits for such analytical methods.
During the last three years, the thermal Rock-Eval® device has also been used to identify and to quantify pure polymers and textile microfibers in the environment [11,12]. Regarding the detection limits of this thermal technique, Romero-Sarmiento et al. [11] estimated a preliminary detection limit of around 0.2 wt.%, meaning around 0.1 mg of microplastics in 60 mg of sediment sample (1667 ppm), related to sample preparation and weighting procedures. However, the analytical sensitivity of this thermal device could also be tested and extended to detect low plastic concentrations. Thermal Rock-Eval® parameters proposed to characterize polymer samples have already been published [11,12]. For instance, Figure 1 illustrates an example of selected thermal Rock-Eval® parameters and linear regressions between Total HCcomposite and the polymer content defined for the polyethylene terephthalate (PET) polymer, providing a screening framework to quickly convert Rock-Eval® results (Total HC) obtained from environmental samples into quantified values of polymer (PET) content. The Total HCpolymer provides the quantity of hydrocarbon (HC) compounds released during total pyrolysis of the polymer. The Tpeakpolymer parameter corresponds to the temperature at which the HC signal reaches its maximum. Concerning units, Total HCpolymer is expressed in mg/g, whereas Tpeakpolymer is expressed in °C ([11]; Figure 1). Recently, Ricard et al. [13] also demonstrated and confirmed good linear correlations between the Total HCcomposite parameter and the polymer content in mixtures containing PE and different mineral matrices (e.g., calcite, sand, sepiolite, kaolinite, illite, and goethite), suggesting that matrix effects do not impede PE quantification. Nevertheless, additional work is still needed to better define the specific detection and quantification limits of this thermal method, particularly for small mass contents of PE microplastics in the environment.
Furthermore, quantification in number has the advantage of being able to characterize the form of plastic and particularly its shape, which is generally grouped into six categories: sphere (pellets), fiber, foam, film, fragment, and colloidal suspension containing nanoparticles. It seems that the plastic shape has a major impact on the quantification method. For example, fibers can be extremely numerous and predominant in a sample but only represent a very small mass equivalent [14]. Similarly, the particle size or shape of microplastics largely influences our ability to convert item quantification into mass [15].
For these reasons, this study aims, for the first time, to investigate the limits of detection (LOD) and quantification (LOQ) of polyethylene particles, a key microplastic in the environment, using the thermal Rock-Eval® method. The latter is coupled with a mathematical extrapolation procedure to quantify the masses of samples with a low PE concentration. Initially, we focus on monodisperse PE particles to determine the LOD and LOQ of the pure polymer and to evaluate the extrapolation procedure. In the second step, we measure the Rock-Eval® parameters of particles of different sizes and shapes, which may contain chemical additives, to establish whether their size and shape influence the thermal degradation of microplastics in artificial sediments prepared at different concentrations. Based on these results, we provide suggestions for the LOD and LOQ of these samples.

2. Materials and Methods

2.1. Materials: Polyethylene (PE) Samples of Different Grain Sizes and Shapes

In this study, nine PE samples with different particle polymer grain sizes and shapes were first selected to characterize the corresponding PE polymer properties as a function of thermal degradation. Figure 2 illustrates examples of both the polymer grain sizes and shapes of the selected PE samples. The analyzed polymers included the following nine PE samples: (1) fine-grained powdered PE, grain size 34–50 μm (reference 434272), (2) fine-grained powdered PE, grain size 110 μm (reference 429015), (3) fine-grained powdered PE, grain size 125 μm (reference 434264), (4) PE pellet microspheres (reference 428078), (5) PE fiber (reference GF40985017), (6) high-density polyethylene (HDPE) film, plastic bag packaging (reference 102.813.54), (7) PE foam, camping mattress (reference 1766-195), (8) HDPE fragment, red bottle cap (commercial reference “Montagne, Repère”), and (9) a suspension containing cationic polyethylene nanoparticles, average grain size 79 nm (developed in the framework of the Léa Jacquin PhD thesis 2020–2024 and provided by the Laboratory of Catalysis, Polymerization, Process and Materials (CP2M, Lyon–France)). More detailed descriptions about the investigated PE samples are summarized in Table 2. In general, PE polymers are mainly composed of significantly higher carbon and hydrogen contents. The theorical total organic carbon (TOC) content of PE is around 85.7 wt.% and the PE chemical formula is (C2H4)n [16].
To reproduce and simulate an environmental sediment contaminated by PE plastics from a natural beach environment, artificial composite samples were created by mixing the selected PE samples with a natural sand sample (GA39) obtained from the typical Fontainebleau Sandstone group located in the southern part of the Île-de-France, about 60 km southeast of Paris (France). It corresponds to the same sand matrix previously used [11,12]. This sand mineral matrix was previously heated at 800 °C for ten minutes to clean and to remove any potential organic or polymer contamination. The detailed chemical composition of the natural sand sample used as the mineral matrix reference in this study is available in Table S1 from the Supplementary Data in [12].

2.2. Methods: The Thermal Rock-Eval® Device

A Rock-Eval® 6 device operating at the IFP Energies Nouvelles (France) was first used to define both the limit of detection and quantification of pure PE polymers present in 60 mg of sediment, following the analytical procedure to characterize polymer samples proposed in [11]. This device was also used here to investigate the effect of different particle polymer grain sizes and shapes in sediments during Rock-Eval® parameter acquisition. The Rock-Eval® 6 device is equipped with two ovens dedicated for pyrolysis and combustion processes, respectively. The total hydrocarbon (HC) compounds released during the pyrolysis step are monitored using a flame ionization detector (FID), whereas the total CO2 and CO compounds released during both the pyrolysis and oxidation stages are monitored using an infra-red (IR) detector [17,18,19]. In this work, the modified Rock-Eval® Basic/Bulk-Rock method described in [20] was tested. This method, which has been widely used to analyze soil samples, is characterized by a starting pyrolysis step at 200 °C for 3 min and then the pyrolysis temperature increases from 200 °C to 650 °C at 25 °C/min [20]. The oxidation step starts at 200 °C for 1 min and then the oxidation temperature increases from 200 °C to 850 °C at 25 °C/min. Quality control and calibration of the Rock-Eval® device is classically performed using the reference standard IFPEN-160000 to validate HC, CO, and CO2 signals and calculate Rock-Eval® parameters. About 80 mg of this certified standard is regularly run every 10 analyses. Rock-Eval® thermograms are visualized using Geoworks-Geochemical V1.8 software provided by Vinci Technologies (France). The Rock-Eval® parameters previously defined to characterize polymer families (e.g., Total HC, Total CO, Total CO2, Tpeak, PC, RC, and TOC) were then calculated following procedures already published in [11]. As PE polymers are mainly composed of carbon and hydrogen, only Rock-Eval® FID (HC) signals were considered for investigating both the LOD and LOQ of the PE polymers and for the extrapolation procedure. The Total HCpolymer parameter relates linearly the response of the FID to the polymer mass, as follows:
T o t a l   H C p o l y m e r = c T = 200 ° C T = 650 ° C F I D   d T P o l y m e r   m a s s ,

2.3. Sample Preparation for Rock-Eval® Analysis

In this study, PE and sand mineral matrix samples were directly prepared in Rock-Eval® crucibles as follows:
First, a series of 13 Rock-Eval® analysis was carried out on 60 mg of the blank sand mineral matrix (GA39).
Second, for the evaluation of the quantification method, the fine-grained powdered PE, particle size 125 microns (reference 434264), was selected as the reference polymer. Triplicate Rock-Eval® analyses were performed on this pure polymer sample at different masses, varying between 0.1 to 2.0 mg, equivalent to 0.2 to 3.4% of PE content (set 1). A total of 33 Rock-Eval® analysis were performed. A second set (set 2) of 8 samples was then prepared using the same mass balance, an XPR2 essential microbalance provided by Mettler Toledo (France)). For this set, the weighted masses ranged from 0.01 mg to 0.05 mg. As these values were below the calibration limit of the balance, precise weighting was not possible. All pure small PE amounts were diluted in ca. 60 mg of the sand mineral matrix in Rock-Eval® crucibles to reach environmentally relevant concentrations and to reproduce artificial composite samples. The regression linear responses of set 1 between PE polymer concentration and thermal Rock-Eval® parameters were determined, and then accurate masses of set 2 were estimated using the extrapolation procedure that will be presented in Section 2.5.
The third step of this protocol was focused on evaluating the Rock-Eval® parameters as a function of the pure PE polymer particle size and shape. For the five bigger PE particles (sphere, fiber, film, foam, and fragment), Rock-Eval® analyses were performed on previously cut micro-fragments with dimensions between 1 μm and 1000 μm (=1 mm). For the three fine-grained powdered PE particles with different grain sizes (Table 2), Rock-Eval® analyses were carried out on the fine powders, as provided by the manufacturer. By contrast, for the nano PE colloidal suspension, an aliquot of this liquid sample was weighted in Rock-Eval® crucibles previously filled with mineral sand matrix. For each PE polymer sample with these nine different grain sizes and shapes, triplicate Rock-Eval® analyses were carried out on 60 mg of each composite sample. These composite samples were prepared by taking the sand mineral matrix previously mixed with a fixed amount of PE polymers ranging from 0.07 to 2.3 mg. These measurements were performed to investigate the effect of both particle PE polymer size and shape on the Rock-Eval® parameters recently used to assess both the identification and quantification of polymers present in samples containing sand mineral matrices. A series of 87 Rock-Eval® analysis was performed accordingly.

2.4. Limits of Blank (LOB), Detection (LOD), and Quantification (LOQ) Procedures

The determination of both the limits of detection and quantitation of the analytical methods was primarily based on approaches that support pharmaceutical development and drug screening [21,22,23,24]. In this work, we determined the limits of blank, detection, and quantification based on a signal-to-noise method proposed by Armbruster and Pry [23] and Shrivastava and Gupta [24]. The advantage of this method is that it is independent of the determination of polymer concentration or mass, which might introduce errors.
The limit of blank (LOB) is defined as the highest apparent analyte concentration expected to be found when replicates of a sample containing no analyte are tested [21]. The LOB is estimated by measuring replicates of a blank sample and calculating the mean result and the standard deviation (SDblank), as follows:
L O B = m e a n b l a n k +   1.645 ( S D b l a n k ) ,
The limit of detection (LOD) is defined as the lowest analyte concentration likely to be reliably distinguished from the LOB and at which detection is feasible. The LOD can be estimated as follows:
L O D = m e a n b l a n k +   3 ( S D b l a n k ) ,
This last equation considers only the standard deviation of the blank sample. However, the variability of the detector response may depend on the nature of the sample. This fact can be accounted for by determining the LOD, as follows:
L O D = L O B + 1.645 ( S D l o w   c o n c e n t r a t i o n   s a m p l e ) ,
Combining the standard deviations of the blank and the low-concentration sample. Finally, the limit of quantification (LOQ) is defined as the lowest concentration at which the analyte cannot only be reliably detected but at which some predefined goals for bias and imprecision are met. The LOD can be estimated as follows:
L O Q = m e a n b l a n k +   10 ( S D b l a n k ) ,
Choosing a signal-to-noise ratio of 10:1 might result in higher values of LOQ (e.g., Goedecke et al. [6] proposed LOQ = 2LOD). However, this commonly applied definition provides a general and conservative LOQ limit applicable to all sizes and shapes of PE particles.

2.5. Modified Rock-Eval® Equations and Mathematical Extrapolation Procedures

In this work, a mathematical extrapolation procedure was proposed considering the linear screening framework to estimate polymer masses from the Rock-Eval® FID signal (Total HCpolymer parameter) in a mass range below the one of standard laboratory mass balances (<0.1 mg). The same procedure can be applied to colloidal suspensions, where determining the precise mass of particles in solution is difficult.
As this study focused on very low concentrations of PE in the environment, the contribution of the FID signal from pure, polymer-free sand could not be ignored. Therefore, Equation (1) was modified and rewritten as follows:
T o t a l   H C p o l y m e r = c T = 200 ° C T = 650 ° C F I D s e t 1 d T T = 200 ° C T = 650 ° C F I D s a n d d T m a s s s e t 1 ,
where FIDset1 and FIDsand correspond to the FID signals of a sample containing both sand and polymer (set 1) and of a sample containing only sand, respectively. Additionally, c is a constant that converts the FID signal. For low masses, the FID signal may not be strictly proportional to the polymer mass, resulting in a slightly varying Total HCpolymer value. Nevertheless, in the following, we assume this parameter to be constant, even for low masses, and present a linear extrapolation procedure that provides an estimation of very small polymer masses.
To achieve this, Total HCpolymer was first determined from the FID signals of the higher mass samples (set 1) by plotting the FID signal as a function of the corresponding mass and applying a linear regression. The polymer mass of low-weight samples (massset2) could then be easily computed from the corresponding FID signals (FIDset2) and the Total HCpolymer parameter, as follows:
m a s s s e t 2 = c T = 200 ° C T = 650 ° C F I D s e t 2 d T T = 200 ° C T = 650 ° C F I D s a n d d T T o t a l   H C p o l y m e r .

3. Results and Discussion

In the first part of this section (Section 3.1), we will present and discuss the results obtained for high PE masses (set 1). Based on these results, we will then apply the extrapolation procedure to estimate small PE mass contents (set 2). Finally, we will discuss the limits of detection and quantification. The second part (Section 3.2) deals with the influence of particle polymer size and shape on thermal Rock-Eval® responses.

3.1. Limits of Detection (LOD) and Quantification (LOQ) of Polyethylene (PE) Combining the Thermal Rock-Eval® Method with a Mathematical Extrapolation Procedure

In this study, the limits of detection (LOD) and quantification (LOQ) are considered as the lowest concentration or the smallest amount of a specific PE polymer that can be detected and quantified, respectively, using the thermal Rock-Eval® method combined with a mathematical extrapolation procedure, to overcome limitations in mass balance and non-linear detector responses.
First, to define these limits, Table 3 summarizes the Rock-Eval® parameters obtained for composite samples containing different weighted masses, varying between 0.1 to 2.0 mg of the fine-grained powdered PE, grain size 125 μm, in 60 mg of sand (set 1). For clarification, Total CO provides the quantity of carbon monoxide released during both the total pyrolysis and oxidation of the composite sample. Total CO2 provides the quantity of carbon dioxide released during both the total pyrolysis and oxidation of the composite sample. The PC and RC parameters represent the total amounts of carbon content quantified during the pyrolysis and the oxidation, respectively. TOC corresponds here to the sum of both PC and RC ([11]; Table 3).
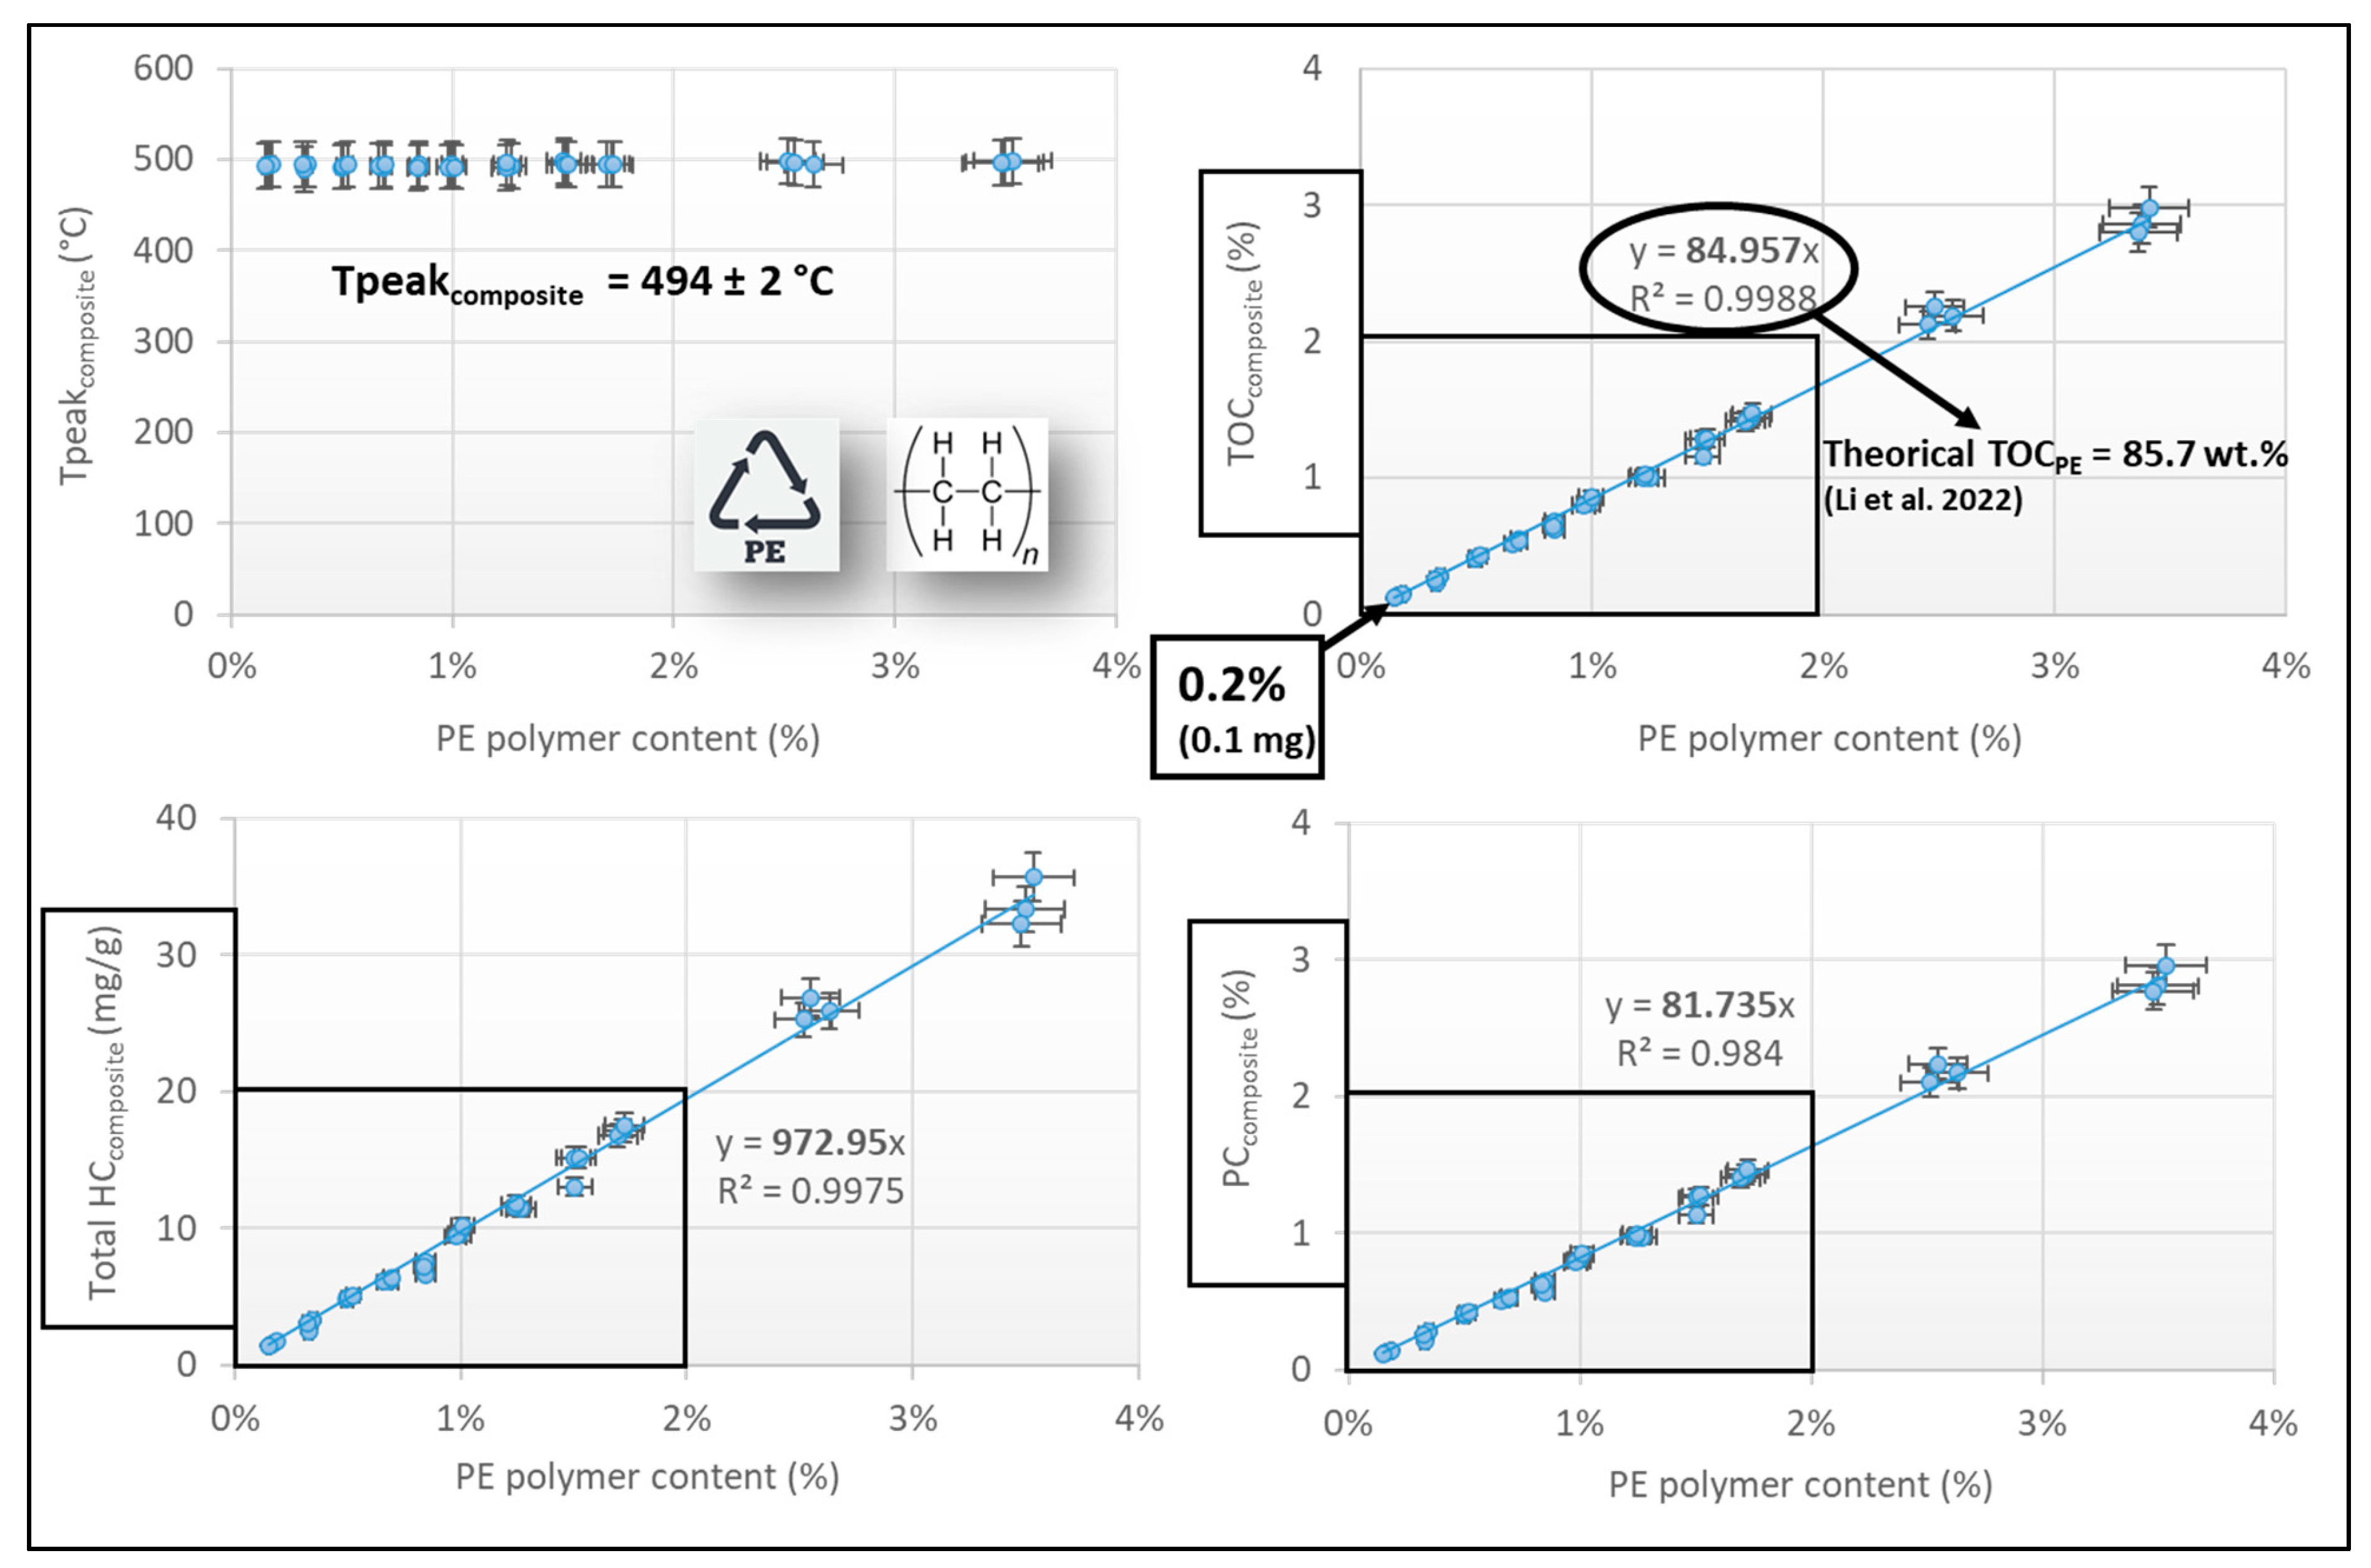
To determine both the instrumental detection and quantification limits of the Rock-Eval® device, Figure 3 illustrates the linear regression curves of the calculated TOCcomposite as well as the Total HCcomposite and PCcomposite parameters for composite samples containing sand mineral matrix mixed with PE at different concentrations. The obtained correlation coefficients are nearly 1, indicating that a linear equation describes the good relationship between these calculated Rock-Eval® parameters of the composite samples and PE polymer contents varying between 0.2 to 3.4 wt.% (0.1 to 2.0 mg absolute polymer mass in crucible; Figure 3; Table 3). Furthermore, the results confirm that the slope of the linear regression curve of the calculated TOC for the composite samples is also consistent with the theorical TOC calculated for the PE polymers (around 85 wt.% [16]; Figure 3). The results indicate that for a given polymer, in this case polyethylene (PE), mainly mixed with sand mineral matrix, the polymer concentration for an artificial or natural sample can be quickly quantified using the obtained Rock-Eval® parameters (Total HC, PC, and TOC, Figure 3) and the corresponding linear regressions of the composite sample when dealing with higher polymer mass (in the microgram range of > 0.1 mg). Figure 3 also shows that the Tpeak parameter does not change as a function of increasing PE concentration in the artificial sediment. These composite samples show an average Tpeak of 494 ± 2 °C, indicating that this parameter can be considered as a useful characteristic of polymer type in environmental samples, especially those dominated by sand mineral matrices and PE contents (Figure 3). However, different polymer types degrade at very similar temperatures [25] and should be expected to provide similar Tpeak values. Thus, more work is still needed to propose an advanced method for a correct differentiation of polymer microplastic mixtures as a function of the type of polymer (PE, PP, PET, etc.).
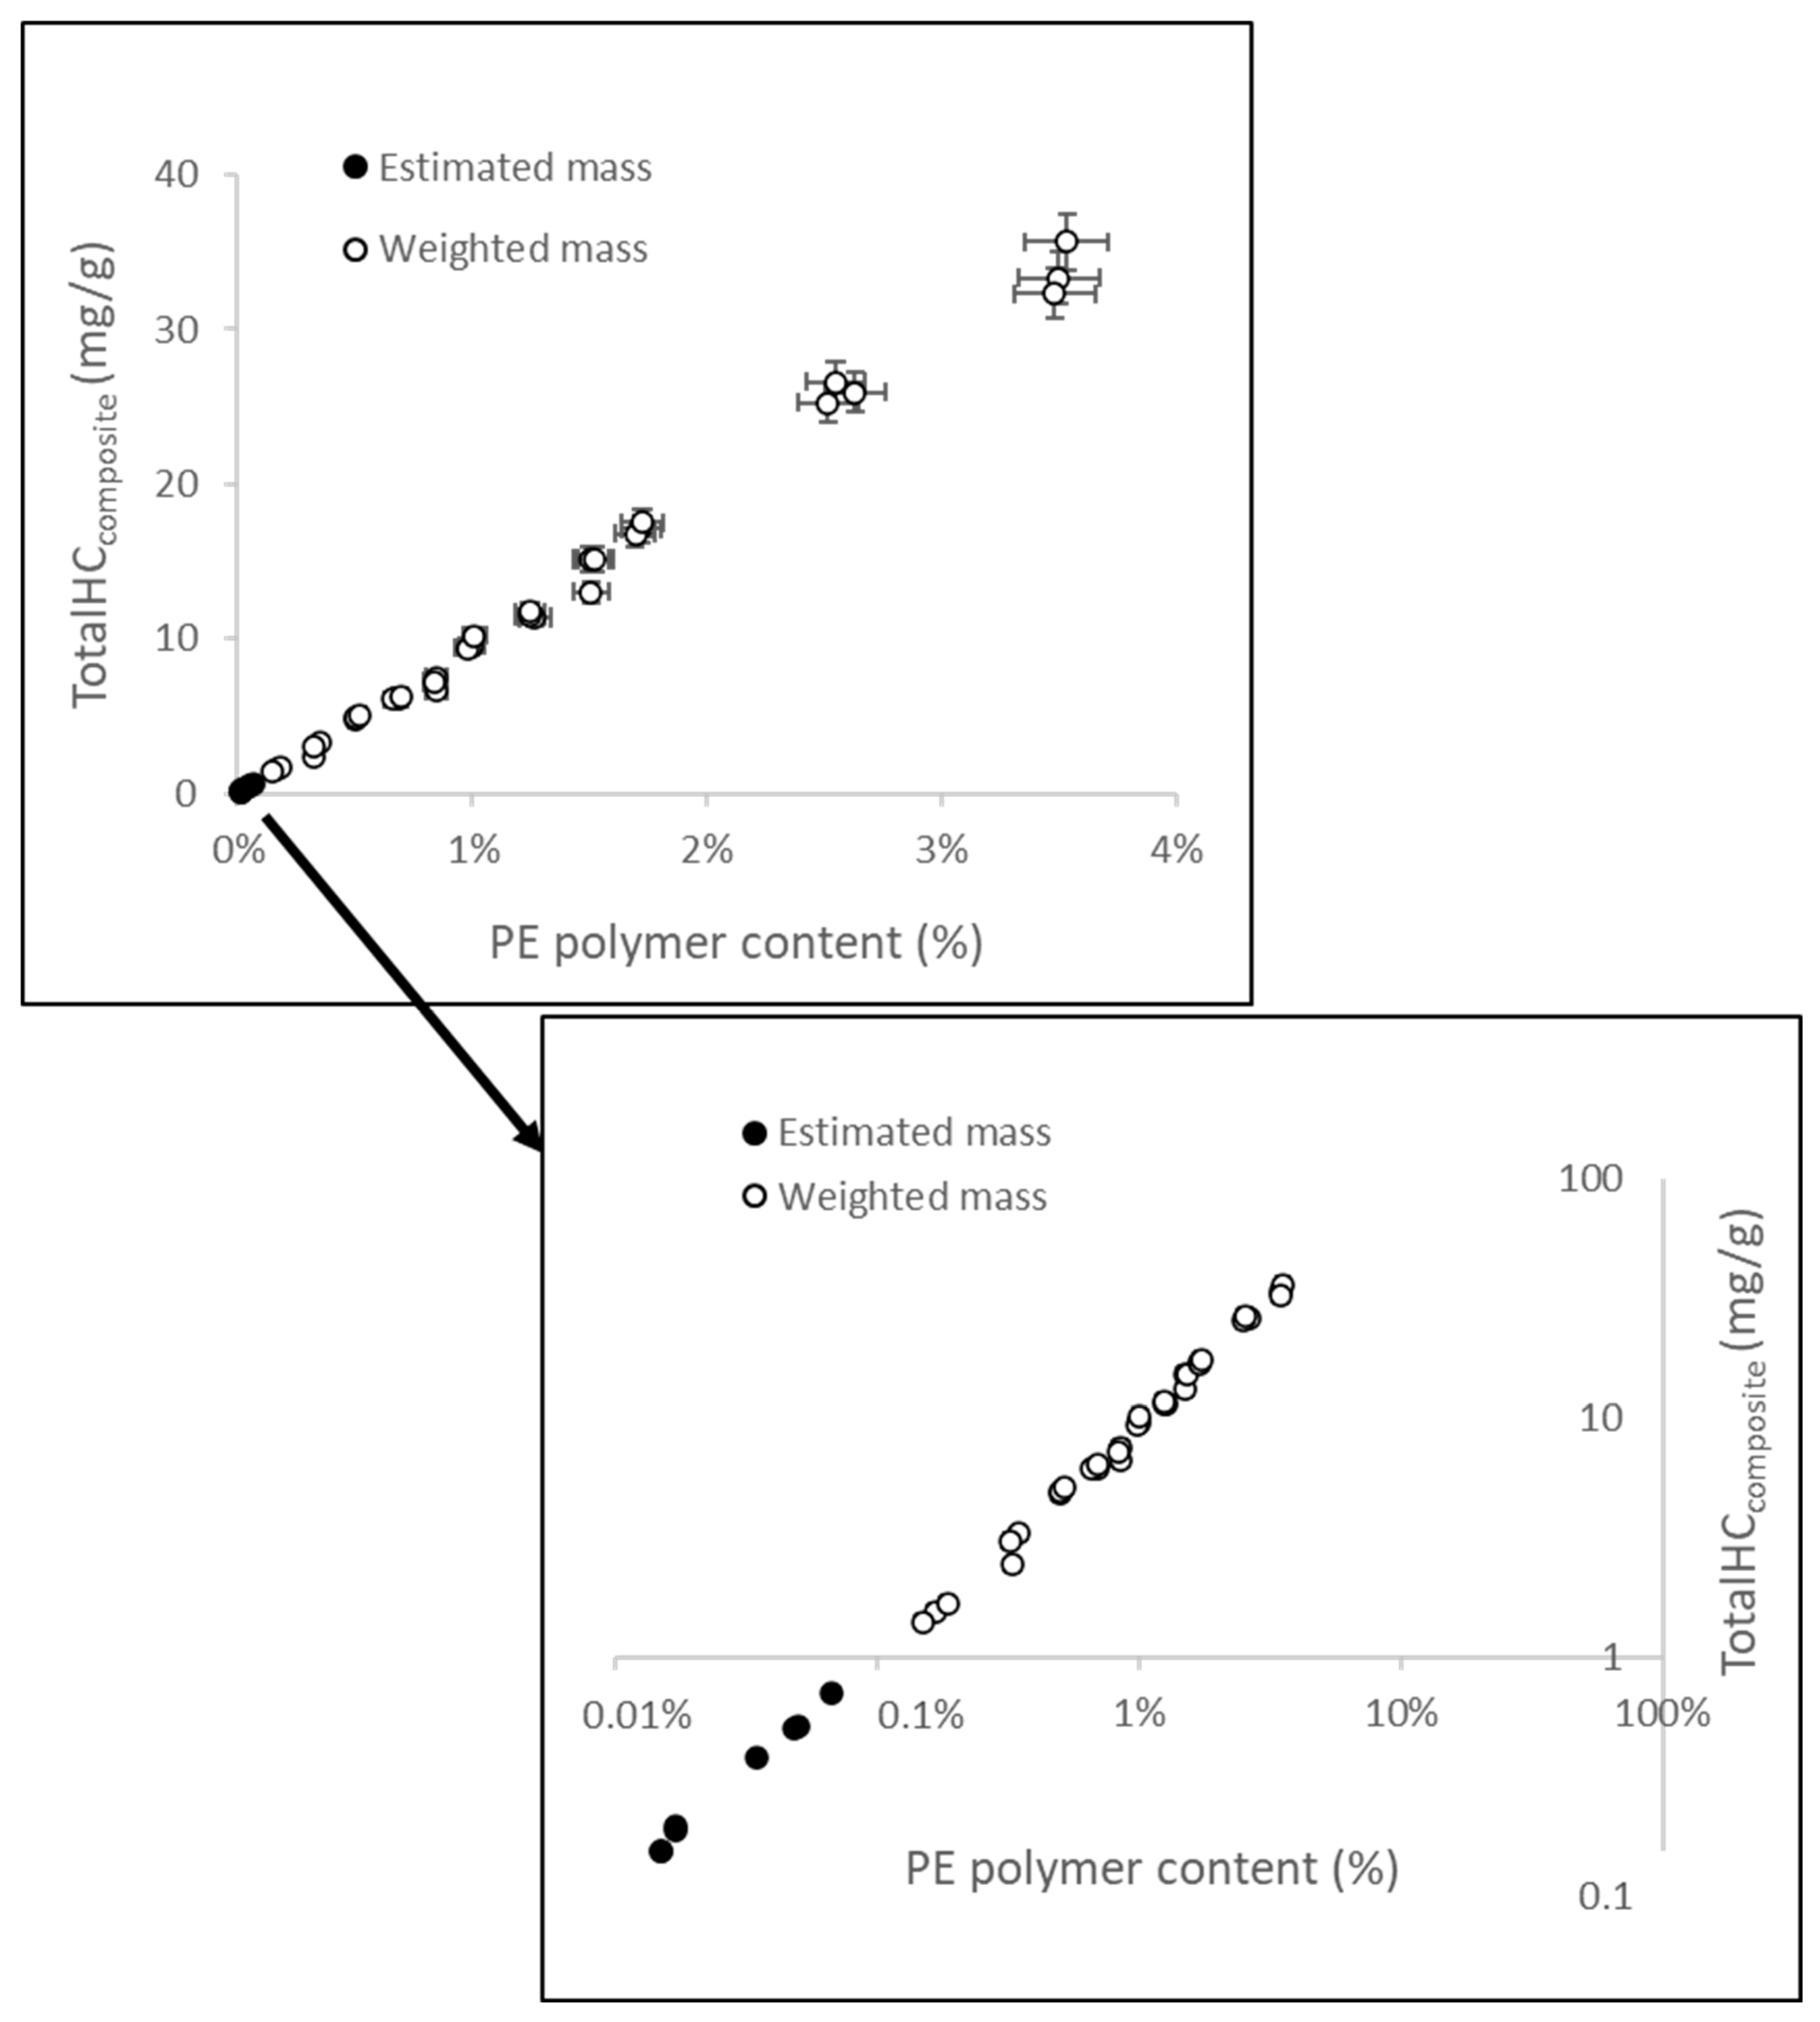
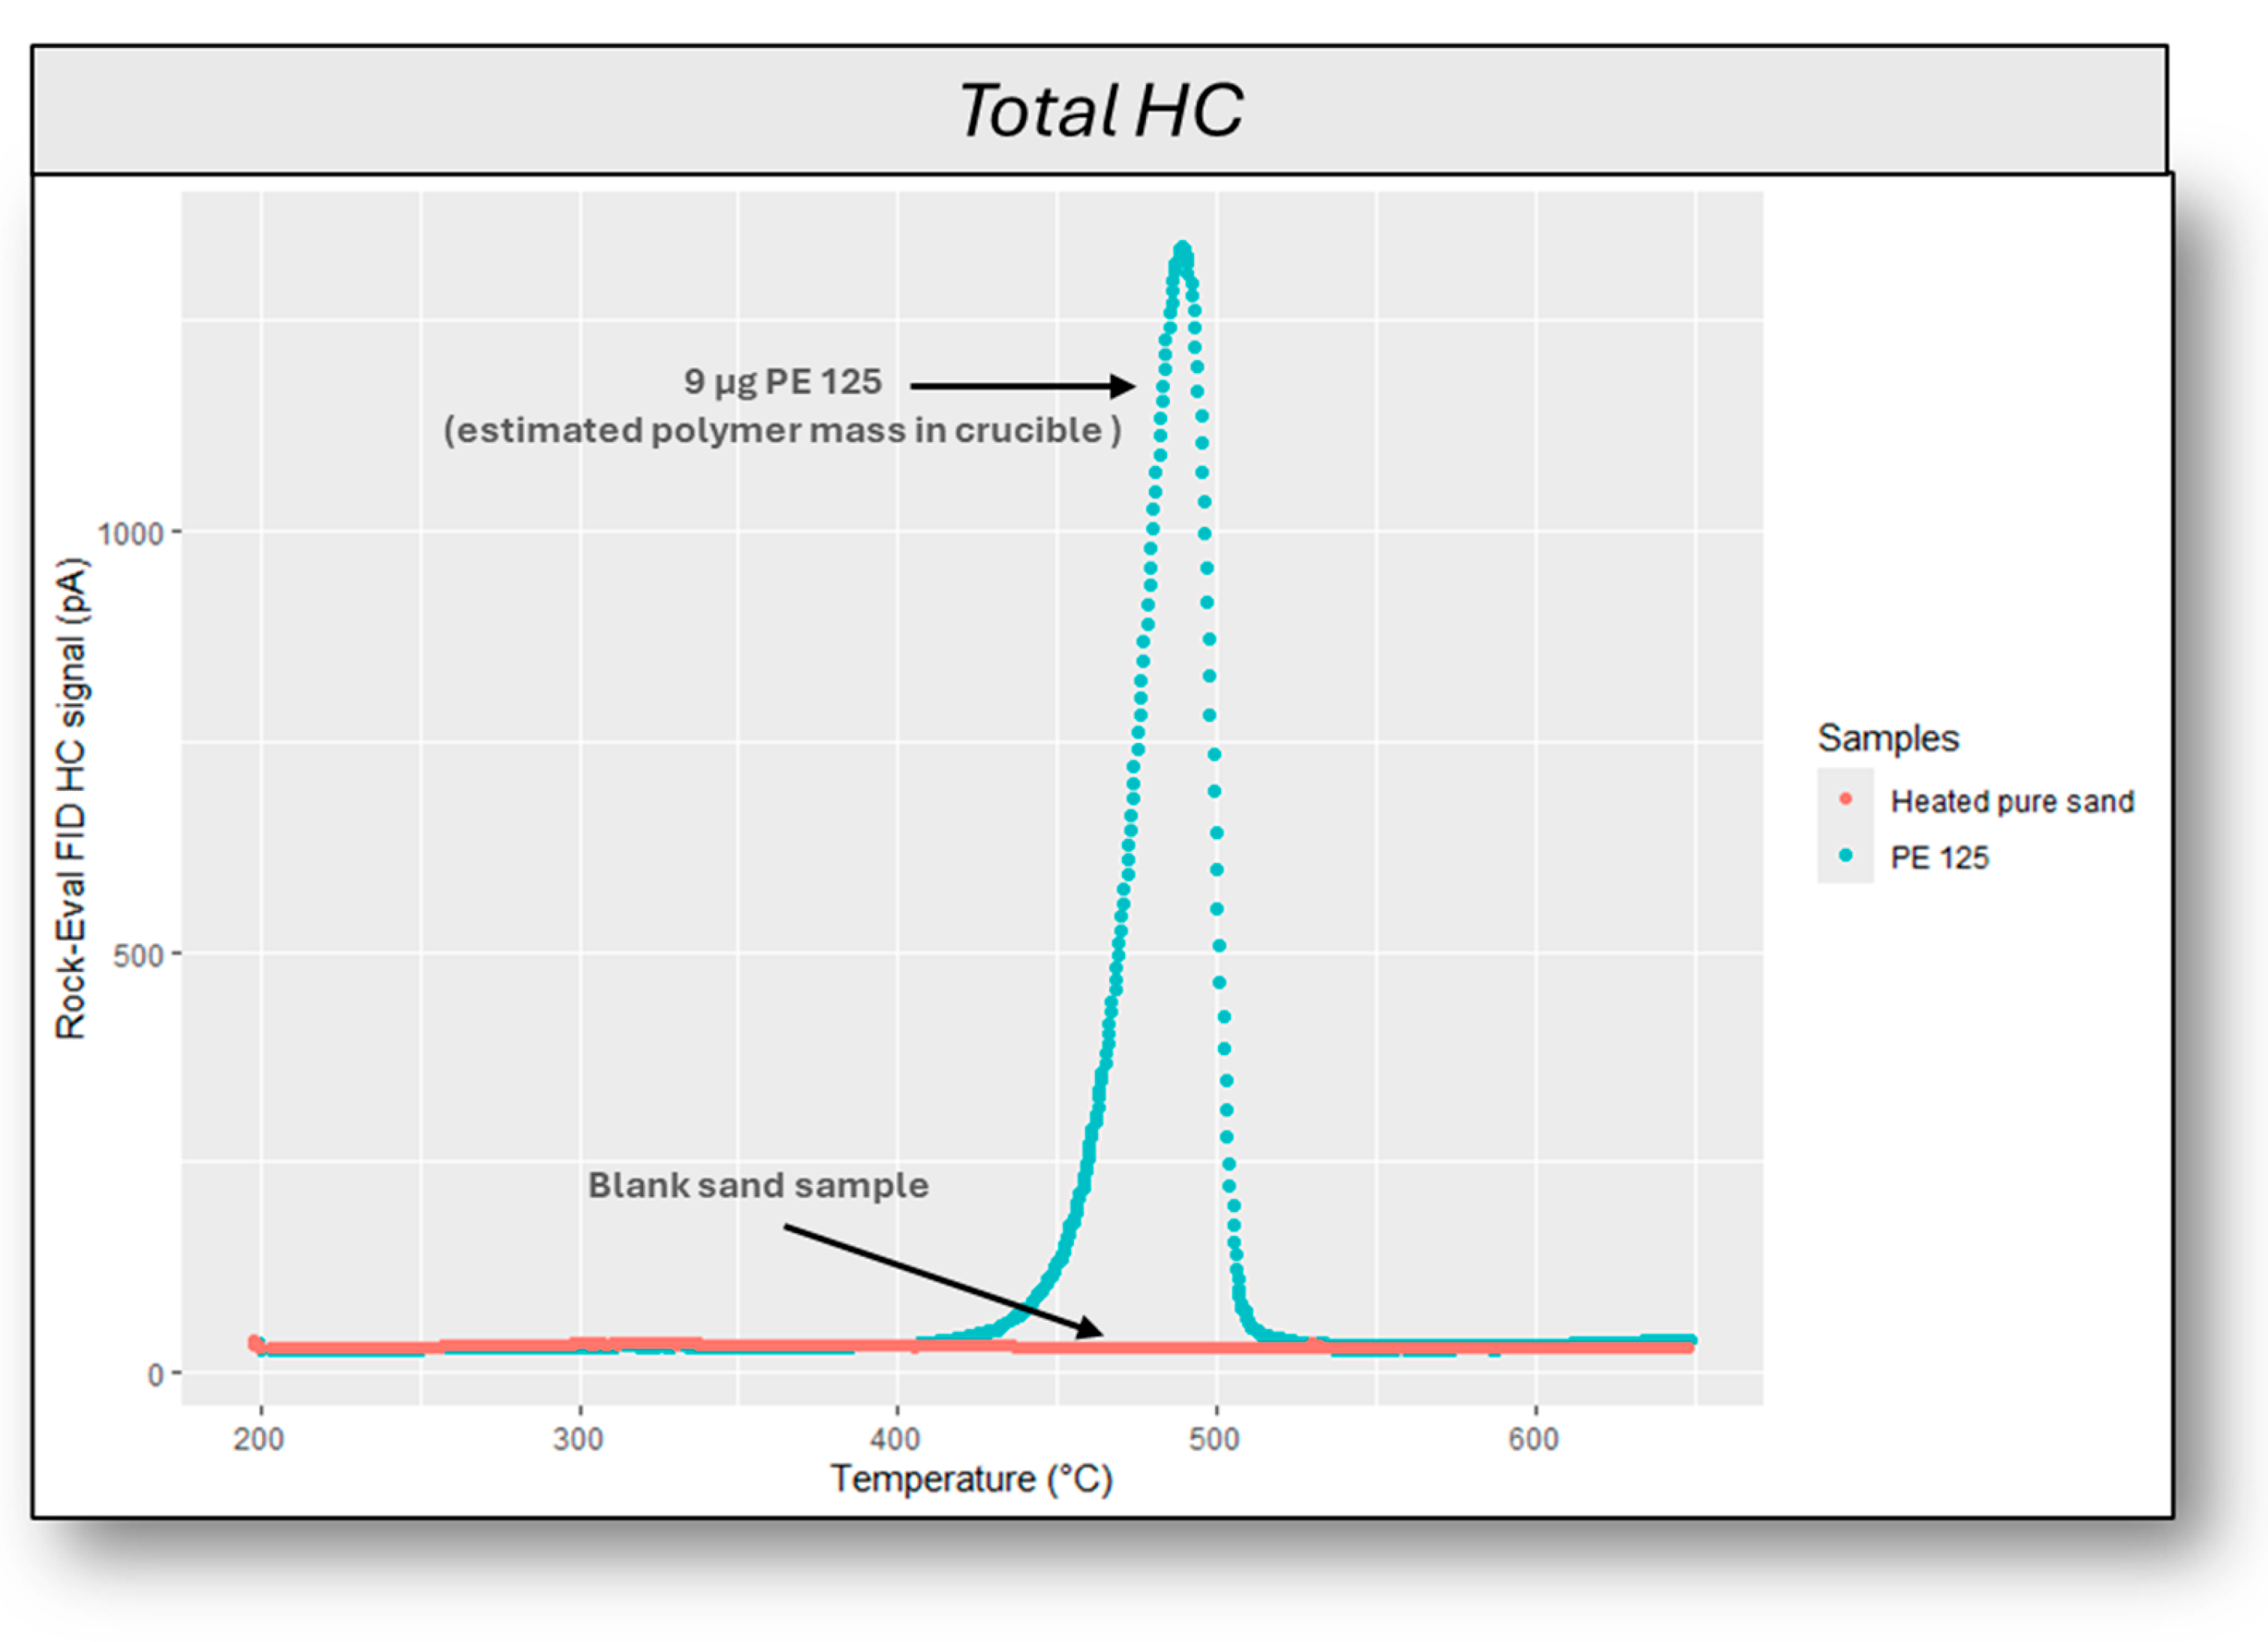
As mentioned above, the linearity of the Total HCcomposite parameter for PE is confirmed for high mass samples (>0.1 mg). We therefore calculated Total HCpolymer for set 1 and applied the extrapolation procedure to low-mass PE samples (set 2). Figure 4 shows the obtained Total HCcomposite parameter in composite samples as a function of the PE polymer content for weighted masses (set 1, empty circles) and low estimated masses (set 2, black circles). Figure 4 also illustrates that the estimated masses preserve the linearity of the Total HCcomposite parameter, and polymer concentrations down to 0.015% can be detected. The analytical validity of this result is confirmed by the thermal Rock-Eval® FID HC signal shown in Figure 5, which corresponds to a composite sample with an estimated polymer mass of 9 μg (weighted PE mass of 10 μg) and a blank sand sample. Figure 5 shows that, even for this small polymer mass (9 μg PE estimated mass in crucible), the Rock-Eval® FID HC signal is clearly detectable and higher than that of the blank sample.
Considering this result, we can define properly the limits of blank (LOB), detection (LOD), and quantification (LOQ) of polyethylene (PE) using the thermal Rock-Eval® method, based on signal-to-noise considerations. Using Equation (2), the LOB becomes 1 μg, suggesting that polymer masses below 1 μg in 60 mg of sand (~17 ppm) could not be precisely detected due to the signal noise induced by the sediment matrix. Considering only the standard deviation from the blank sample response (Equation (3)), the LOD becomes 1.7 µg (absolute polymer mass in crucible). This value is slightly higher when including the dispersion of the data points at low concentrations (Equation (4)). In this case, we obtain an LOD value for the fine-grained powdered PE, grain size 125 μm, of 2 µg (28–33 ppm). These values align with those reported by Goedecke et al. [6] for TED-GC/MS. Finally, the LOQ ranges from 5 to 6 µg (83–100 ppm). By contrast, this LOQ value is higher than the one proposed by Goedecke et al. [6], who assumed that LOQ = 2LOD, resulting in very low LOQ values. However, our conservative LOQ value is supported by the thermal Rock-Eval® HC signal shown in Figure 5, which has an estimated mass of 9 µg. As illustrated in Figure 5, the signal from the sample containing PE is significantly higher than that from the blank sand sample, confirming an LOQ of around 5 to 6 µg.
As mentioned before, LOD and LOQ can be computed from the blank sand sample (Equations (3) and (5)). However, even for this organic and polymer-free sample, there is still a very slight FID signal, independent of the temperature, corresponding to the background noise. However, at this point, we cannot state whether the background noise is influenced by the mass of the blank sample. LOD and LOQ are probably more instrument-dependent than sample-dependent, but a clear statement requires further experiments. However, we suppose that different types of polymers having the same amount of carbon as 1.7 μg of PE could be also detected in 60 mg of sample in a crucible.

3.2. Influences of Particle Polymer Size and Shape on the Thermal Rock-Eval® Responses

Based on the pure PE polymer results, Figure 6 illustrates the distribution of the Total HCpolymer and Tpeakpolymer parameters as a function of PE polymer particle size and shape. In general, all PE sizes and shapes, except for the foam and the nanoparticles, show the same thermal degradation stability, illustrated by an average Tpeakpolymer of 495 ± 6 °C (Figure 6). However, a slightly increased dispersion of the Total HCpolymer parameter is mainly observed for the fine-grained powdered PE samples (Figure 6). These results probably suggest that these fine-grained PE particles are more volatile during thermal degradation of the polymer. By contrast, the thermal Rock-Eval® responses for the microsphere (pellets), fiber, and film PE samples are less dispersed, suggesting that these bigger PE particles are probably more resistant to thermal degradation. Nevertheless, a high dispersion of these Total HCpolymer and Tpeakpolymer parameters is also observed for bigger foam and fragment PE shapes (Figure 6). At this point, it should be mentioned that sample preparation procedures might also influence the results. Triplicate composite samples prepared using fine-grained powdered PE particles or foam and fragments might be less homogeneous than triplicate samples prepared using bigger PE particles such as pellets or film. This could probably induce a dispersion of the Rock-Eval® results and enlarge the standard deviation. In addition, it is important to note that the fragment and foam samples also contained colorant additives, as is illustrated in Figure 2. In the plastic industry, additives are commonly used to modify or improve both the chemical and physical properties of polymers ([26] and references therein). Plasticizers, flame retardants, antioxidants, acid scavengers, light and heat stabilizers, lubricants, pigments, antistatic agents, slip compounds, and thermal stabilizers are the most used additives in polymeric materials ([27] and references therein). Even if these additives are usually present in small amounts compared to the polymeric bulk, they could probably participate in some additional chemical reactions during the polymer’s thermal degradation, also inducing this dispersion in Rock-Eval® results. For instance, the investigated foam and fragment PE samples probably contained pigment agents (black and red colorants, respectively; Figure 2), which could generate some chemical reactions during both the pyrolysis and oxidation stages. The differences in the Tpeakpolymer values of the foam and nanoparticles can probably also be explained by chemical additives. Particularly, the production process of PE nanoparticles in a colloidal solution requires a precursor, which might modify Tpeakpolymer. However, this hypothesis cannot be confirmed because the exact additive composition was not available for the commercial PE samples nor for the PE nanoparticles provided by the Laboratory of Catalysis, Polymerisation, Process and Materials (Table 2). Unfortunately, no chemical reactions can be provided here to support this assumption. Nevertheless, in this study, it was possible to detect PE nanoparticles of 79 nm in size, which were much smaller than those detected by Kaile et al. ([10]; Table 1).
In summary, our results show that the size and shape of PE particles are not key factors in the Rock-Eval® method since thermal degradation is independent of size and shape. As shown above (Figure 6), the Rock-Eval® parameters are very similar for PE particles of different sizes (PE125, PE110, and PE 34–50) and shapes (PE film, fiber, and sphere). However, samples containing chemical additives (e.g., fragment, foam, and nano PE) show slightly different Rock-Eval® parameter values and larger dispersions. These results suggest that the influence of chemical additives on Rock-Eval® parameters is much more significant than that of particle size and shape. Additional work is still necessary to evaluate the effect of chemical additives as well as other polymer properties, like crystallinity and composition (type), on Rock-Eval® parameters.
Furthermore, we examined the influence of particle size and shape on the detection and quantification limits of the thermal Rock-Eval® method. Based on the previously mentioned definition of LOD (Equation (4)) and the Total HCpolymer variability shown in Figure 6, we can conclude that, except for foam and fragments, the LOD for all samples is slightly below 2 µg, as the dispersion of Total HCpolymer values is even lower for these samples than for fine-grained powdered PE with a grain size of 125 µm. However, the higher dispersion of Total HCpolymer values in foam and fragments leads to a slightly higher LOD for these samples, according to Equation (3). Based on the definition of LOQ (Equation (5)), the LOQ remains independent of the nature of the sample. Considering the above-mentioned dispersion of Total HCpolymer values due to the presence of unknown chemical additives, we propose in this study a conservative LOQ definition based on a large signal-to-noise ratio.
Finally, for all PE polymer sizes and shapes, the obtained results confirm a good correlation between the TotalHCcomposite parameter and the estimated PE mass (Figure 7A). Applying the extrapolation procedure also revealed a strong correlation between the weighted and estimated PE masses of these investigated samples (Figure 7B). This confirms that the mathematical procedure can be used with low-weight PE samples of different shapes.

4. Conclusions

The limits of detection (LOD) and quantification (LOQ) of a polyethylene polymer in 60 mg of artificial sediment sample using the thermal Rock-Eval® device were determined to be around 1.7–2 μg (28 to 33 ppm) and 5 to 6 μg (83–100 ppm), respectively. For any size or shape of the investigated PE polymers, the obtained Rock-Eval® detection and quantification limits were relatively similar. Nevertheless, the results suggest that the LOD is more affected by particle polymer size and shape than the LOQ. An increasing dispersion of Rock-Eval® parameters (Total HCpolymer and Tpeakpolymer) as a function of both polymer particle size and shape was observed, indicating that these parameters are also affected by both polymer grain size and shape. Additives present in polymeric materials could also interact during the thermal degradation of polyethylene microplastics. This study provides specific Rock-Eval® parameters (e.g., Total HC), linear regressions, and a mathematical extrapolation procedure that can be now used to quantify PE micro- to nanoplastic contents (very small PE masses) in environmental samples, especially those dominated by sand mineral matrices. To conclude, for environmental samples, it should be noted that applying preconcentration, filtration, and/or separation steps that enable a several orders of magnitude increase in microplastic concentration, the LOD/LOQ, when expressed relative to the total sampled mass, could consequently be reduced by the same order of magnitude.

Author Contributions

Conceptualization, M.-F.R.-S., D.B. and S.R.; methodology, M.-F.R.-S. and D.B.; formal analysis, M.-F.R.-S. and D.B.; investigation, M.-F.R.-S. and D.B.; data curation, M.-F.R.-S. and D.B.; writing—original draft preparation, M.-F.R.-S.; writing—review and editing, M.-F.R.-S., D.B. and S.R.; project administration, S.R. All authors have read and agreed to the published version of the manuscript.

Funding

This research received no external funding.

Institutional Review Board Statement

Not applicable.

Informed Consent Statement

Not applicable.

Data Availability Statement

Data are contained within the article.

Acknowledgments

IFPEN technical staff Herman Ravelojaona, Melissa Tellez, and Wenda Dherbois are acknowledged for technical assistance. We thank Léa Jacquin, Fabrice Brunel, and Vincent Monteil from the Laboratory of Catalysis, Polymerisation, Process and Materials (CP2M, Lyon–France) for providing the nano PE sample investigated in this study. We also thank our IFPEN colleagues Isabelle Henaut and Viviane Tran for interesting technical discussions. Two anonymous reviewers are acknowledged for useful and constructive comments on the manuscript.

Conflicts of Interest

The authors declare no conflicts of interest.

Abbreviations

The following abbreviations are used in this manuscript:
LODLimit of detection
LOQLimit of quantification
PEPolyethylene
PETPolyethylene terephthalate
FTIRFourier transform infrared spectroscopy
TED-GC/MSThermal extraction desorption-gas chromatography/mass spectrometry
Py-GC-MSPyrolysis–gas chromatography–mass spectrometry
UHPLCUltrahigh-performance liquid chromatography
NMRNuclear magnetic resonance
FIDFlame ionization detector
IRInfrared detector
BPCBulk polymer content
HCHydrocarbons

References

  1. Leslie, H.A.; van Velzen, M.J.M.; Brandsma, S.H.; Vethaak, A.D.; Garcia-Vallejo, J.J.; Lamoree, M.H. Discovery and quantification of plastic particle polution in human blood. Environ. Int. 2022, 163, 107199. [Google Scholar] [CrossRef]
  2. Jamieson, A.J.; Brooks, L.S.R.; Reid, W.D.K.; Piertney, S.B.; Narayanaswamy, B.E.; Linley, T.D. Microplastics and synthetic particles ingested by deep-sea amphipods in six of the deepest marine ecosystems on Earth. R. Soc. Open Sci. 2019, 6, 180667. [Google Scholar] [CrossRef]
  3. Allen, S.; Allen, D.; Baladima, F.; Phoenix, V.R.; Thomas, J.L.; Le Roux, G.; Sonke, J.E. Evidence of free tropospheric and long-range transport of microplastic at Pic du Midi Observatory. Nat. Commun. 2021, 12, 7242. [Google Scholar] [CrossRef]
  4. Geyer, R.; Jambeck, J.R.; Law, K.L. Production, use, and fate of all plastics ever made. Sci. Adv. 2017, 3, 1700782. [Google Scholar] [CrossRef] [PubMed]
  5. Wang, Z.; Wang, X.; Hu, C.; Ge, T.; Wang, L.; Xing, J.; He, X.; Zhao, Y. Comparative evaluation of analytical techniques for quantifying and characterizing polyethylene microplastics in farmland soil samples. Agriculture 2024, 14, 554. [Google Scholar] [CrossRef]
  6. Goedecke, C.; Eisentraut, P.; Altmann, K.; Elert, A.M.; Bannick, C.G.; Ricking, M.; Obermaier, N.; Barthel, A.-K.; Schmitt, T.; Jekel, M.; et al. Development of a routine screening method for the microplastic mass content in a wastewater treatment plant effluent. Front. Environ. Chem. 2022, 3, 844633. [Google Scholar] [CrossRef]
  7. Santos, L.H.M.L.M.; Insa, S.; Arxé, M.; Buttiglieri, G.; Rodríguez-Mozaz, S.; Barceló, D. Analysis of microplastics in the environment: Identification and quantification of trace levels of common types of plastic polymers using pyrolysis-GC/MS. MethodsX 2023, 10, 102143. [Google Scholar] [CrossRef]
  8. Ling, Y.; Bi, J.; Yong, W.; Yao, M.; Zhang, Y.; Zhang, F. Simultaneous determination of eight additives in polyethylene food contact materials by ultrahigh-performance liquid chromatography. Se Pu= Chin. J. Chromatogr. 2021, 39, 488–493. [Google Scholar] [CrossRef]
  9. Peez, N.; Janiska, M.C.; Imhof, W. The first application of quantitative 1H NMR spectroscopy as a simple and fast method of identification and quantification of microplastic particles (PE, PET, and PS). Anal. Bioanal. Chem. 2019, 411, 823–833. [Google Scholar] [CrossRef]
  10. Kaile, N.; Lindivat, M.; Elio, J.; Thuestad, G.; Crowley, Q.G.; Hoell, I.A. Preliminary results from detection of microplastics in liquid samples using flow cytometry. Front. Mar. Sci. 2020, 7, 552688. [Google Scholar] [CrossRef]
  11. Romero-Sarmiento, M.-F.; Ravelojaona, H.; Pillot, D.; Rohais, S. Polymer quantification using the Rock-Eval® device for identification of plastics in sediments. Sci. Total Environ. 2022, 807, 151068. [Google Scholar] [CrossRef] [PubMed]
  12. Romero-Sarmiento, M.-F.; Rohais, S.; Dreillard, M. Quantification of textile microfibers from laundry wastewater using the Rock-Eval® device: Difference between natural and synthetic microfiber origin. Sci. Total Environ. 2024, 956, 177335. [Google Scholar] [CrossRef] [PubMed]
  13. Ricard, C.; Baudin, F.; Romero-Sarmiento, M.-F.; Bouton, N.; Copard, Y.; Friceau, L.; Lieunard, V.; Ludwig, W.; Rohais, S. The effect of the mineral matrix during thermal analysis of polymers: Implications for microplastics characterization. J. Anal. Appl. Pyrolysis 2025, 191, 107219. [Google Scholar] [CrossRef]
  14. Harris, P.T. The fate of microplastic in marine sedimentary environments: A review and synthesis. Mar. Pollut. Bull. 2020, 158, 111398. [Google Scholar] [CrossRef]
  15. Leusch, F.D.L.; Ziajahromi, S. Converting mg/L to particles/L: Reconciling the occurrence and toxicity literature on microplastics. Environ. Sci. Technol. 2021, 55, 11470–11472. [Google Scholar] [CrossRef]
  16. Li, P.; Lai, Y.; Li, Q.; Dong, L.; Tan, Z.; Yu, S.; Chen, Y.; Sharma, V.K.; Liu, J.; Jiang, G. Total organic carbon as a quantitative index of micro- and nano-plastic pollution. Anal. Chem. 2022, 94, 740–747. [Google Scholar] [CrossRef]
  17. Espitalié, J.; Deroo, G.; Marquis, F. La pyrolyse Rock-Eval et ses applications. Rev. De L’institut Français Du Pétrole 1986, 41, 73–89. [Google Scholar] [CrossRef]
  18. Lafargue, E.; Marquis, F.; Pillot, D. Rock-Eval 6 applications in hydrocarbon exploration, production and soils contamination studies. Oil Gas Sci. Technol. 1998, 53, 421–437. [Google Scholar] [CrossRef]
  19. Behar, F.; Beaumont, V.I.; Penteado, H.L.; De, B. Rock-Eval 6 technology: Performances and developments. Oil Gas Sci. Technol. 2001, 56, 111–134. [Google Scholar] [CrossRef]
  20. Disnar, J.R.; Guillet, B.; Keravis, D.; Di-Giovanni, C.; Sebag, D. Soil organic matter (SOM) characterization by Rock-Eval pyrolysis: Scope and limitations. Org. Geochem. 2003, 34, 327–343. [Google Scholar] [CrossRef]
  21. NCCLS. NCCLS Protocols for Determination of Limits of Detection and Limits of Quantitation: Approved Guideline; NCCLS Document EP17-A; NCCLS: Wayne, PA, USA, 2004; ISBN 1-56238-551-8. [Google Scholar]
  22. Currie, L.A. Detection and quantification limits: Basic concepts, international harmonization, and outstanding (“low-level”) issues. Appl. Radiat. Isot. 2004, 61, 145–149. [Google Scholar] [CrossRef]
  23. Armbruster, D.A.; Try, P. Limit of blank, limit of detection and limit of quantitation. Clin. Biochem. Rev. 2008, 29, S49–S52. [Google Scholar]
  24. Shrivastava, A.; Gupta, V.B. Methods for the determination of limit of detection and limit of quantitation of the analytical methods. Chron. Young Sci. 2011, 2, 21–25. [Google Scholar] [CrossRef]
  25. Tsuge, S.; Ohtani, H.; Watanabe, C. Pyrolysis-GC/MS Data Book of Synthetic Polymers: Pyrograms, Thermograms and MS of Pyrolyzates; Elsevier Book: Amsterdam, The Netherlands, 2011; ISBN 9780444538932. [Google Scholar]
  26. Costa, J.P.; Avellan, A.; Mouneyrac, C.; Duerte, A.; Rocha-Santos, T. Plastic additives and microplastics as emerging contaminants: Mechanisms and analytical assessment. TrAC Trends Anal. Chem. 2023, 158, 116898. [Google Scholar] [CrossRef]
  27. Hahladakis, J.N.; Velis, C.A.; Weber, R.; Iacovidou, E.; Purnell, P. An overview of chemical additives presents in plastics: Migration, release, fate and environmental impact during their use, disposal and recycling. J. Hazard. Mater. 2018, 344, 179–199. [Google Scholar] [CrossRef]
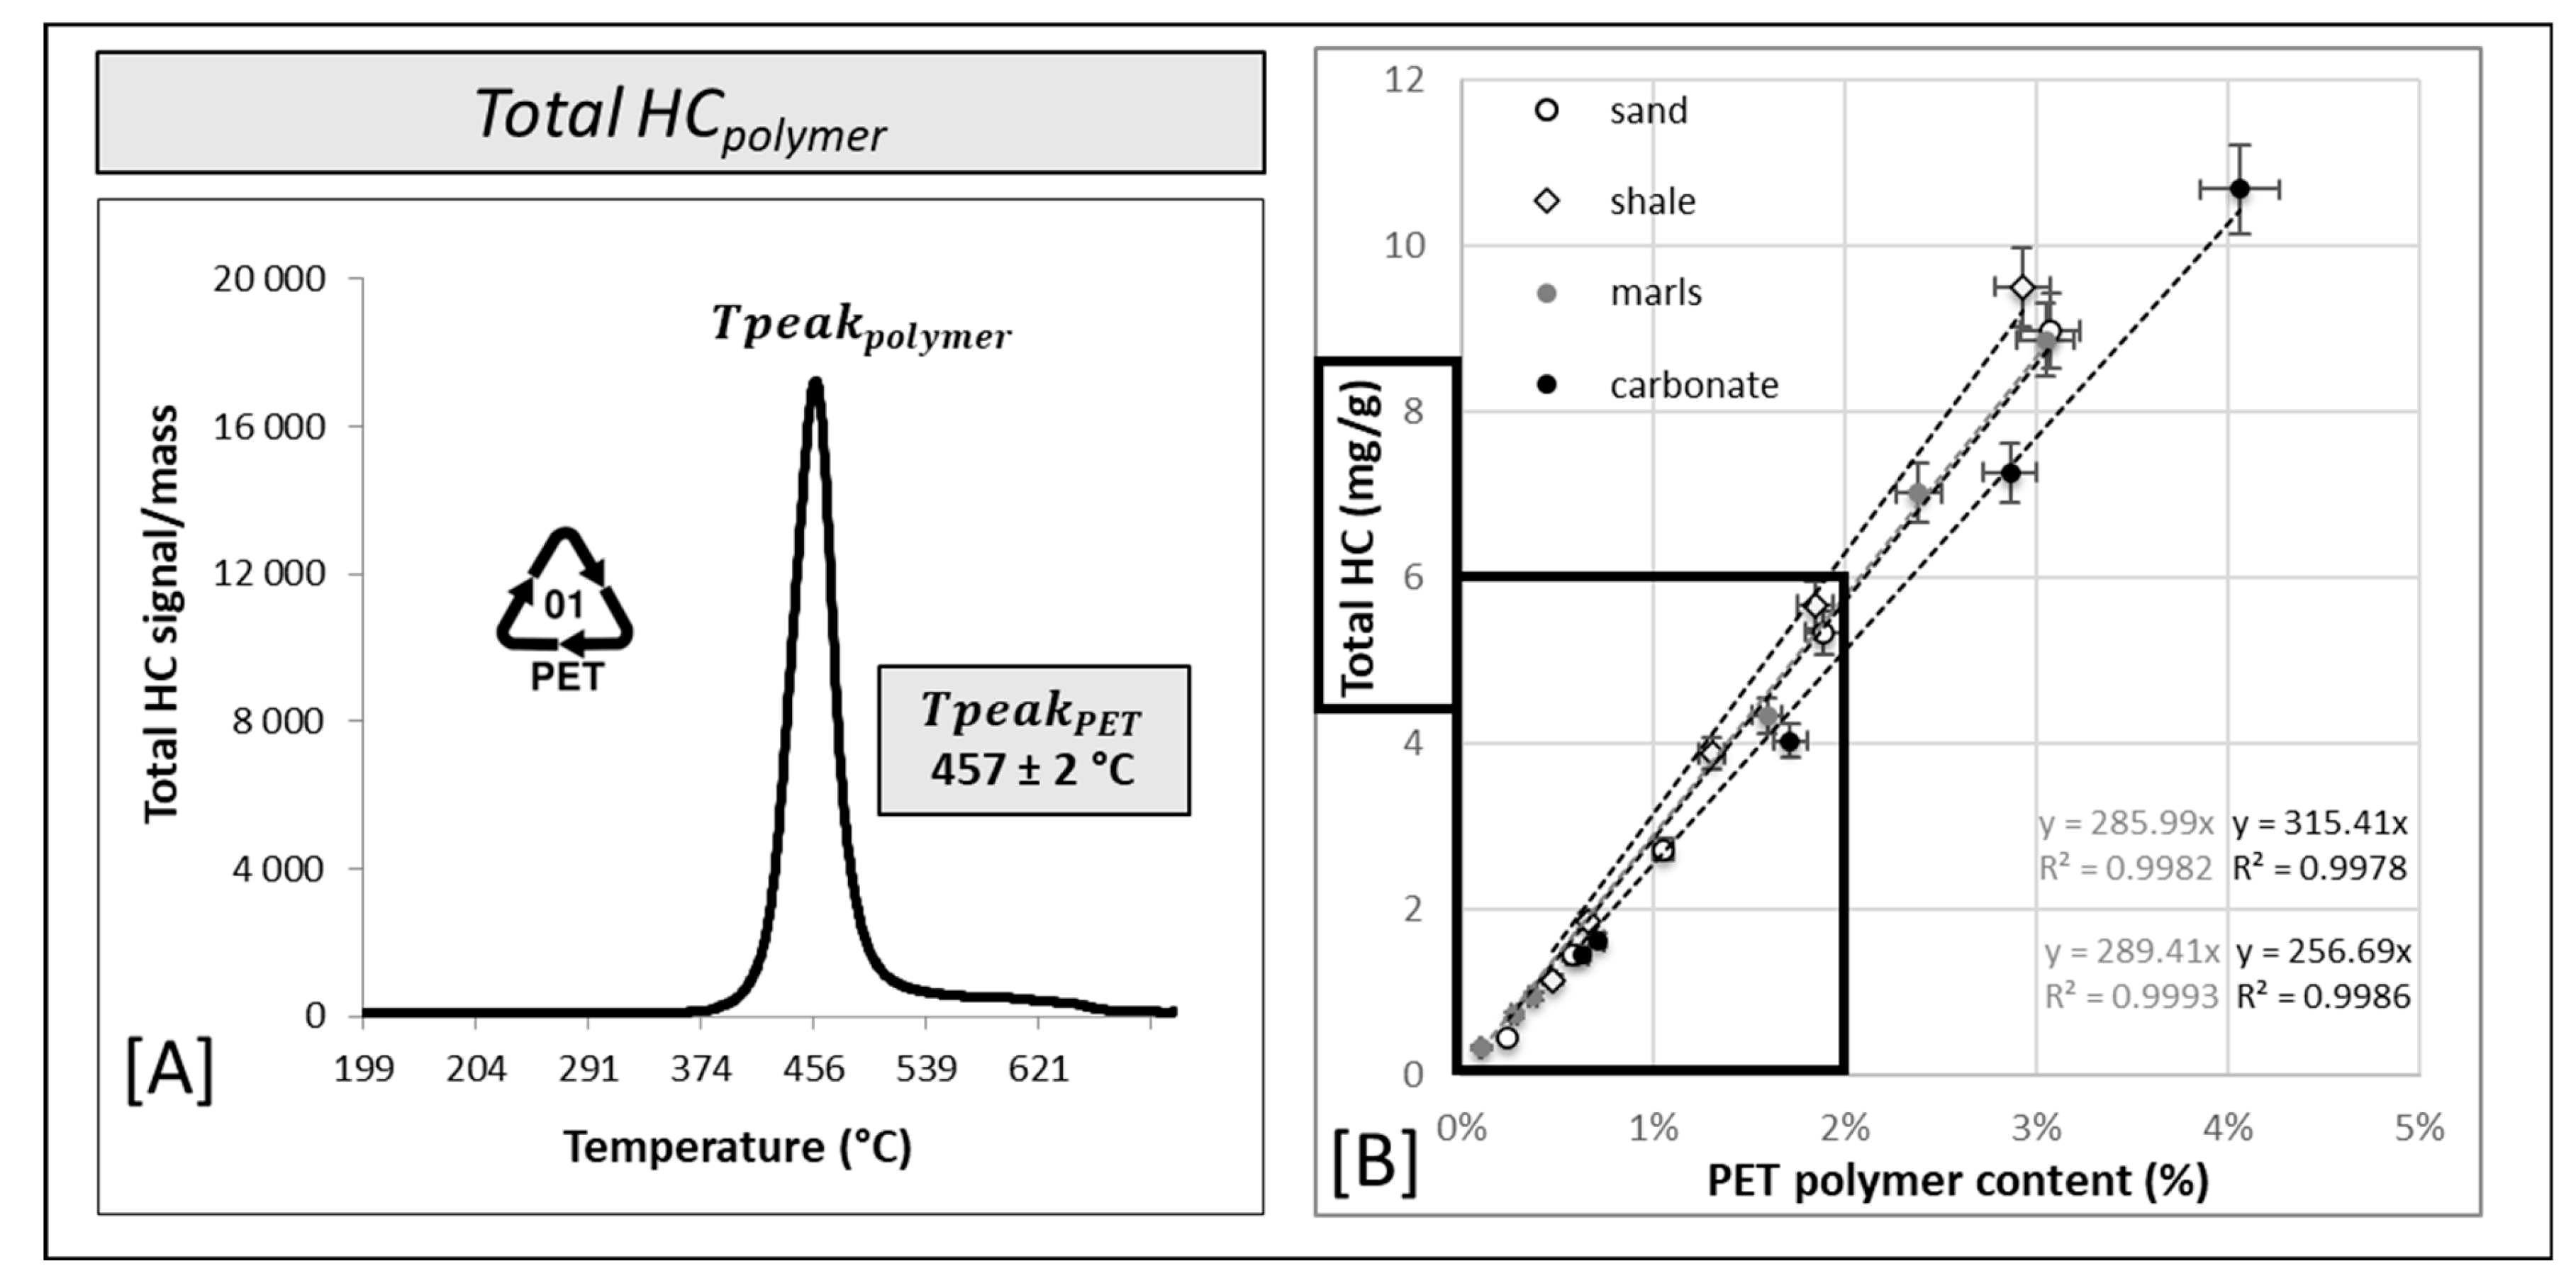
Figure 1. (A) Pyrolysis thermogram showing the Rock-Eval® Total HC and Tpeak parameters that are now used to characterize polymer samples (modified from [11,12]). (B) The Rock-Eval® Total HC parameter versus the PET polymer content, showing linear regressions that can be used to quantify the polymer content in composite samples containing different mineral matrices (e.g., sand, shale, marl, and carbonate, modified from [11]).
Microplastics 04 00071 g001
Figure 2. Examples of polymer grain sizes and shapes of selected PE samples: (A) fine-grained powdered PE, grain size 125 μm (reference 434264); (B) PE sphere (pellet–reference 428078), (C) PE fiber (reference GF40985017); (D) High-density polyethylene (HDPE) film, plastic bag packaging (reference 102.813.54); (E) PE foam, camping mattress (reference 1766-195); and (F) HDPE fragment, red bottle cap (reference “Montagne, Repère brand”).
Microplastics 04 00071 g002
Figure 3. Rock-Eval® Tpeakcomposite, TOCcomposite, Total HCcomposite, and PCcomposite parameters for the composite samples as a function of different PE concentrations (set 1). The obtained linear regressions between TOCcomposite, Total HCcomposite, and PCcomposite can be used to calculate the PE polymer content in composite samples containing sand mineral matrix mixed with the fine-grained powdered PE polymer, grain size 125 μm. The theorical total organic carbon (TOC) content of the PE is around 85.7 wt.% [16].
Microplastics 04 00071 g003
Figure 4. Obtained TotalHCcomposite parameters in composite samples as a function of PE polymer content for weighted masses (set 1, empty circles) and low estimated masses (set 2, black circles).
Microplastics 04 00071 g004
Figure 5. Comparison of Rock-Eval® FID HC signals for a composite sample containing PE 125 µm (weighted mass 0.01 mg) in 60 mg of sand matrix (blue line) versus the heated pure sand (orange line).
Microplastics 04 00071 g005
Figure 6. Total HCpolymer and Tpeakpolymer parameters as a function of PE polymer particle size and shape. Detailed descriptions of the nine investigated PE samples are available in Table 2.
Microplastics 04 00071 g006
Figure 7. (A) Total HCcomposite parameter versus estimated PE mass for composite samples with different PE polymer grain sizes and shapes. (B) Straight line relationship between weighted and estimated PE masses for composite samples with different PE polymer grain sizes and shapes. Detailed descriptions of the nine investigated PE samples are available in Table 2.
Microplastics 04 00071 g007
Table 1. Detection and quantification limits (LOD and LOQ) for polyethylene using different analytical methods.
Analytical TechniqueLODLOQReference
TED-GC/MS1.6 µg (absolute polymer mass in crucible)3.2 µg[6]
Py-GC/MS9.1 µg27.8 µg[7]
UHPLC0.005%0.02% for additives in PE[8]
NMR Spectroscopy19–21 µg/mL74–85 µg/mL[9]
Flow CytometryThe lowest spatial detectable limit for plastic particles was 200 nm[10]
Table 2. Detailed description of the investigated PE samples.
PE ShapesGrain Size (µm)Molecular Weight (g/mol)Density (g/mL)AdditivesCommercial Reference
Fine-grained powdered PE
(PE 34-50)
34–50467.60.94 at 25 °CNo data available434272
Fine-grained powdered PE
(PE 110)
110No data available0.94 at 25 °CNo data available429015
Fine-grained powdered PE
(PE 125)
125Ultra-high molecular weight0.94 at 25 °CNo data available434264
PE pellet
(PE SPHERE)
>3000872.00.918 at 25 °CNo data available428078
PE fiber
(PE FIBER)
Ø 5–20Ultra-high molecular weight0.94–0.965No data availableGF40985017
High-density PE (HDPE) film
(PE-HD FILM)
500–2000No data available0.94–0.965No data available102.813.54
PE foam, camping mattress
(PE FOAM)
500–2000No data availableRelative 0.03No data available1766-195
HDPE fragment
(PE-HD FRAGMENT)
500–2000No data available0.94–0.965No data availableMontagne, Repère
Nano PE colloidal suspension
(NANOPE)
0.079No data availableNo data availableNo data availableProvided by CP2M, Lyon–France
Table 3. Thermal Rock-Eval® parameters obtained for composite samples containing sand mineral matrix mixed with the fine-grained powdered PE polymer, grain size 125 microns, at different concentrations (set 1). BPC corresponds to the bulk polymer content.
Masspolymer (mg)Masssediment (mg)BPC (%)Total HC (mg/g)Total CO (mg/g)Total CO2 (mg/g)Tpeak (°C)PC (%)RC (%)TOC (%)
0.1060.300.21.540.130.814950.130.010.14
0.1159.490.21.680.100.854950.140.010.15
0.0960.060.21.400.100.644930.120.000.12
0.2160.670.33.270.131.054940.280.010.29
0.2060.970.32.420.362.304890.210.020.23
0.1959.270.33.040.170.454940.260.010.27
0.3060.510.54.780.101.104920.400.010.41
0.3060.030.54.880.080.774930.410.010.42
0.3159.480.55.080.090.824950.420.010.43
0.4159.780.76.130.642.114920.520.030.55
0.4060.760.76.090.301.344930.510.010.52
0.4159.570.76.340.351.404940.530.010.54
0.5059.410.87.560.624.264920.650.030.68
0.5059.430.86.640.713.924940.570.050.62
0.5060.180.87.220.562.064910.620.030.65
0.5959.711.09.560.100.954950.800.010.81
0.5859.831.09.400.231.894920.790.010.80
0.6060.081.010.200.160.584920.850.010.86
0.7559.921.211.401.261.724930.970.031.00
0.7561.131.211.510.572.334910.970.031.00
0.7460.151.211.750.732.054960.990.031.02
0.8960.091.515.160.280.744981.260.011.27
0.8960.051.513.041.395.474941.130.031.16
0.9060.001.515.140.401.834941.270.031.30
1.5359.682.525.930.692.504942.170.022.19
1.4960.722.525.270.281.374982.100.022.12
1.4959.982.526.890.171.224972.240.012.25
1.0159.821.717.100.331.584951.430.011.44
0.9959.411.716.790.381.674951.400.011.42
1.0159.551.717.510.261.524941.460.011.47
2.0259.773.433.351.895.024972.810.052.86
2.0459.783.435.670.180.794992.960.012.97
2.0159.773.432.302.915.744962.770.032.80
Disclaimer/Publisher’s Note: The statements, opinions and data contained in all publications are solely those of the individual author(s) and contributor(s) and not of MDPI and/or the editor(s). MDPI and/or the editor(s) disclaim responsibility for any injury to people or property resulting from any ideas, methods, instructions or products referred to in the content.