Article

Reliable River Microplastic Monitoring Using Innovative Fluorescence Dyes—A Case Study

Wasser 3.0 gGmbH, Neufeldstr. 17a–19a, 76187 Karlsruhe, Germany
*
Author to whom correspondence should be addressed.
Microplastics 2025, 4(3), 63; https://doi.org/10.3390/microplastics4030063
Submission received: 28 July 2025 / Revised: 14 August 2025 / Accepted: 5 September 2025 / Published: 10 September 2025

Abstract

Microplastic (MP) contamination in riverine systems poses a growing environmental challenge, and their spatial and temporal variability complicates proper assessments. This study investigated MP concentrations (≥10 µm) across three German rivers using fluorescent staining-based detection. The results reveal highly heterogeneous distributions ranging from 4 to 1761 MP/L. The Rehbach displayed the highest mean MP concentration (540 ± 476 MP/L), whereas the Alb had the lowest (98 ± 54 MP/L). Long-term monitoring underscored pronounced temporal fluctuations linked to changing inputs, weather events, and hydrodynamics. To capture these fluctuations, monitoring campaigns must consider an appropriate temporal sampling framework. Further, to address detection challenges, the study compared 0.5 L grab sampling with 100 L pump sampling (PSU) and observed that the PSU yielded 4.7 times higher MP concentrations with improved reproducibility (27 ± 25% vs. 49 ± 33%). These results highlight the critical need for standardized protocols and scalable, cost-effective methods for reliable MP quantification and hotspot identification in freshwater environments.

1. Introduction

Microplastics (MPs), defined as plastic particles smaller than 5 mm, have emerged as ubiquitous pollutants found in all environments, including freshwater ecosystems, where they pose significant ecological and human health risks [1,2]. Rivers act not only as sinks but also as major transport pathways for MPs from terrestrial sources to marine environments, with estimates suggesting that over 2 million metric tons of MPs are conveyed annually [3,4]. Common polymers such as polyethylene (PE), polypropylene (PP), polystyrene (PS), Polyamide (PA), polyvinylchloride (PVC), and polyethylene terephthalate (PET) are frequently detected in river water and sediments [5]. Despite growing concern, the current understanding of MP abundance, distribution, and impact in freshwater systems remains limited [5,6,7]. Knowledge gaps persist regarding the sources, fate, transport processes, and ecological effects of MPs in rivers, particularly in relation to their interactions with biota and co-contaminants such as heavy metals and persistent organic pollutants.
Obtaining reliable and comparable data on microplastic pollution in rivers is crucial, but faces methodological challenges [8,9]. The lack of harmonized sampling and analytical protocols leads to significant variability in reported MP concentrations, making cross-study comparisons difficult. Factors such as particle size distribution, polymer type, and environmental matrix (e.g., water vs. sediment) influence detection procedures and quantification accuracy [10,11]. Visual inspection, while cost-effective, is prone to misidentification, whereas advanced spectroscopic methods like FTIR and Raman spectroscopy offer higher specificity but are time-consuming and expensive [12,13]. The degradation state of MPs in natural environments further complicates analysis, as weathered particles may not match reference spectra used for identification [14,15]. Pyrolysis–gas chromatography/mass spectrometry (Py-GC/MS) enables quantitative analysis of microplastics (MPs) without particle size limitations, offering high sensitivity and reduced sample preparation [16,17]. However, these methods require specialized and expensive equipment, trained personnel, and rigorous quality assurance procedures. This makes extensive measurement campaigns highly expensive.
An alternative for fast and affordable MP detection is fluorescent staining, which was primarily done using the fluorescent dye Nile Red [18]. The biggest drawback of Nile Red staining is the risk of false positives by natural particles and polymers, such as chitin [19]. Further, there are no standardized staining or imaging procedures among studies [20]. Quenching induced by certain polymer types, such as PVC or pigments, can prevent the detection of MP particles [21]. Also, the detection of small MPs was proven to be less reliable [22].
The presented study uses a novel fluorescent dye developed specifically for MP detection [23,24,25]. Based on MP detection using Nile Red, the study is applying newly developed, chemically modified Nile Red derivatives for more reliable MP detection [23,26]. Method validation of this new dye showed reduced risk of false positives and higher recovery rates of MP compared to Nile Red [24,25]. Also, PVC can be detected reliably, and it is hardly detectable by Nile Red staining [25]. In combination with automated fluorescent imaging, it enables fast and cost-effective MP detection [27,28].
Staining of the sample suspended in water showed increased fluorescence intensity compared to organic solvents [23]. Further, it avoids the risk of damaging the polymers by applying organic solvents [18]. The procedure applies a hydrogen peroxide treatment prior to the fluorescence staining to reduce the risk of false positives [24]. The recovery rates for the tested polymers (PE, PP, PA, PES, PVC) ranged from 93% (PP) to 102% (PES) [25]. The natural particles had average recovery rates of 6% (chitin) to 5% (chalk, wood), posing a reduced risk of false positives [25].
Due to optimized hydrogen peroxide treatment and fluorescence staining, a measurement result can be produced in less than 3 h, including a 2 h waiting time and 20–30 min of working time per sample [25]. Further, the method was already applied for long-term sampling at different WWTPs, being able to deliver comparable data and capture temporal variations, with a detection limit of 10 µm particle size [29,30].
As with all analytical methods, the method of sample collection is crucial for reliable MP detection. Water sample collection can be done by grab samples, pump filtration, and net-based sampling [8,11]. Grab samples are the easiest way of sampling; however, the biggest limitation is the small sample volume, which makes them suitable only for heavily contaminated waters and leads to higher uncertainties in the sampling of unevenly distributed MPs [11]. Net-based sampling, such as Manta trawls or Neuston nets, is easy to use and effective for collecting MPs from surface waters but misses smaller particles due to mesh size limitations (typically > 200 µm) [11]. Pump-based sampling allows for more controlled collection across various depths and can incorporate finer filtration (down to 1 µm), making it suitable for detecting smaller MPs, but it involves additional effort compared to the use of nets [8]. The varying sampling, preparation, and detection methods further complicate the comparability of MP studies.
This study applies a novel fluorescent dye-based detection technique to assess MP concentrations in three German rivers. Through spatial and temporal sampling campaigns, MP distribution patterns are evaluated, and the influence of a wastewater treatment plant (WWTP) effluent on riverine MP loads is investigated. Additionally, two sampling strategies—pump filtration and grab sampling—are compared to determine methodological efficiencies.

2. Materials and Methods

2.1. Sampling Sites

The sampling was carried out at the Alb, Queich, and Rehbach rivers in southwest Germany, as well as at the effluent of the municipal WWTP Landau-Mörlheim.
The Queich is a 52 km long tributary of the Rhine in Rhineland-Palatinate, Germany, with a catchment area of 271 km2 [31]. It originates in the Palatinate Forest near Hauenstein at an elevation of 273 m and flows into the Rhine at Germersheim at an elevation of 95 m. The river’s average discharge is 1.67 m3/s, measured at the Siebeldingen water level station [32]. While the upper reaches are in the Palatinate Forest, the middle and lower reaches are surrounded by a mix of urban and agricultural landscapes with towns and villages along their course.
The Alb is a 51 km long tributary of the Rhine in Baden-Württemberg, Germany, with a catchment area of approximately 448 km2. It rises in the Northern Black Forest near Bad Herrenalb at an elevation of 751 m and flows into the Rhine near Eggenstein-Leopoldshafen at 101 m. The average discharge is about 2.4 m3/s [33]. The Alb passes through both forested and densely populated areas, including the cities of Ettlingen and Karlsruhe, where it has been rerouted and renatured multiple times.
The Rehbach is a roughly 29 km long river in Rhineland-Palatinate, Germany, artificially diverted from the Speyerbach at Neustadt an der Weinstrasse, and it flows through the Upper Rhine Plain before joining the Rhine near Ludwigshafen [31]. Along its course, it passes through several towns, villages, agricultural landscapes, and forests.
The Landau-Mörlheim Wastewater Treatment Plant (WWTP) in Germany serves approximately 80,000 population equivalents, treating municipal, industrial, and agricultural wastewater—primarily from viticulture. The facility operates with three main treatment stages: Primary treatment involves mechanical processes such as rakes, a sand trap, and a fat separator to remove coarse solids and floating materials. Secondary treatment uses biological processes, including nitrification and denitrification, to break down organic matter and nitrogen compounds via activated sludge. Tertiary treatment focuses on chemical phosphate elimination, using iron (III) chloride to precipitate phosphates, which are then removed with excess sludge. The dry weather effluent ranges from 7000–10,000 m3/day, while the rain weather effluent can reach up to 40,000 m3/day.

2.2. Sampling Dates

The monitoring of the river Alb was performed on rain-free days between 3 May and 8 May 2025. The Rehbach sampling was performed on 17 May and 18 May 2025. The samples for the monitoring along the river Queich were taken on rain-free days from 10 April 2025 to 11 May 2025.
In addition, long-term sampling of the Queich was conducted at a sampling spot approximately 400 m downstream of the outlet of the WWTP Landau-Mörlheim (49.2051, 8.19248) over a period of 16 months from March 2024 to June 2025. Over the same period, the effluent of the WWTP Landau-Mörlheim was sampled between 0.5 and 1 h before the sampling at the river Queich.

2.3. Sampling Method

Grab samples were taken for comprehensive MP monitoring of the rivers. Particle sampling unit (PSU, pump filtration) samples were taken at the WWTP Landau effluent, the WWTP Landau rainwater overflow, and for the single spot long-term sampling of the river Queich, in addition to the grab samples.
Grab samples were taken with 0.5 L brown glass bottles (Rixius GmbH, Mannheim, Germany). The bottle was flushed 3 times with the river water; the water was filled into the bottle, and the bottle was closed. The lid of the sample bottles has a Teflon-coated seal. Samples were stored at RT until analysis.
Particle sampling unit (PSU, pump filtration) samples were taken according to Sturm et al., 2024 [25]. Sampling was conducted at the outlet of the third treatment stage using the Wasser 3.0 Particle Sampling Unit (PSU, Wasser 3.0 gGmbH, Karlsruhe, Germany), a transportable device equipped with a 10 µm filter cartridge, pump, valves, hoses, and a water meter. For each sample, 100 L of water was filtered, capturing particles larger than 10 µm. The retained solids were rinsed from the filter into a glass vessel and transported to the laboratory for further analysis.

2.4. Sample Preparation

The sample preparation process for MP analysis involves a combination of oxidative digestion of organic particles in the sample using hydrogen peroxide treatment, followed by fluorescent staining for detection of the MP particles.
In the laboratory, the samples were filtered over a 10 µm stainless steel filter (Wolftechnik Filtersysteme GmbH & Co., KG, Weil, Germany). For the WWTP samples, a subsample of 500 mL was taken from the 2.5 L sample volume. The filter with the retained solids was put in a glass beaker and subjected to oxidative digestion using 35% hydrogen peroxide (H2O2), in combination with iron (II) sulfate (FeSO4·7H2O) as a catalyst. The filter was covered with 25–30 mL of hydrogen peroxide (AB171423, abcr GmbH, Karlsruhe, Germany), and 3–5 grains of solid iron (II)sulfate (AB203817, abcr GmbH, Karlsruhe, Germany) were added. The digestion was performed at 80 °C for 60 min to degrade organic matter while preserving synthetic polymer particles.
Following digestion, the sample was filtered with the stainless steel filter and flushed with demineralized water. The solids on the filter surface were washed into a beaker and filled to a volume of 100 mL. Subsequently, the suspension was stained with the fluorescent dye abcr eco Wasser 3.0 detect mix MP-1 (AB930015, abcr GmbH, Karlsruhe, Germany). The staining was conducted with 0.25 mg/L at 80 °C for 60 min. After staining, samples were filtered on a black filter membrane (Metricel® Black PES Membranfilter, 0.80 µm, Pall, Dreieich, Germany). For the PSU samples, ⌀ 47 mm filters were used, and for the grab samples, ⌀ 25 mm filters were used.

2.5. Fluorescent Imaging and Microplastic Detection

Fluorescent imaging was conducted using a Zeiss Axio Zoom.V16 microscope (Carl Zeiss Microscopy Deutschland GmbH, Oberkochen, Germany) equipped with a PlanNeoFluar Z 1.0× objective and an Axiocam 712 mono camera. Green fluorescent detection was facilitated by a custom-designed filter set provided by AHF Analysentechnik AG (Tübingen, Germany). Imaging parameters are specified in Sturm et al., 2025 [29].
For quantitative analysis of the PSU sample, five tiles measuring 3.9 × 3.9 mm2 were selected from a ⌀ 47 mm round filter and imaged. For the grab samples, the whole ⌀ 25 mm filter was analyzed. Image processing and particle quantification were performed using the ZEN 3.8 software (Carl Zeiss Microscopy Deutschland GmbH), employing the ZEN Toolkit 2D particle counting module. This module enables automated microplastic detection based on predefined brightness threshold criteria.

2.6. Contamination Control

Contamination control during microplastic analysis was ensured through a dedicated laboratory environment exclusively used for MP detection-related procedures. Prior to each sample preparation session, the laboratory was cleaned using lint-free cloths, and personnel wore lint-free protective suits (model 4510 M, 3M Deutschland GmbH, Ness, Germany). Before entering, suits were treated with an adhesive lint roller to minimize fiber shedding. An air filtration system was continuously operated to reduce airborne particulate contamination. Wherever feasible, glass laboratory equipment was employed to avoid plastic-derived artifacts, and all sample containers were covered with aluminum foil during handling and storage. To account for potential background contamination, procedural blanks were routinely analyzed and their values subtracted from measured microplastic concentrations.

3. Results and Discussion

3.1. Sampling Along the Three Rivers

The maps of the sampling locations are displayed in Figure 1, Figures S1 and S2, and the summarized data can be found in Table 1. The highest average concentration was found in the Rehbach, with an average of 540 ± 476 MP/L, while the lowest average concentration was found in the Alb, with 98 ± 54 MP/L. The highest value measured was in the lower reaches of the Rehbach, with 1761 MP/L, and the lowest measured concentration was at the spring of the river Queich, with 4 MP/L. The relatively high standard deviations show the high variability and uneven distribution of microplastics along river courses and in river water. As the Rehbach is shorter than the Queich and Alb, the number of samples is lower (n = 10).
The analysis does not reveal any clear patterns of distribution in the comparison of the upper and lower reaches of the rivers. Neither settlement areas nor point sources, such as industrial or municipal sewage treatment plants, reveal any consistently increased pollution along the river courses. It therefore appears that microplastic inputs are determined more by diffuse input sources and less by point sources. For comparison, a study investigating microplastics pollution at the German river Weser discusses urban runoff and soil erosion as the main sources for MPs in the river water [34]. Here, it is also important whether combined or separate sewer systems are present [35]. Also, sedimentation and resuspension of microplastics in the riverbed might strongly influence concentrations [34]. The distribution and transport of microplastics in water can further be influenced by hydrological conditions. For example, a depression can form in slow-flowing areas where MPs accumulate more strongly [36]. Further, vegetation in the riverbed is discussed as a possible retention zone by creating eddy zones, which cause the settling of small microplastics after the turbulence subsides. Turbulent flow conditions with higher total suspended solids (TSS) are often correlated with higher MP concentrations [34,37,38]. But also, point sources such as municipal or WWTPs can strongly influence MP concentrations in rivers and show highly fluctuating emissions [30,39]. This highlights the high number of interrelated factors that determine the concentration and distribution of MPs in rivers and are themselves subject to constant changes. Therefore, the complexity of sources and transport behavior of MPs in rivers is not yet understood and requires more studies that use the same methodologies and thus have comparable data.
Seasonal variations and the influence of rainfall events are also often discussed but are not considered in this study, as the samples were taken on rain-free days in the spring season in Germany [34,38]. Given that the data covers only a limited timeframe, spanning one to three months during spring and early summer, spatial heterogeneity may be characteristic of spring base-flow conditions.
The concentrations found in all three rivers are relatively high compared to other studies in freshwater environments. In such comparisons, however, it is fundamental to consider the methodology, especially the minimum detectable particle size given by the sampling and detection method [11,40]. The majority of studies investigating microplastics in waters use plankton nets with a mesh size between 300 and 400 µm for sampling [40]. Typical concentrations detected in freshwaters are 0.001–0.1 MP/L. A peer review investigated 301 papers on microplastics in freshwaters and found reported values ranging from 0 to 4276 MP/L with a mean of 0.025  ±  0.133 MP/L, showing the wide range of MP contamination found among different studies [41].
A study along different rivers in southern Germany found an average of 49.8 ± 68.7 MP/m3, ranging from 0.7 MP/m3 to 354.9 MP/m3, with a minimum detectable particle size of 20 µm and FTIR-based detection [42]. This is about 1000 times lower than the concentrations measured in this study. Concentrations similar to those measured in this study were found in a study of microplastics in the rivers of the Chinese city Shenzhen, with a mean abundance of 2305 particles/L, showing strong spatial variation ranging from 38 to 18,380 MP/L [43]. The study used FTIR-based detection down to 30 µm and found 53% of all particles in the smallest size class of 30–50 µm. Another study investigating microplastics abundance in the waters of Guizhou, China, applied Nile Red staining with a detection limit of 10 µm and found an average concentration of 3600 ± 3000 MP/L, while more than 50% of the MPs detected were in the size class of 10–20 µm [44].

3.2. Temporal Variations and Sampling Method Comparison

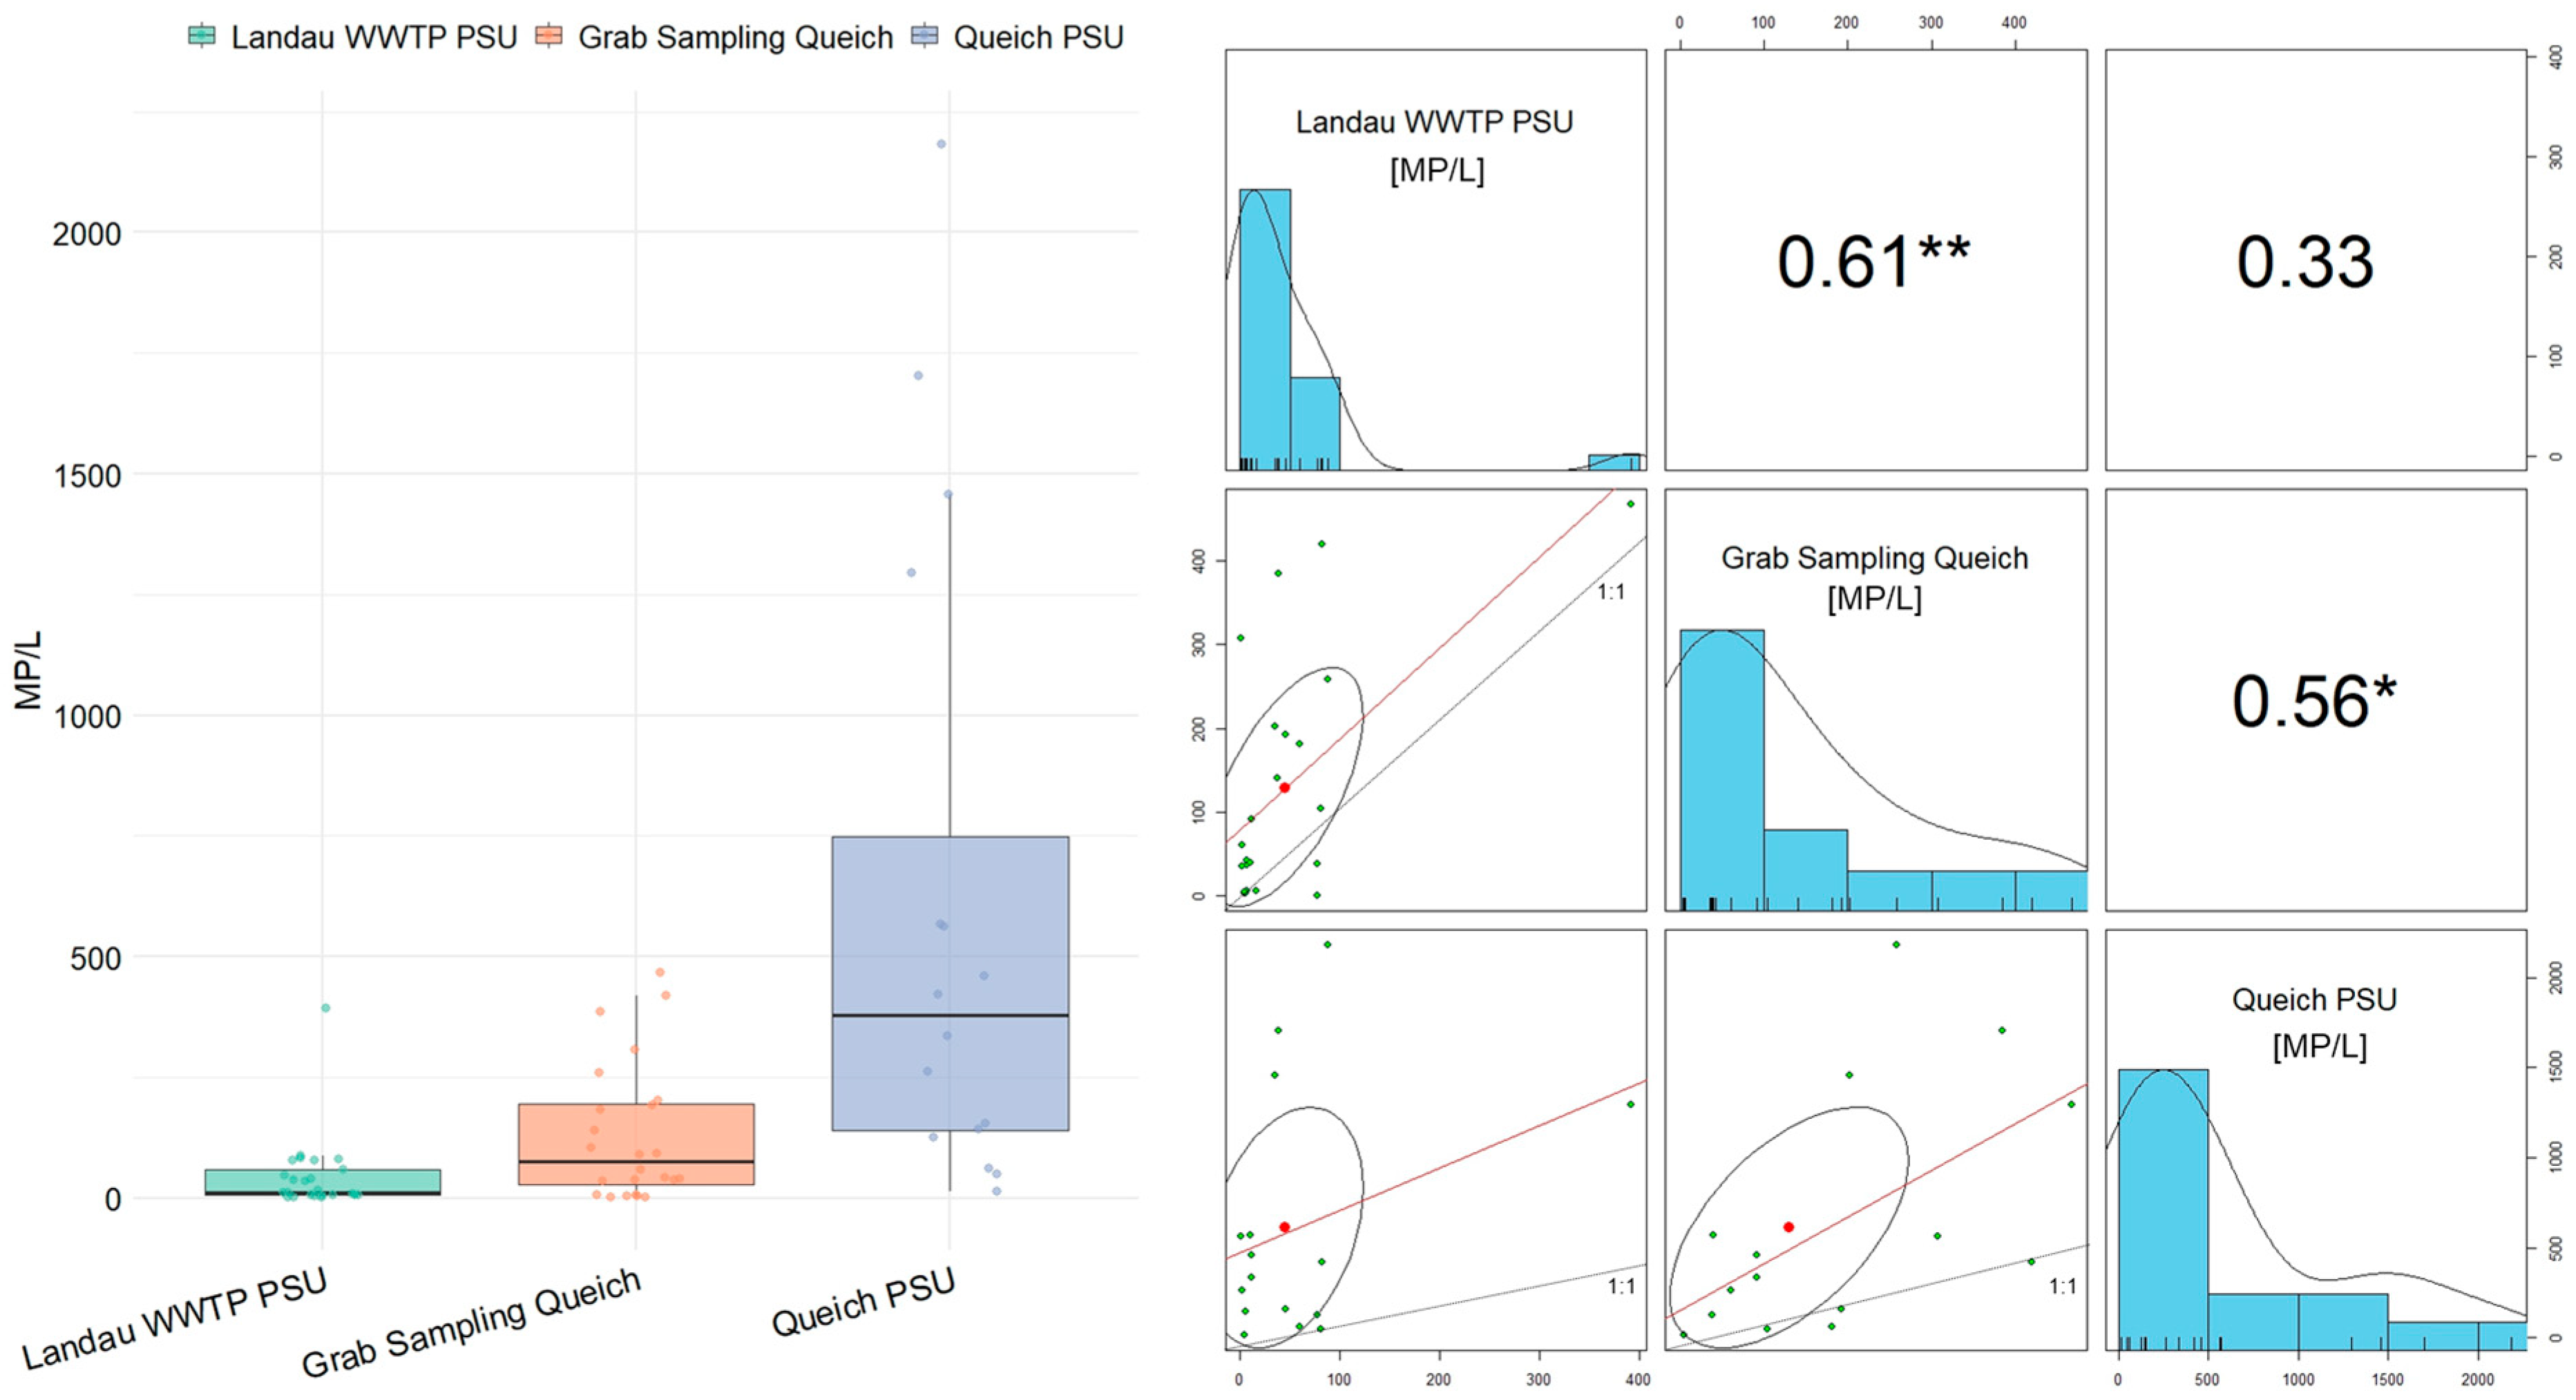
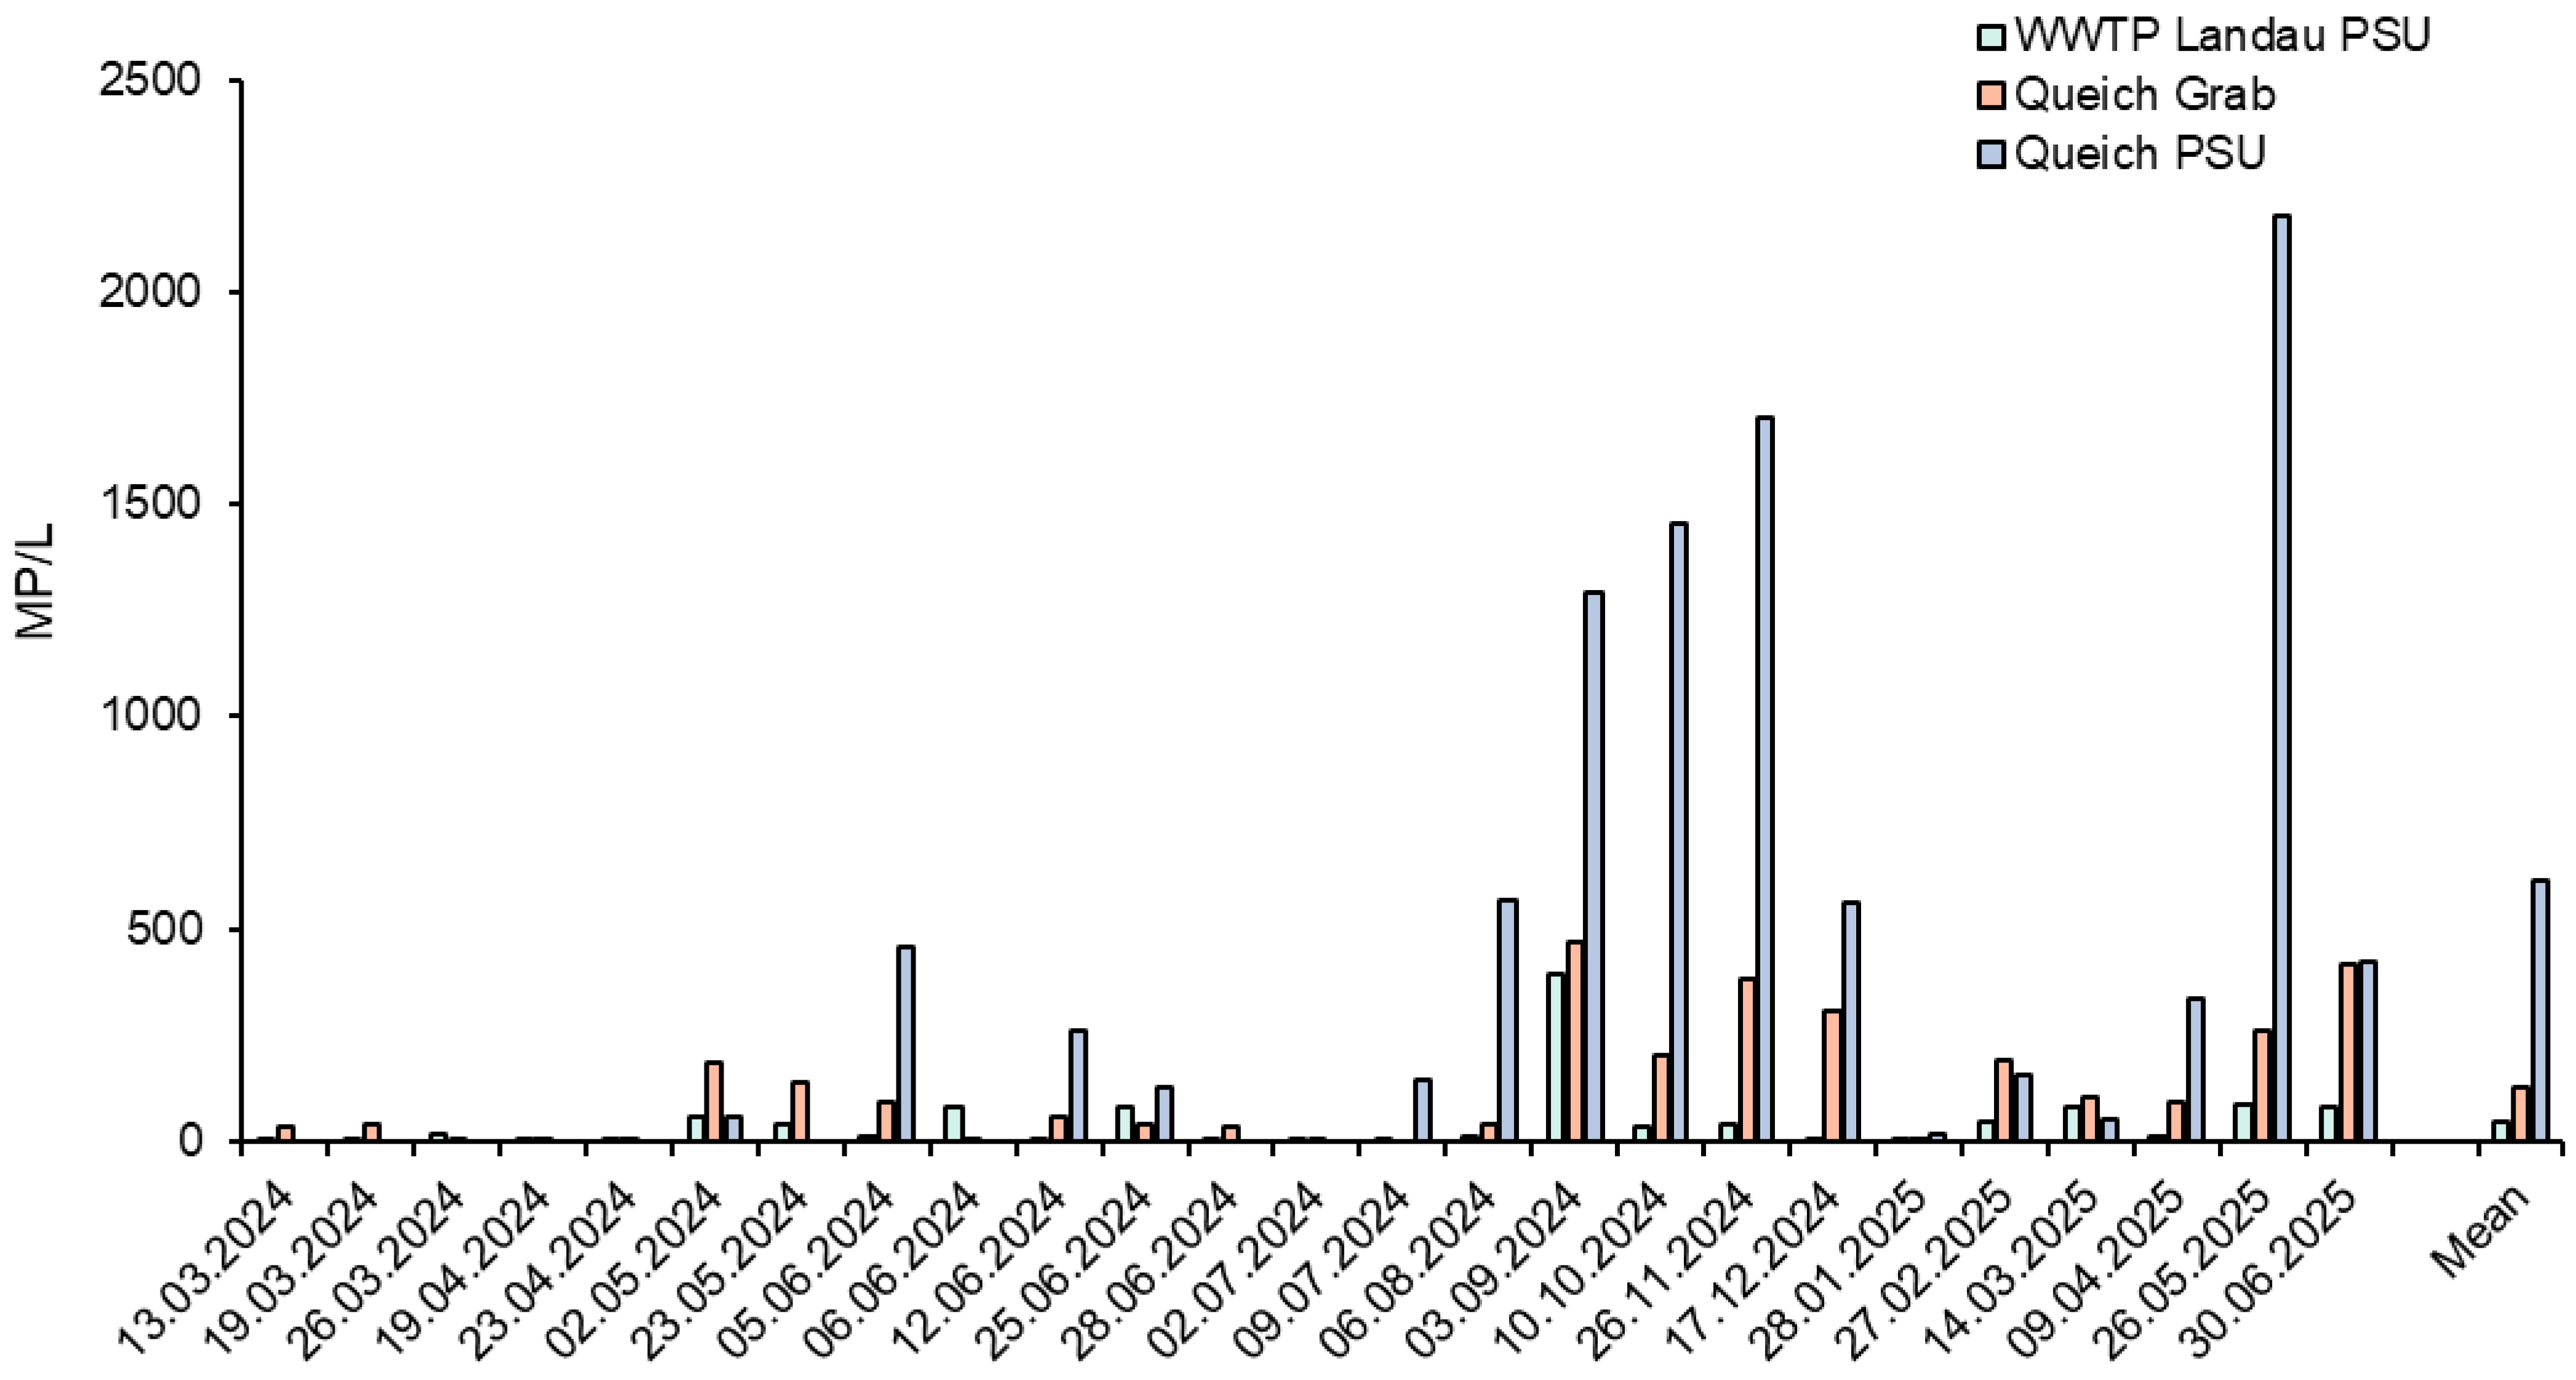
Figure 2 shows the microplastic concentrations of long-term monitoring at the WWTP Landau and the river Queich after the WWTP Landau effluent. The WWTP was sampled with the PSU (100 L), and the Queich was sampled with both the PSU (100 L) and a grab sample (0.5 L) to directly compare both methods.
On average, the WWTP effluent has 44 ± 77 MP/L, ranging from 1 MP/L to 392 MP/L (n = 25). Based on the 0.5 L grab samples, the river Queich shows an average concentration of 130 ± 140 MP/L, ranging from 1 MP/L to 467 MP/L in long-term monitoring (n = 24). Using the 100 L PSU sample, the average concentration in the river Queich is 612 ± 649, ranging from 15 MP/L to 2182 MP/L (n = 16). For comparison, in the spatial monitoring along the river with the grab samples, an average concentration of 264 ± 195 MP/L was measured (n = 32).
Looking at the temporal course of the MP concentrations (Figure 3), strong temporal variations are visible, which are underlined by the high standard deviations and the min. and max. values. This aligns with other studies showing a high temporal variability in MP concentrations in river waters [45,46,47]. An investigation of spatial and temporal variations of MPs in the Wangyu River network, Wuxi, China, showed even higher temporal than spatial variations of the MP concentrations measured in the river water [46]. This high temporal variability shows the importance of comparable long-term data to obtain a representative estimation of MP contamination levels at sampling locations. These strong temporal fluctuations in river MP concentrations arise from a confluence of hydrology, weather, source patterns, in-stream structures, and flow regimes, as well as particle properties of MPs, which are themselves dynamic factors [48,49].
The MP concentrations found in the river Queich are higher than the MP concentrations found in the WWTP effluent. Using the average flow volume of the Queich (1.67 m3/s) and the average MP concentration (130 MP/L for grab samples, 612 MP/L PSU samples) and the average discharge of the WWTP Landau (0.17 m3/s) and the average MP concentration (44 MP/L), the percentage of the MPs in the Queich caused by the WWTP Landau is calculated (Table 2). For grab sampling, 3.3% of the MPs in the river Queich are derived from the WWTP, and for the PSU samples, 0.73%.
Many studies identify WWTPs as point sources of MPs into the environment due to elevated MP concentrations in the WWTP effluent [50,51]. Other studies cannot see a direct effect of WWTP effluents on the MP concentrations in rivers [42]. Hence, diffuse sources are suspected of being the main driver of MP entry. Nevertheless, mass and particle count balances show that wastewater treatment plants release considerable quantities of MPs into the environment [52,53]. A previous long-term study at the WWTP Landau estimated a yearly emission of 150 billion MP/year into the Queich [30]. Further, separate sewer systems can lead to scattered discharge of untreated road runoff into rivers [54]. Sampling of the rainwater overflow from the WWTP Landau showed an average concentration of 577 MP/L, ranging from 41 MP/L to 2255 MP/L, which significantly exceeds the concentrations of the treated wastewater in the sewage treatment plant effluent (Table 3). The maximum inflow to the WWTP is limited to 47,500 m3/day. If more water enters the treatment plant due to rainfall, it flows into the rainwater overflow basins, which can hold up to 15,248 m3. When these are full, they are drained via rainwater, overflow into a natural collection basin, and subsequently into receiving waters. Such events can occur in long rain periods with little or intermediate volumes of rain or in short rain periods with high volumes of rain. Such point sources provide an important starting point for the targeted removal of MPs and preventing emissions into the environment [39,55].
It is notable that there is a strong difference in the concentrations measured by 0.5 L grab samples and 100 L PSU samples, where the average concentration measured with the PSU is 4.7 times higher than the concentrations measured with the grab samples (Figure 2). These findings show the importance of a standardized sample volume and sampling method in the comparability of data and studies. Although the sample preparation and detection use the same methods, the sampling and sample volume had a significant effect on the measured concentration. A meta-analysis of the influence of the sample volume on the measured concentrations found a strong effect of the sample volume on the measured concentrations but showed the opposite trend, whereas an increased sample volume led to an exponential decrease in measured MP concentrations [11].
For correlation analysis of the two sampling methods (Figure 2), a moderate positive correlation between grab and PSU samples at the river Queich was found (r = 0.56). Also, a moderate positive correlation of the MP concentration at the WWTP Landau effluent and the Queich grab samples was detected (r = 0.61). It is notable that this correlation is strongly influenced by the data point from 3 September 2024, which severely limits the significance. A correlation between the WWTP Landau effluent and the Queich PSU data was not found, as the measured values with the PSU are more scattered than the grab samples.
It is particularly important to identify the sources of MPs in order to effectively implement potential removal technologies [55]. Understanding MP sources, sinks, and transport behavior in rivers, taking temporal variability into account, requires a combination of spatial and temporal monitoring. Based on the obtained data, an accurate assessment of MP loads requires a minimum sampling of two replicates per site, as well as monthly monitoring over at least one full seasonal cycle to account for temporal variability. The fluorescent staining-based monitoring method presented in this study offers a cost-effective and time-effective option for high-throughput monitoring. However, it requires further cross-validation with established methods such as Micro-FT-IR or Micro-Raman spectroscopy to verify its accuracy.

3.3. Comparison of Grab and PSU Sample Fluctuations

To investigate the fluctuations within the sampling process, samples were taken in duplicate during the long-term monitoring of the Queich downstream of the WWTP. The data shows an average deviation of both samples from the mean of 49 ± 33% for the grab samples. The PSU samples show a significantly lower deviation from the mean of 27 ± 25%, which nevertheless still represents a considerable measurement fluctuation.
To further investigate the MP fluctuations, on 20 December 2025, 10 grab samples were taken at the study site and subsequently analyzed. The results ranged from 76 MP/L to 970 MP/L, with an average of 308 ± 239 MP/L. This demonstrates that samples taken at the same location within a few minutes may differ by up to 12.8 times. The average deviation from the mean of the 10 samples was 54 ± 59%, which is in the same range as the deviations of the duplicates.
The contamination control found for the blanks of the grab samples was 20 MP/L (n = 10) and for the PSU method, 3 MP/L (n = 10). Due to the small sample volume of 0.5 l, the grab sampling method is much more sensitive to contamination.
MPs, as non-soluble particulate pollutants, exhibit markedly different behaviors compared to soluble contaminants [42]. Their distribution within aqueous systems is heterogeneous, influenced by a wide range of physicochemical and environmental factors. As a result, MPs are dispersed non-uniformly throughout the water column and sediment layers of riverine environments. A study investigating the variance in microplastic sampling in two Japanese urban rivers found that the dispersion of the MPs in the water follows random processes, whereas higher numbers of samples and higher sample volumes can reduce the uncertainties [56]. With a sampling volume of 6.59 ± 2.10 m3, using a 335 µm plankton net, duplicates reached a deviation of <30%. A study sampling a French river using a 330 μm mesh size and a sample volume of 59.4 m3 found a deviation of 13% among triplicates [57]. A variation of the sampling volume ranging from 35.6 m3 to 83.2 m3 showed no effect on the precision of the measurement. It is notable that both studies have considerably higher sampling volumes compared to the 100 L PSU and 0.5 L grab samples and work with higher mesh sizes compared to the 10 µm used in the current study.
Applying the Representative Sample Volume Predictor (RSVP) tool developed by Cross et al., 2025, 0.5 L is not suitable to reliably detect MP concentrations under 6 MP/L (p-value = 0.05) [11]. The 100 L PSU samples can representatively detect 2.1 MP/L (p-value = 0.05). For the PSU samples, the subsampling of 0.5 L from the original 2.5 L sample and the analysis of the five squares representing 7% of the filter area need to be considered (Figure 4). For simplicity, the MPs were assumed to be homogeneously distributed on the filter and in the sample container, which represents a best-case scenario. Analyzing the whole filter would lead to a reliable detection of down to 0.15 MP/L. Analyzing the whole filter and sample would lead to a reliable detection down to 0.03 MP/L. For comparison, the lowest concentrations found in this study were 1 MP/L.

3.4. Correlation Analysis with Environmental Parameters

Figure 5 shows the correlation analysis of the MPs found at the long-term sampling site of the river Queich between additional environmental parameters. There is a moderate negative correlation between the water level of the Queich and the measured MP concentration of the grab samples. This means that at higher discharges, there is a tendency toward lower MP concentrations, which may be due to dilution. This is also indicated by the negative correlation of conductivity and water level, showing a diluting effect of rainwater. The weak positive correlation between the Queich grab samples and conductivity was statistically not significant.
For the other parameters—air temperature, precipitation, water temperature, and the discharge volume of the WWTP Landau—no correlations were found. This indicates that the parameters are independent of each other. The rain overflow cannot be included in the correlation analysis, as the samples were taken on different dates.
While a study at the German river Weser found the highest MP concentrations during high discharge events, a study in the Taiwanese Houjin River showed higher MP concentrations with lower discharges [34,58]. Three measurement campaigns at Liane River (France) under stormy, rainy, and dry conditions found no direct temperature-to-MP link; MP vertical distribution was driven primarily by rainfall events and turbidity [59]. As rivers are complex systems with spatially and temporally varying flow conditions, the impact of environmental factors, such as temperature fluctuations, including extreme cold and heat, on the transport of microplastics under natural conditions still has considerable knowledge gaps [60].

4. Conclusions

Sampling during the spring season across the Queich, Alb, and Rehbach, which are small- to medium-sized rivers in southwestern Germany, revealed highly variable MP concentrations, with concentrations ranging from as low as 4 MP/L to as high as 1761 MP/L. The Rehbach exhibited the highest average concentration (540 ± 476 MP/L), while the Alb showed the lowest (98 ± 54 MP/L), with significant spatial heterogeneity along all three investigated rivers. Despite comparing upper and lower reaches, proximity to settlements, and known point sources such as WWTPs, no consistent pattern of elevated MP contamination was detected. Within the limitations of our fluorescence-based detection method (≥10 µm) and the studied timeframe, diffuse sources appear to contribute significantly to MP inputs in these three German rivers. Hydrological factors such as flow conditions and vegetation-induced sedimentation dynamics can further contribute to the uneven distribution of MPs.
Long-term sampling at one of the study sites revealed pronounced temporal fluctuations in MP concentrations, ranging from 1 MP/L to 467 MP/L using grab samples and 15 MP/L to 2182 MP/L using the PSU, indicating high uncertainty in single-point measurements. These variations are driven by dynamic factors such as changing source inputs, hydrological conditions, weather patterns, and extreme weather events, all of which complicate the quantification of MPs in riverine environments. Consequently, accurate assessment of MP loads and identification of contamination hotspots necessitate both spatial and temporal data, requiring extensive sampling and analytical efforts, and underline the need for fast and cost-effective MP detection. Based on the obtained data, an accurate assessment of MP loads requires a minimum sampling of two replicates per site and monthly monitoring over at least one full seasonal cycle to account for temporal variability. Fluorescent staining-based detection offers a robust framework for rapid MP screening with high sample numbers but requires cross-validation against established methods to ensure quantitative accuracy.
By comparing 0.5 L grab sampling with 100 L pump sampling (PSU), this study found that the sampling volume and process have a considerable effect on the outcome of the measured data. In the long-term sampling of the Queich, the 100 L PSU samples had, on average, 4.7 times higher MP contamination than the 0.5 L grab samples. Further, the PSU samples showed a lower deviation of the duplicates around their mean of 27 ± 25% than the 0.5 L grab samples, with a deviation from the mean of 49 ± 33%. This reinforces the need for standardized sampling protocols along MP studies and long-term monitoring to enhance data reliability and comparability across freshwater environments. Standardized sampling is the basis of achieving comparable data.

Supplementary Materials

The following supporting information can be downloaded at: https://www.mdpi.com/article/10.3390/microplastics4030063/s1, Figure S1: Map of the sample locations and detected microplastic concentrations along the Alb. Figure S2: Map of the sample locations and detected microplastic concentrations along the Rehbach.

Author Contributions

Conceptualization, A.K., D.S. and K.S.; methodology, M.T.S., D.S. and K.S.; validation, M.T.S. and K.S.; formal analysis, A.K., M.T.S. and K.S.; investigation, P.R., O.Z., M.T.S. and A.K.; resources, K.S.; data curation, M.T.S., P.R. and K.S.; writing—original draft preparation, M.T.S., E.M. and K.S.; writing—review and editing, A.K., M.T.S., E.M. and K.S.; visualization, E.M. and M.T.S.; supervision, K.S.; project administration, K.S.; funding acquisition, K.S. All authors have read and agreed to the published version of the manuscript.

Funding

The authors gratefully acknowledge the financial support of the Horizon Mission project UPSTREAM (GA 101112877), co-funded by the European Union and the UK Research and Innovation. This publication reflects the views only of the author, and the European Commission cannot be held responsible for any use that may be made of the information contained herein. The project has also received part of its funding from the Veolia Foundation (Germany)|Project konti|detect.

Data Availability Statement

The original contributions presented in this study are included in the article/supplementary material. Further inquiries can be directed to the corresponding author(s). Full data are available on reasonable request to the corresponding author.

Acknowledgments

The authors thank Entsorgungs und Wirtschaftsbetriebe Landau (EWL, Germany) for the project-related support. The authors thank Sophia Olbrich for the contribution to microplastics sampling, sample preparation, and detection. Further thanks to the schools that supported the sampling as part of citizen science projects, and to the Surfrider Foundation Baden-Pfalz for their support, especially with the Rehbach sampling campaign.

Conflicts of Interest

The authors Michael Toni Sturm, Anika Korzin, Pieter Ronsse, Erika Myers, Oleg Zernikel, Dennis Schober, and Katrin Schuhen were employed by the company Wasser 3.0 gGmbH. The authors declare that the research was conducted in the absence of any commercial or financial relationships that could be construed as a potential conflict of interest.

Abbreviations

The following abbreviations are used in this manuscript:
MPsMicroplastics
TSSTotal suspended solids
WWTPWastewater treatment plant

References

  1. Hale, R.C.; Seeley, M.E.; La Guardia, M.J.; Mai, L.; Zeng, E.Y. A Global Perspective on Microplastics. JGR Oceans 2020, 125, e2018JC014719. [Google Scholar] [CrossRef]
  2. Seewoo, B.J.; Goodes, L.M.; Thomas, K.V.; Rauert, C.; Elagali, A.; Ponsonby, A.-L.; Symeonides, C.; Dunlop, S.A. How do plastics, including microplastics and plastic-associated chemicals, affect human health? Nat. Med. 2024, 30, 3036–3037. [Google Scholar] [CrossRef]
  3. Lebreton, L.C.M.; van der Zwet, J.; Damsteeg, J.-W.; Slat, B.; Andrady, A.; Reisser, J. River plastic emissions to the world’s oceans. Nat. Commun. 2017, 8, 15611. [Google Scholar] [CrossRef]
  4. Meijer, L.J.J.; van Emmerik, T.; van der Ent, R.; Schmidt, C.; Lebreton, L. More than 1000 rivers account for 80% of global riverine plastic emissions into the ocean. Sci. Adv. 2021, 7, eaaz5803. [Google Scholar] [CrossRef] [PubMed]
  5. Gao, S.; Orlowski, N.; Bopf, F.K.; Breuer, L. A review on microplastics in major European rivers. WIREs Water 2024, 11, e1713. [Google Scholar] [CrossRef]
  6. Owowenu, E.K.; Nnadozie, C.F.; Akamagwuna, F.; Noundou, X.S.; Uku, J.E.; Odume, O.N. A critical review of envi-ronmental factors influencing the transport dynamics of microplastics in riverine systems: Implications for ecological studies. Aquat. Ecol. 2023, 57, 557–570. [Google Scholar] [CrossRef]
  7. Sulaiman, B.; Woodward, J.C.; Shiels, H.A. Riverine microplastics and their interaction with freshwater fish. Water Biol. Secur. 2023, 2, 100192. [Google Scholar] [CrossRef]
  8. Campanale, C.; Savino, I.; Pojar, I.; Massarelli, C.; Uricchio, V.F. A Practical Overview of Methodologies for Sam-pling and Analysis of Microplastics in Riverine Environments. Sustainability 2020, 12, 6755. [Google Scholar] [CrossRef]
  9. Huang, Z.; Hu, B.; Wang, H. Analytical methods for microplastics in the environment: A review. Environ. Chem. Lett. 2023, 21, 383–401. [Google Scholar] [CrossRef]
  10. van Mourik, L.M.; Crum, S.; Martinez-Frances, E.; van Bavel, B.; Leslie, H.A.; de Boer, J.H.; Cofino, W.P. Results of WEPALQUASIMEME/NORMANs first global interlaboratory study on microplastics reveal urgent need for harmonization. Sci. Total Environ. 2021, 772, 145071. [Google Scholar] [CrossRef]
  11. Cross, R.K.; Roberts, S.L.; Jürgens, M.D.; Johnson, A.C.; Davis, C.W.; Gouin, T. Ensuring representative sample volume predictions in microplastic monitoring. Micropl. Nanopl. 2025, 5, 5. [Google Scholar] [CrossRef]
  12. Dong, H.; Wang, X.; Niu, X.; Zeng, J.; Zhou, Y.; Suona, Z.; Yuan, Y.; Chen, X. Overview of analytical methods for the determination of microplastics: Current status and trends. TrAC Trends Anal. Chem. 2023, 167, 117261. [Google Scholar] [CrossRef]
  13. Song, Y.K.; Hong, S.H.; Eo, S.; Shim, W.J. A comparison of spectroscopic analysis methods for microplastics: Manual, semi-automated, and automated Fourier transform infrared and Raman techniques. Mar. Pollut. Bull. 2021, 173, 113101. [Google Scholar] [CrossRef]
  14. Campanale, C.; Savino, I.; Massarelli, C.; Uricchio, V.F. Fourier Transform Infrared Spectroscopy to Assess the Degree of Alteration of Artificially Aged and Environmentally Weathered Microplastics. Polymers 2023, 15, 911. [Google Scholar] [CrossRef]
  15. Fernández-González, V.; Andrade-Garda, J.M.; López-Mahía, P.; Muniategui-Lorenzo, S. Impact of weathering on the chemical identification of microplastics from usual packaging polymers in the marine environment. Anal. Chim. Acta 2021, 1142, 179–188. [Google Scholar] [CrossRef]
  16. Seeley, M.E.; Lynch, J.M. Previous successes and untapped potential of pyrolysis-GC/MS for the analysis of plastic pollution. Anal. Bioanal. Chem. 2023, 415, 2873–2890. [Google Scholar] [CrossRef] [PubMed]
  17. Kittner, M.; Eisentraut, P.; Dittmann, D.; Braun, U. Decomposability versus detectability: First validation of TED-GC/MS for microplastic detection in different environmental matrices. Appl. Res. 2024, 3, e202200089. [Google Scholar] [CrossRef]
  18. Meyers, N.; Catarino, A.I.; Declercq, A.M.; Brenan, A.; Devriese, L.; Vandegehuchte, M.; de Witte, B.; Janssen, C.; Everaert, G. Microplastic detection and identification by Nile red staining: Towards a semi-automated, cost- and time-effective technique. Sci. Total Environ. 2022, 823, 153441. [Google Scholar] [CrossRef]
  19. Stanton, T.; Johnson, M.; Nathanail, P.; Gomes, R.L.; Needham, T.; Burson, A. Exploring the Efficacy of Nile Red in Microplastic Quantification: A Costaining Approach. Environ. Sci. Technol. Lett. 2019, 6, 606–611. [Google Scholar] [CrossRef]
  20. Nel, H.A.; Chetwynd, A.J.; Kelleher, L.; Lynch, I.; Mansfield, I.; Margenat, H.; Onoja, S.; Goldberg Oppenheimer, P.; Sambrook Smith, G.H.; Krause, S. Detection limits are central to improve reporting standards when using Nile red for microplastic quantification. Chemosphere 2021, 263, 127953. [Google Scholar] [CrossRef] [PubMed]
  21. Gao, Z.; Wontor, K.; Cizdziel, J.V. Labeling Microplastics with Fluorescent Dyes for Detection, Recovery, and Degradation Experiments. Molecules 2022, 27, 7415. [Google Scholar] [CrossRef] [PubMed]
  22. Nalbone, L.; Panebianco, A.; Giarratana, F.; Russell, M. Nile Red staining for detecting microplastics in biota: Preliminary evidence. Mar. Pollut. Bull. 2021, 172, 112888. [Google Scholar] [CrossRef]
  23. Sturm, M.T.; Horn, H.; Schuhen, K. The potential of fluorescent dyes-comparative study of Nile red and three derivatives for the detection of microplastics. Anal. Bioanal. Chem. 2021, 413, 1059–1071. [Google Scholar] [CrossRef]
  24. Sturm, M.T.; Myers, E.; Schober, D.; Korzin, A.; Schuhen, K. Development of an Inexpensive and Comparable Microplastic Detection Method Using Fluorescent Staining with Novel Nile Red Derivatives. Analytica 2023, 4, 27–44. [Google Scholar] [CrossRef]
  25. Sturm, M.T.; Myers, E.; Korzin, A.; Polierer, S.; Schober, D.; Schuhen, K. Fast Forward: Optimized Sample Preparation and Fluorescent Staining for Microplastic Detection. Microplastics 2023, 2, 334–349. [Google Scholar] [CrossRef]
  26. Shruti, V.C.; Pérez-Guevara, F.; Roy, P.D.; Kutralam-Muniasamy, G. Analyzing microplastics with Nile Red: Emerging trends, challenges, and prospects. J. Hazard. Mater. 2022, 423, 127171. [Google Scholar] [CrossRef] [PubMed]
  27. Prata, J.C.; Reis, V.; Matos, J.T.V.; Da Costa, J.P.; Duarte, A.C.; Rocha-Santos, T. A new approach for routine quantification of microplastics using Nile Red and automated software (MP-VAT). Sci. Total Environ. 2019, 690, 1277–1283. [Google Scholar] [CrossRef]
  28. Prata, J.C.; Alves, J.R.; Da Costa, J.P.; Duarte, A.C.; Rocha-Santos, T. Major factors influencing the quantification of Nile Red stained microplastics and improved automatic quantification (MP-VAT 2.0). Sci. Total Environ. 2020, 719, 137498. [Google Scholar] [CrossRef]
  29. Sturm, M.T.; Argyropoulou, D.; Myers, E.; Korzin, A.; Ronsse, P.; Zernikel, O.; Schober, D.; Schuhen, K. Comparative Long-Term Monitoring of Microplastics in the Effluent of Three Different Wastewater Treatment Plants with Two, Three, and Four Treatment Stages. Water 2025, 17, 711. [Google Scholar] [CrossRef]
  30. Sturm, M.T.; Myers, E.; Korzin, A.; Schober, D.; Schuhen, K. Long-Term Monitoring of Microplastics in a German Municipal Wastewater Treatment Plant. Microplastics 2024, 3, 492–502. [Google Scholar] [CrossRef]
  31. Landesamt für Umwelt Rheinland-Pfalz. Steckbriefe der Oberflächenwasserkörper. Available online: https://wasserportal.rlp-umwelt.de/auskunftssysteme/wasserkoerper-steckbriefe-wrrl (accessed on 20 July 2025).
  32. Landesamt für Umwelt Rheinland-Pfalz. Hochwasservorhersagezentrale Rheinland-Pfalz—Pegel Siebeldingen/Queich. Available online: https://www.hochwasser.rlp.de/flussgebiet/oberrhein/siebeldingen#pegelkennwerte (accessed on 22 July 2025).
  33. Landesanstalt für Umwelt Baden-Württemberg. Pegel—Ettlingen/Alb. Available online: https://www.hvz.baden-wuerttemberg.de/pegel.html?id=00110 (accessed on 22 July 2025).
  34. Moses, S.R.; Löder, M.G.J.; Herrmann, F.; Laforsch, C. Seasonal variations of microplastic pollution in the German River Weser. Sci. Total Environ. 2023, 902, 166463. [Google Scholar] [CrossRef] [PubMed]
  35. Cocca, M.; Di Pace, E.; Errico, M.E.; Gentile, G.; Montarsolo, A.; Mossotti, R.; Avella, M. (Eds.) Proceedings of the 2nd International Conference on Microplastic Pollution in the Mediterranean Sea; Springer International Publishing: Cham, Switzerland, 2020; ISBN 978-3-030-45908-6. [Google Scholar]
  36. Xia, F.; Wang, Y.; Wang, D.; Cai, Y.; Zhang, J. Seasonal pulse effect of microplastics in the river catchment-From tributary catchment to mainstream. J. Environ. Manag. 2023, 342, 118316. [Google Scholar] [CrossRef] [PubMed]
  37. Lofty, J.; Sonnino Sorisio, G.; Kelleher, L.; Krause, S.; Ouro, P.; Wilson, C. Hydrological and hydraulic drivers of mi-croplastics in a rural river sourced from the UK’s largest opencast coal mine. Environ. Pollut. 2025, 368, 125722. [Google Scholar] [CrossRef]
  38. Imbulana, S.; Tanaka, S.; Moriya, A.; Oluwoye, I. Inter-event and intra-event dynamics of microplastic emissions in an urban river during rainfall episodes. Environ. Res. 2024, 243, 117882. [Google Scholar] [CrossRef]
  39. Bodzek, M.; Pohl, A.; Rosik-Dulewska, C. Microplastics in Wastewater Treatment Plants: Characteristics, Occurrence and Removal Technologies. Water 2024, 16, 3574. [Google Scholar] [CrossRef]
  40. Hartz, L.; Grabinski, L.; Salameh, S. Microplastic pollution in aquatic environments: A meta-analysis of influencing factors and methodological recommendations. Front. Environ. Sci. 2025, 13, 1600570. [Google Scholar] [CrossRef]
  41. Jin, X.; Li, Z.; Peñuelas, J.; Sardan, J.; Wu, Q.; Peng, Y.; Heděnec, P.; Li, Z.; Yuan, C.; Yuan, J.; et al. Quantitative assessment on the distribution patterns of microplastics in global inland waters. Commun. Earth Environ. 2025, 6, 331. [Google Scholar] [CrossRef]
  42. Schrank, I.; Löder, M.G.J.; Imhof, H.K.; Moses, S.R.; Heß, M.; Schwaiger, J.; Laforsch, C. Riverine microplastic contamination in southwest Germany: A large-scale survey. Front. Earth Sci. 2022, 10, 794250. [Google Scholar] [CrossRef]
  43. Yang, H.; Sun, F.; Liao, H.; Huang, L.; Zhao, Q.; Wu, F. Pollution characterization and multi-index ecological risk assessment of microplastics in urban rivers from a Chinese megacity. J. Hazard. Mater. 2024, 480, 136145. [Google Scholar] [CrossRef] [PubMed]
  44. Xiong, S.; Bai, G.; Shen, X.; Zhou, Y. On microplastics abundance in waters of Guizhou, China. J. Ocean. Limnol. 2025, 43, 383–395. [Google Scholar] [CrossRef]
  45. Witzig, C.S.; Fiener, P.; König, M.; Zumbülte, N. Temporal Variability of Microplastic Concentrations in Inland Waters: An Automated, Semicontinuous Sampling of Microplastics ≥11 μm in a Stream in Southern Germany. ACS EST Water 2024, 4, 1443–1450. [Google Scholar] [CrossRef]
  46. Fan, Y.; Zheng, J.; Deng, L.; Rao, W.; Zhang, Q.; Liu, T.; Qian, X. Spatiotemporal dynamics of microplastics in an urban river network area. Water Res. 2022, 212, 118116. [Google Scholar] [CrossRef]
  47. Mohsen, A.; Balla, A.; Kiss, T. High spatiotemporal resolution analysis on suspended sediment and microplastic transport of a lowland river. Sci. Total Environ. 2023, 902, 166188. [Google Scholar] [CrossRef]
  48. Chifflard, P.; Nather, T.; Weber, C.J. Transport of (Micro)plastic Within a River Cross-Section—Spatio-Temporal Variations and Loads. Microplastics 2024, 3, 755–770. [Google Scholar] [CrossRef]
  49. Wang, L.; Huang, J.; Wu, Y.; Chen, X.; Chen, M.; Jin, H.; Yao, J.; Wang, X. Spatial–Temporal and Risk Assessment of Microplastics in the Surface Water of the Qinhuai River during Different Rainfall Seasons in Nanjing City, China. Water 2024, 16, 1857. [Google Scholar] [CrossRef]
  50. Zhuang, L.; Zhang, Y.; Xue, Y.; Ren, Y.; He, J.; Sun, H. Influence of ongoing discharge from multiple wastewater treatment plants on microplastic patterns in small-scale receiving rivers. Sci. Total Environ. 2024, 932, 172880. [Google Scholar] [CrossRef]
  51. Montecinos, S.; Gil, M.; Tognana, S.; Salgueiro, W.; Amalvy, J. Distribution of microplastics present in a stream that receives discharge from wastewater treatment plants. Environ. Pollut. 2022, 314, 120299. [Google Scholar] [CrossRef]
  52. Barkmann-Metaj, L.; Weber, F.; Bitter, H.; Wolff, S.; Lackner, S.; Kerpen, J.; Engelhart, M. Quantification of micro-plastics in wastewater systems of German industrial parks and their wastewater treatment plants. Sci. Total Environ. 2023, 881, 163349. [Google Scholar] [CrossRef] [PubMed]
  53. Roscher, L.; Halbach, M.; Nguyen, M.T.; Hebeler, M.; Luschtinetz, F.; Scholz-Böttcher, B.M.; Primpke, S.; Gerdts, G. Microplastics in two German wastewater treatment plants: Year-long effluent analysis with FTIR and Py-GC/MS. Sci. Total Environ. 2022, 817, 152619. [Google Scholar] [CrossRef] [PubMed]
  54. Treilles, R.; Gasperi, J.; Saad, M.; Rabier, A.; Breton, J.; Rocher, V.; Guérin, S.; Tassin, B. Macro and Microplastics in Stormwater and Combined Sewer Overflows in Paris Megacity. In Proceedings of the 2nd International Conference on Microplastic Pollution in the Mediterranean Sea; Cocca, M., Di Pace, E., Errico, M.E., Gentile, G., Montarsolo, A., Mossotti, R., Avella, M., Eds.; Springer International Publishing: Cham, Switzerland, 2020; pp. 145–151, ISBN 978-3-030-45908-6. [Google Scholar]
  55. Gao, W.; Zhang, Y.; Mo, A.; Jiang, J.; Liang, Y.; Cao, X.; He, D. Removal of microplastics in water: Technology progress and green strategies. Green. Anal. Chem. 2022, 3, 100042. [Google Scholar] [CrossRef]
  56. Tanaka, M.; Kataoka, T.; Nihei, Y. Variance and precision of microplastic sampling in urban rivers. Environ. Pollut. 2022, 310, 119811. [Google Scholar] [CrossRef] [PubMed]
  57. Bruge, A.; Dhamelincourt, M.; Lanceleur, L.; Monperrus, M.; Gasperi, J.; Tassin, B. A first estimation of uncertainties related to microplastic sampling in rivers. Sci. Total Environ. 2020, 718, 137319. [Google Scholar] [CrossRef] [PubMed]
  58. Huang, C.-W.; Li, Y.-L.; Lin, C.; Bui, X.-T.; Vo, T.-D.-H.; Ngo, H.H. Seasonal influence on pollution index and risk of multiple compositions of microplastics in an urban river. Sci. Total Environ. 2023, 859, 160021. [Google Scholar] [CrossRef] [PubMed]
  59. Pasquier, G.; Doyen, P.; Dehaut, A.; Veillet, G.; Duflos, G.; Amara, R. Vertical distribution of microplastics in a river water column using an innovative sampling method. Environ. Monit. Assess. 2023, 195, 1302. [Google Scholar] [CrossRef]
  60. Kumar, R.; Sharma, P.; Verma, A.; Jha, P.K.; Singh, P.; Gupta, P.K.; Chandra, R.; Prasad, P.V.V. Effect of Physical Characteristics and Hydrodynamic Conditions on Transport and Deposition of Microplastics in Riverine Ecosystem. Water 2021, 13, 2710. [Google Scholar] [CrossRef]
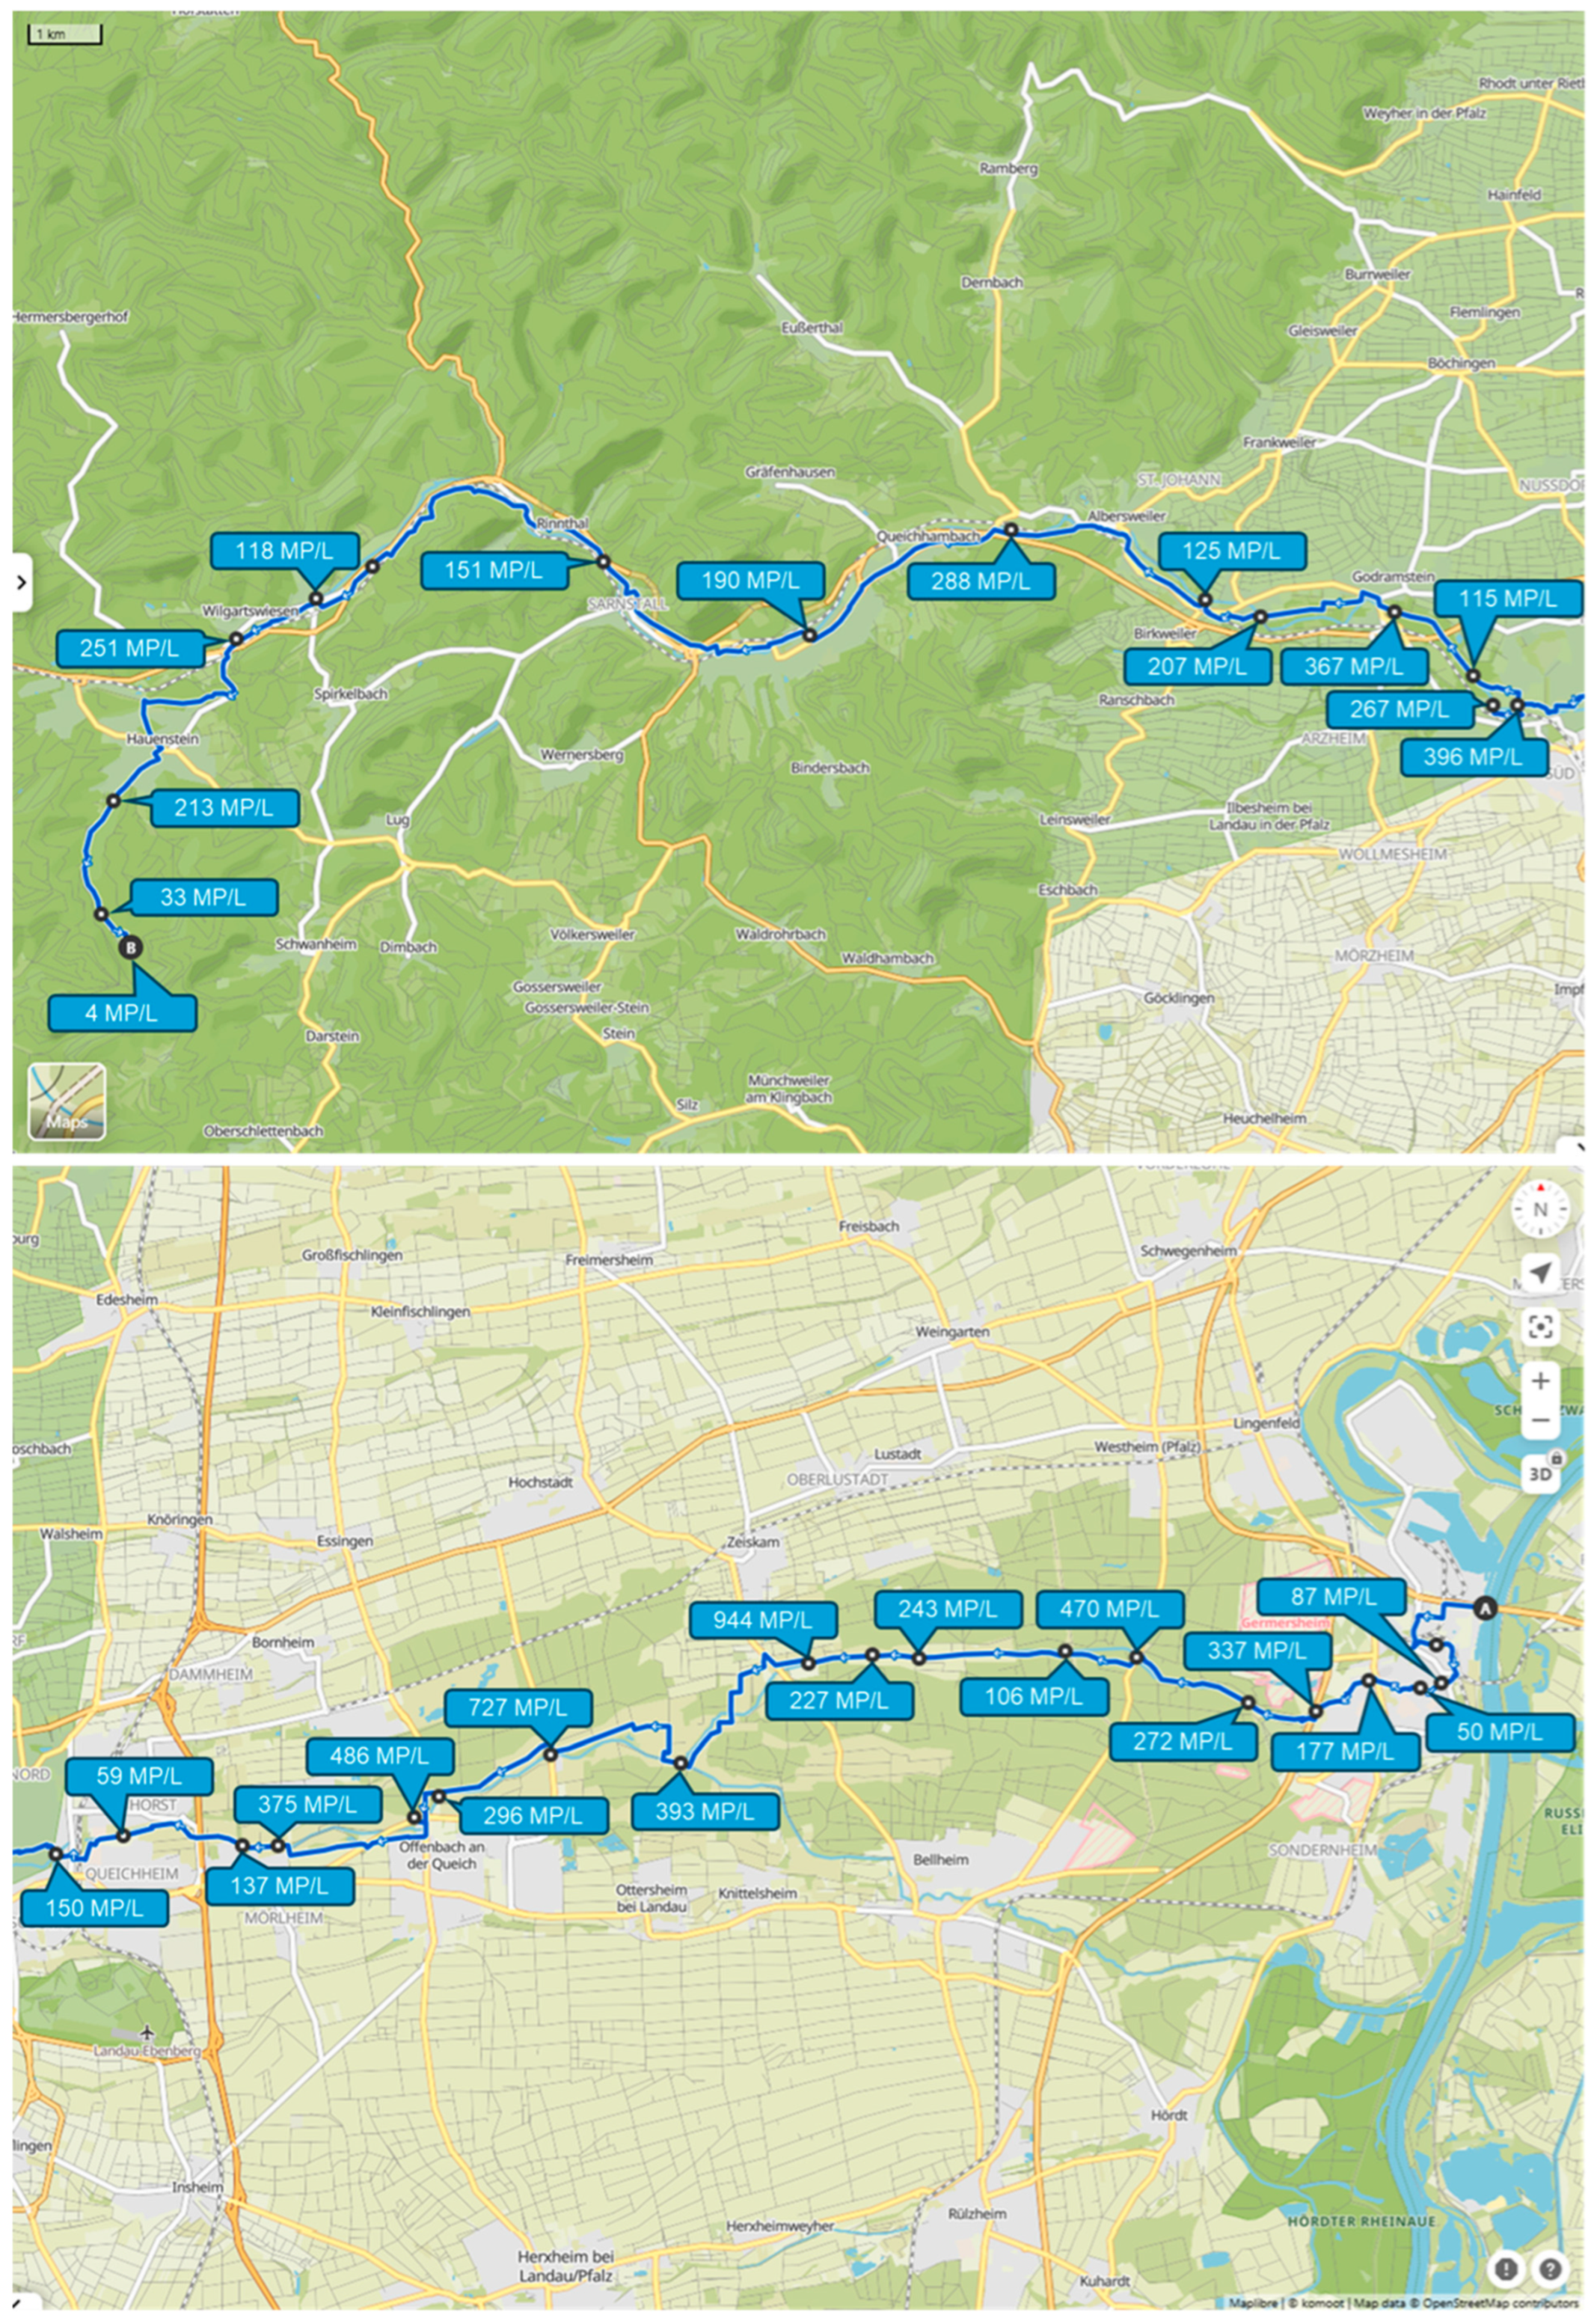
Figure 1. Map of the sample locations and detected microplastic concentrations along the Queich, divided into western (top) and eastern (bottom) halves. Source of the map: Maplibre|© Komoot|Map data © OpenStreetMap.
Microplastics 04 00063 g001
Figure 2. Boxplot and correlation plot of the microplastics measured at the WWTP Landau and the river Queich, approx. 400 m downstream of the outlet of the WWTP Landau. PSU: 100 L filtration; grab samples: 0.5 L samples taken with a glass bottle. * = p < 0.05; ** = p < 0.01.
Microplastics 04 00063 g002
Figure 3. Temporal course of microplastics measured at the WWTP Landau and the river Queich, approximately 400 m downstream of the outlet of the WWTP Landau. PSU: 100 L filtration; grab samples: 0.5 L samples taken with a glass bottle.
Microplastics 04 00063 g003
Figure 4. Scheme of the sample volume and processed quantities for PSU and grab samples.
Microplastics 04 00063 g004
Figure 5. Correlation of microplastics measured at the river Queich long-term monitoring and the additional environmental parameters of air temperature, precipitation, water temperature, conductivity, water level, and the discharge volume of the WWTP Landau. * = p < 0.05; ** = p < 0.01; *** = p < 0.001. Green dots = data points of the samples. Blue line = correlation (loess smooths) with 95% confidence interval in light blue.
Microplastics 04 00063 g005
Table 1. Summary of the MP detection data in the sampled rivers.
LocationMeanS.D.MedianMinMaxNo. Samples
UnitMP/LMP/LMP/LMP/LMP/Ln
Queich264195235494432
Alb9854782718821
Rehbach540476359123176110
Table 2. Percentage of the MPs in the Queich caused by the WWTP Landau, excluding the rainwater overflow.
Sample Type QueichTotal MP/sWWTP MP/sWWTP Contribution (%)
Grab224,5807\z4803.33%
PSU1,028,5600.73%
Table 3. Summary of the MP detection of the rainwater overflow from the WWTP Landau-Mörlheim.
DateMP Concentration [MP/L]
03.01.202441
22.02.202486
17.05.20242255
09.01.2025190
27.01.2025314
Mean577
S.D.844
Max2255
Min41
Disclaimer/Publisher’s Note: The statements, opinions and data contained in all publications are solely those of the individual author(s) and contributor(s) and not of MDPI and/or the editor(s). MDPI and/or the editor(s) disclaim responsibility for any injury to people or property resulting from any ideas, methods, instructions or products referred to in the content.