Article

A Novel Approach for Characterization of Microplastic Pollution in the Chesapeake Bay

1
Department of Biology, Morgan State University, Baltimore, MD 21251, USA
2
Patuxent Environmental and Aquatic Research Laboratory (PEARL), Morgan State University, Saint Leonard, MD 20685, USA
3
Oberoi International School, Mumbai 400060, India
*
Author to whom correspondence should be addressed.
Microplastics 2025, 4(3), 53; https://doi.org/10.3390/microplastics4030053
Submission received: 25 April 2025 / Revised: 4 June 2025 / Accepted: 4 August 2025 / Published: 22 August 2025

Abstract

Microplastic pollution in the Chesapeake Bay is of critical concern as estuaries serve as habitats and nurseries for diverse aquatic organisms and offer vital ecological services. However, quantitative analysis of microplastics, especially those smaller than 300 µm, in the natural aquatic environment is very challenging due to a lack of efficient sampling methods. This study takes a novel approach to quantify the abundance, size distribution, and morphological characteristics of microplastics, as small as 20 µm, in the surface waters of the Chesapeake Bay. Water samples (10 L) were collected monthly from July 2023 to October 2023 at four locations along the Chesapeake Bay. The samples were digested with a 10% potassium hydroxide solution and subjected to density separation using sodium chloride (ρ = 1.2 g/cc). Microplastic particles were examined using a Shimadzu AIM–9000 FTIR microscope for enumeration and chemical identification. Overall, the mean microplastic concentration observed was 766.16 ± 302.59 MP/L, significantly higher than previously estimated in the Chesapeake Bay. Microplastic abundance exhibited a significant (p = 0.02) spatial variation across the four sampling locations. Most abundant were particles less than 100 µm (60.65%), followed by particles between 100 µm and 300 µm (23.19%), and particles exceeding 300 µm (16.16%). Morphological analysis identified fragments as the dominant shape (86.02%), followed by fibers (11.87%), and beads (2.10%). This study underscores the importance of standard and efficient sampling methods in microplastics research. By sampling microplastics as small as 20 µm, this research demonstrated that the abundance of microplastics in the Chesapeake Bay is significantly higher than previously estimated and dominated by smaller–sized particles. These small microplastics are more likely to enter the food web where human exposure may occur. Therefore, microplastic pollution in the Chesapeake Bay ecosystem has the potential to impose environmental and public health risks.

1. Introduction

Plastic pollution has emerged as a significant global challenge, primarily due to plastics being cost–effective, lightweight, moisture–resistant polymeric materials that can be tailored to meet diverse storage and application requirements [1]. It is estimated that approximately 380 million metric tons of plastic were produced in 2015 [2], contributing to a cumulative global production of around 10,000 teragrams between 1950 and 2023 [3]. This number is projected to continue to increase over time. The high volume of plastic production, coupled with inadequate waste management practices and resistance to degradation has led to pervasive accumulation in the environment [1]. Microplastic pollution has been detected in remote mountain ranges, from Arctic sea ice to the Antarctic, deep in ocean trenches, and in the Great Pacific Garbage Patch located within the Pacific Ocean [4]. While plastics may not rank as the most toxic pollutants, their abundance and persistence make them the most encountered particles by marine organisms [5]. Microplastics, defined as plastic particles smaller than 5 mm [6], originate from two main sources: primary microplastics–intentionally manufactured for domestic or industrial applications, such as exfoliating agents in facial scrubs, toothpaste, or resin pellets, and secondary plastics–resulting from the breakdown of larger plastic material, particularly from exposure to sunlight [7]. In sunlight, the ultraviolet (UV) rays oxidize the polymer matrix, leading to photodegradation [8]. The degraded fragments, fibers, films, beads, and granules subsequently enter marine ecosystems. Over the past four decades, these micro–sized plastic debris have steadily accumulated in the marine environment [9].
Chesapeake Bay, the largest estuary in the United States, connects multiple river basins to the Atlantic Ocean and encompasses numerous sub–estuaries [10,11]. It supports over 3600 species, including blue crabs, Eastern oysters, striped bass, and Atlantic menhaden, and serves as a critical spawning, nursery, and feeding ground [12,13]. Preserving the biodiversity of the Chesapeake Bay is vital for maintaining ecosystem stability and resilience. Any disruption to its biodiversity can destabilize the food web potentially causing population decline. The Chesapeake Bay provides essential ecological services like flood mitigation, carbon storage, and climate regulation [14]. However, it is also a sink for pollutants originating from various sources, including wastewater and industrial discharges, agricultural runoff, atmospheric deposition, and marine activities [15,16]. Microplastics are released into waterways through industrial discharge effluent from plastic manufacturing and processing facilities [15]. Agricultural runoff may transport microplastics derived from plastic mulch, coated fertilizers, and degraded greenhouse coverings into the Chesapeake Bay [15]. Atmospheric deposition also plays a role in airborne microplastics settling into aquatic environments. Additionally, discarded fishing gear, such as nets and lines, contributes to microplastic pollution as they degrade over time [17]. Wastewater contains microbeads from personal care products and synthetic microfibers from laundering synthetic textiles [15], which often bypass wastewater treatment processes. Collectively, these sources lead to the accumulation of microplastics in the Chesapeake Bay, posing ecological risks to marine life and potentially impacting human health through various exposure routes, most notably through the food chain [16].
Due to their minuscule size, microplastics are bioavailable to all organisms in the food web, making ingestion more common than larger plastic debris [18]. They are similar in size to naturally available food sources and therefore commonly mistaken for food [18]. Microplastics are also hydrophobic which results in sorption of organic pollutants in aquatic environments where ingestion by organisms can potentially cause toxicity and reproductive harm [19]. Ingested microplastics can either accumulate within the organism or be expelled as pseudofeces, a specialized method of excretion to expel particles that cannot be used as food. If not expelled, accumulation could result in blockages of the gut leading to physiological stress and reduced fertility [20]. Furthermore, if microplastics block the digestive tract, it may lead to false food satiation in organisms [20], which results in a decline in feeding capacity and reduces body energy reserves, thus impacting an organism’s growth [21]. Additionally, studies have shown that microplastics not only influence an organism’s behavior and reproduction but can also affect biodiversity and habitat change at the ecosystem level [15].
The Chesapeake Bay, and its tributaries, are of vital importance to those who depend on it for sustenance, work, and recreation. There is growing concern about the impacts of microplastic pollution on this critical ecosystem. Significant research gaps exist in quantifying the extent of microplastic pollution in aquatic environments. Reliable methods for sample collection, extraction, and identification in quantitative assessments of microplastics remain elusive [22] primarily due to varied chemical composition, density, size, and shape. In addition, there is high variability in sampling techniques required to recover microplastics from distinct environmental matrices, including coastal deposits, surface water, and bottom sediments. Previous studies conducted to elucidate the abundance of microplastics using the manta trawl net had the limitation of only capturing microplastics greater than 300 µm in size, resulting in an underestimation in quantification [9]. Additionally, manta and neuston nets are made of plastics and can easily get clogged or ripped due to suspended solids and strong water currents. Alternatively, using a pump to collect surface water can also clog sieves with small pore sizes. This study focuses on elucidatingthe extent of microplastic pollution in the surface waters of the Chesapeake Bay. This study aims to quantify the size, shape, abundance, and distribution of microplastics by capturing particles, as small as 20 µm, through composite sampling using simple tools. Incorporating smaller sized fractions is crucial for risk assessment because these smaller particles are more bioavailable to planktivorous and filter–feeding organisms within aquatic ecosystems [23]. Additionally, this study contributes to the standardization of protocols for microplastic sample collection, abundance estimation, and result reporting, facilitating more consistent and comparable assessments of microplastic pollution.

2. Materials and Methods

2.1. Study Site

Surface water samples were collected monthly from four locations in the Chesapeake Bay between July 2023 and October 2023 (Figure 1). At each site, a 10 L surface water sample was collected. The selected locations along the Chesapeake Bay in Maryland included: Havre De Grace (39.55486 N 76.09145 W), Dundee Creek Marina (39.35166 N 76.35879 W), Baltimore’s Inner Harbor (39.28160 N 76.61080 W), and the Patuxent Environmental and Aquatic Research Laboratory (PEARL) (38.39428 N 76.50382 W). The four sampling sites represent diverse environmental settings within the Chesapeake Bay watershed. Havre de Grace, Maryland, an urban area at the Susquehanna River sub–estuary, is influenced by the largest watershed in the Chesapeake Bay, which contributes 51% of its freshwater inflow and spans urban, industrial, and agricultural land uses [24]. Dundee Creek Marina, located in a state park at the Gunpowder River sub–estuary in Middle River, Maryland, is downstream of a landfill and sewage treatment plant, with surrounding urban, suburban, and rural land uses. Baltimore’s Inner Harbor, a major seaport at the mouth of the Jones Falls in Baltimore, Maryland, is characterized by dense urban development and mixed land uses. The fourth site, the PEARL, lies in Jefferson Patterson State Park within the Patuxent River sub–estuary in Saint Leonard, Maryland, where the watershed supports a population of approximately 800,000 people and consists of forests, croplands, grasslands, and impervious surfaces [25].

2.2. Sample Collection and Processing

A short–term composite sampling method was employed using simple tools for monthly sample collection at four locations over four months. To minimize plastic contamination during sample collection and extraction, all reagents were freshly prepared using glass beakers and bottles, and white cotton lab coats were worn in the laboratory to reduce the fiber shedding from synthetic clothing material. Water samples (10 L per location per month) were collected by a 1 L steel container attached to a telescopic pole. The samples on the collection site were passed through stacked 5 mm and 20 µm steel sieves (Gilson), particles > 5 mm were discarded while those retained on the 20 µm sieve were rinsed with deionized water and transferred to a glass mason jar. The jars were transported to Morgan State University in a cooler at ambient atmospheric temperature. In the laboratory, a modified National Oceanic and Atmospheric Administration protocol was followed for the extraction of microplastics from the collected samples [26]. The samples were treated with 10% potassium hydroxide (KOH) solution (Thermo Fisher Scientific, Pittsburg, PA, USA) for 48 h to digest biogenic organic matter without damaging the microplastics [27]. The digested samples then underwent density separation using a sodium chloride (NaCl) solution (Thermo Fisher Scientific, Pittsburg, PA, USA) with a density of 1.2 g/cc [7]. The samples with NaCl solution were placed in a glass funnel attached to a tube and pinch clamp, then left undisturbed for 24 h to allow denser materials (sands, debris, etc.) to settle while microplastics remained afloat. The upper layer containing microplastics was then collected onto a 20 µm steel sieve and rinsed with DI water to remove residual NaCl. The material retained on the sieve was transferred into a glass beaker with deionized (DI) water. The sample was then subjected to vacuum filtration (MilliporeSigma, Burlington, MA, USA) and microplastics were collected on a 25 mm silver membrane filter (Sterlitech Corporation, Auburn, WS, USA) with a 5 µm pore size.

2.3. Sample Analysis

Silver membranes with extracted microplastics were analyzed by the AIM–9000 Fourier Transform Infrared (FTIR) microscope (Shimadzu Scientific Instruments, Columbia, MD, USA) for size, shape, chemical composition, and abundance. The analysis was performed in reflectance mode, resolution 8 (two peaks separated by 8 cm−1 are resolved as separate peaks), mirror speed 9, using a 15× reflection objective mirror. For each microplastic chemical identification, the measurement mode was absorbance where an average of 30 scans were obtained and a score of ≥600 was chosen for the particle to be considered a microplastic. The score indicates the correlation between the sample and key spectral features with reference material. The FTIR spectrum was analyzed in the IR (Infrared) range from 700.0 to 4500.0 cm−1 for the characteristic peaks using the in–built spectral library, which includes the spectra from pristine as well as UV and thermally degraded microplastics. An in–house curated spectral library was also developed for microplastic chemical composition identification. The AIM–9000 FTIR microscope features automated analysis and an advanced wide–field camera for high–sensitivity microplastics analysis. The system allows the infrared spectra measurement while displaying a visible image of the sample. The microplastic samples on the silver membrane filters were enumerated at 150× using a random field technique [28]. A minimum of 20 random fields (300 µm × 400 µm) and approximately 100 individual particles were enumerated to estimate microplastic abundance. The selected 20 fields represent approximately 4% of the total surface area of the silver membrane filter. The mean particle count from these randomly sampled fields was used to extrapolate the total number of microplastics present on the membrane, providing a statistically robust estimate of microplastic abundance. Randomly chosen microplastics, between 90 and 100, were analyzed to calculate the proportions of microplastics present in each sample in different size ranges, and the morphology of the particles was recorded for the size and shape analysis of the microplastic particles. Raw experimental data are available in the Supplemental Materials.

2.4. Statistical Analysis

The estimated abundance of microplastics in the Chesapeake Bay was expressed in mean ± standard deviation. Microsoft Excel (Microsoft 365 Enterprise, 2024) and RStudio (2024.12.0+467) were used for graphs, analysis of variance (ANOVA), and chi–square tests for homogeneity. The microplastics collected at the four locations within the same month were used as four replicates for a monthly average. Similarly, the average microplastics obtained per location were also calculated by using the four monthly collections. A two–way ANOVA analysis was used to compare the difference in the mean microplastics between the four locations and four months in the Chesapeake Bay. The p–value was set at 0.05. Regarding the shape and size of the microplastics, a chi–square test of homogeneity was performed to test if the proportions of different sizes and shapes are conserved, location–wise, and monthly.

3. Results

3.1. Temporal and Spatial Distribution of Microplastics Abundance in the Chesapeake Bay

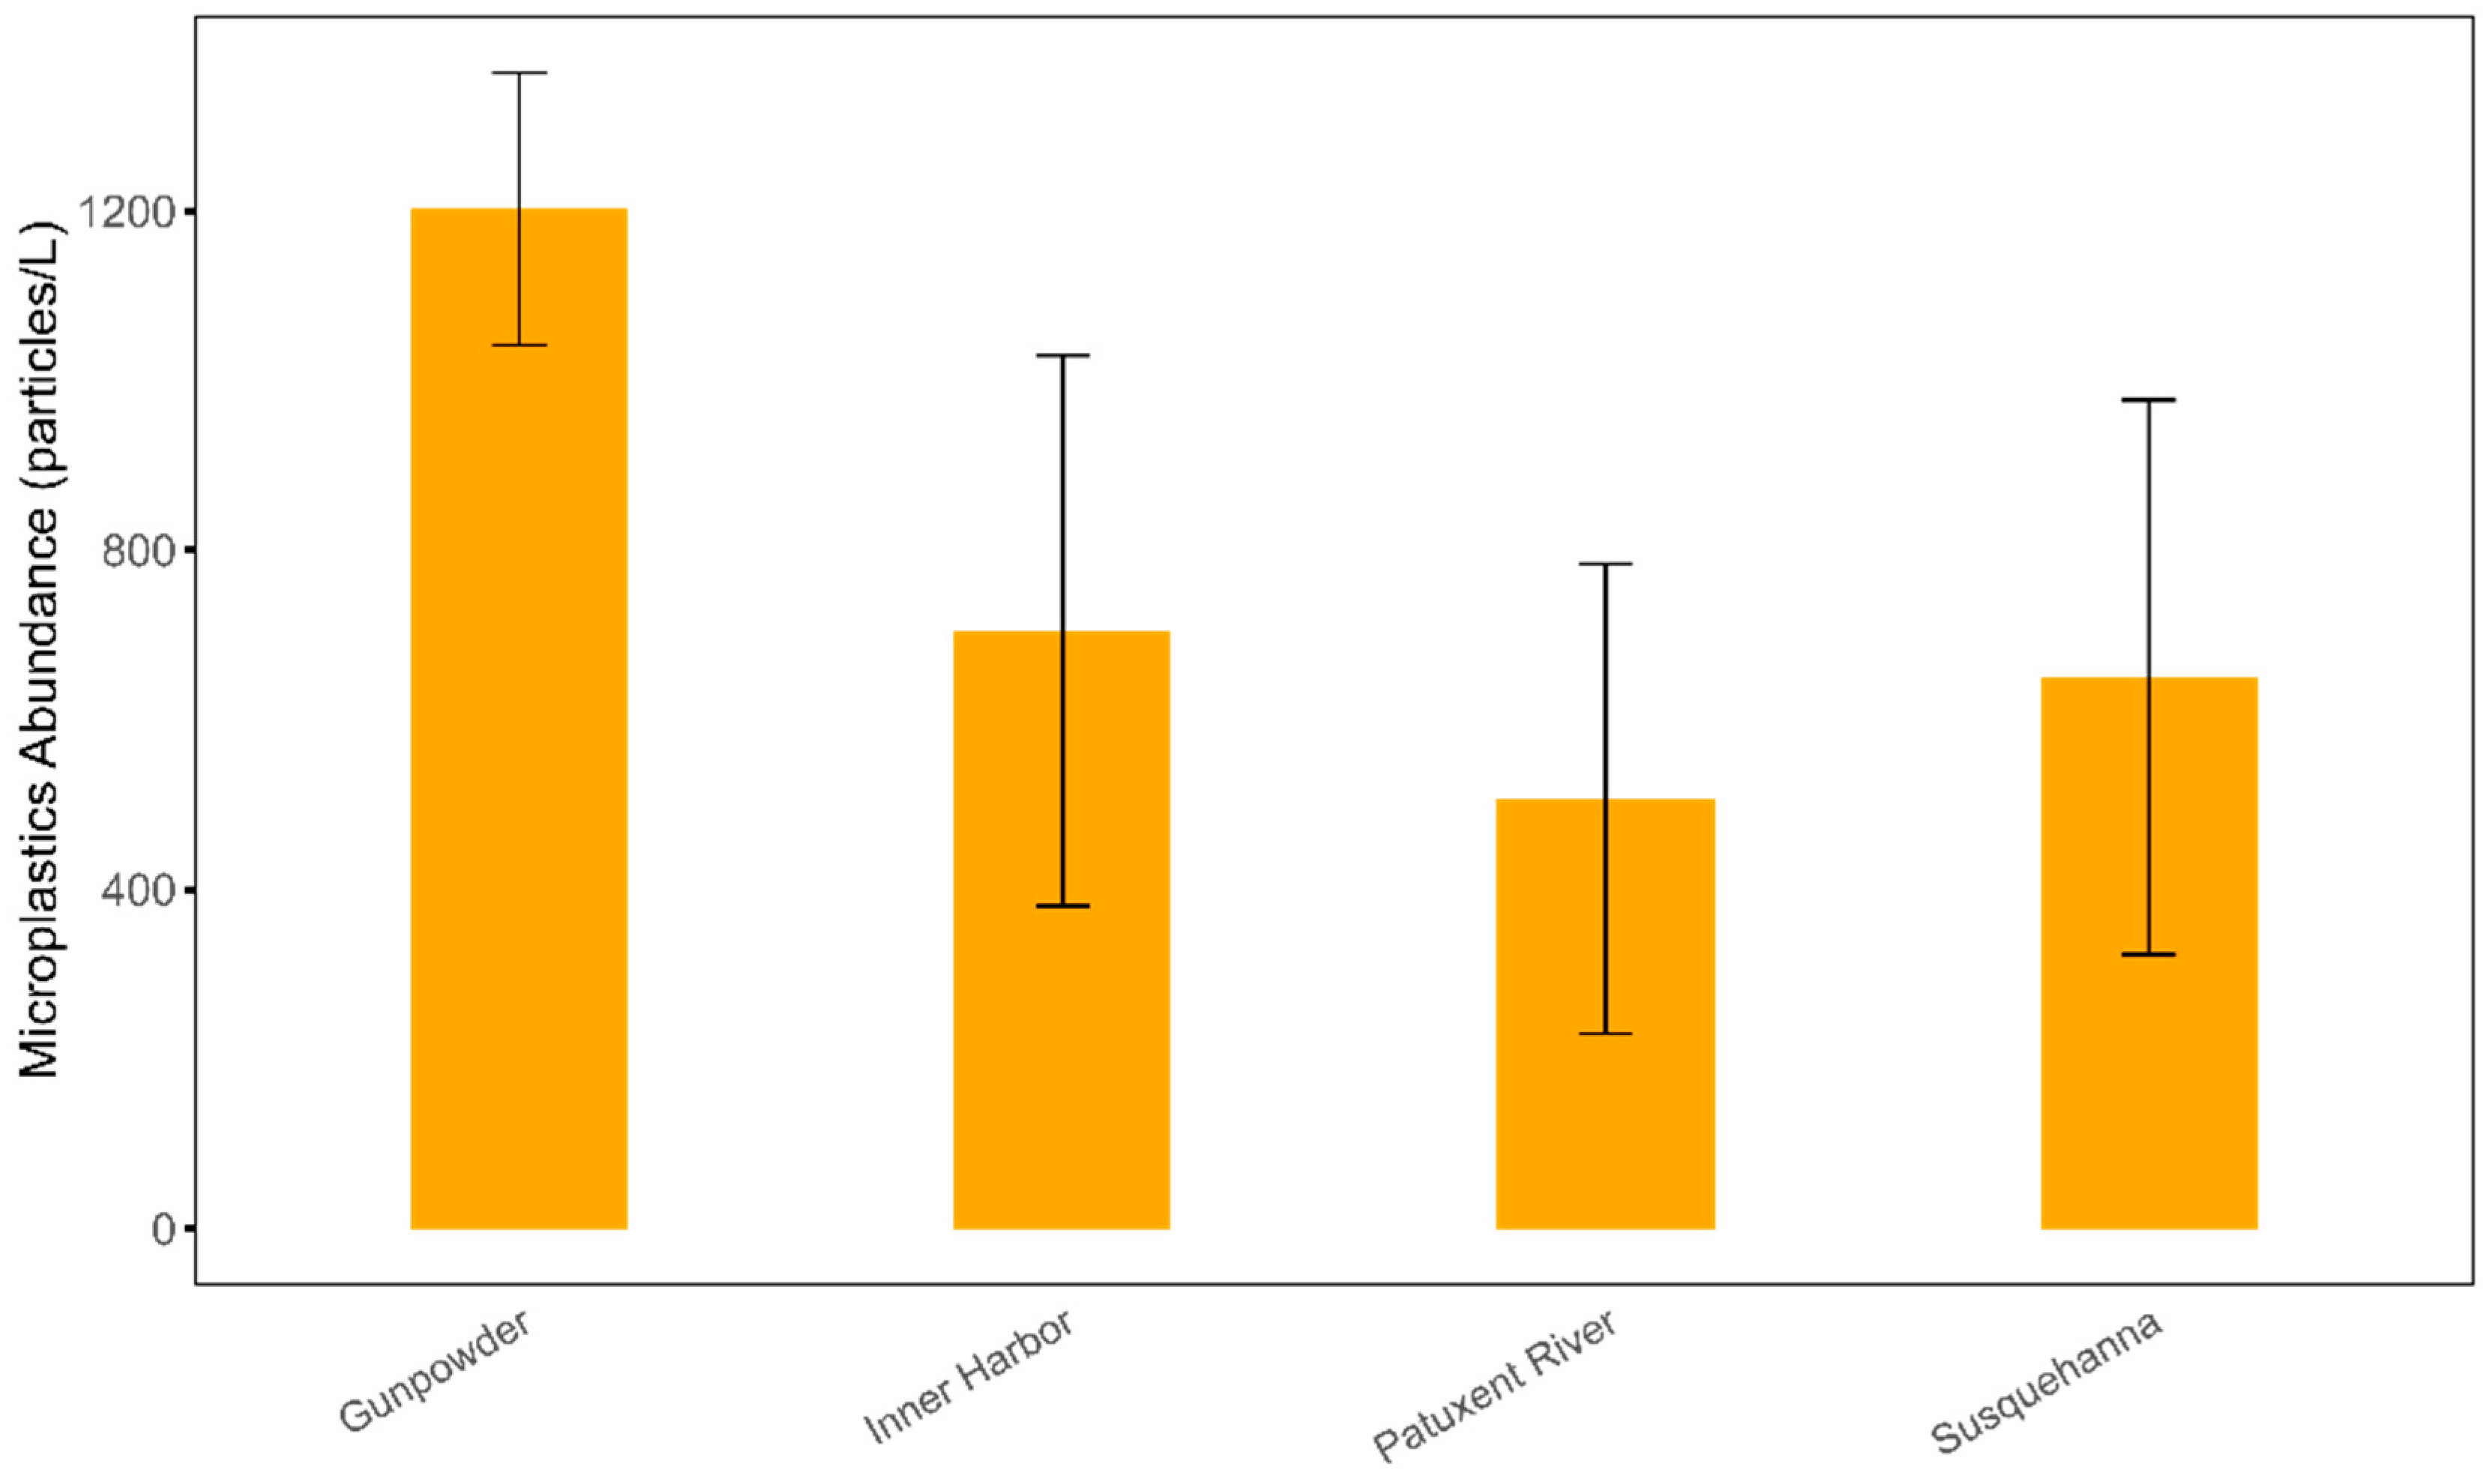
Microplastic abundance (MP/L) across the four locations in the Chesapeake Bay exhibited significant spatial heterogeneity (Figure 2). Mean concentrations varied significantly among locations (one-way ANOVA, p = 0.022), with Gunpowder River demonstrating the highest overall abundance (mean ± SD: 1202.38 ± 160.39 MP/L), followed by Baltimore’s Inner Harbor (705 ± 324.52 MP/L), Susquehanna River (650.48 ± 326.92 MP/L), and Patuxent River (506.8 ± 277.11 MP/L). The Patuxent River displayed the greatest variability, with values ranging from 152.8 MP/L (August) to 829.5 MP/L (October). In contrast, Gunpowder River maintained consistently higher concentrations across all months.
Microplastics abundance in the Chesapeake Bay does not show a significant temporal pattern, (F = 0.483, p = 0.7002). While Gunpowder River and Baltimore’s Inner Harbor showed relatively stable monthly trends (coefficient of variation [CV] = 13.3% and 46%, respectively), Susquehanna River and the Patuxent River exhibited sharper fluctuations (CV = 50.3% and 54.68%, respectively). As shown in Table 1, Susquehanna River’s September abundance (1114.4 MP/L) exceeded its July baseline (603 MP/L) by 59.56%, whereas the Patuxent River’s October concentration (829.5 MP/L) surpassed its August minimum (152.8 MP/L) by 137.78%. These patterns underscore the interplay of location–specific and seasonal drivers in microplastic abundance distribution.

3.2. Spatiotemporal Distribution of the Microplastics Sizes in Chesapeake Bay Surface Water

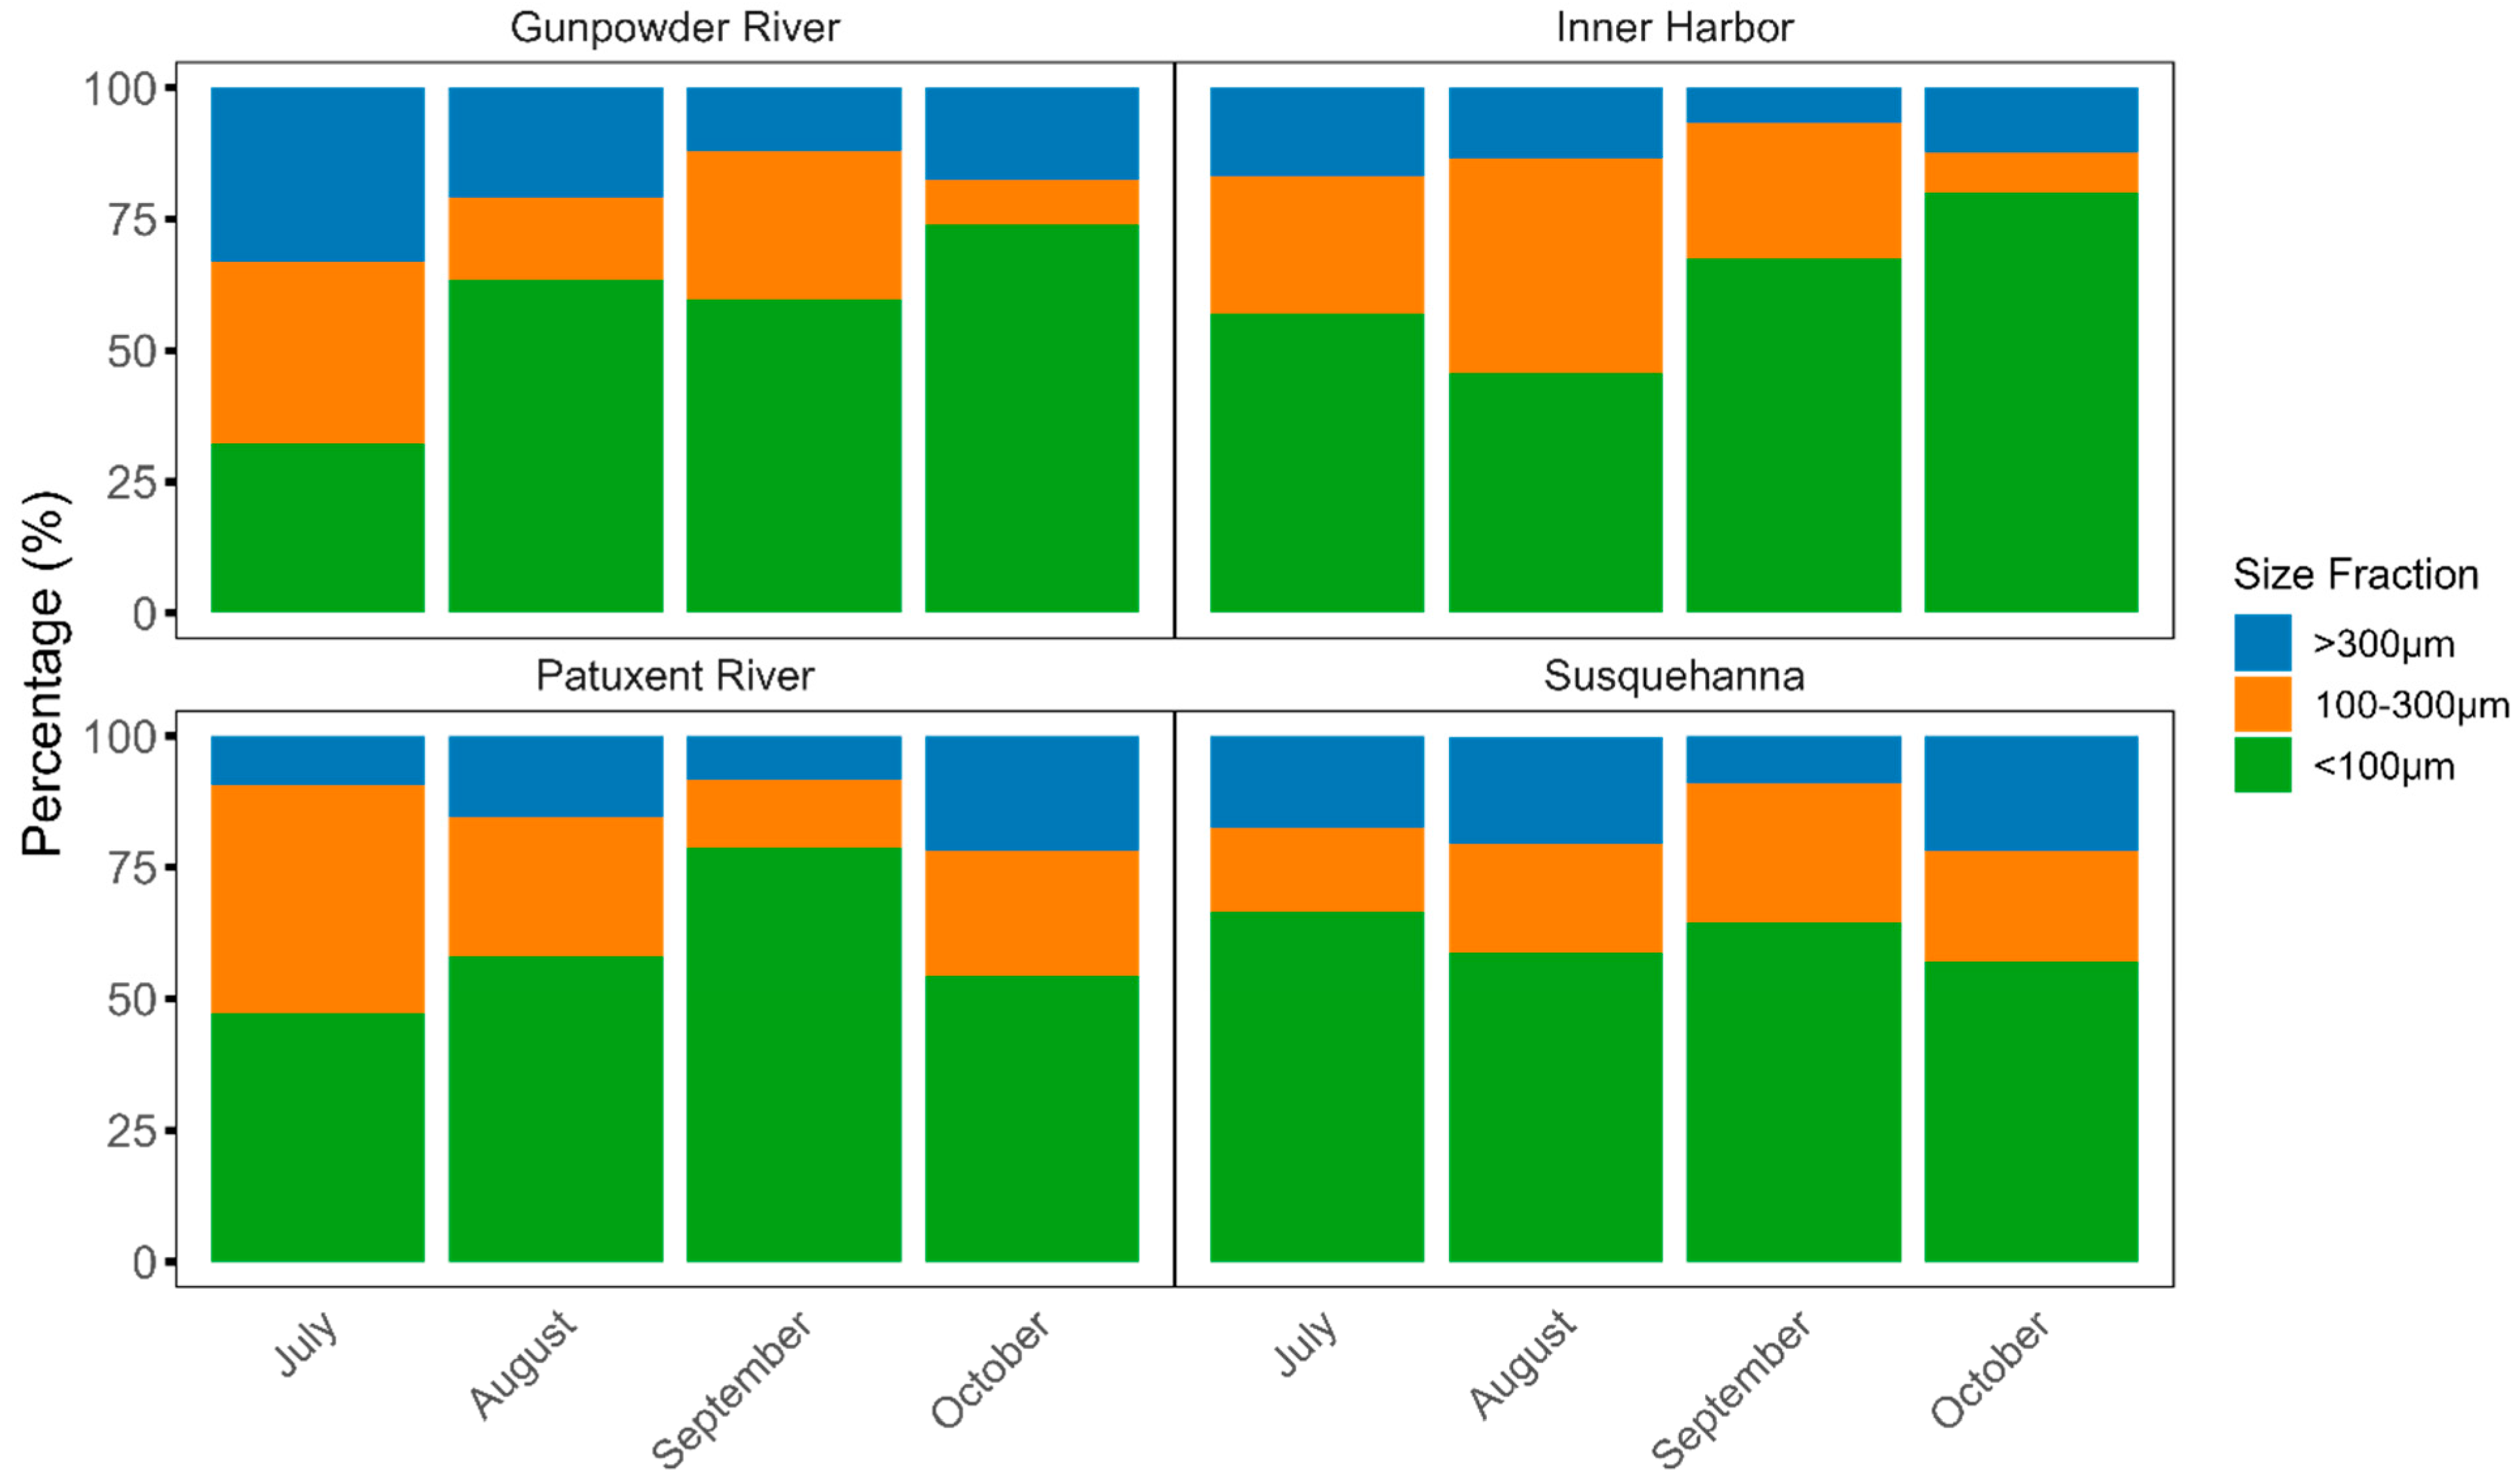
Microplastic size fractions were analyzed across four locations (Susquehanna River, Gunpowder River, Baltimore’s Inner Harbor, and Patuxent River) in the Chesapeake Bay from July 2023 to October 2023 (Figure 3). Microplastics were divided into three size fractions: >300 µm, 100–300 µm, and <100 µm, respectively, with abundances and percentage distributions reported. The size fraction analysis revealed a consistent dominance of smaller microplastic particles (<100 µm) across all sampling locations and months, constituting 45.7–80.2% of total abundance. Spatial heterogeneity was evident: the Gunpowder River displayed relatively balanced distributions in July (32.3–34.6% across size classes), contrasting with a shift toward larger particles in the Patuxent River in October (>300 µm: 21.7%, vs. 8.3% in September). These patterns highlight the ubiquity of small microplastics and location–specific seasonal dynamics, potentially reflecting differential pollution sources, hydrodynamic conditions, or degradation processes across the Chesapeake Bay watershed.
Overall, microplastic size fractions in the Chesapeake Bay were overwhelmingly dominated by particles < 300 µm (Figure 4) across all locations and seasons, consistently comprising 76% (±8% SD) of total abundance. This fraction, which cannot be sampled by conventional manta net, exhibited minimal spatial variability, with proportions ranging from 67% (Gunpowder River in July) to 91.74% (Patuxent River in September), and temporal stability, maintaining >70% prevalence even during peaks in larger particle inputs (e.g., Susquehanna River’s >300 µm fraction reached 21.9% in October). While minor seasonal fluctuations occurred (e.g., Gunpowder River’s > 300 µm fraction declined from 33% in July to 17% in October), the <300 µm fraction remained the predominant size class, underscoring ubiquity irrespective of localized hydrodynamic or anthropogenic drivers.

3.3. Spatiotemporal Distribution of Microplastics Morphology in Chesapeake Bay Surface Water

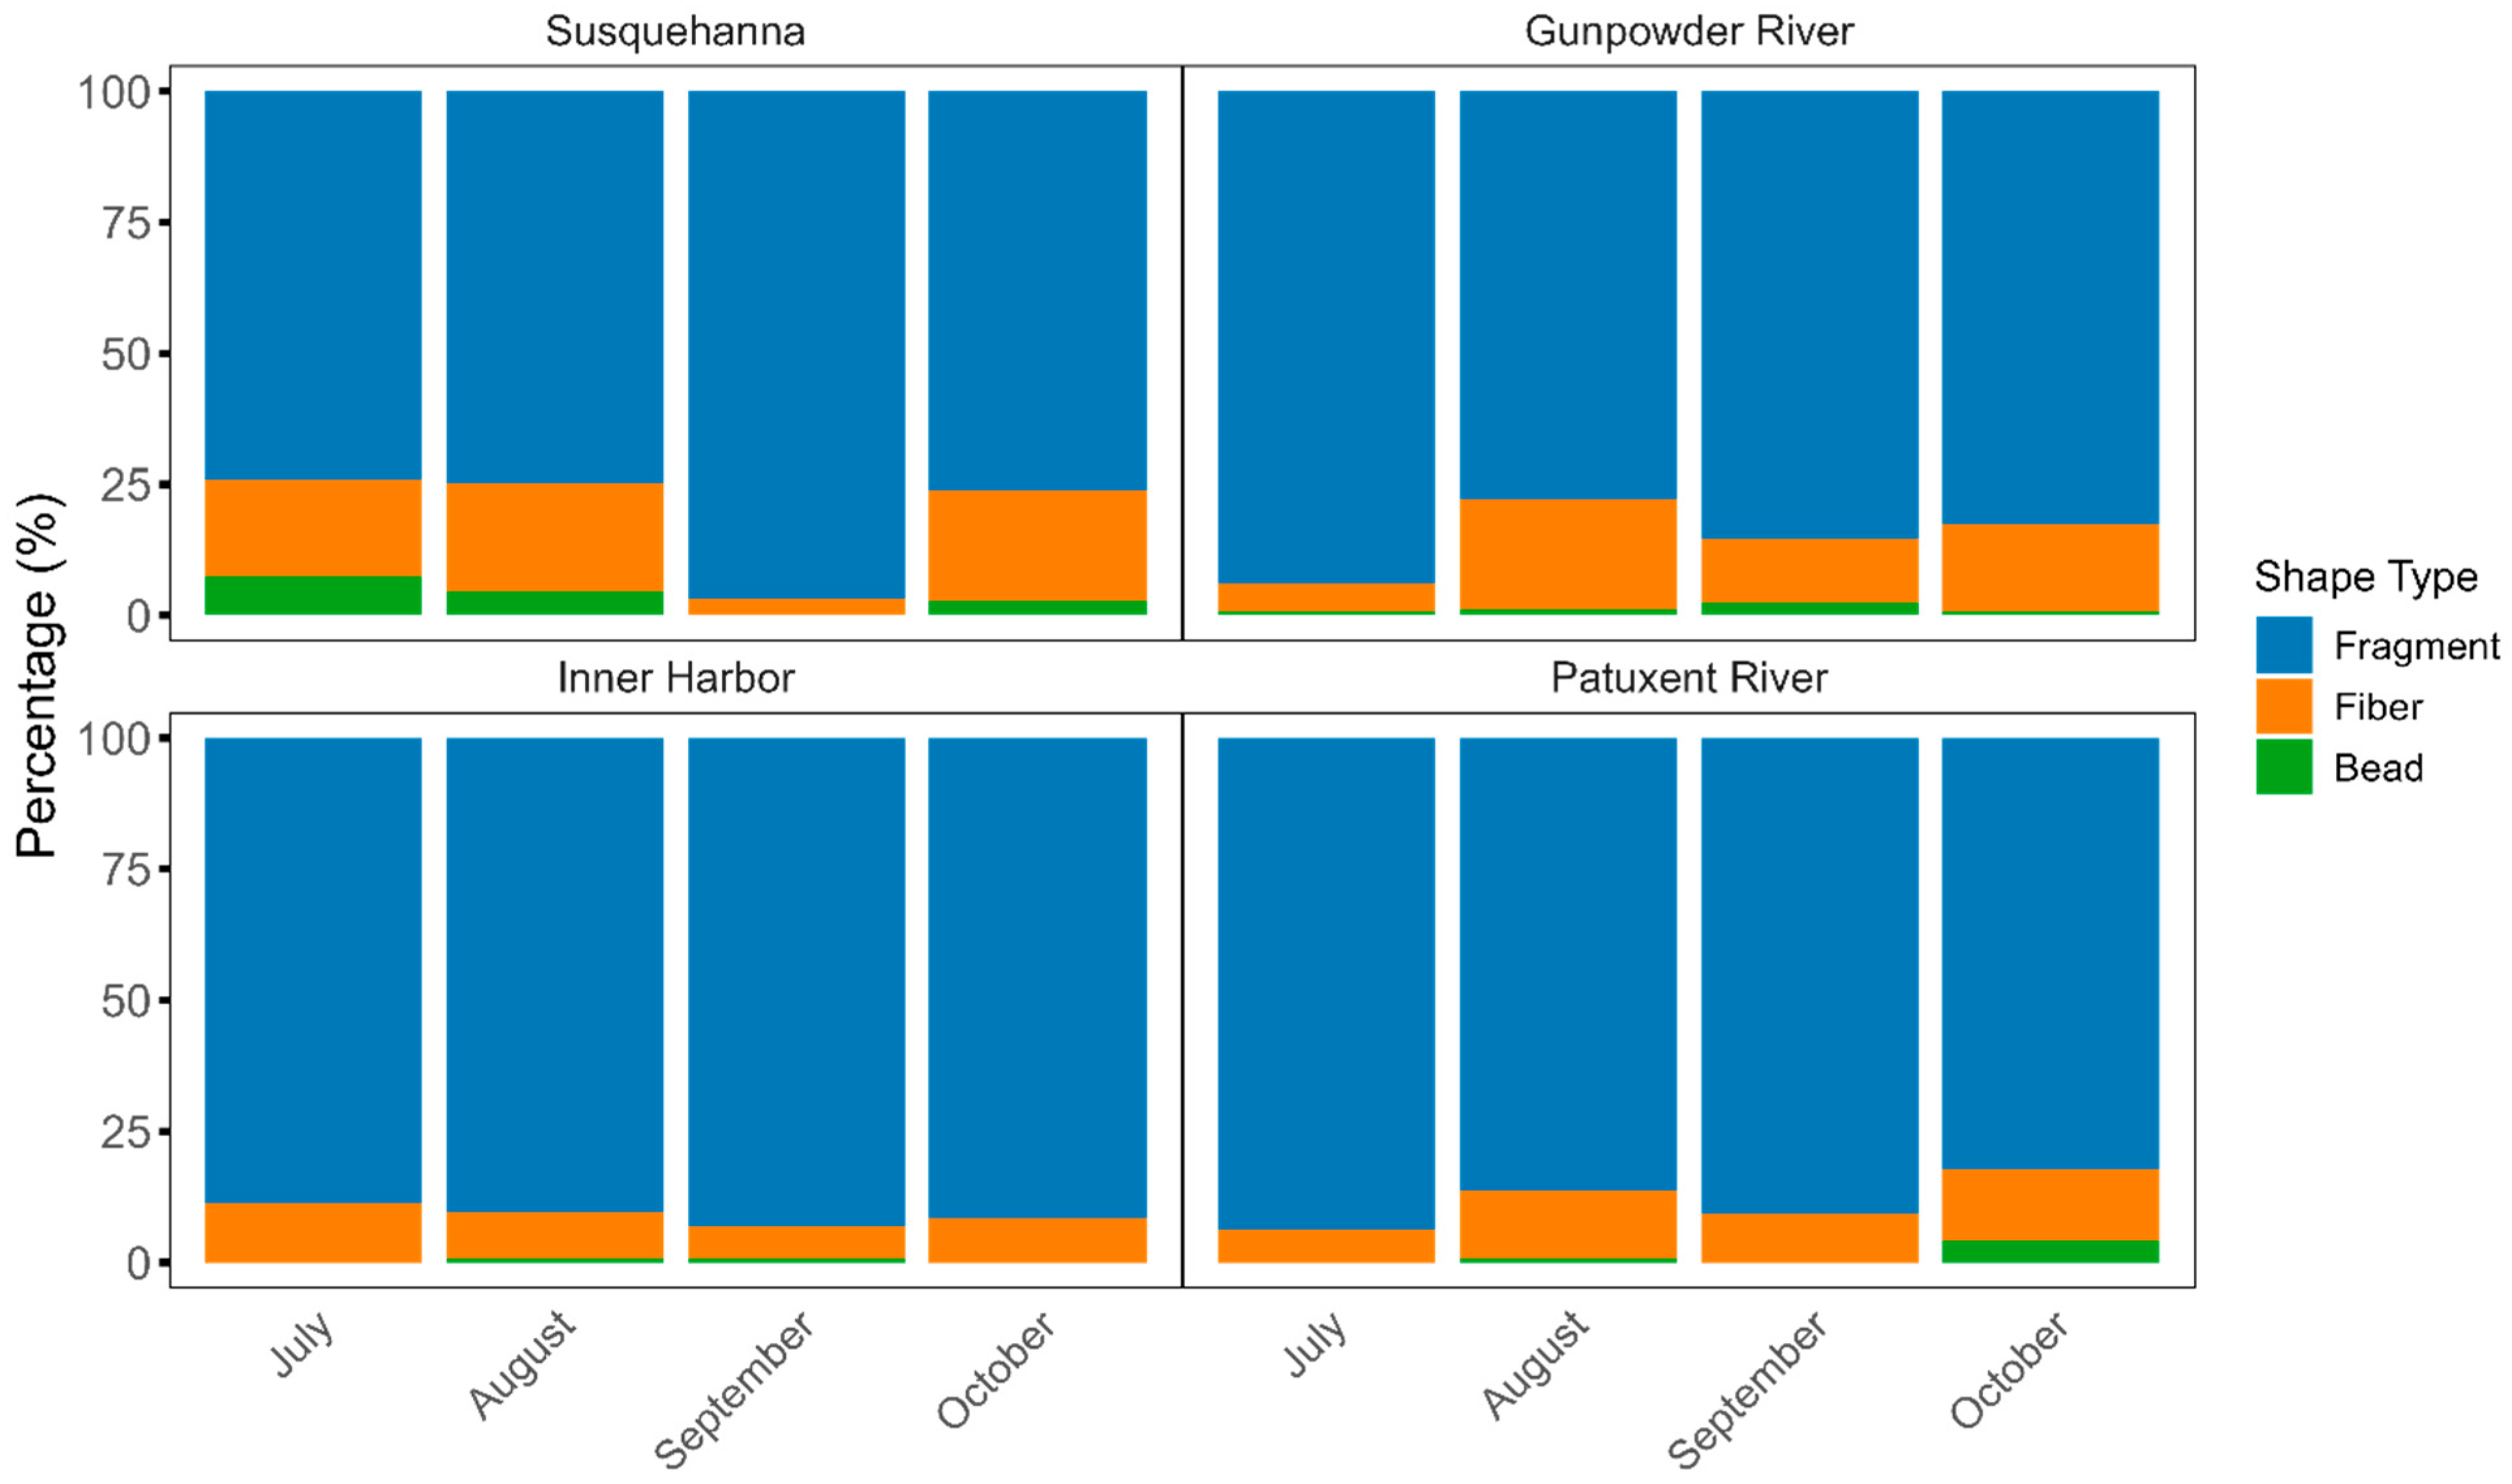
All collected microplastics were grouped under one of the three categories of shape: fragment, fiber, and bead. Randomly chosen microplastics, between 90 and 100, per silver membrane, were analyzed to calculate the proportions of the different shapes captured during sampling. The microplastic shape analysis revealed pronounced dominance of fragments across all sampling locations and months, constituting 74.1–97.0% of total particles (Figure 5). This fragment predominance was particularly evident in September, where all locations exhibited >85% fragment composition, peaking at 97.0% in September for Susquehanna River. Fibers represented a secondary component (3.0–21.0%), with spatial variability most pronounced in the Gunpowder River, where fiber percentages fluctuated seasonally (5.3% in July to 20.9% in August). Beads were largely negligible (<5.0%) except for isolated instances, such as the Patuxent River (4.2% in October).
Spatial patterns highlighted location–specific dynamics: the Baltimore’s Inner Harbor demonstrated consistency in fragment dominance (88.8–93.2%), likely reflecting stable urban runoff inputs, while the Gunpowder River exhibited elevated fiber proportions (5.3–20.9%), potentially tied to textile–related pollution in landfill and sewage treatment plant from upstream sources

4. Discussion

The current study reports an average microplastics concentration of 766.16 ± 302.59 MP/L (766,160 ± 302,590 particles/m3) in the surface waters of the Chesapeake Bay. Although geographically different, this is comparable to a study conducted on the Yellow River surface water reporting an average microplastics abundance of 930 MP/L during the dry season [29], and a study conducted on the coastal area in Guangdong, China reporting microplastic abundance ranging from 850 MP/L to as high as 3500 MP/L [30]. On the other hand, the concentration reported in the current study is significantly higher than the findings of a prior study conducted in the same region, which documented a mean microplastic concentration of 0.160 ± 0.287 particles/m3 [6]. In the current study, the lowest recorded microplastic abundance was 15,300 particles/m3 at the Patuxent River, whereas the highest concentration was 1,349,000 particles/m3 at the Gunpowder River. These values are in stark contrast to those previously reported by Bikker et al. (2020) [6], where microplastic concentrations ranged from 0.007 particles/m3 (minimum) to 1.245 particles/m3 (maximum). The observed disparity between the present and previous studies could primarily be attributed to differences in sampling methodologies. The current study utilized a composite sampling technique employing simple collection tools, which enabled the retrieval of microplastics smaller than 300 µm. In contrast, studies that relied on neuston trawls and pump–based sampling are less effective in capturing smaller microplastics. A previously conducted study contrasting the grab sampling method with the neuston tow net reported an average 5.9 ± 4.4 MP/L via grab sampling compared to 0.005 ± 0.004 MP/L via neuston net [31], enhancing the detection of microplastics in the lower size range, thereby yielding concentrations that are three orders of magnitude higher than those reported in earlier studies [31]. Additionally, this cost–efficient method facilitates a more targeted and effective collection, as demonstrated by a study in Sweden that reported microplastic concentrations ranging from 167 to 102,500 particles/m3 using an 80 µm hand net [32].
Sampling approaches that utilize simple tools may also have inherent limitations. Unlike trawl–based or pump–based methodologies, which process larger volumes of water and can account for spatial heterogeneity, sampling using simple tools may underestimate microplastic patchiness due to a reliance on relatively small surface water volumes. A study conducted on Klang River estuary collected 1 L of surface water per sample and reported microplastic abundance ranging from 0.5 to 4.5 particles/L [33], this limitation highlights the necessity for methodological standardization in microplastics research to improve comparability across studies. Furthermore, the use of trawl–based sampling presents inherent challenges in estimating the actual volume of water filtered, as it is influenced by dynamic environmental variables such as boat velocity, wave action, and prevailing wind conditions. These factors contribute to continuous fluctuations in trawl depth, leading to potential variability in microplastic concentration estimates [34]. To enhance the comparability of microplastic abundance data across studies conducted in the Chesapeake Bay, it is imperative to establish standardized methodologies for both sampling and reporting. Implementing uniform protocols, such as adopting volume–based concentration metrics or integrating simple tools for sampling, would facilitate more robust cross–study comparisons and improve the accuracy of microplastic pollution assessments in aquatic environments.
Seasonal variability in microplastic distribution has been documented in the Chesapeake Bay, with studies reporting a significant seasonal trend characterized by an increase in floating microplastic concentrations from October to May, followed by a relative decline from June to September [10]. This pattern is attributed to seasonal hydrodynamic factors, including changes in precipitation, river discharge, wind–driven resuspension, and water column stratification, all of which influence microplastic transport and accumulation dynamics. The findings of the current study do not identify any statistically significant difference in the temporal distribution of microplastics; however, a slight increase in microplastic abundance in surface waters from 679.3 ± 398.47 MP/L during summer to 853.03 ± 289.46 MP/L in the fall was observed. Environmental conditions such as stormwater runoff, reduced water turbulence, and increased organic matter interactions may influence microplastic retention and redistribution. A study conducted on the Chesapeake Bay surface waters during the summer and fall seasons using neuston trawls reported microplastic concentrations ranging from 5534 ± 5134 particles/km2 to 297,927 ± 180,252 particles/km2, depending on the sampling location [35]. The methodological approach in a previous study quantified microplastic abundance based on surface area, complicating direct comparisons with the volume–based concentrations reported in the current study. The elevated microplastic concentrations observed in the Susquehanna River (September: 1114.4 MP/L), Gunpowder River (July: 1349 MP/L and September: 1164.2 MP/L), and Patuxent River (October: 829.5 MP/L) can be attributed to several interrelated factors, including seasonal weather patterns such as rainfall and storm events, land use such as wastewater treatment plant located near the collection site, and human activities such as boating, fishing and swimming, that facilitate the transport or resuspension of the microplastics.
In the present study, two–way ANOVA analysis revealed no statistically significant variation in the temporal abundance of microplastics across the four–month study period; however, a significant spatial variation in microplastic concentrations was observed. This spatial heterogeneity may be attributed to the geomorphological characteristics of the sampling locations, such as hydrodynamic conditions, proximity to anthropogenic sources, and sediment resuspension dynamics. Notably, the higher abundance of microplastics in the Gunpowder River sub–estuary is likely due to its proximity to the Eastern Sanitary Landfill solid waste management facility, situated upstream of the sampling site, along with potential contributions from the Harford County Sewage Treatment Plant, also located upstream. The lower concentration of microplastics in the Patuxent River sub–estuary may be attributed to the rural setting of the watershed with low anthropogenic impacts. These findings underscore the need for continuous monitoring with replicates, larger water volumes, and multi–scale spatial assessments to enhance the robustness of microplastic distribution analyses in aquatic ecosystems and better understand the influence of anthropogenic inputs.
Many of the previous studies regarding microplastic size distribution reported a continuous size spectrum [36]. As the microplastic abundance increases, the size fraction decreases [4]. A study conducted on Norway’s largest lake reported 60% of the microplastics found were less than 1 mm and 36% of the microplastics were between 1 and 5 mm [15]. A separate study conducted on Wei River in China reported 40.8% to 68.8% of the microplastics were less than 0.5 mm, 15.1% to 27.1% of the microplastics were between 1 and 2 mm, and concluded that the abundance of microplastics decreases with the size enlargement [37]. The current study also finds a similar trend regarding microplastic size and abundance. Overall, 60% of the microplastics ranged <100 µm, 23% from 100 to 300 µm, and 16% from >300 µm, indicating a trend of the smaller microplastics being more abundant compared to larger microplastics. A chi–square test for homogeneity revealed statistically significant differences in microplastic size proportions across different locations for three out of four months (July, August, and October). In July, the higher proportion of microplastics smaller than 100 µm from the Susquehanna River sub–estuary predominantly contributed to this variation. In August, the elevated proportion of microplastics within the 100–300 µm size range from the Baltimore’s Inner Harbor Jones Falls sub–estuary accounted for most of the observed difference. In October, the increased percentage of microplastics < 100 µm from Baltimore’s Inner Harbor Jones Falls sub–estuary primarily contributed to the observed variation. Studies have shown that grab sampling collects three orders of magnitude more microplastics as compared to neuston nets, with a remarkable difference in the reported microplastic sizes. Grab sampling captures smaller microplastics at higher proportions while neuston nets report capturing greater quantities of larger microplastics [31]. Our current study also reports an overwhelming proportion of microplastics that are <300 µm across all locations and seasons, consistently comprising 76% of the total abundance. Understanding the size fraction of microplastics is a very important parameter because the size correlates directly with the availability and potential impact on the ecosystem given smaller particles have stronger sorption capacity for hydrophobic pollutants and are accessible to a much wider range of organisms in an ecosystem [38]. A study conducted on mussels has shown that small microplastics have a larger gut retention time than large microplastics [39]. Another study observed a size–dependent microplastic effect on the life history and body length of Daphnia magna [40].
The commonly used categories to classify the different shapes of microplastics are fiber, fragment, film, flakes, pellets, beads, and foams [41]. To categorize the particles into these shapes, it is essential to know the three dimensions (length, width, and height), which are easy to deduce for large particles but more uncertain for small particles [42]. Furthermore, only two dimensions are visible under a microscope. Therefore, in the current study, we choose only three categories to classify particle shapes: beads, fibers, and fragments [42]. The cylindrical microplastics were categorized as fibers since the length–to–width ratio for fragments and films are the same [43], so they were grouped together as fragments, and spherical particles were grouped as beads. Understanding the shape of microplastics is also a very important parameter for ecological risk assessment because research has shown that fibers can cause the entanglement of copepods, hampering normal swimming [44], also the shape of the microplastics determine bioavailability.
Studies have shown that grab sampling methods collect more non–fibrous microplastics compared to the neuston net [31]. In the current study, the same trend was observed, with 11% of microplastics found to be fibers, 86%—a majority—recognized as fragments, and only 2% as beads. Similarly, a study conducted on an Italian subalpine lake reported 73.7% of the microplastics as fragments [45], while another study conducted at Taihu Lake in China reported 78% of the microplastics as fragments and films [16]. The high percentage of fragments and films in the current study indicates a potential origin from the fragmentation of larger plastic debris [46]. While fibers are mainly derived from wastewater via washing clothes [47] highlighting the role of watershed–specific microplastic pollution sources in shaping microplastic morphology. These findings underscore the overwhelming prevalence of secondary microplastics (fragments and fibers) in the Chesapeake Bay, with spatial variability reflecting differential pollution pathways, hydrodynamic sorting, and anthropogenic activities. The consistency of fragment dominance across location aligns with global trends of plastic weathering and fragmentation. Campanale et al. observed a near absence of beads (<1.0%) at 10 of 16 sites surveyed, implying limited contributions from cosmetic or industrial pellet sources during the study period [48]. However, the observed October bead spike at Patuxent River (4.2%) suggests episodic inputs, potentially from localized spills or seasonal recreational activities.
Overall, the current study found the average abundance of microplastic particles to be 766.16 ± 302.59 MP/L. Our results suggested that the 10 L monthly composite sample collection is sufficient to estimate the abundance of the microplastics present in surface waters of the Chesapeake Bay. A statistically significant difference in microplastic abundance exists among the four locations indicating patchiness of microplastic distribution. Therefore, more sample collections at different locations could provide a better estimate of the spatial distribution patterns of microplastic pollution. The size distribution of microplastics revealed that 60.65% were <100 µm, 23.19% ranged from 100 to 300 µm, and 16.16% were >300 µm, indicating a higher prevalence of smaller microplastics compared to larger ones. This trend has significant ecological implications, as smaller microplastics are more readily ingested by lower trophic–level organisms, potentially leading to bioaccumulation and trophic transfer within the food web. In terms of morphology, 86.02% of microplastics were classified as fragments, 11.87% as fibers, and 2.10% as beads. A consistent trend was observed with fragments being the most abundant shape, followed by fibers, while beads were the least prevalent in surface waters. The dominance of fragments suggests that secondary microplastics, resulting from the breakdown of larger plastic debris, are a major source of microplastic contamination in the Chesapeake Bay.
Furthermore, the traditional microplastic sampling methods, such as manta nets, are limited in their ability to capture smaller microplastics (<300 µm) due to larger mesh sizes, typically ranging from 300 to 500 µm. Consequently, previous studies may have underestimated the true abundance of smaller microplastics in aquatic environments. Our study addresses this limitation by employing a composite sampling protocol using a 1 L stainless steel container, allowing for a more comprehensive assessment of microplastic contamination, particularly in the smaller size fractions. By capturing these previously overlooked particles, our findings provide critical insights into the extent of microplastic pollution and its potential ecological consequences, underscoring the need for improved monitoring and mitigation strategies.

Supplementary Materials

The supporting information can be downloaded at: https://www.mdpi.com/article/10.3390/microplastics4030053/s1. This file consists of raw data formatted in a Microsoft Excel spreadsheet. The file contains parameters for each sample analyzed with columns consisting of field area, score, shape, size estimation, and color organized by sampling location (Susquehanna River, Gunpowder River, Baltimore’s Inner Harbor, and Patuxent River) and sampling month (July, August, September, and October).

Author Contributions

C.F.: Conceptualization, Funding Acquisition, Project Supervision, Resources, Designing Experiments, Writing, Review, Editing, and Data Analysis; S.B.: Investigation, Designing Experiment, Writing, Review, and Editing; T.T.: Graduate Student, Investigation, Writing, Review, Corresponding Author; D.G.: Student, Writing, Editing, Data Organizing, and Data Analysis. All authors have read and agreed to the published version of the manuscript.

Funding

This work was supported in part by the National Science Foundation (Award Number 2022887) awarded to Chunlei Fan. Additional support was provided by the National Institute on Minority Health and Health Disparities of the National Institutes of Health (Award Number U54MD013376), the Department of Energy (Contract DE–FOA–0002581), and the National Science Foundation (Award Number 2244396). The content is solely the responsibility of the authors and does not necessarily represent the official views of the funding agencies.

Institutional Review Board Statement

Not Applicable.

Informed Consent Statement

Not Applicable.

Data Availability Statement

The data presented in this study are stored at the Patuxent Environmental and Aquatic Research Laboratory and can be made available upon request.

Acknowledgments

This work was supported in part by the National Science Foundation (award number 2022887) awarded to Chunlei Fan. The National Institute on Minority Health and Health Disparities of the National Institutes of Health (Award Number U54MD013376), under the Department of Energy under Contract DE–FOA–0002581, and the National Science Foundation (Award Number 2244396) also supported the research reported in this publication. We are grateful to Santosh Mandal for the generous use of additional laboratory space, support, and guidance in the digestion of the organic compounds and the extraction of microplastics. The content is solely the authors’ responsibility and does not necessarily represent the official views of the listed federal agencies.

Conflicts of Interest

The author declares no conflicts of interest.

References

  1. Iroegbu, A.O.C.; Sadiku, R.E.; Ray, S.S.; Hamam, Y. Plastics in municipal drinking water and wastewater treatment plant effluents: Challenges and opportunities for South Africa—A review. Environ. Sci. Pollut. Res. 2020, 27, 12953–12966. [Google Scholar] [CrossRef] [PubMed]
  2. Geyer, R.; Jambeck, J.R.; Law, K.L. Production, use, and fate of all plastics ever made. Sci. Adv. 2017, 3, e1700782. [Google Scholar] [CrossRef] [PubMed]
  3. Sonke, J.E.; Koenig, A.; Segur, T.; Yakovenko, N. Global environmental plastic dispersal under OECD policy scenarios toward 2060. Sci. Adv. 2025, 11, eadu2396. [Google Scholar] [CrossRef] [PubMed]
  4. Hale, R.C.; Seeley, M.E.; La Guardia, M.J.; Mai, L.; Zeng, E.Y. A Global Perspective on Microplastics. J. Geophys. Res. Oceans 2020, 125, e2018JC014719. [Google Scholar] [CrossRef]
  5. Bejarano, S.; Diemel, V.; Feuring, A.; Ghilardi, M.; Harder, T. No short–term effect of sinking microplastics on heterotrophy or sediment clearing in the tropical coral Stylophora pistillata. Sci. Rep. 2022, 12, 1468. [Google Scholar] [CrossRef]
  6. Bikker, J.; Lawson, J.; Wilson, S.; Rochman, C.M. Microplastics and other anthropogenic particles in the surface waters of the Chesapeake Bay. Mar. Pollut. Bull. 2020, 156, 111257. [Google Scholar] [CrossRef]
  7. Chen, J.; Wang, W.; Liu, H.; Xu, X.; Xia, J. A review on the occurrence, distribution, characteristics, and analysis methods of microplastic pollution in ecosystems. Environ. Pollut. Bioavailab. 2021, 33, 227–246. [Google Scholar] [CrossRef]
  8. Rostampour, S.; Cook, R.; Jhang, S.-S.; Li, Y.; Fan, C.; Sung, L.-P. Changes in the Chemical Composition of Polyethylene Terephthalate under UV Radiation in Various Environmental Conditions. Polymers 2024, 16, 2249. [Google Scholar] [CrossRef]
  9. Andrady, A.L. Microplastics in the marine environment. Mar. Pollut. Bull. 2011, 62, 1596–1605. [Google Scholar] [CrossRef]
  10. López, A.G.; Najjar, R.G.; Friedrichs, M.A.M.; Hickner, M.A.; Wardrop, D.H. Estuaries as Filters for Riverine Microplastics: Simulations in a Large, Coastal–Plain Estuary. Front. Mar. Sci. 2021, 8, 715924. [Google Scholar] [CrossRef]
  11. Hood, R.R.; Shenk, G.W.; Dixon, R.L.; Smith, S.M.C.; Ball, W.P.; Bash, J.O.; Batiuk, R.; Boomer, K.; Brady, D.C.; Cerco, C.; et al. The Chesapeake Bay Program Modeling System: Overview and Recommendations for Future Development. Ecol. Model. 2021, 465, 109635. [Google Scholar] [CrossRef] [PubMed]
  12. Phillips, S.; Blomquist, J.D.; Bennett, M.; Berlin, A.; Blazer, V.; Claggett, P.R.; Faulkner, S.; Hyer, K.; Ladino, C.; Moyer, D.; et al. U.S. Geological Survey Chesapeake Science Strategy, 2015–2025—Informing Ecosystem Management of America’s Largest Estuary; Open–File Report 2015–1162; U.S. Geological Survey: Reston, VA, USA, 2015.
  13. Vasconcelos, R.P.; Reis–Santos, P.; Costa, M.J.; Cabral, H.N. Connectivity between estuaries and marine environment: Integrating metrics to assess estuarine nursery function. Ecol. Indic. 2011, 11, 1123–1133. [Google Scholar] [CrossRef]
  14. Brophy, L.S.; Greene, C.M.; Hare, V.C.; Holycross, B.; Lanier, A.; Heady, W.N.; O’Connor, K.; Imaki, H.; Haddad, T.; Dana, R. Insights into estuary habitat loss in the western United States using a new method for mapping maximum extent of tidal wetlands. PLoS ONE 2019, 14, e0218558. [Google Scholar] [CrossRef] [PubMed]
  15. Clayer, F.; Jartun, M.; Buenaventura, N.T.; Guerrero, J.-L.; Lusher, A. Bypass of Booming Inputs of Urban and Sludge–Derived Microplastics in a Large Nordic Lake. Env. Sci. Technol. 2021, 55, 7949–7958. [Google Scholar] [CrossRef]
  16. Su, L.; Xue, Y.; Li, L.; Yang, D.; Kolandhasamy, P.; Li, D.; Shi, H. Microplastics in Taihu Lake, China. Environ. Pollut. 2016, 216, 711–719. [Google Scholar] [CrossRef]
  17. Sun, J.; Wang, M.-H.; Ho, Y.-S. A historical review and bibliometric analysis of research on estuary pollution. Mar. Pollut. Bull. 2012, 64, 13–21. [Google Scholar] [CrossRef]
  18. Curren, E.; Yew Leong, S.C. Spatiotemporal characterisation of microplastics in the coastal regions of Singapore. Heliyon 2023, 9, e12961. [Google Scholar] [CrossRef]
  19. Cole, M.; Lindeque, P.; Halsband, C.; Galloway, T.S. Microplastics as contaminants in the marine environment: A review. Mar. Pollut. Bull. 2011, 62, 2588–2597. [Google Scholar] [CrossRef]
  20. Guzzetti, E.; Sureda, A.; Tejada, S.; Faggio, C. Microplastic in marine organism: Environmental and toxicological effects. Environ. Toxicol. Pharmacol. 2018, 64, 164–171. [Google Scholar] [CrossRef]
  21. Uy, C.A.; Johnson, D.W. Effects of microplastics on the feeding rates of larvae of a coastal fish: Direct consumption, trophic transfer, and effects on growth and survival. Mar. Biol. 2022, 169, 27. [Google Scholar] [CrossRef]
  22. Zobkov, M.B.; Esiukova, E.E. Microplastics in a Marine Environment: Review of Methods for Sampling, Processing, and Analyzing Microplastics in Water, Bottom Sediments, and Coastal Deposits. Oceanology 2018, 58, 137–143. [Google Scholar] [CrossRef]
  23. Firdaus, M.; Trihadiningrum, Y.; Lestari, P. Microplastic pollution in the sediment of Jagir Estuary, Surabaya City, Indonesia. Mar. Pollut. Bull. 2020, 150, 110790. [Google Scholar] [CrossRef] [PubMed]
  24. Schall, M.K.; Smith, G.D.; Blazer, V.S.; Walsh, H.L.; Wagner, T. Factors Influencing the Prevalence of Hyperpigmented Melanistic Lesions in Smallmouth Bass Micropterus dolomieu in the Susquehanna River Basin, Pennsylvania. J. Fish Dis. 2025, 48, e14033. [Google Scholar] [CrossRef] [PubMed]
  25. Kiser, A.H. Patuxent River Basin Environmental Variable Rasters: Climate, Topography, Land Use and Land Cover; U.S. Geological Survey: Reston, VA, USA, 2024. [CrossRef]
  26. Masura, J.; Baker, J.; Foster, G.; Arthur, C. Laboratory Methods for the Analysis of Microplastics in the Marine Environment: Recommendations for Quantifying Synthetic Particles in Waters and Sediments; NOAA Marine Debris Division: Silver Spring, MD, USA, 2015.
  27. Gabriel, A.D.; Amparado, R.F.; Lubguban, A.A.; Bacosa, H.P. Riverine Microplastic Pollution: Insights from Cagayan de Oro River, Philippines. Int. J. Environ. Res. Public Health 2023, 20, 6132. [Google Scholar] [CrossRef] [PubMed]
  28. Venrick, E.L.; McGowan, J.A.; Cayan, D.R.; Hayward, T.L. Climate and Chlorophyll a: Long–Term Trends in the Central North Pacific Ocean. Science 1987, 238, 70–72. [Google Scholar] [CrossRef]
  29. Han, M.; Niu, X.; Tang, M.; Zhang, B.-T.; Wang, G.; Yue, W.; Kong, X.; Zhu, J. Distribution of microplastics in surface water of the lower Yellow River near estuary. Sci. Total Environ. 2020, 707, 135601. [Google Scholar] [CrossRef]
  30. Li, Y.; Zhang, Y.; Chen, G.; Xu, K.; Gong, H.; Huang, K.; Yan, M.; Wang, J. Microplastics in Surface Waters and Sediments from Guangdong Coastal Areas, South China. Sustainability 2021, 13, 2691. [Google Scholar] [CrossRef]
  31. Barrows, A.P.W.; Neumann, C.A.; Berger, M.L.; Shaw, S.D. Grab vs. neuston tow net: A microplastic sampling performance comparison and possible advances in the field. Anal. Methods 2017, 9, 1446–1453. [Google Scholar] [CrossRef]
  32. Song, Y.K.; Hong, S.H.; Jang, M.; Kang, J.-H.; Kwon, O.Y.; Han, G.M.; Shim, W.J. Large Accumulation of Micro–sized Synthetic Polymer Particles in the Sea Surface Microlayer. Environ. Sci. Technol. 2014, 48, 9014–9021. [Google Scholar] [CrossRef]
  33. Zaki, M.R.M.; Ying, P.X.; Zainuddin, A.H.; Razak, M.R.; Aris, A.Z. Occurrence, abundance, and distribution of microplastics pollution: An evidence in surface tropical water of Klang River estuary, Malaysia. Env. Geochem Health 2021, 43, 3733–3748. [Google Scholar] [CrossRef]
  34. Razeghi, N.; Hamidian, A.H.; Wu, C.; Zhang, Y.; Yang, M. Microplastic sampling techniques in freshwaters and sediments: A review. Environ. Chem. Lett. 2021, 19, 4225–4252. [Google Scholar] [CrossRef]
  35. Yonkos, L.T.; Friedel, E.A.; Perez–Reyes, A.C.; Ghosal, S.; Arthur, C.D. Microplastics in Four Estuarine Rivers in the Chesapeake Bay, U.S.A. Environ. Sci. Technol. 2014, 48, 14195–14202. [Google Scholar] [CrossRef]
  36. Kooi, M.; Primpke, S.; Mintenig, S.M.; Lorenz, C.; Gerdts, G.; Koelmans, A.A. Characterizing the multidimensionality of microplastics across environmental compartments. Water Res. 2021, 202, 117429. [Google Scholar] [CrossRef]
  37. Ding, L.; Mao, R.F.; Guo, X.; Yang, X.; Zhang, Q.; Yang, C. Microplastics in surface waters and sediments of the Wei River, in the northwest of China. Sci. Total Environ. 2019, 667, 427–434. [Google Scholar] [CrossRef] [PubMed]
  38. Deakin, K.; Savage, G.; Jones, J.S.; Porter, A.; Muñoz–Pérez, J.P.; Santillo, D.; Lewis, C. Sea surface microplastics in the Galapagos: Grab samples reveal high concentrations of particles <200 μm in size. Sci. Total Environ. 2024, 923, 171428. [Google Scholar] [CrossRef] [PubMed]
  39. Scott, N.; Porter, A.; Santillo, D.; Simpson, H.; Lloyd–Williams, S.; Lewis, C. Particle characteristics of microplastics contaminating the mussel Mytilus edulis and their surrounding environments. Mar. Pollut. Bull. 2019, 146, 125–133. [Google Scholar] [CrossRef] [PubMed]
  40. Schwarzer, M.; Brehm, J.; Vollmer, M.; Jasinski, J.; Xu, C.; Zainuddin, S.; Fröhlich, T.; Schott, M.; Greiner, A.; Scheibel, T.; et al. Shape, size, and polymer dependent effects of microplastics on Daphnia magna. J. Hazard. Mater. 2022, 426, 128136. [Google Scholar] [CrossRef]
  41. Rochman, C.M.; Grbic, J.; Earn, A.; Helm, P.A.; Hasenmueller, E.A.; Trice, M.; Munno, K.; De Frond, H.; Djuric, N.; Santoro, S.; et al. Local Monitoring Should Inform Local Solutions: Morphological Assemblages of Microplastics Are Similar within a Pathway, But Relative Total Concentrations Vary Regionally. Environ. Sci. Technol. 2022, 56, 9367–9378. [Google Scholar] [CrossRef]
  42. Liu, F.; Rasmussen, L.A.; Klemmensen, N.D.R.; Zhao, G.; Nielsen, R.; Vianello, A.; Rist, S.; Vollertsen, J. Shapes of Hyperspectral Imaged Microplastics. Environ. Sci. Technol. 2023, 57, 12431–12441. [Google Scholar] [CrossRef]
  43. Kooi, M.; Koelmans, A.A. Simplifying Microplastic via Continuous Probability Distributions for Size, Shape, and Density. Environ. Sci. Technol. Lett. 2019, 6, 551–557. [Google Scholar] [CrossRef]
  44. Lehtiniemi, M.; Hartikainen, S.; Näkki, P.; Engström–Öst, J.; Koistinen, A.; Setälä, O. Size matters more than shape: Ingestion of primary and secondary microplastics by small predators. Food Webs. 2018, 17, e00097. [Google Scholar] [CrossRef]
  45. Sighicelli, M.; Pietrelli, L.; Lecce, F.; Iannilli, V.; Falconieri, M.; Coscia, L.; Di Vito, S.; Nuglio, S.; Zampetti, G. Microplastic pollution in the surface waters of Italian Subalpine Lakes. Environ. Pollut. 2018, 236, 645–651. [Google Scholar] [CrossRef]
  46. Barnes, D.K.A.; Galgani, F.; Thompson, R.C.; Barlaz, M. Accumulation and fragmentation of plastic debris in global environments. Philos. Trans. R. Soc. B Biol. Sci. 2009. [Google Scholar] [CrossRef]
  47. Browne, M.A.; Crump, P.; Niven, S.J.; Teuten, E.; Tonkin, A.; Galloway, T.; Thompson, R. Accumulation of Microplastic on Shorelines Woldwide: Sources and Sinks. Environ. Sci. Technol. 2011, 45, 9175–9179. [Google Scholar] [CrossRef]
  48. Campanale, C.; Stock, F.; Massarelli, C.; Kochleus, C.; Bagnuolo, G.; Reifferscheid, G.; Uricchio, V.F. Microplastics and their possible sources: The example of Ofanto river in southeast Italy. Environ. Pollut. 2020, 258, 113284. [Google Scholar] [CrossRef]
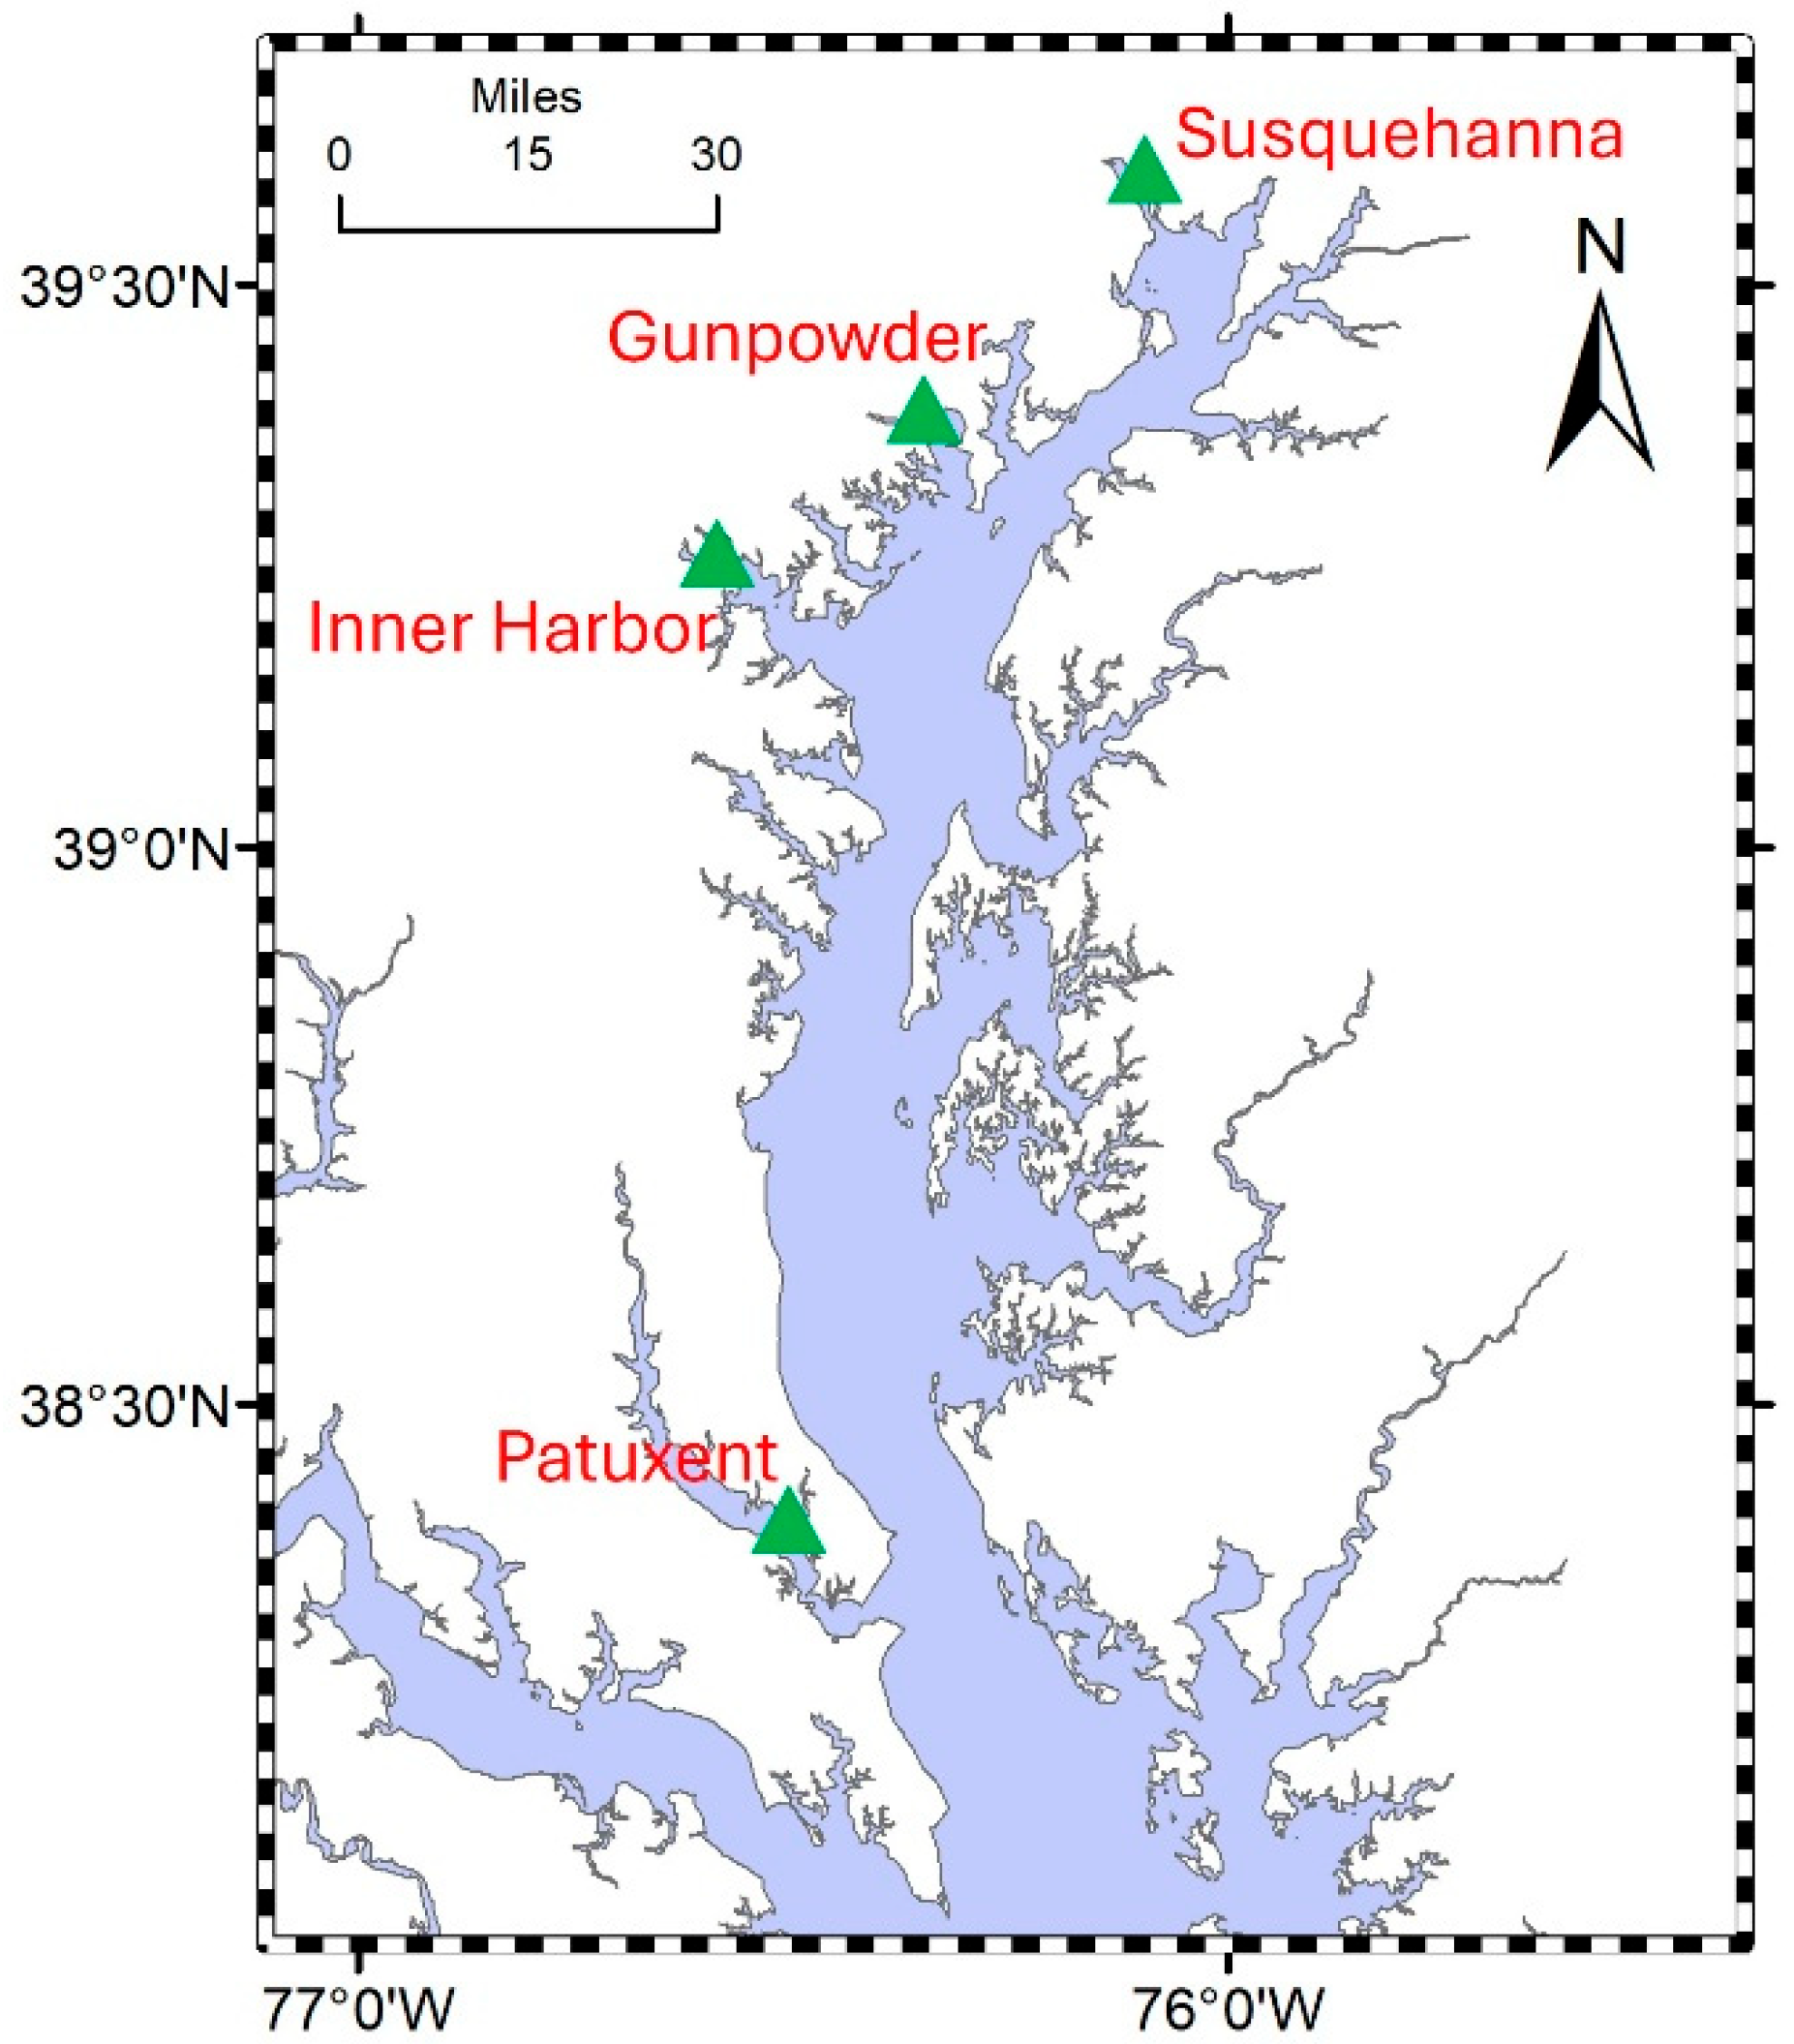
Figure 1. Map of the Chesapeake Bay showing the four designated locations for microplastic sample collection.
Microplastics 04 00053 g001
Figure 2. Average microplastics abundance at the four sampling sites in the Chesapeake Bay.
Microplastics 04 00053 g002
Figure 3. Spatiotemporal patterns of the microplastics by size at the four sampling sites in surface waters of the Chesapeake Bay.
Microplastics 04 00053 g003
Figure 4. Temporal and spatial patterns of microplastic size fractions < 300 µm compared to > 300 µm at the four sampling sites in the Chesapeake Bay.
Microplastics 04 00053 g004
Figure 5. Spatiotemporal patterns of microplastic morphology in surface waters at the four sampling sites in the Chesapeake Bay.
Microplastics 04 00053 g005
Table 1. Microplastics Abundance During Four Months from July 2023–October 2023.
LocationJuly (MP/L)August (MP/L)September (MP/L)October (MP/L)
Susquehanna River603351.61114.4532.9
Gunpowder River13491282980.31198.2
Inner Harbor484.3703.91164.2467.6
Patuxent River507.8152.8537.1829.5
Disclaimer/Publisher’s Note: The statements, opinions and data contained in all publications are solely those of the individual author(s) and contributor(s) and not of MDPI and/or the editor(s). MDPI and/or the editor(s) disclaim responsibility for any injury to people or property resulting from any ideas, methods, instructions or products referred to in the content.