Abstract
This paper addresses the growing concern surrounding microplastic pollution, particularly within the textile industry, and the associated potential health risks linked to the inhalation and ingestion of microplastic particles. Microplastics, defined as plastic particles smaller than five millimeters, are increasingly found not only in aquatic environments, but also in soils, air, and food. Although research on the health impacts of microplastics is still emerging, early studies indicate that these particles could contribute to health issues, including oxidative stress, inflammation, and cardiovascular diseases. Notably, individuals with higher concentrations of plastics in arterial plaques are more susceptible to heart attacks and strokes. In the textile industry, synthetic fibers such as polyester, nylon, and acrylic release microplastics into the air during production. The paper discusses a study conducted in a textile company that processes polyester yarns, where airborne microplastic concentrations were measured at various locations throughout the day. Particle sizes ranging from 0.3 nm to 10 nm were analyzed, revealing the presence of polyester polymers in the particulate matter. These findings underscore the widespread nature of microplastic pollution, particularly in industrial settings, and raise concerns about the health risks associated with prolonged exposure to airborne microplastics. While further research is necessary to fully understand the extent of these health impacts, preliminary data suggest a troubling link between microplastic inhalation and cardiovascular conditions.
1. Introduction
Plastics are described by the International Union of Pure and Applied Chemistry (IUPAC) as polymeric materials that may contain additional compounds to enhance performance and reduce costs [1]. Due to their low cost and ease of manufacturing, plastics have been widely used in production and daily life, leading to the generation of massive amounts of plastic waste worldwide, with petrochemical-based plastics accounting for more than 80% of all plastics used globally. For example, the most common types of plastics include polystyrene (PS), polyethene terephthalate (PET), polyurethane (PUR), polypropylene (PP), polycarbonate (PC), polyvinyl chloride (PVC), and polyethene (PE) [2].
Plastics (synthetic or organic polymers) play a significant role in the global economy and industry, but their widespread use raised serious concerns for ecosystems. Most of these artificial polymers that saturate the environment degrade very slowly or are non-biodegradable when released into natural ecosystems. The natural degradation of plastics takes between 10 and 1000 years, depending on the environment and the types of monomers involved [3]. As a result, plastic waste accumulates much faster than it can degrade, becoming a major global issue [4]. Consequently, this contributes to the current situation of “white pollution”, a term referring to the visible accumulation of plastic waste that leads to environmental degradation [5]. Broadly speaking, plastic pollution occurs in various forms, ranging from macroplastics (pieces larger than 20 cm) to microplastics (smaller than 5 mm), and even to nanoparticles, which are invisible to the naked eye [6].
The textile industry, with some of the most complex and lengthy technological processes, is one of the world’s largest polluters, requiring special attention due to the wide variety of raw materials it processes—many of which are based on synthetic polymers—as well as the multitude of chemical finishing products used to impart specific characteristics demanded by end consumers. Moreover, recycling in the textile industry is still at an early stage in developing countries and is entirely absent in others. Micro and nanoplastic (MNP) pollution from the textile industry is evident in the air around workplaces, in wastewater, and beyond. MNP pollution is encountered throughout the entire life cycle of a textile product, from the production of synthetic textile fibers (with microfiber losses during polymer extrusion and processing, and emissions of microplastics into industrial air and wastewater), to the manufacturing stages (fiber release in factory air, industrial pre-sale washing → microfibers entering the sewer system), to consumer use (releasing between 700 and 700,000 microfibers per wash; tumble drying → dispersion into air/water), and finally, end-of-life phases (whether through landfill disposal, incineration, or recycling) [7]. It is estimated that one gram of textile can release between 4900 and 640,000 fibers and 0 to 350,000 fibrils [8].
Atmospheric MNPs are small in size, predominantly under 500 microns. A large proportion of these particles are smaller than or equal to 10 µm, which falls within the respirable particle size range. These particles fall into the category of particulate matter that raises the greatest concern for biotic, ecosystem, and human health.
On another note, it is acknowledged that indoor air pollution (including plastic particles) can be up to 100 times higher than outdoor air pollution. Every day, we inhale up to 130 small plastic particles, and the concentration of micro and nanoplastics (MnPs) in all environments is steadily increasing [9].
In the European Union, no single, general, or mandatory regulation sets maximum allowable levels for particulate pollution in indoor air in industrial settings. However, there are several regulations, directives, and standards that indirectly address this issue, particularly from the perspective of worker protection and occupational health. Among these are the following: (a) Directive 98/24/EC—on the protection of workers’ health and safety from risks related to chemical agents; (b) Directive 2004/37/EC—on the protection of workers from the risks related to exposure to carcinogens or mutagens; and (c) occupational exposure limits (OELs)—exposure limit values for workers. In this context, the European Commission periodically publishes lists of occupational exposure limit values for various agents, including inhalable and respirable dust, respirable crystalline silica, and other toxic or irritant particles. PM10 and PM2.5 pollution levels in the textile industry can vary significantly depending on the type of process (spinning, weaving, finishing, etc.), degree of automation, ventilation systems, and maintenance of premises. According to [10] pollution levels in a synthetic textile mill in China (cutting and dyeing), the PM10: 305–580 µg/m3 and PM2.5: 190–460 µg/m3 levels exceed the WHO-recommended limits by more than five times. Other research undertaken by Hasan et al. [11] on the situation in a textile factory with spinning, weaving, and dyeing units from Bangladesh finds that workers’ daily exposure to PM exceeds the WHO limits by three–four times, with values of PM10: 185–370 µg/m3 and PM2.5: 110–245 µg/m3 [11]. A comparative study undertaken by [12] in EU textile factories (Germany, Spain) shows levels of PM10: 50–180 µg/m3 and PM2. 35–120 µg/m3 under working conditions with partially operating filters and continuous activity (two shifts).
In Romania, studies on pollution by PM 2.5 and PM 10 (and in particular MNP’s) are limited, being identified only in research by some authors of the present work [13], which, in agreement with members of the European Commission [14] suggest that, in the absence of adequate control and filtration measures, microplastic levels can be significant in a textile industrial environment.
The impact of micro and nanoparticles, including nano/microplastics, on human health and the environment is a growing concern, particularly as they become more prevalent in the environment and are found in various products that we interact with daily. Here are key aspects regarding micro/nanoplastics’ potential impact on human health and how they can enter the body:
- Routes of Entry into the Body
Inhalation: Micro and nanoparticles can be inhaled through the air, for example, in indoor or in occupational environments, such as textile production or industries that use synthetic materials [15,16]. They can also be present in polluted urban/outdoor air. Once inhaled, these small particles may penetrate deep into the lungs and enter the bloodstream, potentially reaching other organs [16].
Ingestion: Microplastics and nanoplastics are present in food and water, primarily through contamination from plastic packaging or environmental pollution [17]. Ingested micro/nanoparticles can be absorbed through the digestive system, passing into the bloodstream and reaching various organs, including the liver and kidneys [18].
Dermal Exposure: While less common, especially nanoparticles, but also microplastics, can enter the body through the skin, particularly if they are part of cosmetics or other topical products. However, skin penetration depends on the size and type of nanoparticles [19,20].
- 2.
- Potential Health Impacts
Respiratory Issues: Inhalation of nanoparticles can lead to respiratory conditions such as asthma, chronic bronchitis, and even lung fibrosis. Because of their small size, they can bypass the body’s natural defense mechanisms, entering the alveoli in the lungs and causing inflammation or tissue damage [19].
Cardiovascular Risks: As mentioned in the original text, nanoparticles may accumulate in arterial plaques and have been associated with an increased risk of cardiovascular diseases. They may induce oxidative stress and inflammation, both of which contribute to heart disease and stroke [20].
Oxidative Stress: Nanoparticles can generate reactive oxygen species (ROS), leading to oxidative stress. This process damages cells, DNA, and proteins, contributing to ageing, cancer, and other diseases [19].
Immune System Disruption: Nanoparticles can interfere with immune responses. They may trigger excessive inflammation or alter immune cell behavior, making the body more susceptible to infections or autoimmune conditions [21].
Toxicity and Bioaccumulation: Certain nanoparticles contain toxic substances, such as heavy metals or persistent organic pollutants (POPs), which can accumulate in the body over time. This accumulation can lead to chronic health problems such as kidney damage or cancer.
- 3.
- How Nanoparticles Affect the Body
Inflammation and Immune Response: Nanoparticles can induce an inflammatory response in the body, activating immune cells such as macrophages. Chronic inflammation is a key factor in the development of various diseases, including cardiovascular diseases, cancer, and neurodegenerative conditions [18].
Cellular Uptake: Due to their small size, nanoparticles can penetrate cell membranes and enter cells, where they can interfere with cellular functions. Once inside the cells, nanoparticles can interact with organelles such as mitochondria and the nucleus, potentially disrupting cellular processes, leading to cell death or mutations [15].
Translocation to Other Organs: Once nanoparticles enter the bloodstream or lymphatic system, they can be carried to various organs, including the liver, kidneys, brain, and heart. This widespread distribution increases the potential for adverse health effects in multiple organ systems [16].
- 4.
- Studies and Evidence
Lung Damage: Research has shown that inhaled nanoparticles can cause lung inflammation and even lead to lung cancer. For example, carbon-based nanoparticles have been linked to pulmonary toxicity and inflammation [19].
Cardiovascular Effects: Studies in humans and animals suggest that nanoparticles can contribute to cardiovascular problems. One study found that exposure to ambient air pollution, which includes nanoparticles, increases the risk of heart attack and stroke due to the promotion of arterial plaque buildup [20].
Gut and Liver: Ingested nanoparticles have been found to pass through the gut and accumulate in the liver, leading to liver toxicity and inflammation in animal models. This suggests that prolonged exposure to nanoparticles through food or water could have significant liver health consequences [17].
- 5.
- Figures on Nanoparticles and Health Risks
Size Distribution of Airborne Nanoparticles: Research on airborne nanoparticles shows that their size typically ranges from 0.3 nm to 100 nm. Smaller particles (around 10 nm) are more likely to penetrate biological barriers, such as cell membranes and lung tissue [19].
Prevalence of Microplastics: A study published in Science Advances estimated that people ingest approximately 39,000 to 52,000 microplastic particles annually, with an additional 10,000 particles inhaled [20].
Inflammatory Response to Nanoparticles: In studies involving rats, exposure to 50 nm nanoparticles led to a significant increase in markers of oxidative stress and inflammation in the lungs and heart. Human studies suggested similar effects from inhaling fine particulate matter (PM2.5), which includes nanoparticles [16].
The textile industry is one of the significant contributors to the release of microplastics and nanoparticles into the environment. The key causes of microplastic release in the textile industry are as follows:
Use of Synthetic Fibers: The widespread use of synthetic fibers (polyester, nylon, and acrylic) is the primary driver of microplastic pollution in the textile industry. These fibers are durable and inexpensive but do not biodegrade easily in the environment.
Mechanical Processes: Weaving, spinning, and cutting synthetic fabrics releases fibers into the air and water. These microplastics are often too small to be captured by standard filtration systems.
Washing and Wearing: The everyday washing of synthetic textiles is a significant cause of microplastic pollution. Each wash cycle can release millions of fibers, which are too small to be effectively filtered by most wastewater treatment plants.
Wastewater Discharge from Textile Factories: Textile factories that process synthetic materials often discharge wastewater containing microplastic fibers. This water can contaminate surrounding ecosystems and contribute to pollution.
These particles are typically in the nanometer to micrometer range and can be inhaled or settled into the environment [16].
The study analysed airborne plastic particle concentration in a textile company that processes polyester textile structures using confection technology. The study monitored airborne microplastic concentrations at various times during the workday (morning and afternoon shifts) at different locations, including production areas, offices, and the exterior of the company. Particle sizes ranging from 0.3 µm to 10 µm were considered, and various statistical measures (mean, standard deviation, quartiles, etc.) were calculated for each size of airborne particles. The study also presented the chemical composition of the particulate matter and confirmed that the polyester polymer was present in the samples collected, indicating the source of the microplastic pollution.
2. Materials and Methods
Comparing the concentration of particles indoors and outdoors in textile factories and offices can provide valuable information about pollution sources and help implement air quality control measures.
According to data provided by IBISWorld (2024), there are approximately 7970 active companies in the textile industry in Romania, of which 4388 operate in the garment manufacturing sector. Thus, the share of garment factories in the total number of textile companies is approximately 55%. A distinctive aspect of textile products is that they are made from a variety of fiber blends, including both natural and synthetic fibers, giving each type of material unique characteristics. In this context, it must be emphasised that it was difficult to choose a company that processes exclusively polyester items, as collecting polyester nano and microparticles from the air requires the source to be strictly specialised in this material.
Thus, in order to assess specific exposure concentrations of polyester nano and microparticles, measurements were taken at a textile company that manufactures 100% polyester sports t-shirts. During the t-shirt manufacturing process, several operations can generate particles, depending on the nature of the material used and the type of processing. Cutting the material and sewing, for example, can generate fine particles or microfibers that detach from the textile structure due to high working speeds and the friction phenomenon. Particle number concentration was measured indoors (work area and office) and outdoors to study the variation in the airborne contamination with particles of different sizes. The collection of total particles indoors and their further analysis was conducted to analyze the nature of the particles and to differentiate the contribution of microplastics to the worker exposure.
The concentration measurements of airborne nano/micoplastics (NMP) were carried out at three locations: the production section/hall (at the workplaces), the office, and the company’s exterior.
The factory has an urban location, being situated in a very large courtyard next to several office buildings and away from traffic. Both the studied production hall and the offices are on the first floor. The production hall and offices had no mechanical ventilation or air conditioning. The outdoor measurements were carried out in the courtyard, near the building. The working day was 8 h (7:00 AM to 3:00 PM) with a break of no more than 30 min at about 11:30.
The measuring and sampling were conducted in two subsequent days. The first day covered the entire schedule, while the second day covered only the first part, allowing for a comparison of similar time intervals between the days (but also for other studies not included here). The workers spent most of their day in the production hall, with limited time in the offices and outdoors. The supervisors spent most of their time in the office, with periodic inspections of the production area.
The sampling starting time correlated with the production schedule: T1-Day I, 7:00 AM, T2-Day I, 3:00 PM/14 AM; and T3-Day II, 7:00 AM. For indoor measurement, real-time particle counting and collecting of particles for further analysis were performed in parallel, as described below. Outdoor measurements were conducted using the real-time counting procedure.
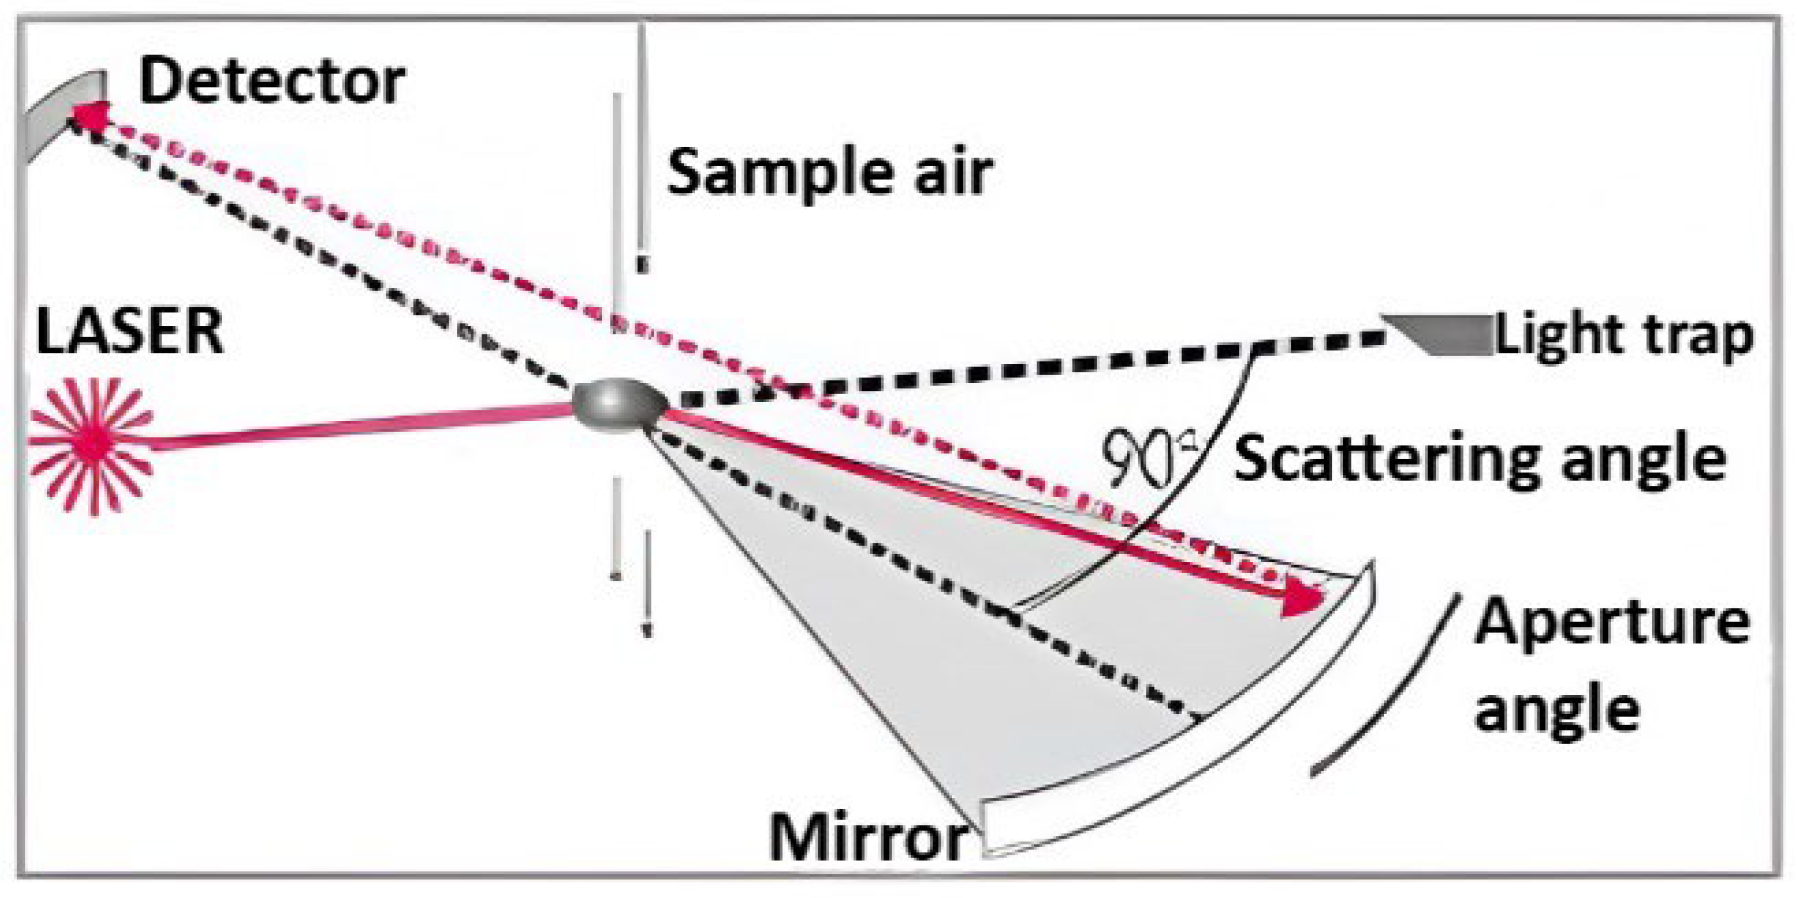
A real-time measurement procedure was applied to determine the number of particles per size of 0.3, 0.5, 1.0, 2.5, 5.0, and 10 µm in all three locations. The device used was the LASER AEROSOL SPECTROMETER MINI LAS model 11-E-Laser by GRIMM Aerosol Technik (Muldestausee, Germany), which is a portable, high-precision instrument designed for real-time aerosol measurement. It combines advanced laser scattering technology with user-friendly features, making it suitable for environmental monitoring, occupational health assessments, and atmospheric research. Particle size range: 0.25 to 32 µm. Number of size channels: 31. Measurement principle: laser light scattering. Sampling flow rate: adjustable, typically around 1.2 L/min. Battery life: approximately 8 h. Connectivity: Bluetooth-enabled for remote control. Display: integrated touchscreen for real-time data visualization. Data output: particle number concentration and size distribution. Applications: air quality monitoring, workplace exposure assessment, and environmental research.
The device directs a laser beam through an aerosol sample. As the particles scatter the laser light, the instrument measures the intensity and distribution of the scattered light to determine the particle size and concentration (Figure 1). The precise classification and quantification of the particles were ensured over the entire specified size range.
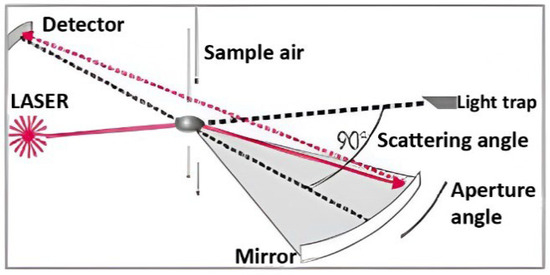
Figure 1.
The action principle of the spectrometer [D].
Real-time measurements were performed in all three locations (production/office/outside).
The collection of airborne particles was conducted using systems to sample within the respiratory area of the personnel. The sampling flow was 2.5–3 L/min (higher concentrations were expected in the production space, so a lower flow rate was used to avoid filter clogging). The sampling duration was set to allow a sampled air volume of at least 300 L. Duration was also influenced by the activities carried out by the personnel so that all relevant phases of the workday were covered.
The filtering media was SKC R100 hydrophobic quartz filters with 1.2 µm pore size, 25 mm diameter, and placed along with a supporting pad in SKC cassettes (clear styrene). Personal sampling pumps were Gilian GilAir Plus models, with a flow rate of 1–5 L/min, using flexible connecting tubing. An analytical balance with a precision of 0.000001 mg and a static neutralizer was used in a controlled environment (20 ± 10 °C, 50 ± 5% RH, PM10 levels less than 20/m3). The preparation of filters, including blanks, before sampling followed these steps: Calcination at 800 °C, and equilibration in the environmentally controlled weighing chamber for at least 2 h before weighing and uploading in the cassettes. After collection, the filters were gently removed from the cassette to avoid loss of sampled particles and passed over an antistatic radiation source. The filters were also weighed after the collection of particles, including field blanks. The concentration of total particulate matter (mg/m3) in the air volume sampled (m3) is calculated using the following formula:
where W1 = tare weight of the filter before sampling (mg), W2 = post-sampling weight of the sample-containing filter (mg), B1 = mean tare weight of blank filters (mg), B2 = mean post-sampling weight of blank filters (mg), and V = air volume sampled (m3).
After the final weighing, the samples were further analyzed by TED-GC-MS.
The thermal extraction desorption–gas chromatography–mass spectrometry (TED-GC-MS) method is a sophisticated analytical technique used for detecting and identifying volatile organic compounds (VOCs), semi-volatile organic compounds (SVOCs), and other trace substances in complex matrices, such as air, water, soil, or industrial samples. This method combines the capabilities of thermal desorption, gas chromatography, and mass spectrometry to provide high sensitivity, specificity, and versatility for chemical analysis.
System Configuration and Components Are the Following
- (a)
- Thermal extraction/furnace: a device capable of heating samples to high temperatures (typically up to 600 °C) to facilitate the release of VOCs;
- (b)
- Solid-phase adsorber: a material that traps the volatile compounds released during thermal extraction;
- (c)
- Thermal desorption unit (TDU): a component that heats the adsorber to release the trapped compounds into a carrier gas;
- (d)
- Gas chromatograph (GC): an instrument that separates compounds based on their interaction with a stationary phase within a column;
- (e)
- Mass spectrometer (MS): an analytical device that ionizes and detects compounds based on their mass-to-charge ratio.
In the study, the complete loaded glass fibre filter (2.5 mm diameter) was placed in an aluminium oxide crucible (900 µL volume) and was heated from 25 to 600 °C (10 K/min) under a N2 atmosphere. The decomposition gases are forwarded to a thermodesorption unit and collected on an adsorber. This loaded adsorber is automatically transferred to a second thermodesorption unit, which is located at the GC/MS system. The decomposition gases are desorbed by heating to 200 °C and collected in a cold injection system (−100 °C) before the molecules are separated in the gas chromatography column and detected in a mass spectrometer. The data analysis occurred with the ChemStation Agilent software. Quantification of the polymers was conducted by measuring the sample first. A second measurement with the same crucible was conducted by adding a known mass of the individual polymer type to be quantified to include the matrix in the quantification process. More details of the measurement process can be found in the Nature Protocol [22]. Microclimate parameters of the environments (temperature and relative humidity) were also measured using a real-time measurement device (TROTEC PC220).
3. Results and Discussion
3.1. Airborne Particle Concentration
Table 1 presents the parameters of the three environments in which the concentrations of particles of 0.3–10 nm are expressed in number/m3 of air.

Table 1.
Parameters of the three environments.
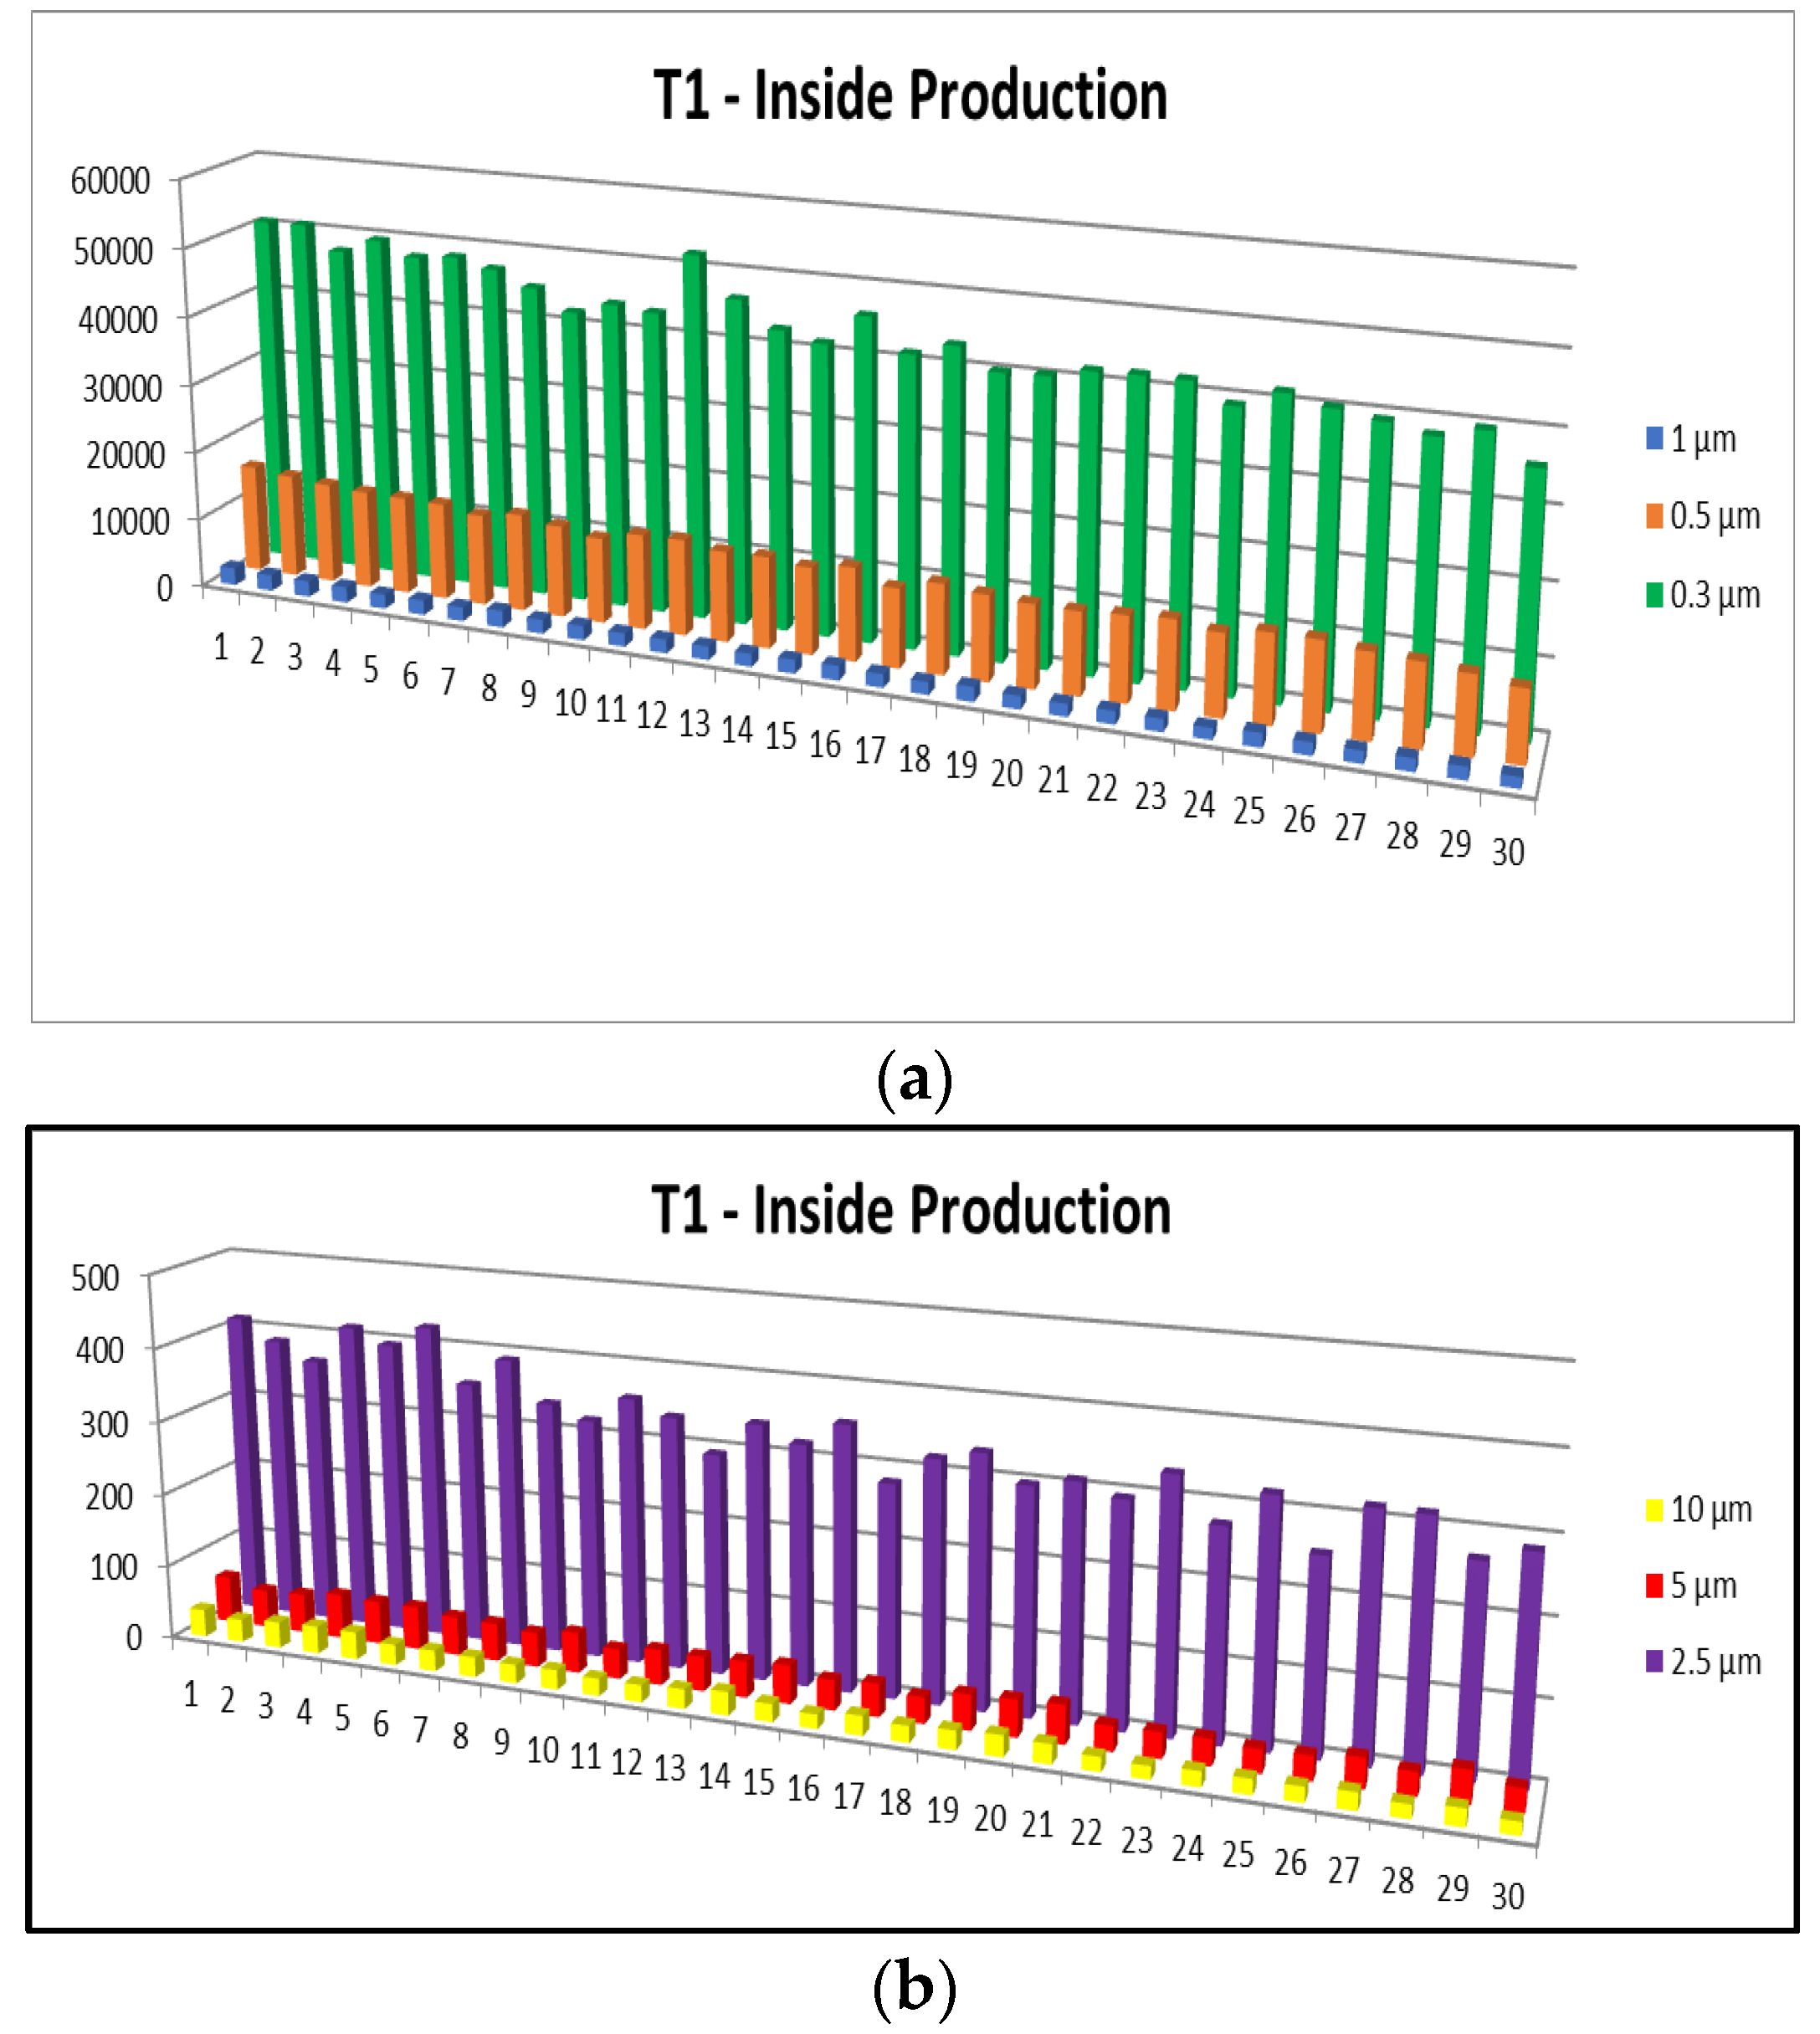
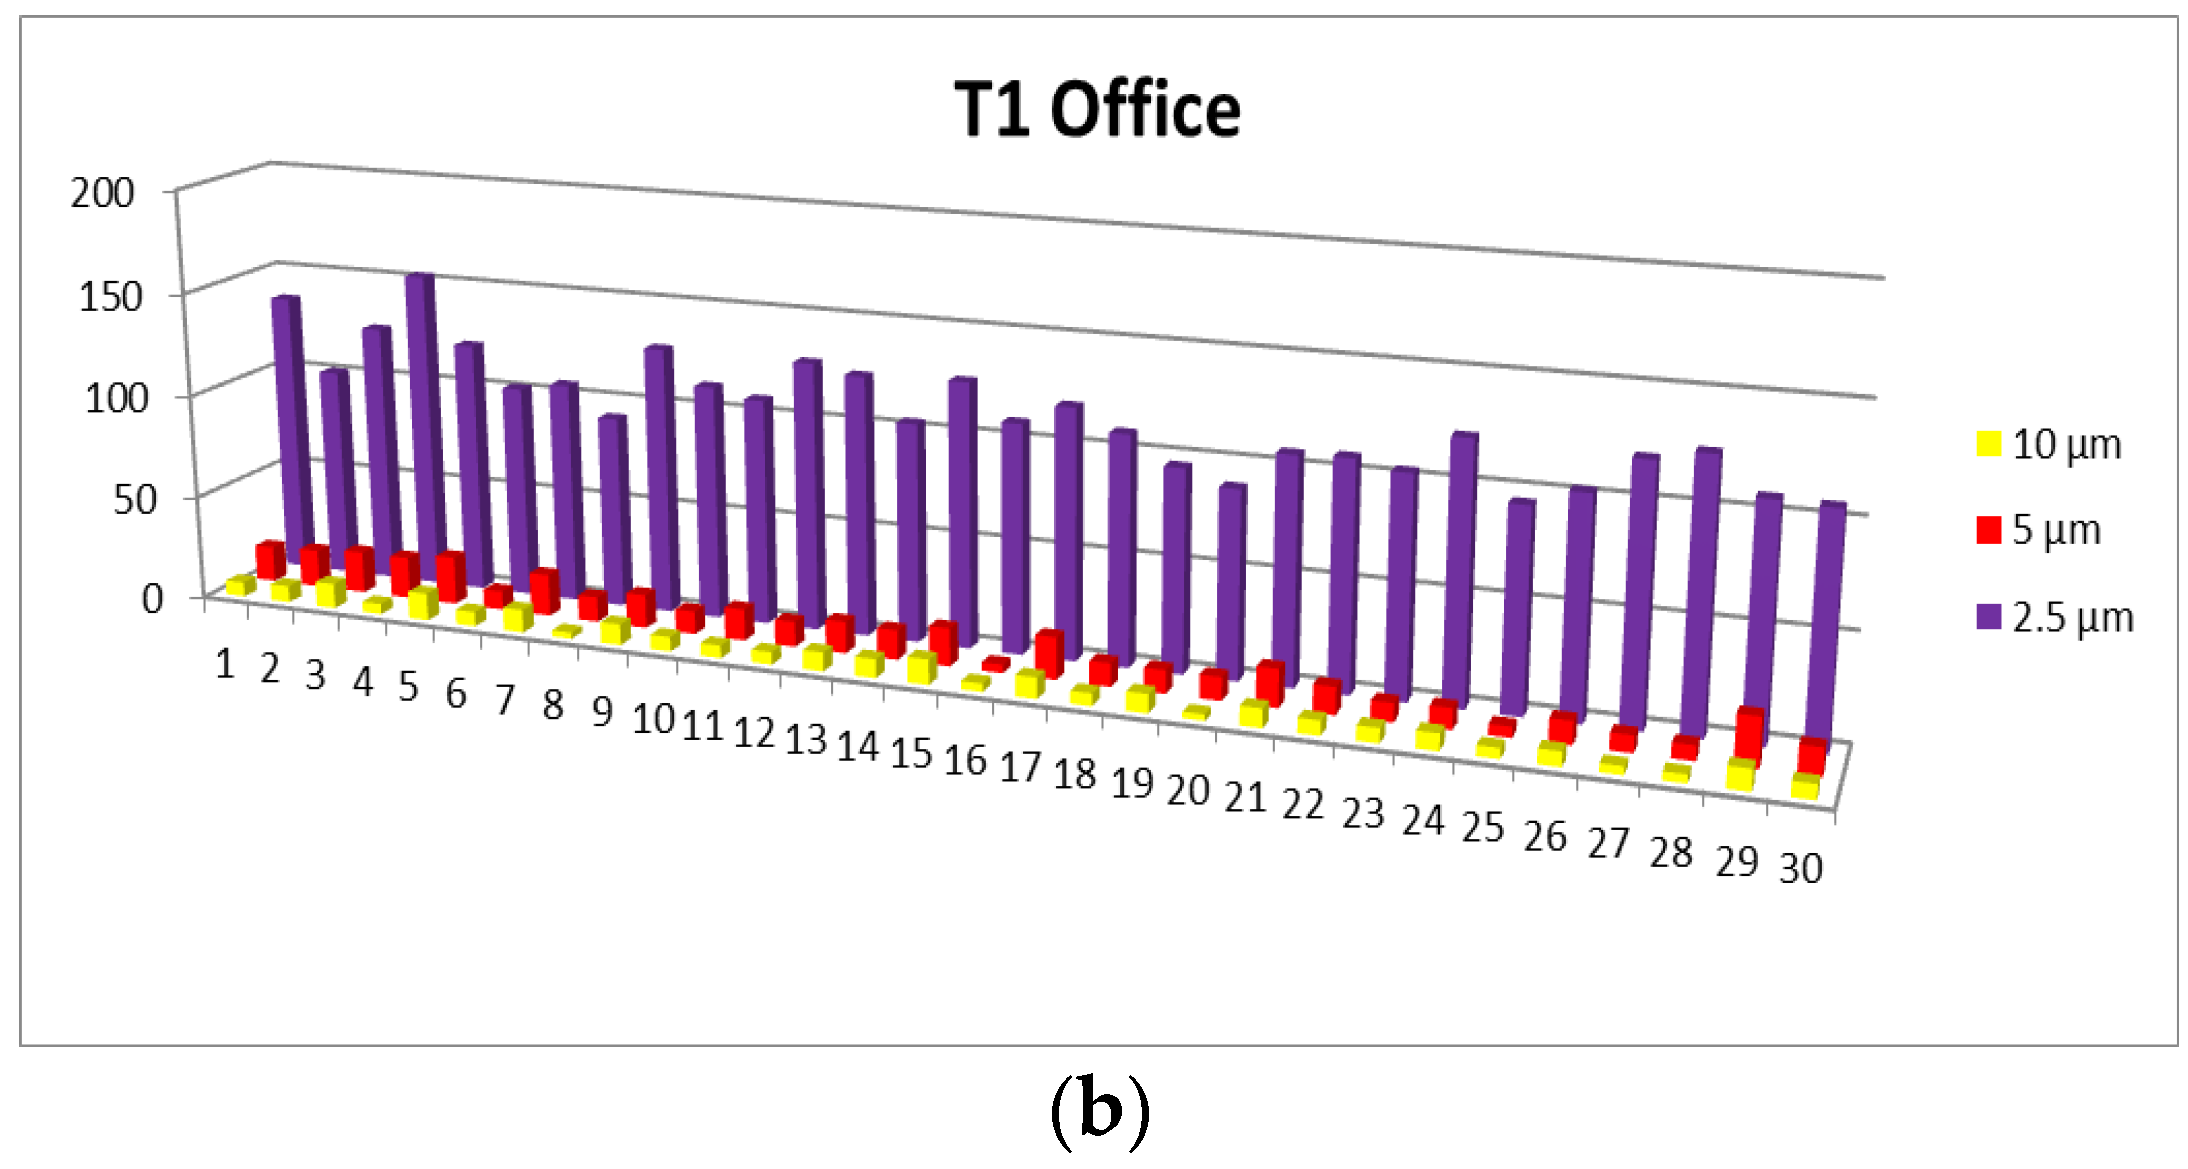
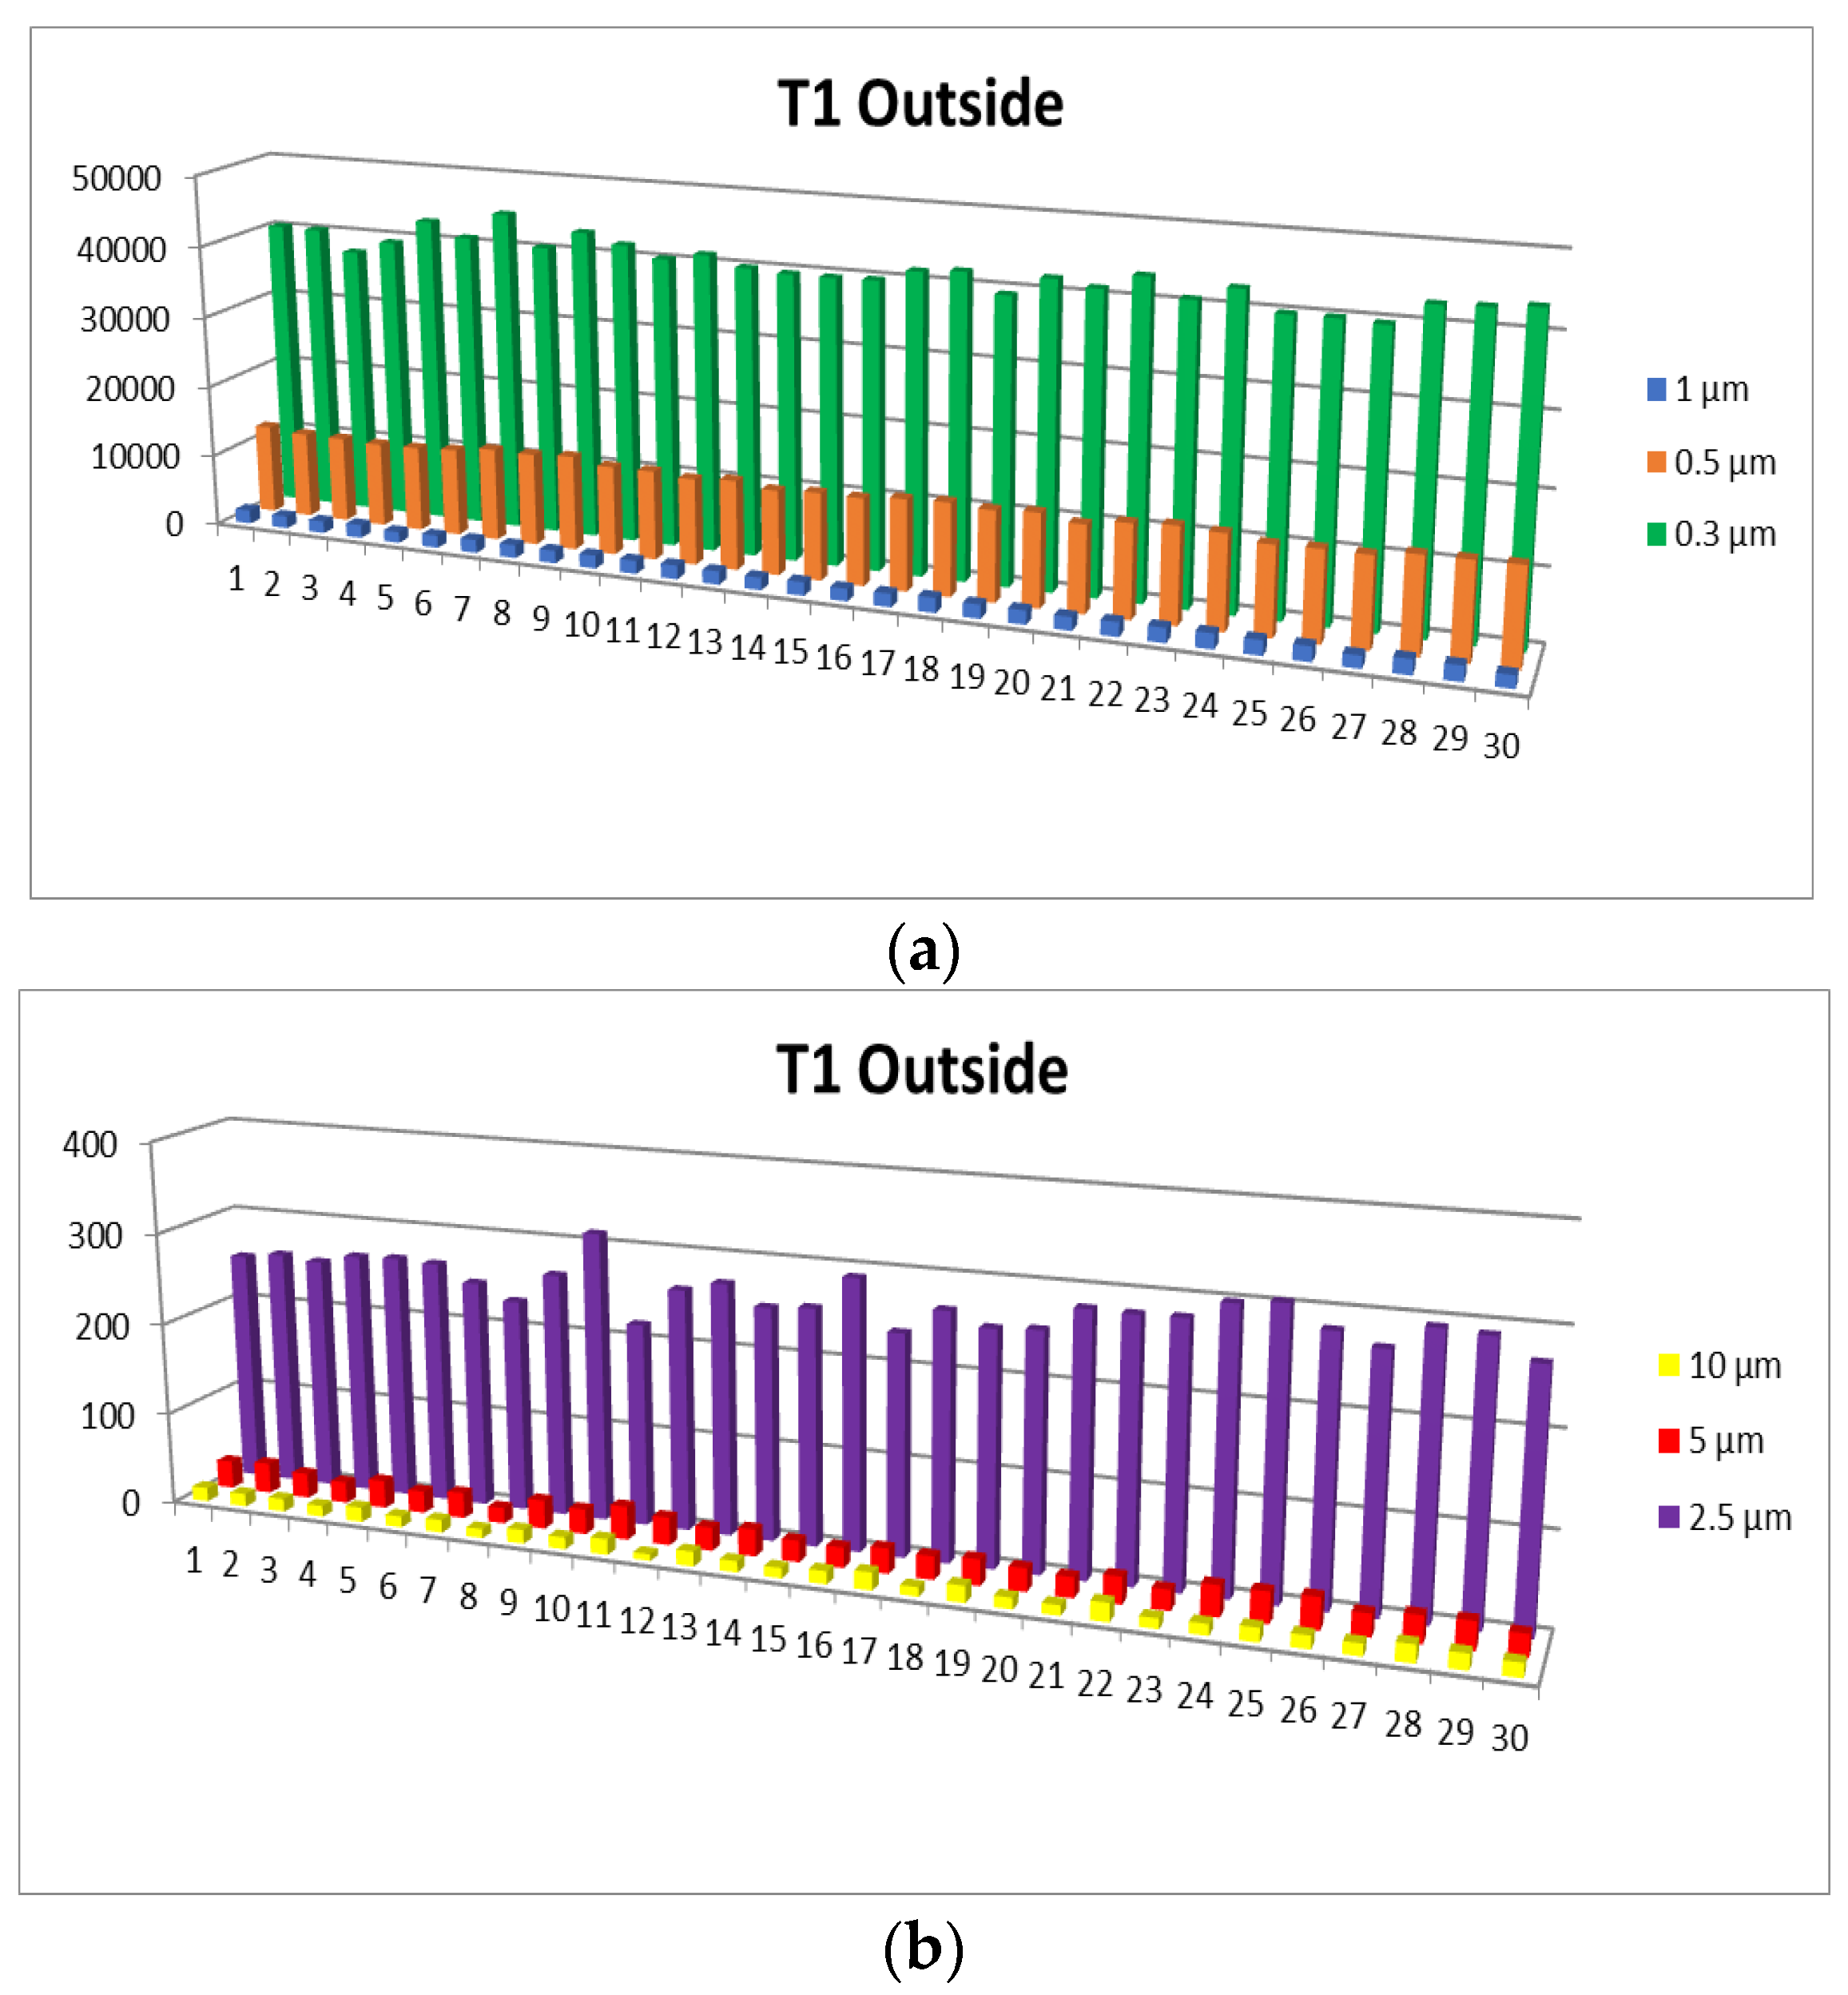
For the particle number concentration, expressed in number/m3, 30 measurements were made for each particle type at the three times and the three locations mentioned. Figure 2, Figure 3 and Figure 4 illustrate the evolution of particle numbers per size class in the production, office, and outside areas, as an example, at T1.

Figure 2.
Evolution of the particle number per size classes, in the production area at T1 (a)—0.3–1 µm; (b)—2.5–10 µm.
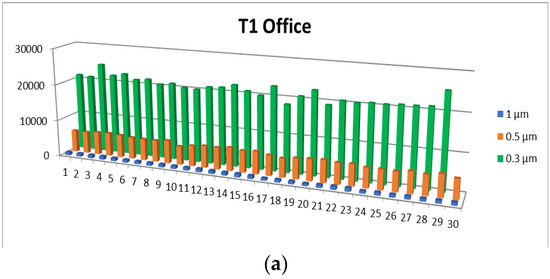

Figure 3.
Evolution of the particle number per size classes, in the office area at T1 (a)—0.3–1 µm; (b)—2.5–10 µm.

Figure 4.
Evolution of the particle number per size classes, in the outside area at T1 (a)—0.3–1 µm; (b)—2.5–10 µm.
All the diagrams show the evolution of the number of particles for 30 measurements taken for approximately 60 min.
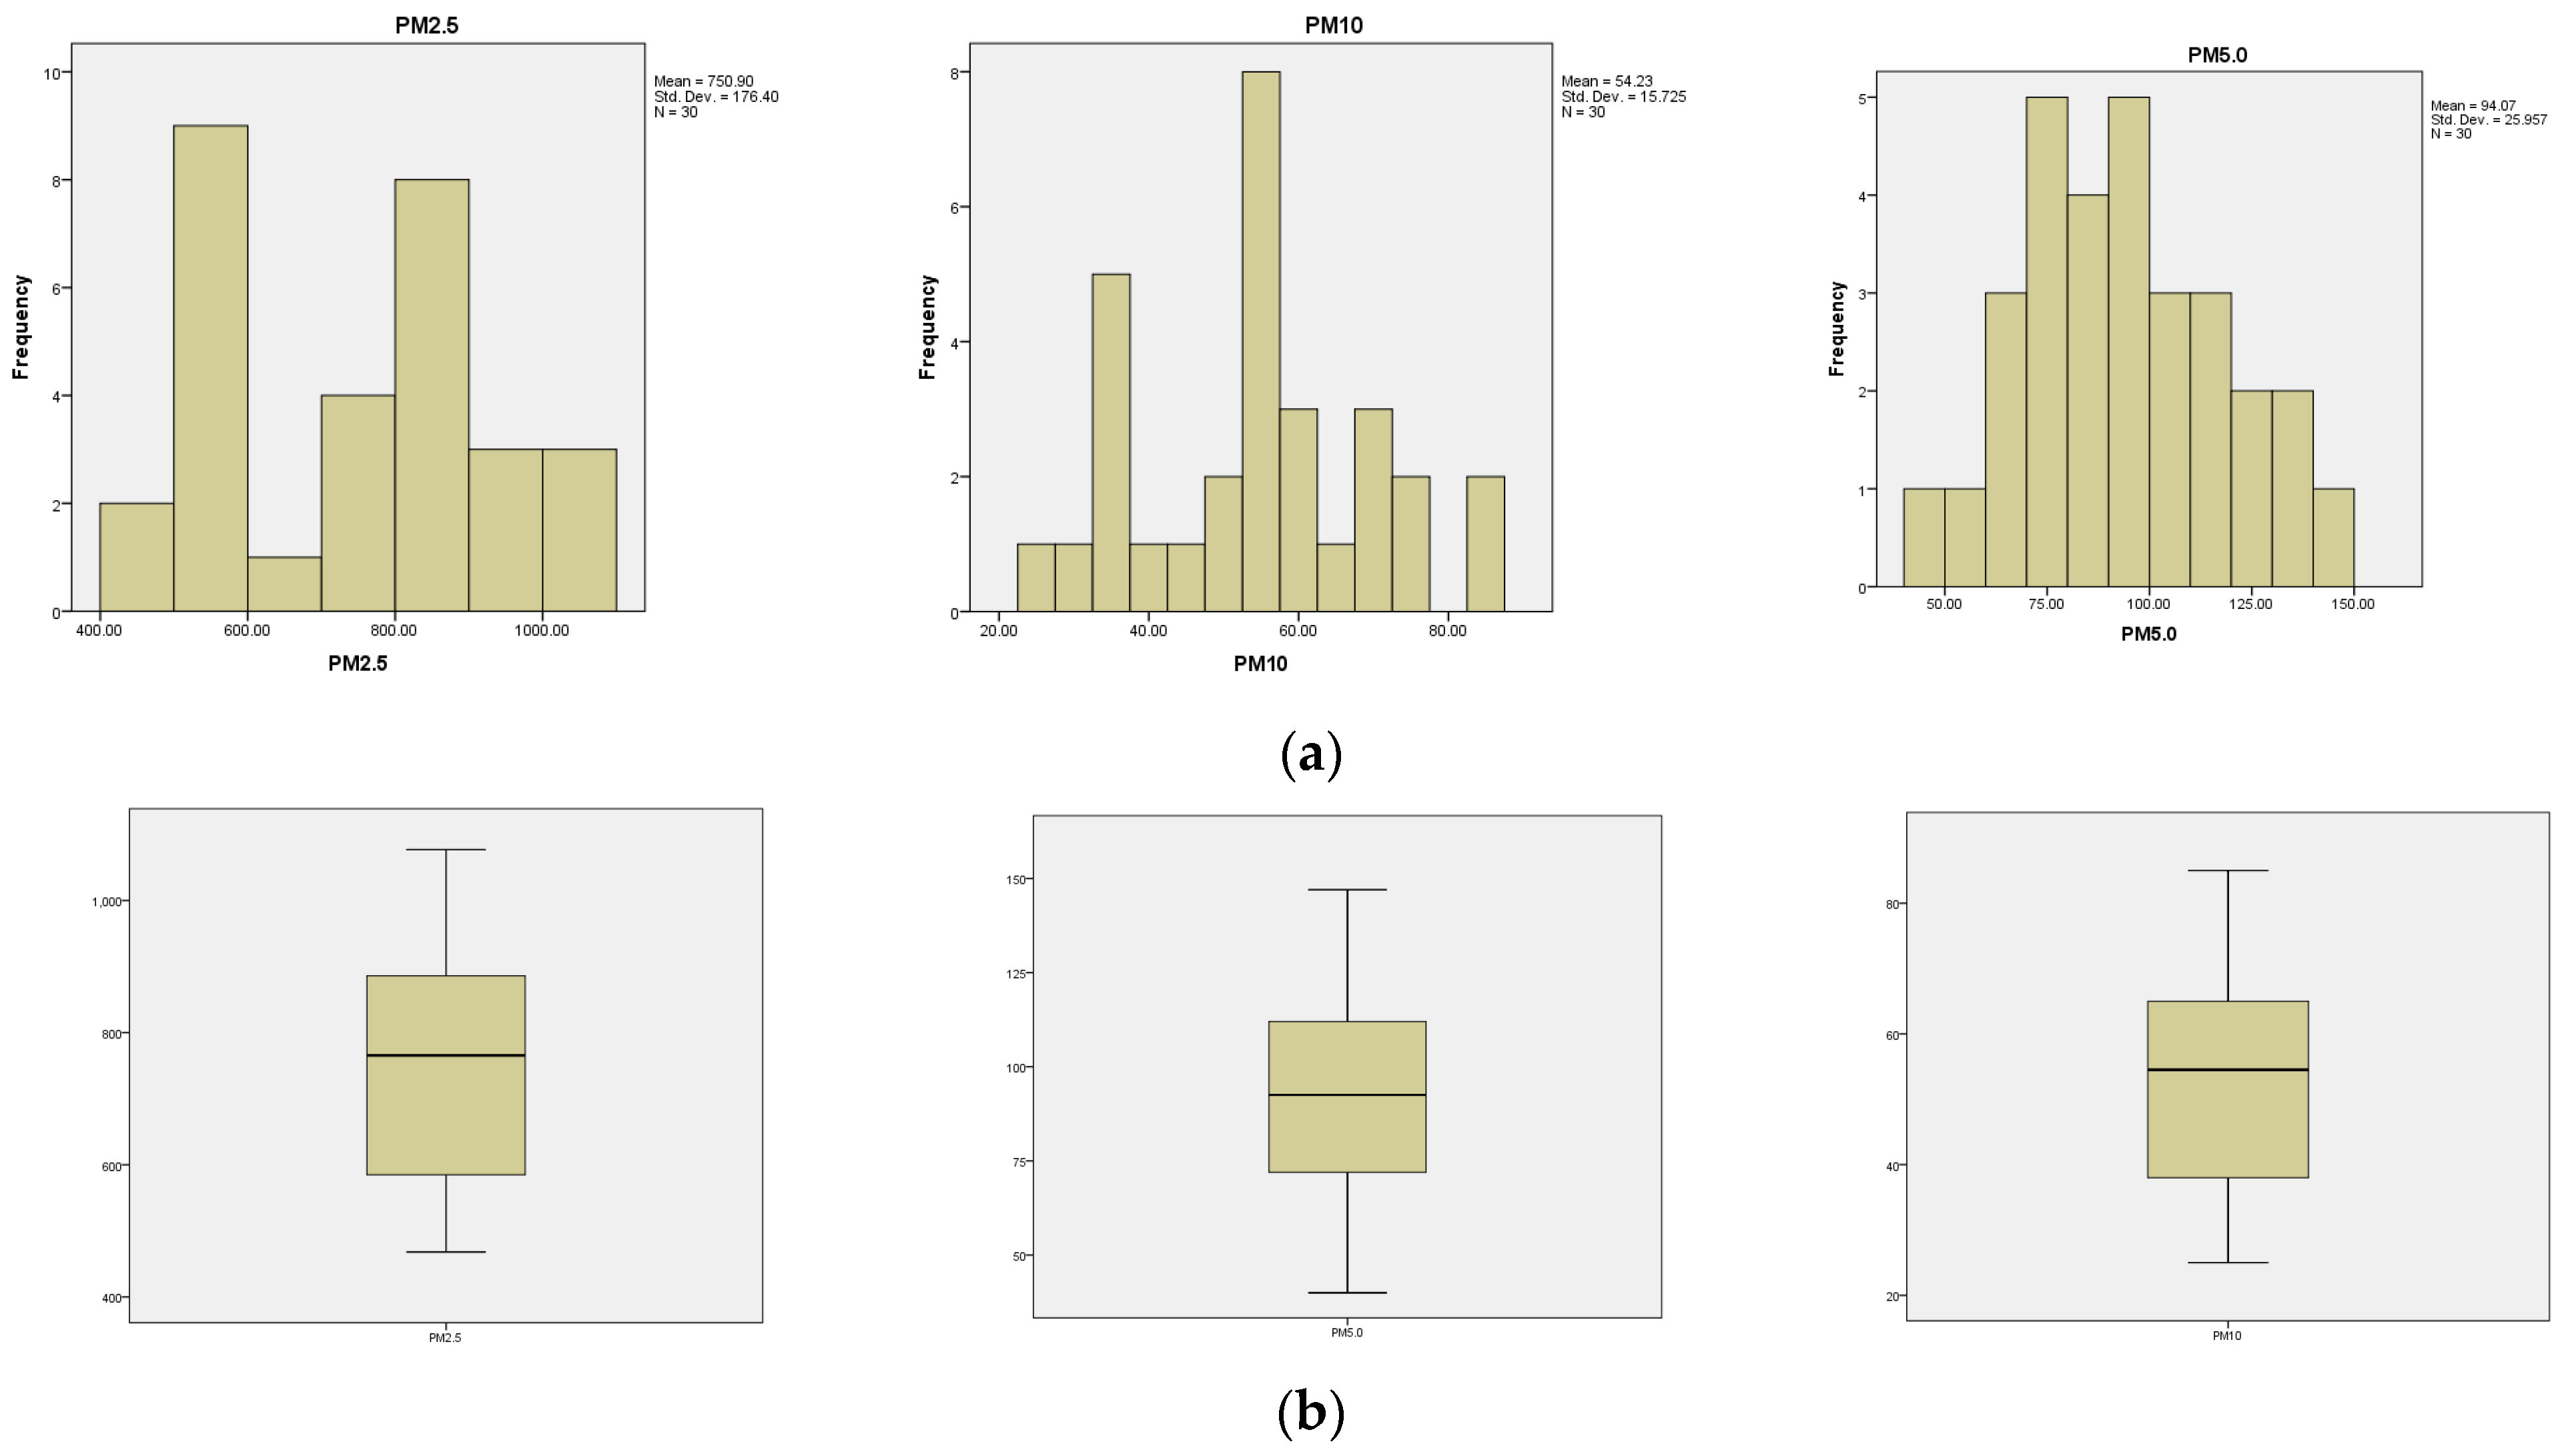
To characterize the populations of recorded particle concentrations (nr/m3), specific methods of descriptive statistics were employed. Using a specialized program (SPSS), we were able to rigorously analyze the distributions of particles with sizes of 0.3, 0.5, 1.0, 2.5, 5.0, and 10 µm. For each of these six variables, which are crucial for assessing air quality, the following statistical measures were calculated: mean, variance, standard deviation, median, quartiles, skewness, and kurtosis, along with an identification of cases where intervention might be required [accepting values that are located less than three box lengths away (box plot diagram) and eliminating values that are more than three box lengths away (outliers)].
Additionally, histograms and box plots were generated. Figure 5 and Figure 6 display the histograms and box plots for the six variables studied (T1-Day1-Production). They are provided for all times and locations.
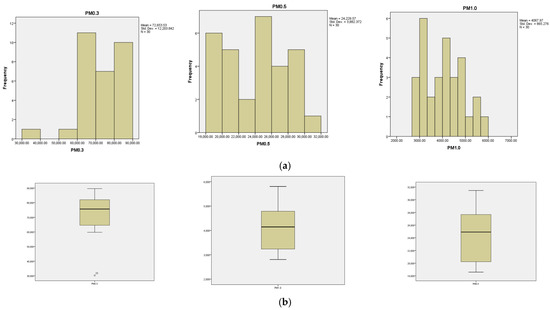
Figure 5.
(a) Histograms. (b) Box plot graphs—T2-Day1-Production (0.3, 0.5, and 1.0 µm particles).
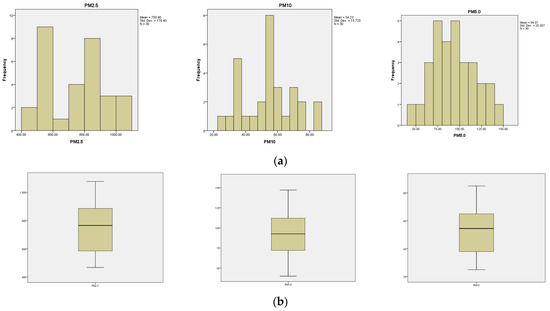
Figure 6.
(a) Histograms. (b) Box plot graphs—T2-Day1-Production (2.5, 5.0, and 10 µm particles).
The comparison between the statistical indicators of the variables for all times and locations highlights:
- Particle concentration: 0.3 µm particles have the highest concentration range, followed by 0.5 µm, 2.5 µm, 1.0 µm, and finally 5.0 µm and 10 µm, which have the lowest concentrations.
- Distribution patterns: In total, 0.3 µm, 0.5 µm, and 2.5 µm particles exhibit skewed distributions to the left, indicating a predominance of smaller values. Additionally, 1.0 µm particles show a balanced distribution with the median in the center, meaning there is a more equal proportion of small and large values. Further, 5.0 µm and 10 µm particles show right-skewed distributions, suggesting that larger values are more common.
- Size vs. distribution: as particle size increases, the concentration generally decreases, and the distribution shifts from skewed left (small particles) to more balanced (1.0 µm) and then skewed right (larger particles).
- The kurtosis indicators have negative values for the variable’s particle numbers 0.3, 0.5, 2.5, 5, and 10 µm: −0.544, −0.048, −0.0430, −0.990, and −0.230, with the curves being platykurtic in shape. On the other hand, they have a positive value for the 1.0 µm particle variable, 0.254, with the curve being leptokurtic.
In Table 2, the average values of the number of particles at T1, T2, and T3 are presented for the three averages considered at T1, T2, and T3, while in Figure 7, the evolution graphs of these values are shown.
Table 2.
Average values of the number of particles/m3.
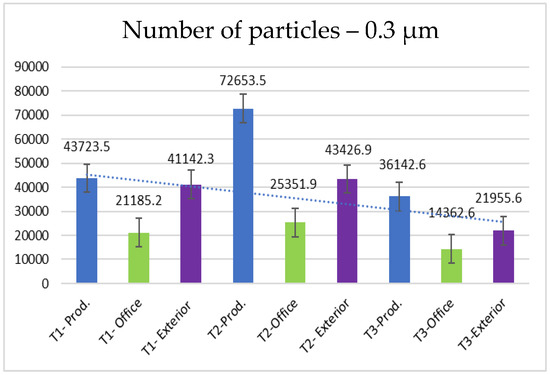
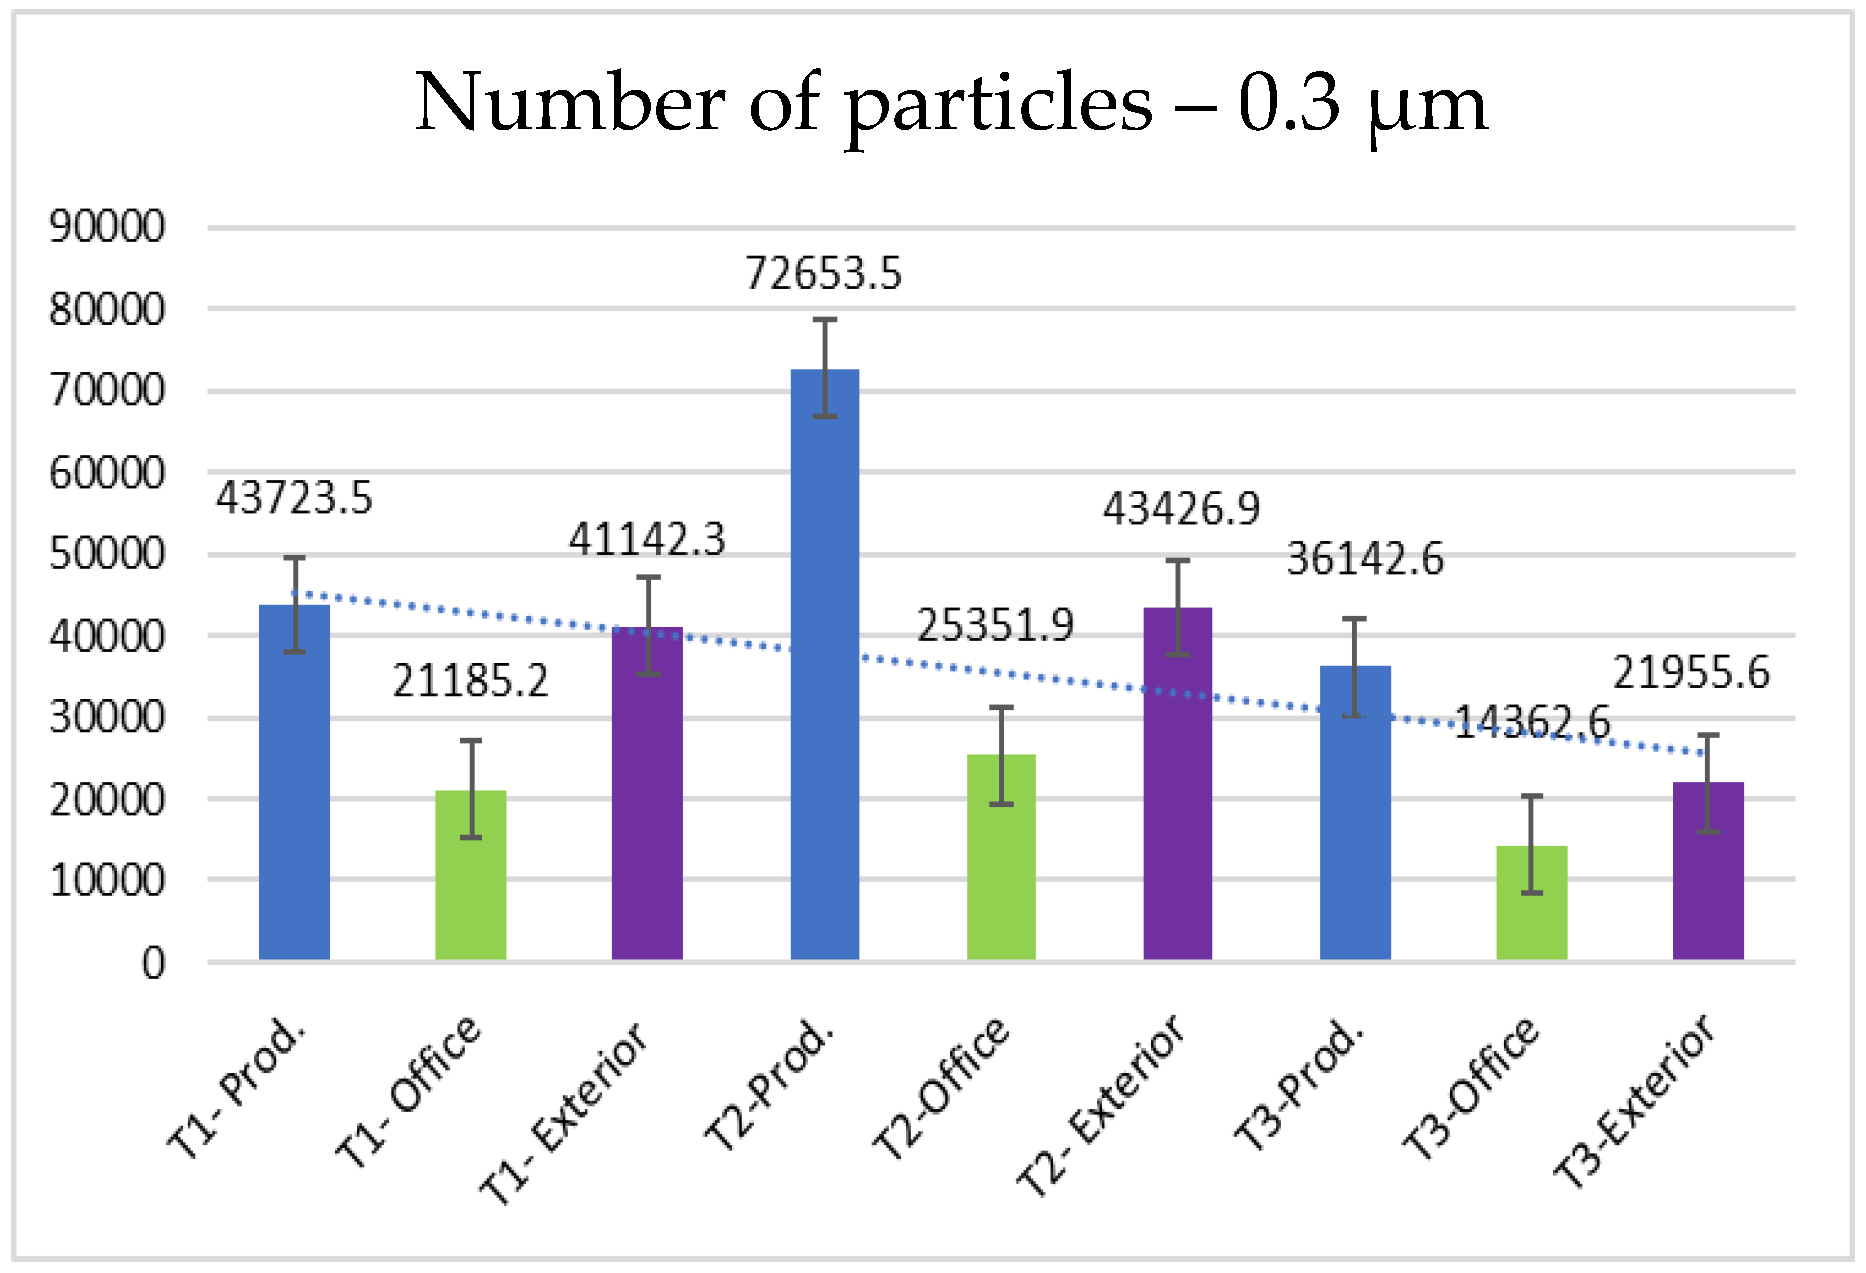
Figure 7.
Number of particles evolution—0.3 µm.
Data analysis showed the following aspects:.
- 0.3 µm particles (Figure 7): These particles are the most numerous in the production area compared to other sizes, with a maximum of 72,653.5 at T2. They are much more frequent than the larger particles. These particles show significantly higher concentrations compared to the company’s exterior.
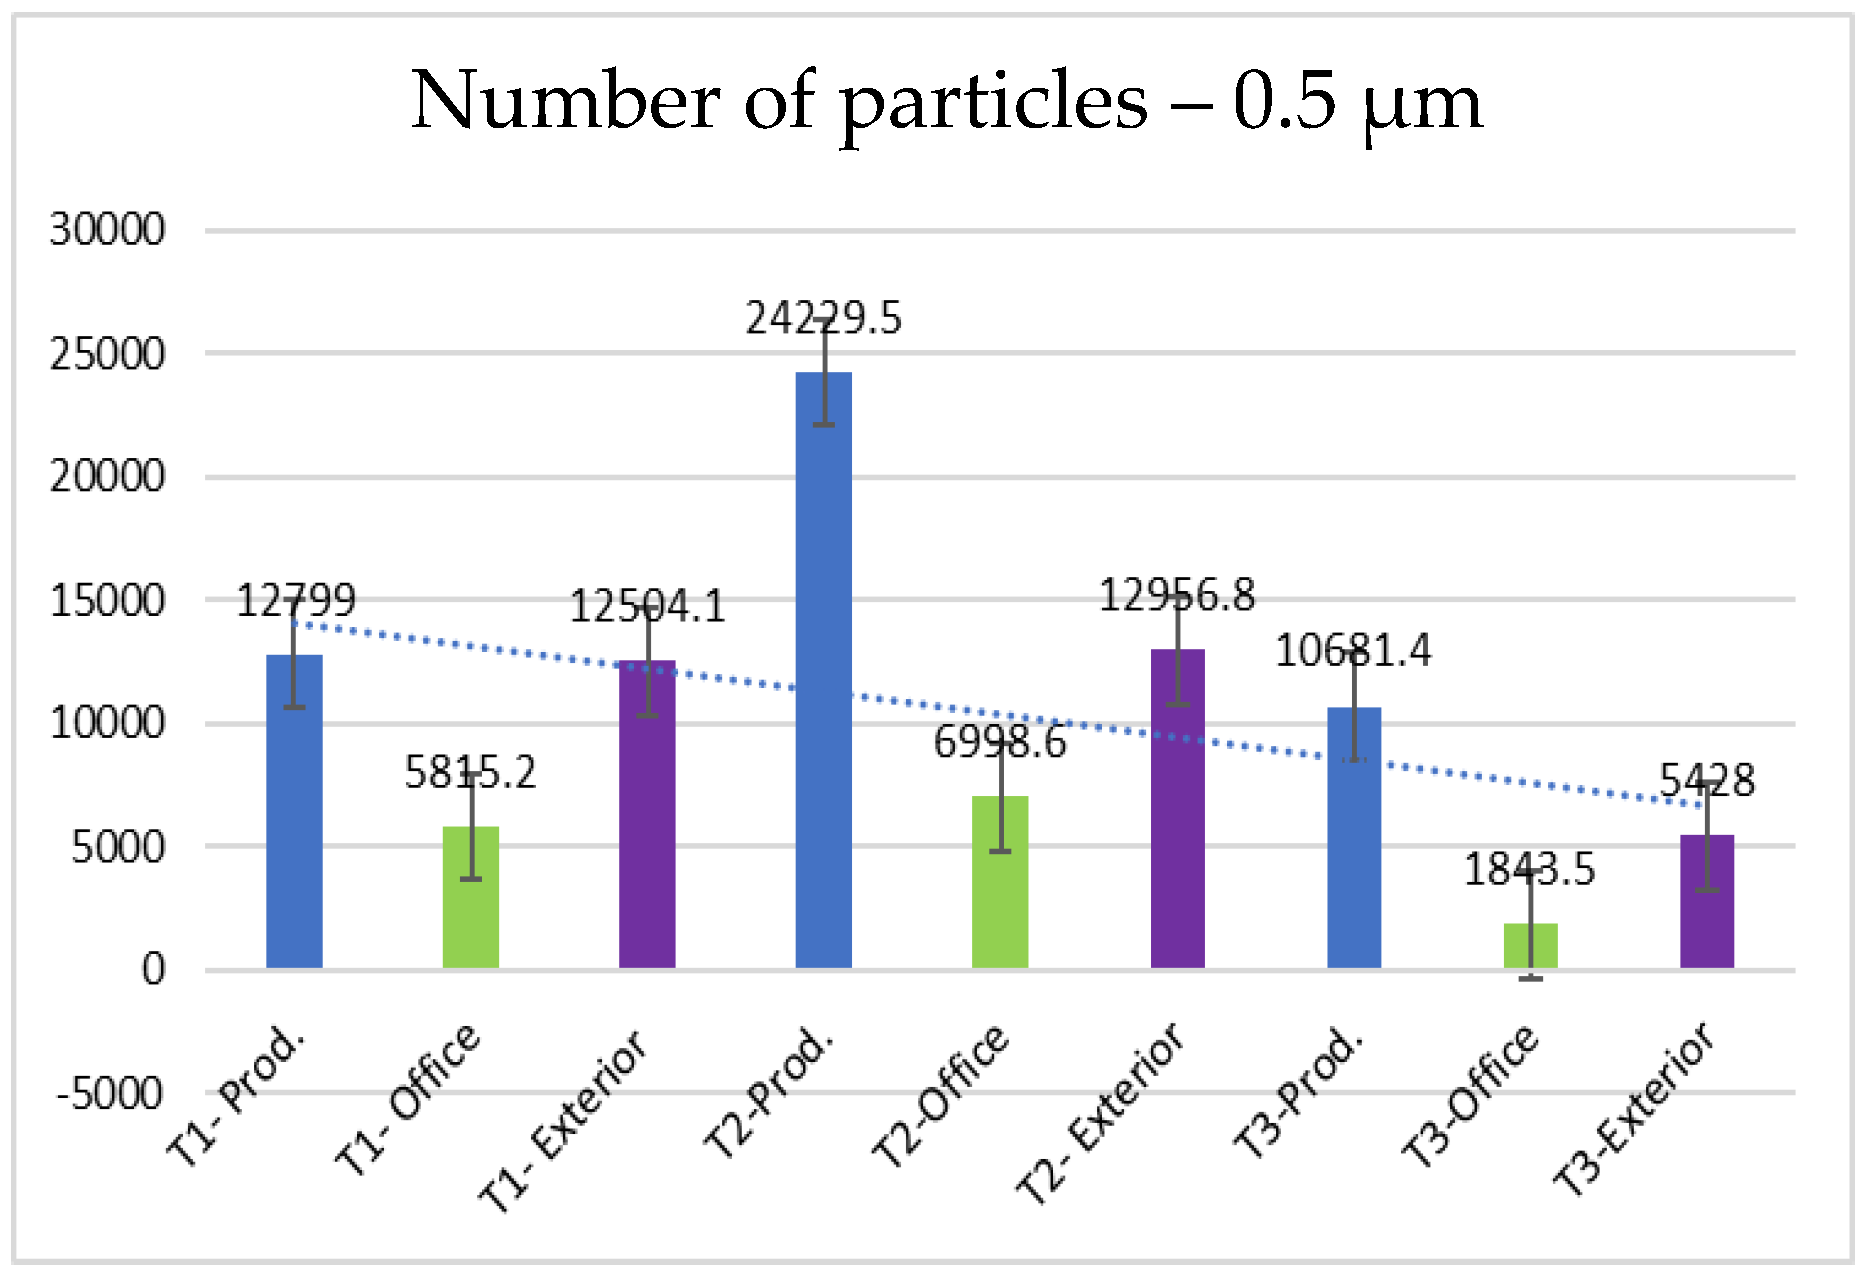
- 0.5 µm particles (Figure 8): These particles also have a large number in the production area (24,229.5 particles at T2), but their concentration is lower than that of the 0.3 µm particles. Compared to the 0.3 µm particles, their number decreases significantly.
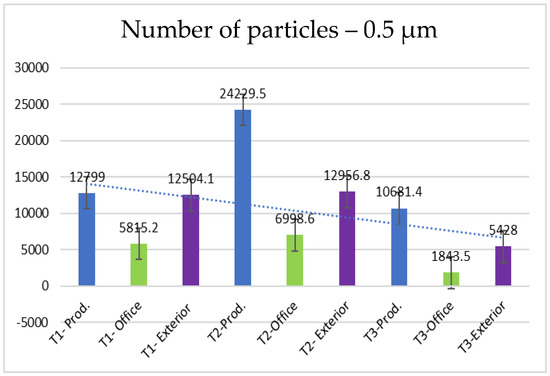 Figure 8. Number of particles evolution—0.5 µm.
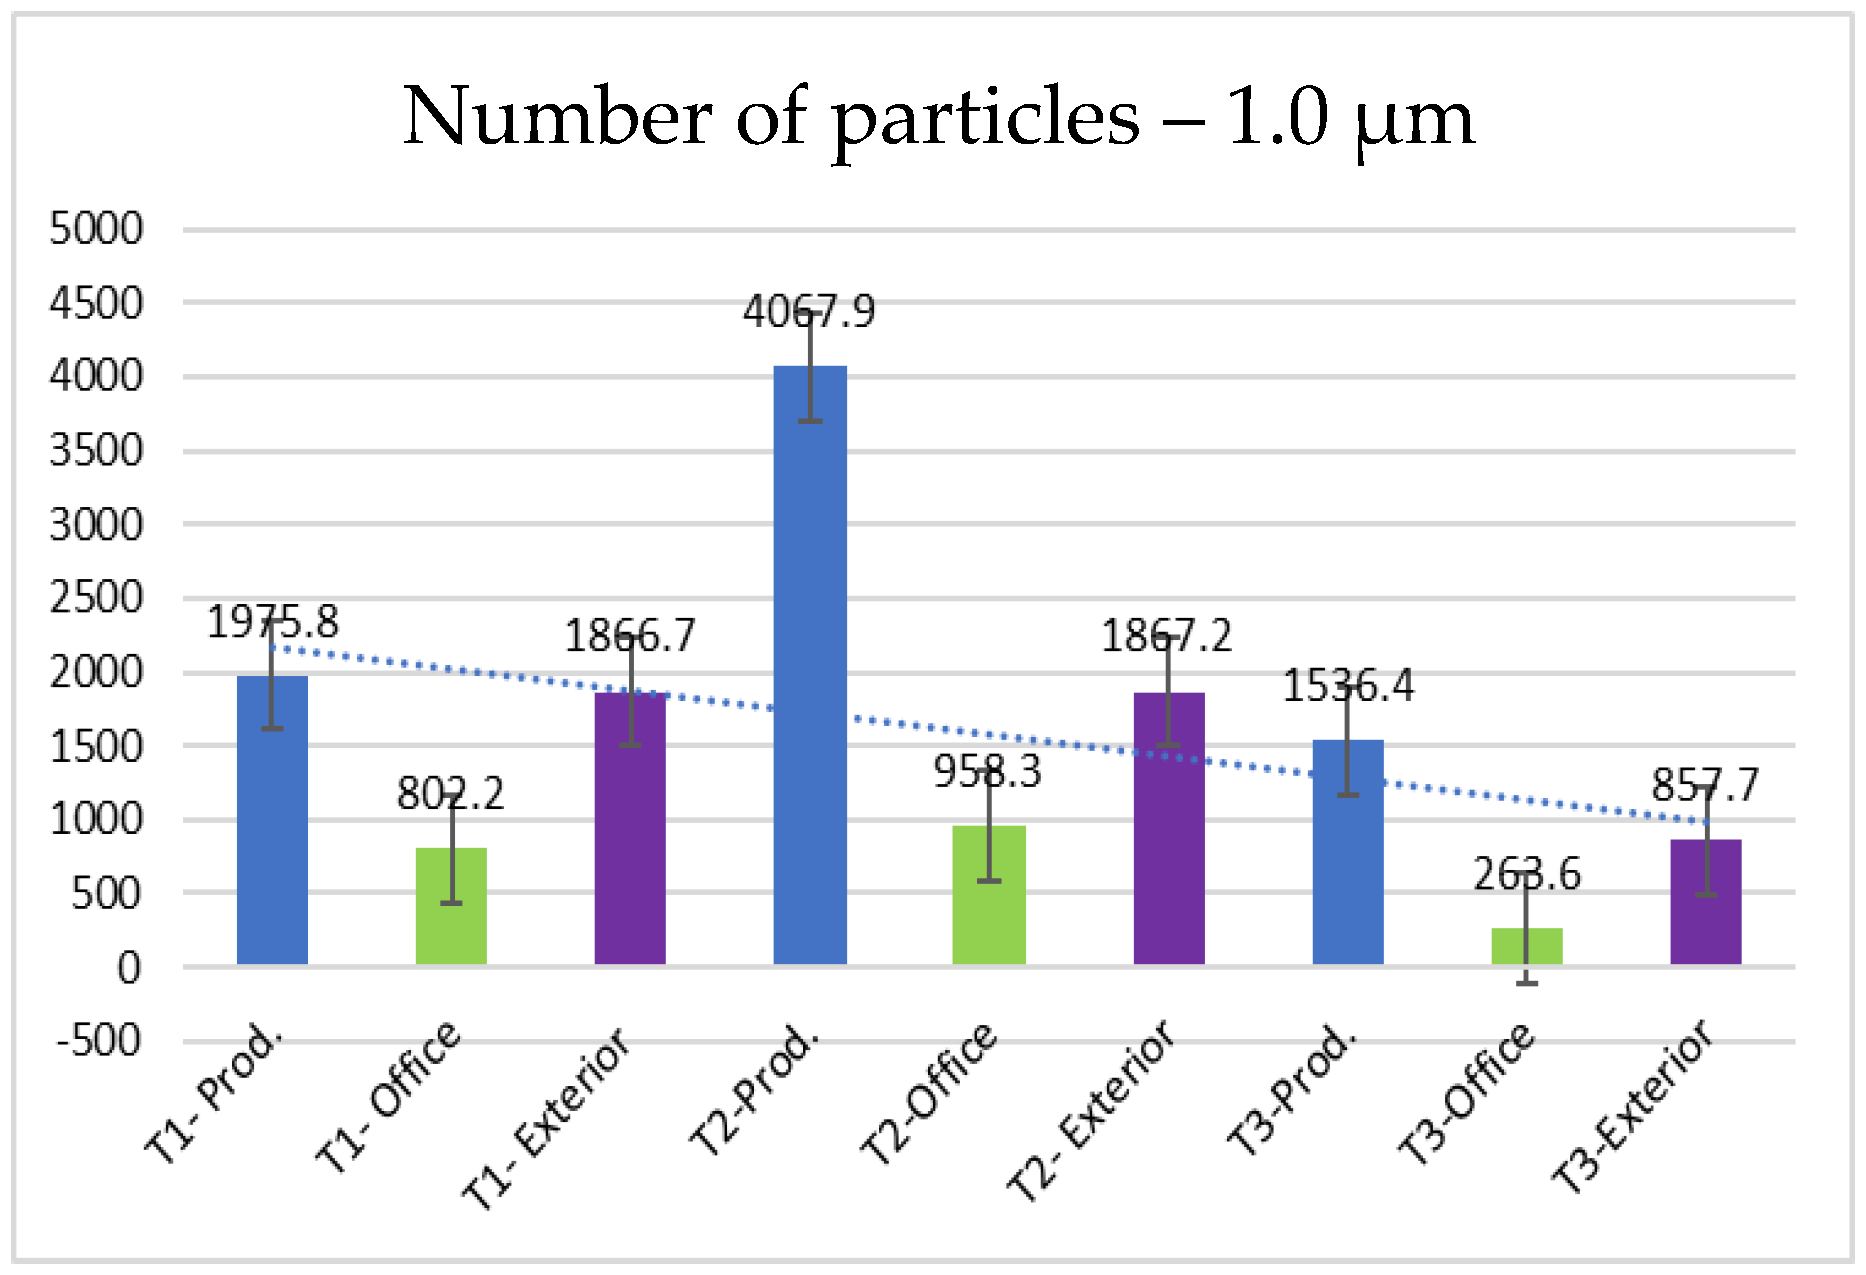
 - 1.0 µm particles (Figure 9): The concentrations of 1.0 µm particles are lower than those of the 0.3 µm and 0.5 µm particles, with a maximum of 4067.8 particles at T2 in the production area. These are significantly less frequent than the smaller particles, but still more numerous than in the exterior.
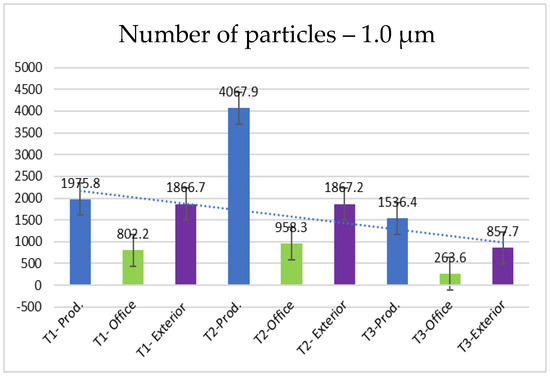 Figure 9. Number of particles evolution—1.0 µm.
 - 2.5 µm particles (Figure 10): The number of 2.5 µm particles is significantly lower than that of 0.3 µm and 0.5 µm particles, but higher than that of 5.0 µm and 10.0 µm particles. At T2, 750.9 particles were recorded in the production area, and the differences with the exterior are not as significant as with smaller particles
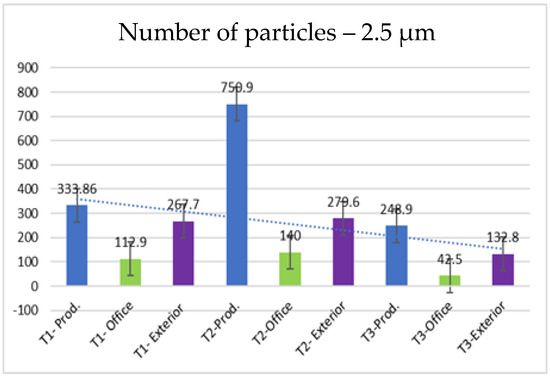 Figure 10. Number of particles evolution—2.5 µm.
 - 5.0 µm particles (Figure 11): The concentrations of 5.0 µm particles are lower than those of 2.5 µm particles, with a maximum of 94.06 particles at T2 in the production area. Compared to smaller particles, these are much less frequent but still more frequent than the 10.0 µm particles.
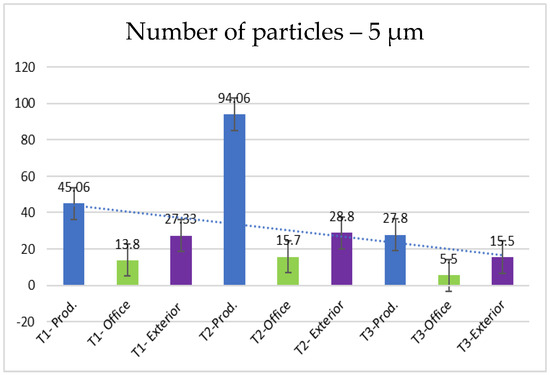 Figure 11. Number of particles evolution—5.0 µm.
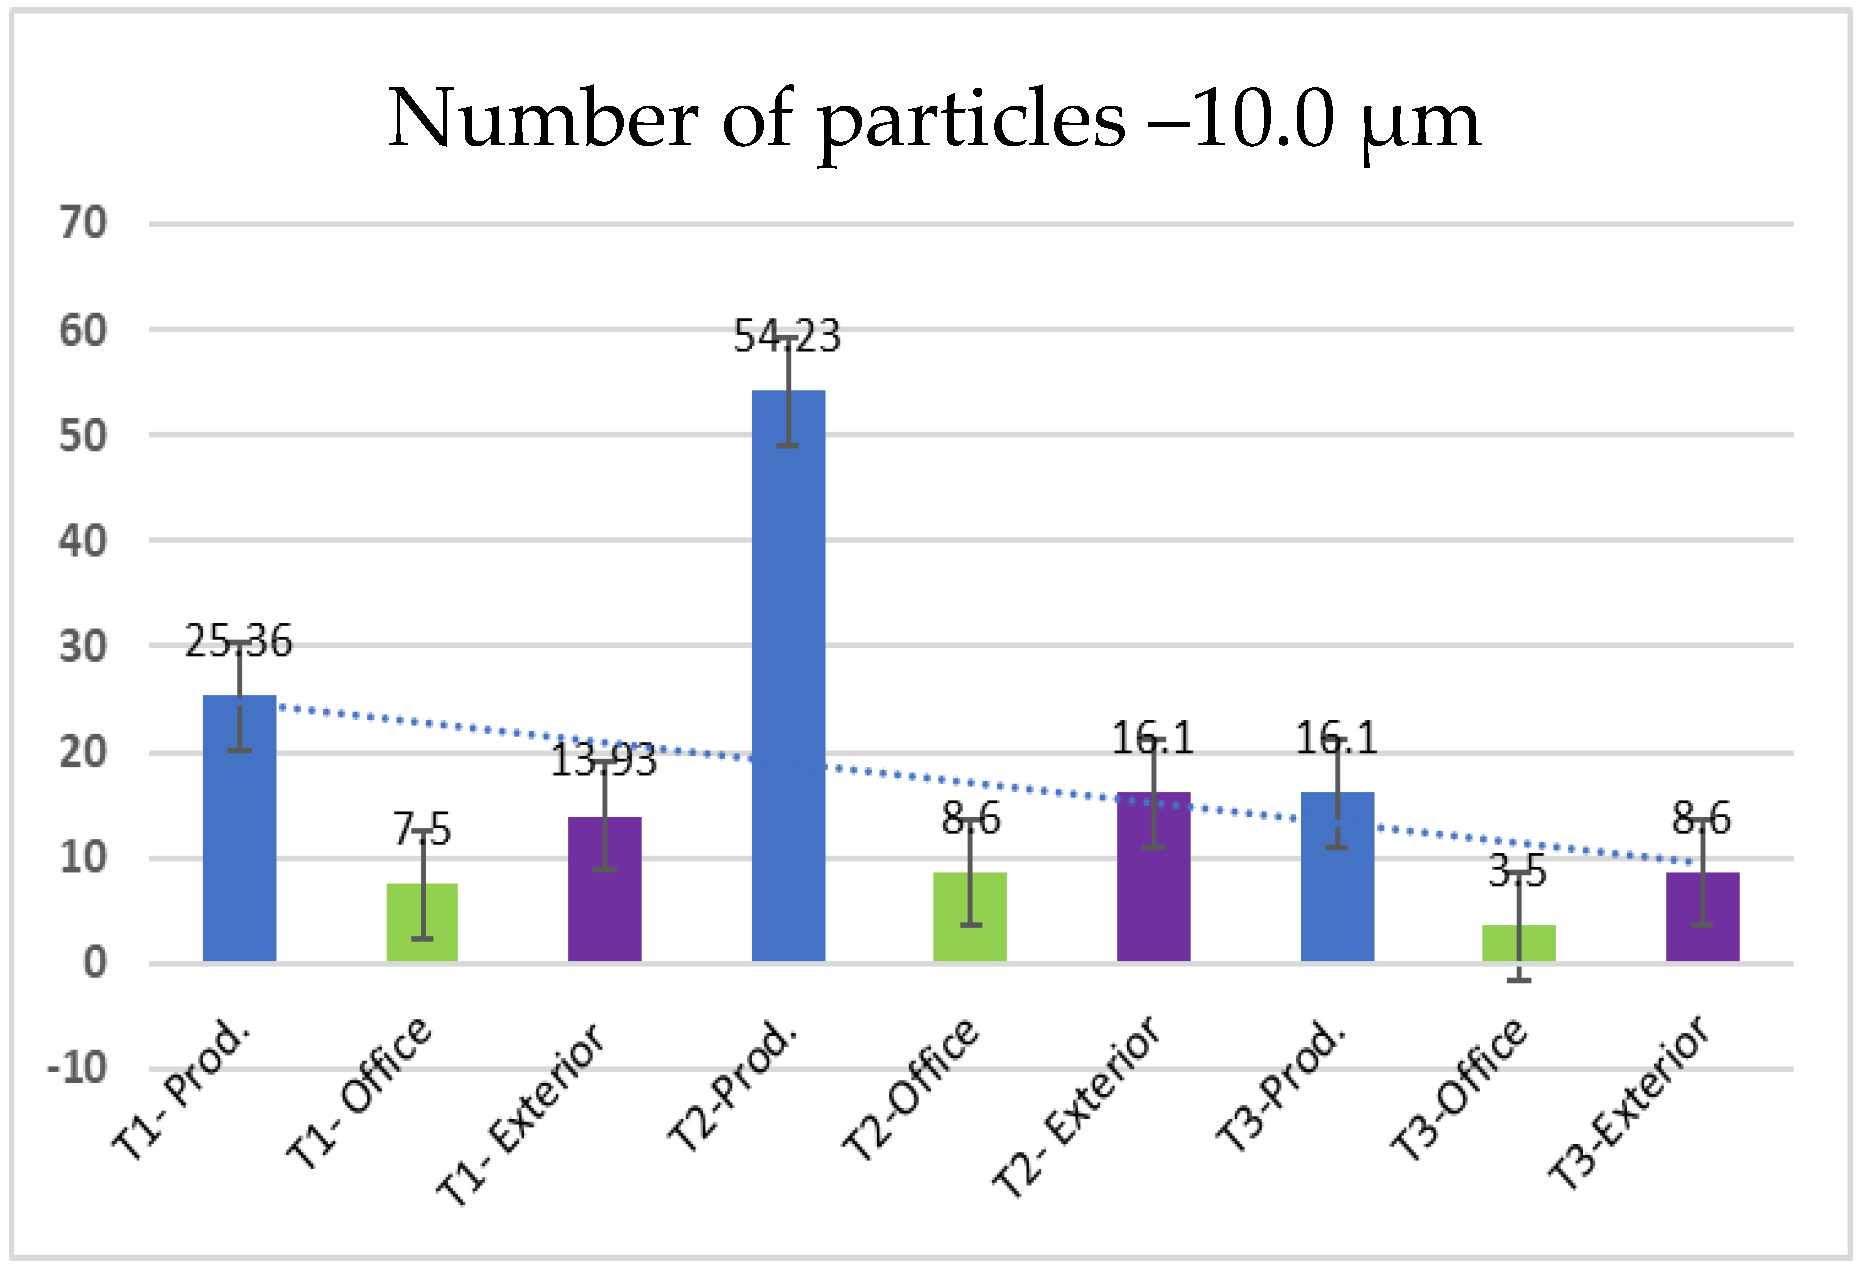
 - 10.0 µm particles (Figure 12): The least number of particles is those of 10.0 µm, with a maximum of 56.23 particles at T2 in the production area. Compared to other sizes, their number is much lower, indicating an unequal distribution of particles as their size increases.
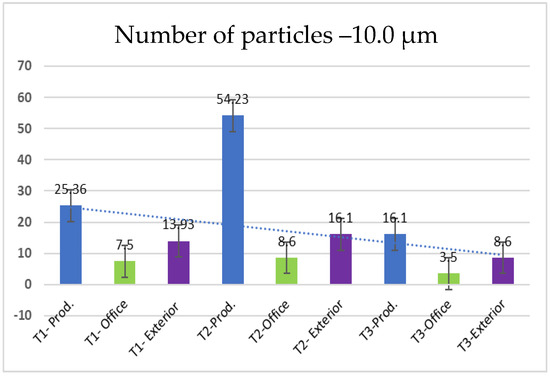 Figure 12. Number of particles evolution—10.0 µm.
3.2. Particles Collection
Table 3 presents parameters of the particle collection on the quartz filters.
Table 3.
Parameters of the particle collection on the quartz filters.
All the concentrations measured are below the legal limit for occupational health and safety for particles, both as regards to the respirable fraction (5 mg/m3) and the inhalable fraction (10 mg/m3).
The work involved investigating the factors influencing the quantity of particles collected on a filter. It focused on several key variables, including airflow (the volume of air passing through the filter per unit of time (L/min), the concentration of particles in the air (µg/m3), and the total air volume processed by the filter (L). These variables were monitored within the range of airflow (2.5–3 L/min), particle concentration (34.86–165.97 µg/m3), and air volume (303.0–570.0 L). The relationship between these factors was described using a formula as follows:
Mass of particles collected on the filter (µg) = airflow (m3/h or L/min) × time (h or min) ×concentration of particles (µg/m3).
Collection efficiency refers to the ability of a filter to capture particles from the air or gas flow passing through it. As can be seen from the data presented in Table 4, the collection efficiency ranges between 71.5% and 96.9%. This efficiency could have been influenced by the particles’ size, the type of size, and the filter type used. It was observed that fine particles, such as sub-micron-sized particles, were more likely to pass through filters compared to larger particles. Additionally, the pump operation was a critical factor. It was noted that the pump may not have functioned continuously or maintained a constant flow rate throughout the sampling period. Such fluctuations in airflow could have led to a discrepancy between the calculated and actual air volume sampled. The concentration of particles could also be varied over time and space, further contributing to potential discrepancies in the mass of particles collected. All these aspects were considered, which justified conducting separate measurements related to particle collection and their concentration in the air. The efficient collection process ensured that a sufficient quantity of particles was obtained for the analysis of their characteristics.
Table 4.
The identified polymer mass levels.
3.3. TED GC-MS Analysis
TED GC-MS was used to identify specific organic components in the collected particles, and mass spectra and chromatograms were generated. Figure 8 presents a total ion chromatogram for the particle collected at T1 in the production area.
A polymer marker molecule for polyester (PET-polyethene terephthalate) was detected, which was expected given the processing of 100% polyester materials, as well as polystyrene (monomer styrene) molecules (PS), which may originate from auxiliary parts of sewing machines and other objects in the workspaces. A contamination from the filter polystyrene cassettes could also be considered.
LOD, or limit of detection, refers to the smallest concentration of a substance or analyte that can be accurately identified or measured. In the study, LOD (PET) was 1.0 µg and LOD(PS) = 0.08 µg.
Table 4 and Figure 13 display the identified polymer mass levels for T1, T2, and T3 in the production area.
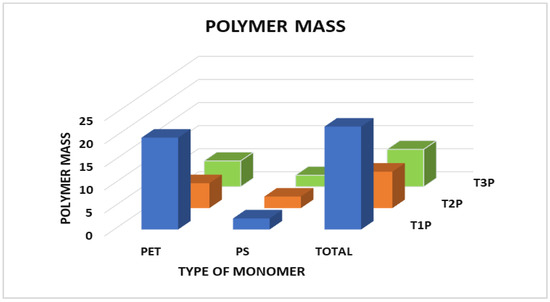
Figure 13.
The evolution of polymer mass.
It can be observed that, in all cases, PET represents the highest weight compared to PS, which is explainable by the fact that the fabric processed during sampling usually contains PET. The share of PET in the collected particles is comparable in the first part of the days: 12.9% for T1 and 16.1% for T3. For T2, the share of PET is only 2.5%, though particle concentrations are generally higher in this time interval for production. In the morning, the concentration of airborne particles is higher in textile factories because the air has not been properly ventilated overnight, and the initial work activities resuspend already settled particles and generate new ones.
4. Conclusions
- ⮚
- The concentration of particles in the production area is significantly higher than in both the office and the exterior for all time intervals, especially for T2 (for all sizes). The smallest particles (0.3 µm) dominate the production environment, with the highest concentration observed during the mid-day shift (T2). This suggests that the textile manufacturing processes, such as cutting and sewing, contribute to a substantial amount of particulate pollution, primarily consisting of fine particles and microfibers, that accumulate as the working day evolves due to poor ventilation.
- ⮚
- Smaller particles (0.3 µm and 0.5 µm) are more abundant in the production environment compared to larger particles (5.0 µm and 10.0 µm). As the particle size increases, the concentration tends to decrease, indicating that smaller particles are more prevalent during the textile manufacturing process. The distribution of particle sizes also exhibits distinct skewness: Smaller particles are more frequent with a left-skewed distribution, while larger particles show a right-skewed distribution. It is hard to tell if this is caused by the work processes, because smaller particles tend to stay in the air longer, or both.
- ⮚
- The concentration of airborne particles varies throughout the day (T1, T2, and T3) and between locations (production, office, and exterior). For example, particle levels in the production area peak around and after midday (T2) and show a significant drop in the morning of Day II (T3). This variation emphasizes the dynamic nature of particle concentration, being influenced by production activities and the time of day.
- ⮚
- The study showed that the filtration method for particle collection was efficient, with collection efficiencies ranging between 71.5% and 96.9%. However, smaller particles (sub-micron-sized) tend to pass through the filters more easily than larger ones, and fluctuations in the airflow rate of the pumps might contribute to discrepancies in the sampled air volume.
- ⮚
- Analysis using TED-GS-MS confirmed the presence of PET and polystyrene (PS) markers in airborne particles, with PET being the most predominant polymer detected. This finding correlates with the use of polyester materials in the manufacturing of sports t-shirts. The detection of these substances suggests that textile processing contributes significantly to the release of polymer-based pollutants into the air: 2.5–16.1% of the sampled particles.
- ⮚
- Although the concentration of collected particles is lower than the legal exposure limit for the respirable/inhalable fraction, the high share of very small particles indicates considerable risks to workers’ health. Such very small particles can penetrate deep into the respiratory system and cause health problems. Some research is currently in progress, and the results and additional information will be available to provide more details regarding particle concentration in various textile workplaces.
- ⮚
- The findings highlight the need for air quality control measures, particularly in the production areas of textile factories. The high concentration of fine particles, especially in the 0.3 µm and 0.5 µm range, calls for effective filtration systems and ventilation strategies to reduce airborne particle exposure, protecting workers’ health and improving air quality in industrial environments. The study suggests that the manufacturing processes in textile factories, especially those dealing with polyester materials, are significant sources of airborne particulate pollution, with implications for both environmental and workplace health. Further studies and better air quality management strategies are necessary to mitigate these risks.
Author Contributions
Conceptualization: E.V.; methodology: K.A., P.T.M., R.S. and M.H.; software: M.C.G. and R.S. (Razvan Scarlat); validation: E.V.; investigation: E.V., R.S. (Raluca Stepa) and F.D.; data curation: E.V., M.H. and F.D.; writing—E.V., M.C.G. and R.S. (Raluca Stepa); writing—review and editing: E.V., M.C.G. and R.S. (Raluca Stepa); visualization: F.D., A.V. and M.C.G.; project administration: E.V. All authors have read and agreed to the published version of the manuscript.
Funding
This project has received funding from the European Union’s Horizon 2020 Research and Innovation Program under grant agreement number 964766—POLYRISK—H2020-SC1-BHC-2018-2020/H2020-SC1-2020-Single-Stage-RTD. This paper reflects the views of the author(s), and the European Union cannot be held responsible for any use which may be made of the information contained there.
Institutional Review Board Statement
Not applicable.
Informed Consent Statement
Not applicable.
Data Availability Statement
Research data are at the organisation where the authors work and at the coordinator of the project.
Conflicts of Interest
The authors declare no conflicts of interest.
References
- Chang, X.; Xue, Y.; Li, J.; Zou, L.; Tang, M. Potential health impact of environmental micro-and nanoplastics pollution. J. Appl. Toxicol. 2020, 40, 4–15. [Google Scholar] [CrossRef] [PubMed]
- Urbanek, A.K.; Rymowicz, W.; Mirończuk, A.M. Degradation of plastics and plastic-degrading bacteria in cold marine habitats. Appl. Microbiol. Biotechnol. 2018, 102, 7669–7678. [Google Scholar] [CrossRef] [PubMed]
- Othman, A.R.; Hasan, H.A.; Muhamad, M.H.; Ismail, N.I.; Abdullah, S.R.S. Microbial degradation of microplastics by enzymatic processes: A review. Environ. Chem. Lett. 2021, 19, 3057–3073. [Google Scholar] [CrossRef]
- Lee, H.M.; Kim, H.R.; Jeon, E.; Yu, H.C.; Lee, S.; Li, J.; Kim, D.H. Evaluation of the biodegradation efficiency of four various types of plastics by Pseudomonas aeruginosa isolated from the gut extract of superworms. Microorganisms 2020, 8, 1341. [Google Scholar] [CrossRef] [PubMed]
- Shen, M.; Song, B.; Zeng, G.; Zhang, Y.; Huang, W.; Wen, X.; Tang, W. Are biodegradable plastics a promising solution to solve the global plastic pollution? Environ. Pollut. 2020, 263, 114469. [Google Scholar] [CrossRef] [PubMed]
- Prajapati, A.; Narayan Vaidya, A.; Kumar, A.R. Microplastic properties and their interaction with hydrophobic organic contaminants: A review. Environ. Sci. Pollut. Res. 2022, 29, 49490–49512. [Google Scholar] [CrossRef] [PubMed]
- European Environment Agency. Microplastics from Textiles—Towards a Circular Economy. EEA Report No. 12/2022. 2022. Available online: https://www.eea.europa.eu/publications/microplastics-from-textiles-towards-a (accessed on 30 March 2025).
- Yang, T.; Gao, M.; Nowack, B. Formation of microplastic fibers and fibrils during abrasion of a representative set of 12 polyester textiles. Sci. Total Environ. 2023, 862, 160758. [Google Scholar] [CrossRef] [PubMed]
- NILU. Micro and Nano Plastics in the Marine-Atmospheric Environment. Available online: https://nilu.com/2022/05/micro-and-nano-plastics-in-the-marine-atmospheric-environment/ (accessed on 30 March 2025).
- Sheraz, M.; Kim, J.; Kim, J. Nano/microplastics in indoor air: A critical review of synthesis routes for toxicity testing and preventative measure strategies. Process Saf. Environ. Prot. 2023, 180, 274–304. [Google Scholar] [CrossRef]
- Shojaee Barjoee, S.; Azimzadeh, H.; Hosseini Sangchi, S. Study of Suspended Air Particles and Health Risk Assessment of Exposure to PM10 and PM2.5 in One of the Textile Industries. J. Health 2020, 11, 144–155. Available online: http://healthjournal.arums.ac.ir/article-1-2159-en.html (accessed on 30 March 2025). [CrossRef]
- Hasan, M.K.; Shahriar, A.; Jim, K.U. Water pollution in Bangladesh and its impact on public health. Heliyon 2019, 5, e02145. [Google Scholar] [CrossRef] [PubMed]
- Visileanu, E.; Ene, A.G.; Grosu, M.C.; Miclea, P.T.; Scarlat, R.V. The Structural Influence of Airborne Particles on their Toxicity. Adv. Mater. Lett. 2023, 14, 2302-1718. [Google Scholar] [CrossRef]
- Adegeest, D.-A. European Commission Urged to Deal with Microplastics from Synthetic Textiles, FashionUnited. 2023. Available online: https://fashionunited.com/news/fashion/european-commission-urged-to-deal-with-microplastics-from-synthetic-textiles/2023041853372 (accessed on 30 March 2025).
- Feron, V.J.; de Jong, W.H. Health risks of nanoparticles in the workplace. Lancet 2015, 385, 2299–2300. [Google Scholar]
- Fitzgerald, D.C.; Russo, D. Inhalation and systemic distribution of inhaled nanoparticles: Implications for human health. Nanomedicine 2019, 14, 2409–2422. [Google Scholar]
- Schwabe, S.; Pohl, C. Microplastics in food and the human body: A review. Environ. Int. 2020, 141, 105755. [Google Scholar]
- Prado, J.M.; Vieira, E.A. Nanoparticles in the environment: Distribution, exposure, and biological impact on human health. J. Nanosci. Nanotechnol. 2019, 19, 3914–3926. [Google Scholar]
- Nel, A.; Xia, T.; Mädler, L.; Li, N. Toxic potential of materials at the nanolevel. Science 2006, 311, 622–627. [Google Scholar] [CrossRef] [PubMed]
- Wright, S.L.; Kelly, F.J. Plastic and human health: A micro issue? Environ. Sci. Technol. 2017, 51, 6634–6647. [Google Scholar] [CrossRef] [PubMed]
- Gao, S.; Song, Z.; Xu, Z.; Zhang, Q. Nanoplastics in the environment: Sources, fate, and impacts. Environ. Sci. Nano 2018, 5, 3–28. [Google Scholar]
- Abdolahpur Monikh, F.; Baun, A.; Hartmann, N.B.; Kortet, R.; Akkanen, J.; Lee, J.S.; Shi, H.; Lahive, E.; Uurasjärvi, E.; Tufenkji, N.; et al. Exposure protocol for ecotoxicity testing of microplastics and nanoplastics. Nat. Protoc. 2023, 18, 3534–3564. [Google Scholar] [CrossRef] [PubMed]


Disclaimer/Publisher’s Note: The statements, opinions and data contained in all publications are solely those of the individual author(s) and contributor(s) and not of MDPI and/or the editor(s). MDPI and/or the editor(s) disclaim responsibility for any injury to people or property resulting from any ideas, methods, instructions or products referred to in the content. |
© 2025 by the authors. Licensee MDPI, Basel, Switzerland. This article is an open access article distributed under the terms and conditions of the Creative Commons Attribution (CC BY) license (https://creativecommons.org/licenses/by/4.0/).