Article

Fate of Microplastics in Deep Gravel Riverbeds: Evidence for Direct Transfer from River Water to Groundwater

1
Department Geotechnical Engineering, Federal Waterways Engineering and Research Institute (BAW), 76187 Karlsruhe, Germany
2
Institute of Environmental Science and Geography, University of Potsdam, 14476 Potsdam, Germany
3
International Rhine Regulation (IRR), St. Margrethen, 9000 St. Gallen, Switzerland
*
Authors to whom correspondence should be addressed.
Microplastics 2025, 4(2), 26; https://doi.org/10.3390/microplastics4020026
Submission received: 28 March 2025 / Revised: 17 April 2025 / Accepted: 5 May 2025 / Published: 8 May 2025

Abstract

:
Riverbed sediments act as potential retention reservoirs or transport corridors for microplastic particles (MPs) from river water to groundwater. Vertical concentration profiles of MPs, together with river water and groundwater analysis, provide insight into their fate and transport behavior in freshwater systems. However, such data remain scarce. This study provides a depth-specific analysis of MPs ≥ 100 µm (abundance, type, and size) in gravelly riverbed sediments down to 200 cm, along with river water and groundwater analysis. Three sediment freeze cores were collected from the Alpine Rhine, a channelized mountain stream with high flow velocities and permanent losing stream conditions. The average MP abundance in the riverbed was 3.1 ± 2.3 MP/kg (100–929 µm); in the river, 92 ± 5 MP/m3 (112–822 µm); and in the groundwater, 111 ± 6 MP/m3 (112–676 µm). The dominant polymer types in the riverbed were polypropylene (PP), polyvinyl chloride (PVC), and polyethylene terephthalate (PET) (>70%), while polyamide (PA) dominated in the river water (56%) and the groundwater (76%). The comparable MP concentration, particle sizes, and polymer types between river water and groundwater, as well as the vertical MP concentration profiles, indicate that even large MPs up to 676 µm are transported from river water to groundwater without significant retention in the gravel sediment.

1. Introduction

Microplastic particles (MPs; 1 µm to 5 mm in size), as an emerging contaminant, are ubiquitous in freshwater ecosystems such as rivers [1,2], which serve as a major pathway for the transport of plastics from terrestrial environments to the oceans [3,4]. However, recent studies have shown that riverbed and riverbank sediments can be important temporary or long-term retention reservoirs for MPs [5,6]. In contrast, adjacent groundwater systems are often assumed to be pristine and less contaminated by MPs than surface water or fluvial sediments [7].
River water and groundwater interact hydraulically through recharge and discharge dynamics, facilitating the exchange of water, solutes, and particles [8,9]. Low-density polymers are typically expected to remain buoyant, but processes such as biofouling, biofilm formation, aggregation, and turbulence can allow them to infiltrate into sediments [10,11]. In sediments, the biodegradation of certain types of MPs (e.g., polyethylene terephthalate (PET)) or mechanical weathering may result in further particle size reduction [12]. Little attention has been paid to the driving mechanisms of MP transport, relocation, and retention within the porous media transition zone. Particle transport in porous media is fundamentally different from solute transport and is strongly influenced by the ratio of particle size to pore diameter [13,14]. In particular, small MPs (<20 μm) are assumed to be advectively transported at the pore scale through the riverbed sediments across the surface water–groundwater interface into the shallow groundwater system [15,16,17]. Because groundwater serves as the primary source of drinking water for approximately 31.5% (2.2 billion people) of the world’s population [18,19], the potential for MPs to enter groundwater or drinking water resources has been raised as a major global health concern [7,20]. Despite this, there are comparatively few studies on the occurrence of MPs in groundwater resources, with little focus on the potential risk of MP transfer from surface water to the groundwater system via riverbed sediment [21,22,23].
Depth-specific MP profiles can provide valuable insights into MP accumulation and retention processes in riverbed sediments [15,24]. However, information on the depth-specific distribution and abundance of MPs in deep riverbed sediments >60 cm is scarce [24,25]. This knowledge is critical for elucidating the environmental behavior and fate of MPs in fluvial environments [26,27]. Most fluvial studies have focused on shallow sediment layers (0–30 cm) or, in some cases, layers to depths of 50–60 cm [15], with contradictory results on vertical MP trends, reporting both increasing [12,28] and decreasing concentrations [29,30]. Pittroff et al. [24] analyzed the MP distribution in riverbeds to a depth of 100 cm and identified three distinct vertical trends: nearly stable concentrations in the top layers (0–30 cm), a decrease in the middle layers (30–60 cm), and an increase in the deep layers (60–100 cm). Based on these findings, an initial conceptual approach was proposed, suggesting the use of MPs as a potential process tracer for riverbed sediment dynamics.
The challenges of and limitations to depth-oriented sampling in water-saturated sediments under flowing water are one reason for the lack of MP studies in deep riverbed sediments (>60 cm). In particular, when the cohesion of the sediment structure is very low, as in the case of gravel-sized sediments, conventional sampling techniques such as gravity or drill coring have usually failed [31,32]. During insertion and withdrawal of the corer, the sample liquefies and is lost, or the original sediment structure is destroyed. In contrast, the freeze core technique allows depth-oriented and undisturbed sampling of non-cohesive, water-saturated sediments by freezing the sediment while preserving the original sediment structure [33,34]. The sampling method is particularly suitable for rivers with relatively large water depths (>2–10 m) and high flow velocities, where samples can be collected down to a sediment depth of typically 1.0 m [15,24].
In this study, the vertical distribution of MPs in the gravelly riverbed of the Alpine Rhine was investigated, complemented by river water and groundwater analysis. The Alpine Rhine is a canalized mountain river with coarse gravel sediments and permanent losing conditions at the study site, which has representative site characteristics that are often important for drinking water supply. The freeze core technique was used to obtain depth-oriented sediment samples with undisturbed structure down to an unprecedented depth of 200 cm by successively taking two separate 100 cm cores with increasing depth. The results enhance our understanding of the depth-specific distribution of MPs in deep riverbed sediments and underscore the role of advective particle transport in the transfer of MPs from river water to deeper sediments and even to groundwater.

2. Materials and Methods

2.1. Study Site

The Alpine Rhine (Switzerland and Austria) comprises the first 90 km of the Rhine River between the confluence of the Anterior and Posterior Rhine and Lake Constance. The foreland of the Alpine Rhine is used for the drinking water supply of 200,000 people, for agriculture, and as a floodplain during high water. The study site (73.0–73.2 river km) is located 1 km downstream of the main drinking water extraction plant of the Alpine Rhine Valley (~3.5 million m3/year). Early in the 20th century, the Alpine Rhine was channelized with dams for flood protection and developed into a double trapezoidal profile. The mean volumetric discharge (MQ) was 230–250 m3/s, the low-water discharge (NNQ) was 40 m3/s, and the high-water discharge (HQ100) was 3100 m3/s. The mean stream flow velocity was between 1 and 5 m/s, the river width was between 50 and 70 m, and the water depth was between 1 and 4 m. There was a high suspended load of ~2.5 million t/a. The aquifer was formed by Rhine gravel with a high hydraulic conductivity (kf) of 3–5 × 10⁻³ m/s and an average thickness of ~14 m [35]. The average groundwater flow rate in the aquifer was about 2 m/day, corresponding to a low groundwater gradient of about 0.0015. The groundwater level is below the Alpine Rhine water level in all hydrological situations, which implies a continuous infiltration of river water into the alluvial aquifer (permanent losing conditions) [35].

2.2. Sampling and Analysis

In April 2021, three undisturbed, depth-oriented, and water-saturated sediment cores (100 cm long and 30–50 cm in diameter) were collected from the riverbed near Mäder, Austria (Figure 1), using the freeze core technique as previously described by Pittroff et al. [24]. Briefly, a hollow metal lance (4.5 cm diameter) was inserted into the riverbed from a ship, and liquid nitrogen (−196 °C) was circulated through the lance for 30–45 min, freezing the surrounding sediment into a solid core that was 20–50 cm in diameter. One core (AR 1) was taken close to the groundwater well (73.15 river km; coordinates N 47°21′20.034, E 9°36′36.936), and two combined cores (AR 2-I and AR 2-II) were collected 150 m upstream (73.0 river km; coordinates N 47°21′16.7832, E 9°36′32.994) (Figure 1). After sampling the first core (AR 2-I), an excavator was used to dig a hole, approximately 100 cm deep, at the location of AR 2-I. Then, AR 2-II was taken at the bottom of the hole and thus covered a depth of 100–200 cm below the riverbed. AR 2-I and AR 2-II are combined to represent the continuous riverbed profile from 0–200 cm and are referred to as AR 2.
After sampling, the sediment cores were sliced into depth segments of the same sediment texture (Table 1). The sediment was oven-dried at 60 °C and sieved (stainless-steel sieves; Retsch GmbH, Haan, Germany) to a <2 mm fine sediment fraction (sand, silt, and clay) for further processing. The ≥2 mm coarse sediment fraction (gravel and cobble) was visually inspected for microplastics (no MPs were found overall) and not further processed. The corresponding total dry weights of all depth segments are listed in Table 1. In AR 2 (140–200 cm), due to the coarse sediment texture (98–99.6%) (Figure 2), it was not possible to extract sufficient fine sediment (<2 mm) by sieving for further spectroscopic MP analysis as described below.
The sediment grain-size distribution [36] and sediment textural classification [37] were determined for each depth segment in aliquots of sub-samples. The organic matter content was estimated using loss on ignition (heated at 550 °C for 4–8 h) according to DIN 18128 [38]. Hydraulic conductivity (kf) was estimated from the grain-size distribution (d10, diameter of the 10th percentile) and an empirically derived coefficient as formulated by Hazen [39]. For water samples, sampled particles were extracted from filter sieves using an ultrasonic bath and concentrated on stainless-steel filter membranes (50 µm mesh, Ø 47 mm) for further processing.
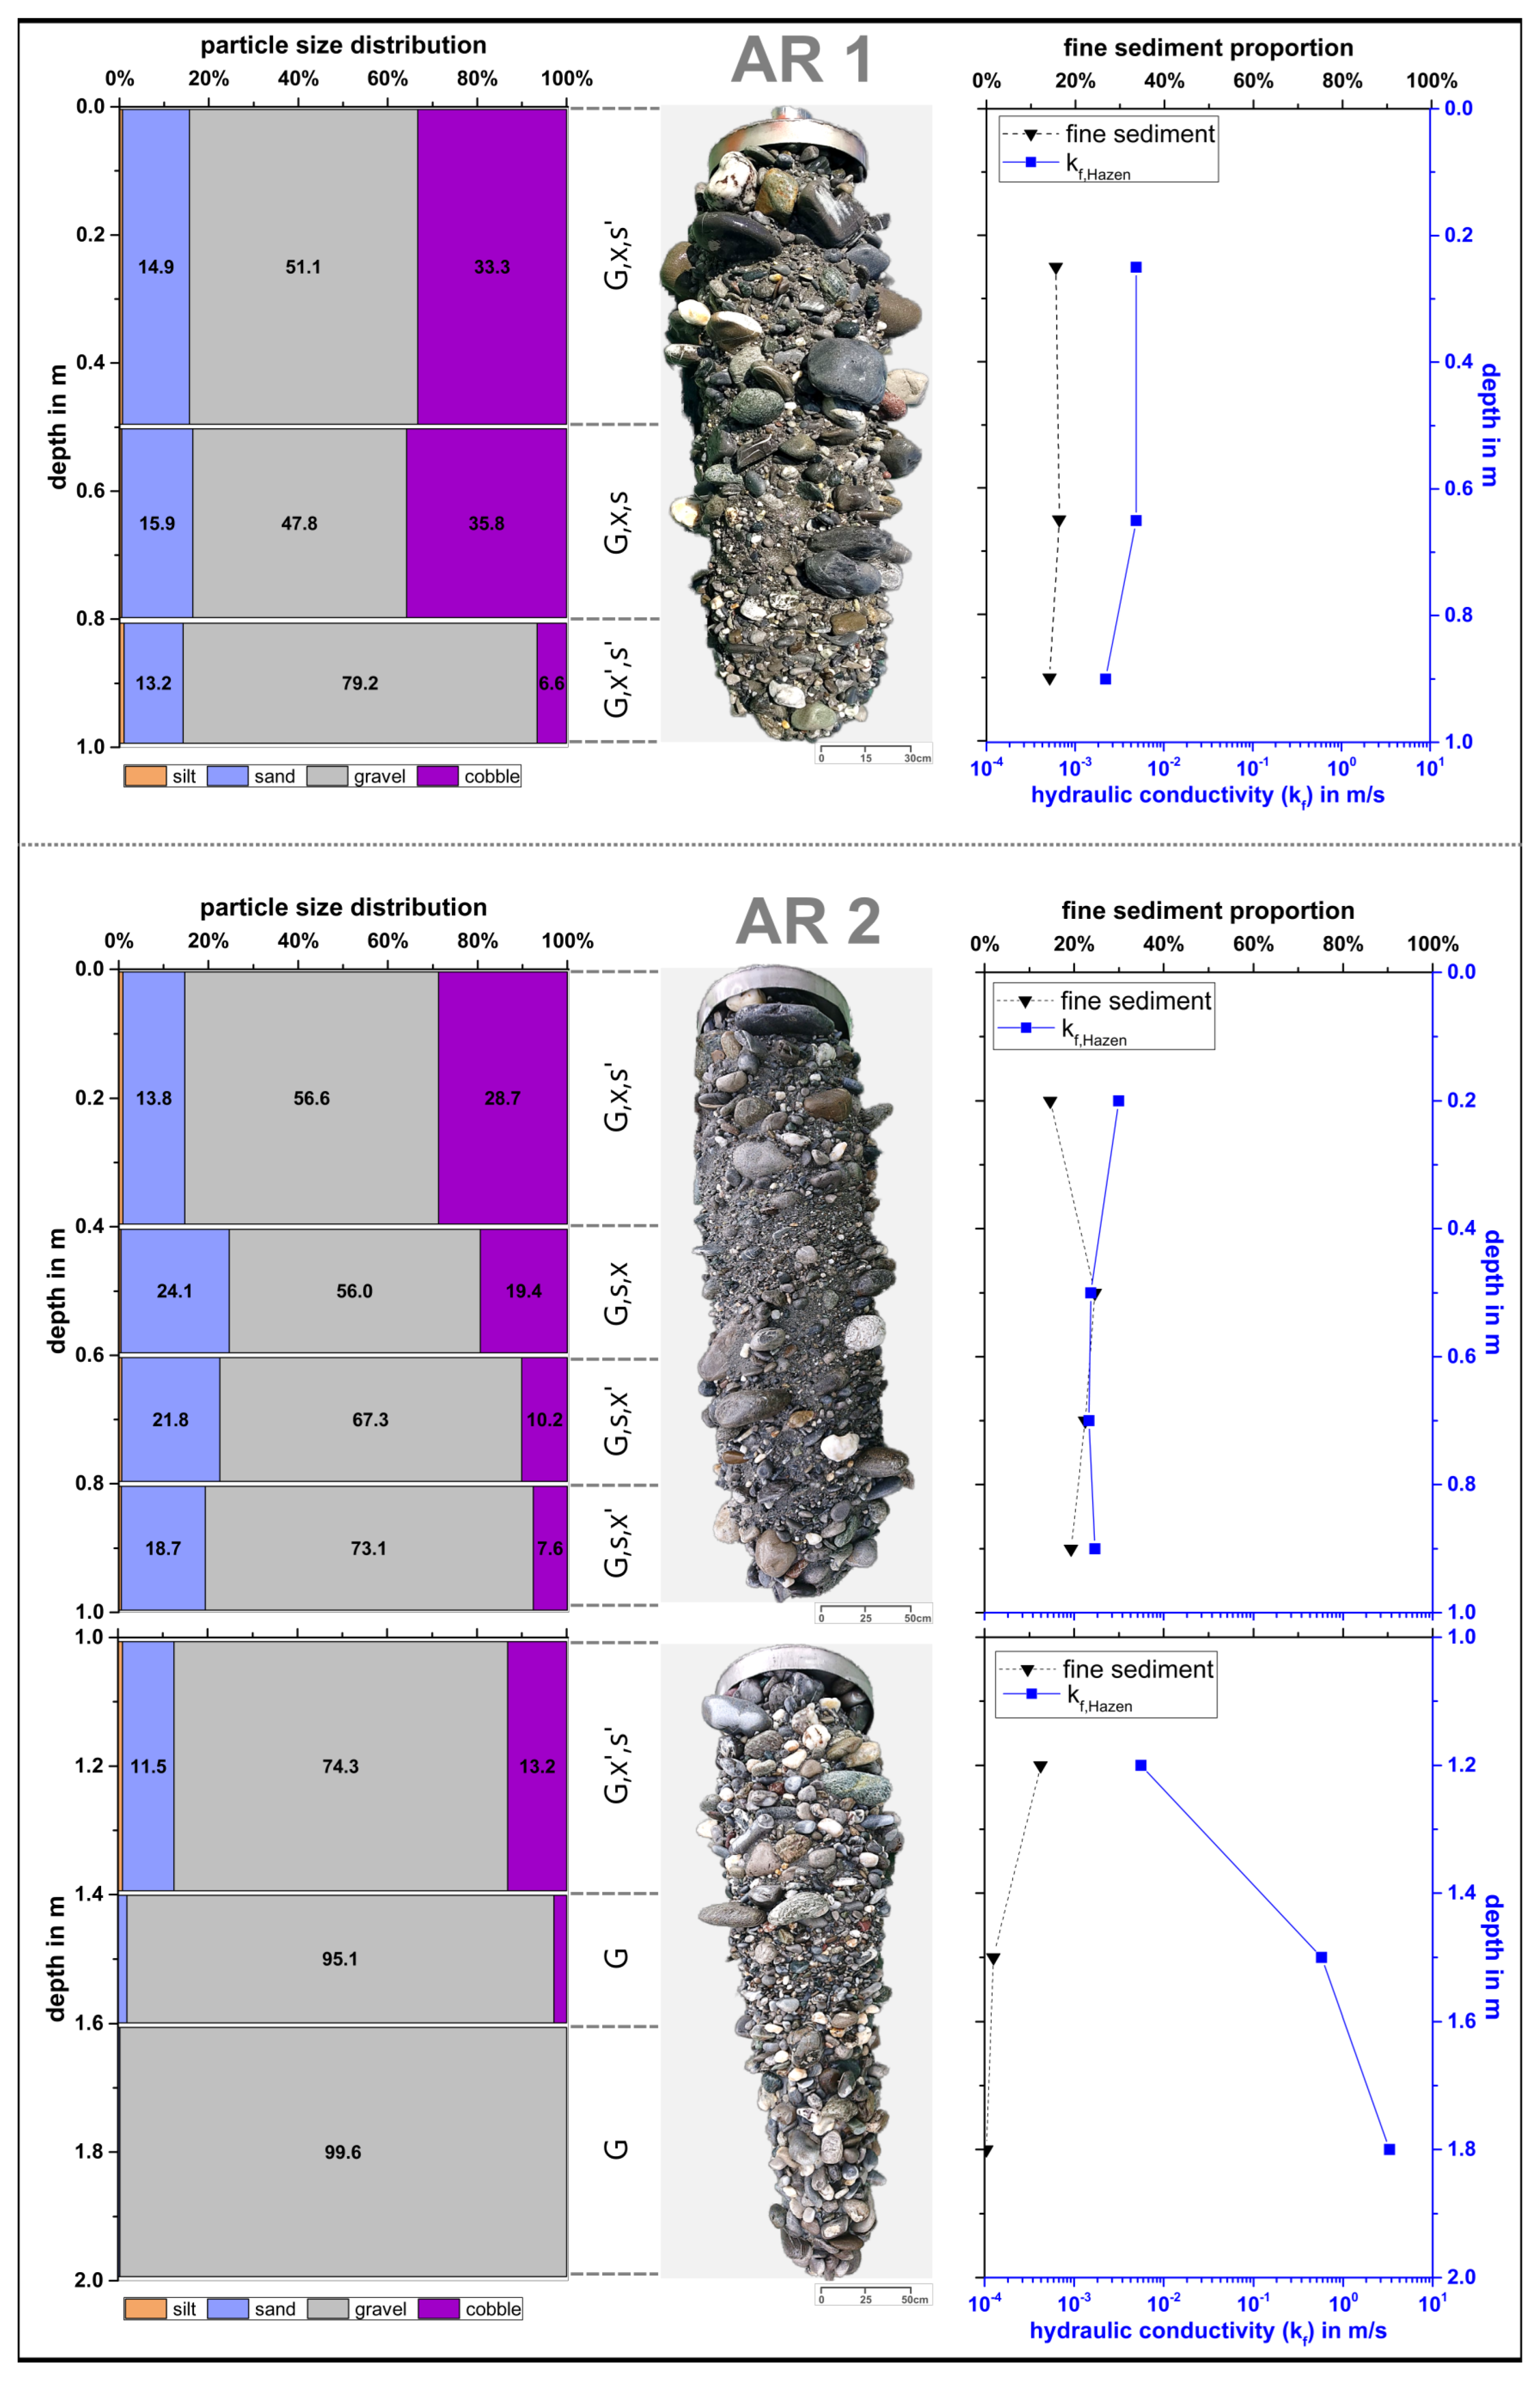
Figure 2. Summary of sediment properties for all freeze cores (AR 1 and AR 2). Sediment grain-size distribution corresponds to cobble “x” (>63 mm), gravel “g” (>2.0–63 mm), sand “s” (>0.063–2.0 mm), and silt “u” (>0.002–0.063 mm) [37]. On the right are the profiles of the proportion of fine sediment (<2 mm) and the hydraulic conductivity (kf).
Microplastics 04 00026 g002
In May 2022, one groundwater sample of 1 m3 was collected from the monitoring well (7–15 m filter section, ~10 m sampling depth, ~20 L/s, max. 0.2 bar), located close to the river (25 m distance), after purging to remove artificial MP accumulations, and one river water sample of 1 m3 was collected from the riverbank near the well (~1 m sampling depth, ~18.5 L/s, max. 3.7 bar) (Figure 1). The water samples were collected using an on-site filtration setup connected to a 2” submersible Grundfos MP1 pump (Eijkelkamp Soil & Water, Giesbeek, The Netherlands) and processed according to Pittroff et al. [40]. However, only one stainless-steel filter cartridge (V4A 2.5 × 10 inch, AFT GmbH, Zirndorf, Germany) with a mesh size of 50 µm was used (instead of three). All components (filter bowl, mesh carrier, and filter sieves) were made of stainless steel with polytetrafluoroethylene (PTFE) seals.
Complete water samples and approximately 150 g of fine sediment from each depth segment were further processed by density separation (sodium iodide (NaI); ρ = 1.8 g/cm3) to isolate even highly dense MPs such as polyvinyl chloride (PVC) from inorganics [41] as described in detail by Pittroff et al. [24] and secondly by the Fenton protocol treatment (30% H2O2 + 20 g/L FeSO4) to remove the organic matrix according to Azzawi et al. [42,43]. After treatment, the samples were transferred to binder-free glass fiber (GF) filters (0.7 µm, Ø 47 mm ROTILABO CR263, Carl Roth, Karlsruhe, Germany), dried at 50 °C for 24 h, and analyzed for MPs by near-infrared (NIR) imaging spectroscopy (50 µm pixel size) according to Pittroff et al. [24] and Munz et al. [23]. It should be noted that the minimum identifiable MP diameter was 100 µm for the sediment samples and slightly larger (112 µm) for the water samples because the pixel binning for the water samples was set to 3 pixels instead of 2 pixels to allow faster processing and accuracy for filters with high particle loading. Particle abundance in the sediment samples was normalized to the total dry weight of the depth-segment sample.

2.3. Contamination Control

To avoid contamination, only cotton lab coats, metal tools, and glassware were used whenever possible, cleaned in an ultrasonic bath, and rinsed with deionized water. All equipment and work surfaces were carefully cleaned with 30% ethanol solution and deionized water stored in perfluoroalkoxy alkane (PFA) bottles. Chemicals, solutions, and liquids were filtered through 0.45 µm cellulose acetate (CA) filters prior to use. Sediment samples were stored in stainless-steel cans, and filters were stored in closed glass Petri dishes prior to analysis. For contamination control, procedural blanks (n = 3) were performed, heated (650 °C, 3 h) and calcined sea sand (100–300 µm; Th. Geyer, Renningen, Germany) was processed and analyzed in the same manner as the samples. No significant abundances of MPs were detected. That is, in one blank, no MPs were detected, and only 1 MP per sample was found in the other two blanks (127 µm polycarbonate (PC) and 1087 µm polypropylene (PP)).

3. Results and Discussion

3.1. Characteristics of the Riverbed Sediments

The sediment characteristics of the extracted freeze cores from the riverbed are summarized in Figure 2. The riverbed sediments of the Alpine Rhine at the study site are formed by Rhine gravel with slightly silty, sandy gravel. From 0 cm to 140 cm, the riverbed is characterized by a well-graded sandy-gravel sediment texture with partly higher proportions of medium sand and cobbles. The proportion of fine sediment (<2 mm) ranged from 12.5% to 24.6% (average 13.4%) with a hydraulic conductivity (kf) ranging from 1.47 × 10⁻³ m/s to 5.55 × 10⁻³ m/s (average 3.65 × 10⁻³ m/s). No organic matter above the limit of detection (LOD) of 0.1% was detected in any of the sediment samples. From 140 cm to 200 cm, the riverbed is characterized by rounded gravel (≥2 mm; 95.1–99.6%) with almost no sand and cobbles. The proportion of fine sediment (<2 mm) was very low at 2.0% (140–160 cm) and 0.4% (160–200 cm), with correspondingly very high hydraulic conductivity (kf) of 0.58 m/s (140–160 cm) and 3.29 m/s (160–200 cm).

3.2. Depth-Specific MP Distribution in Riverbed Sediments

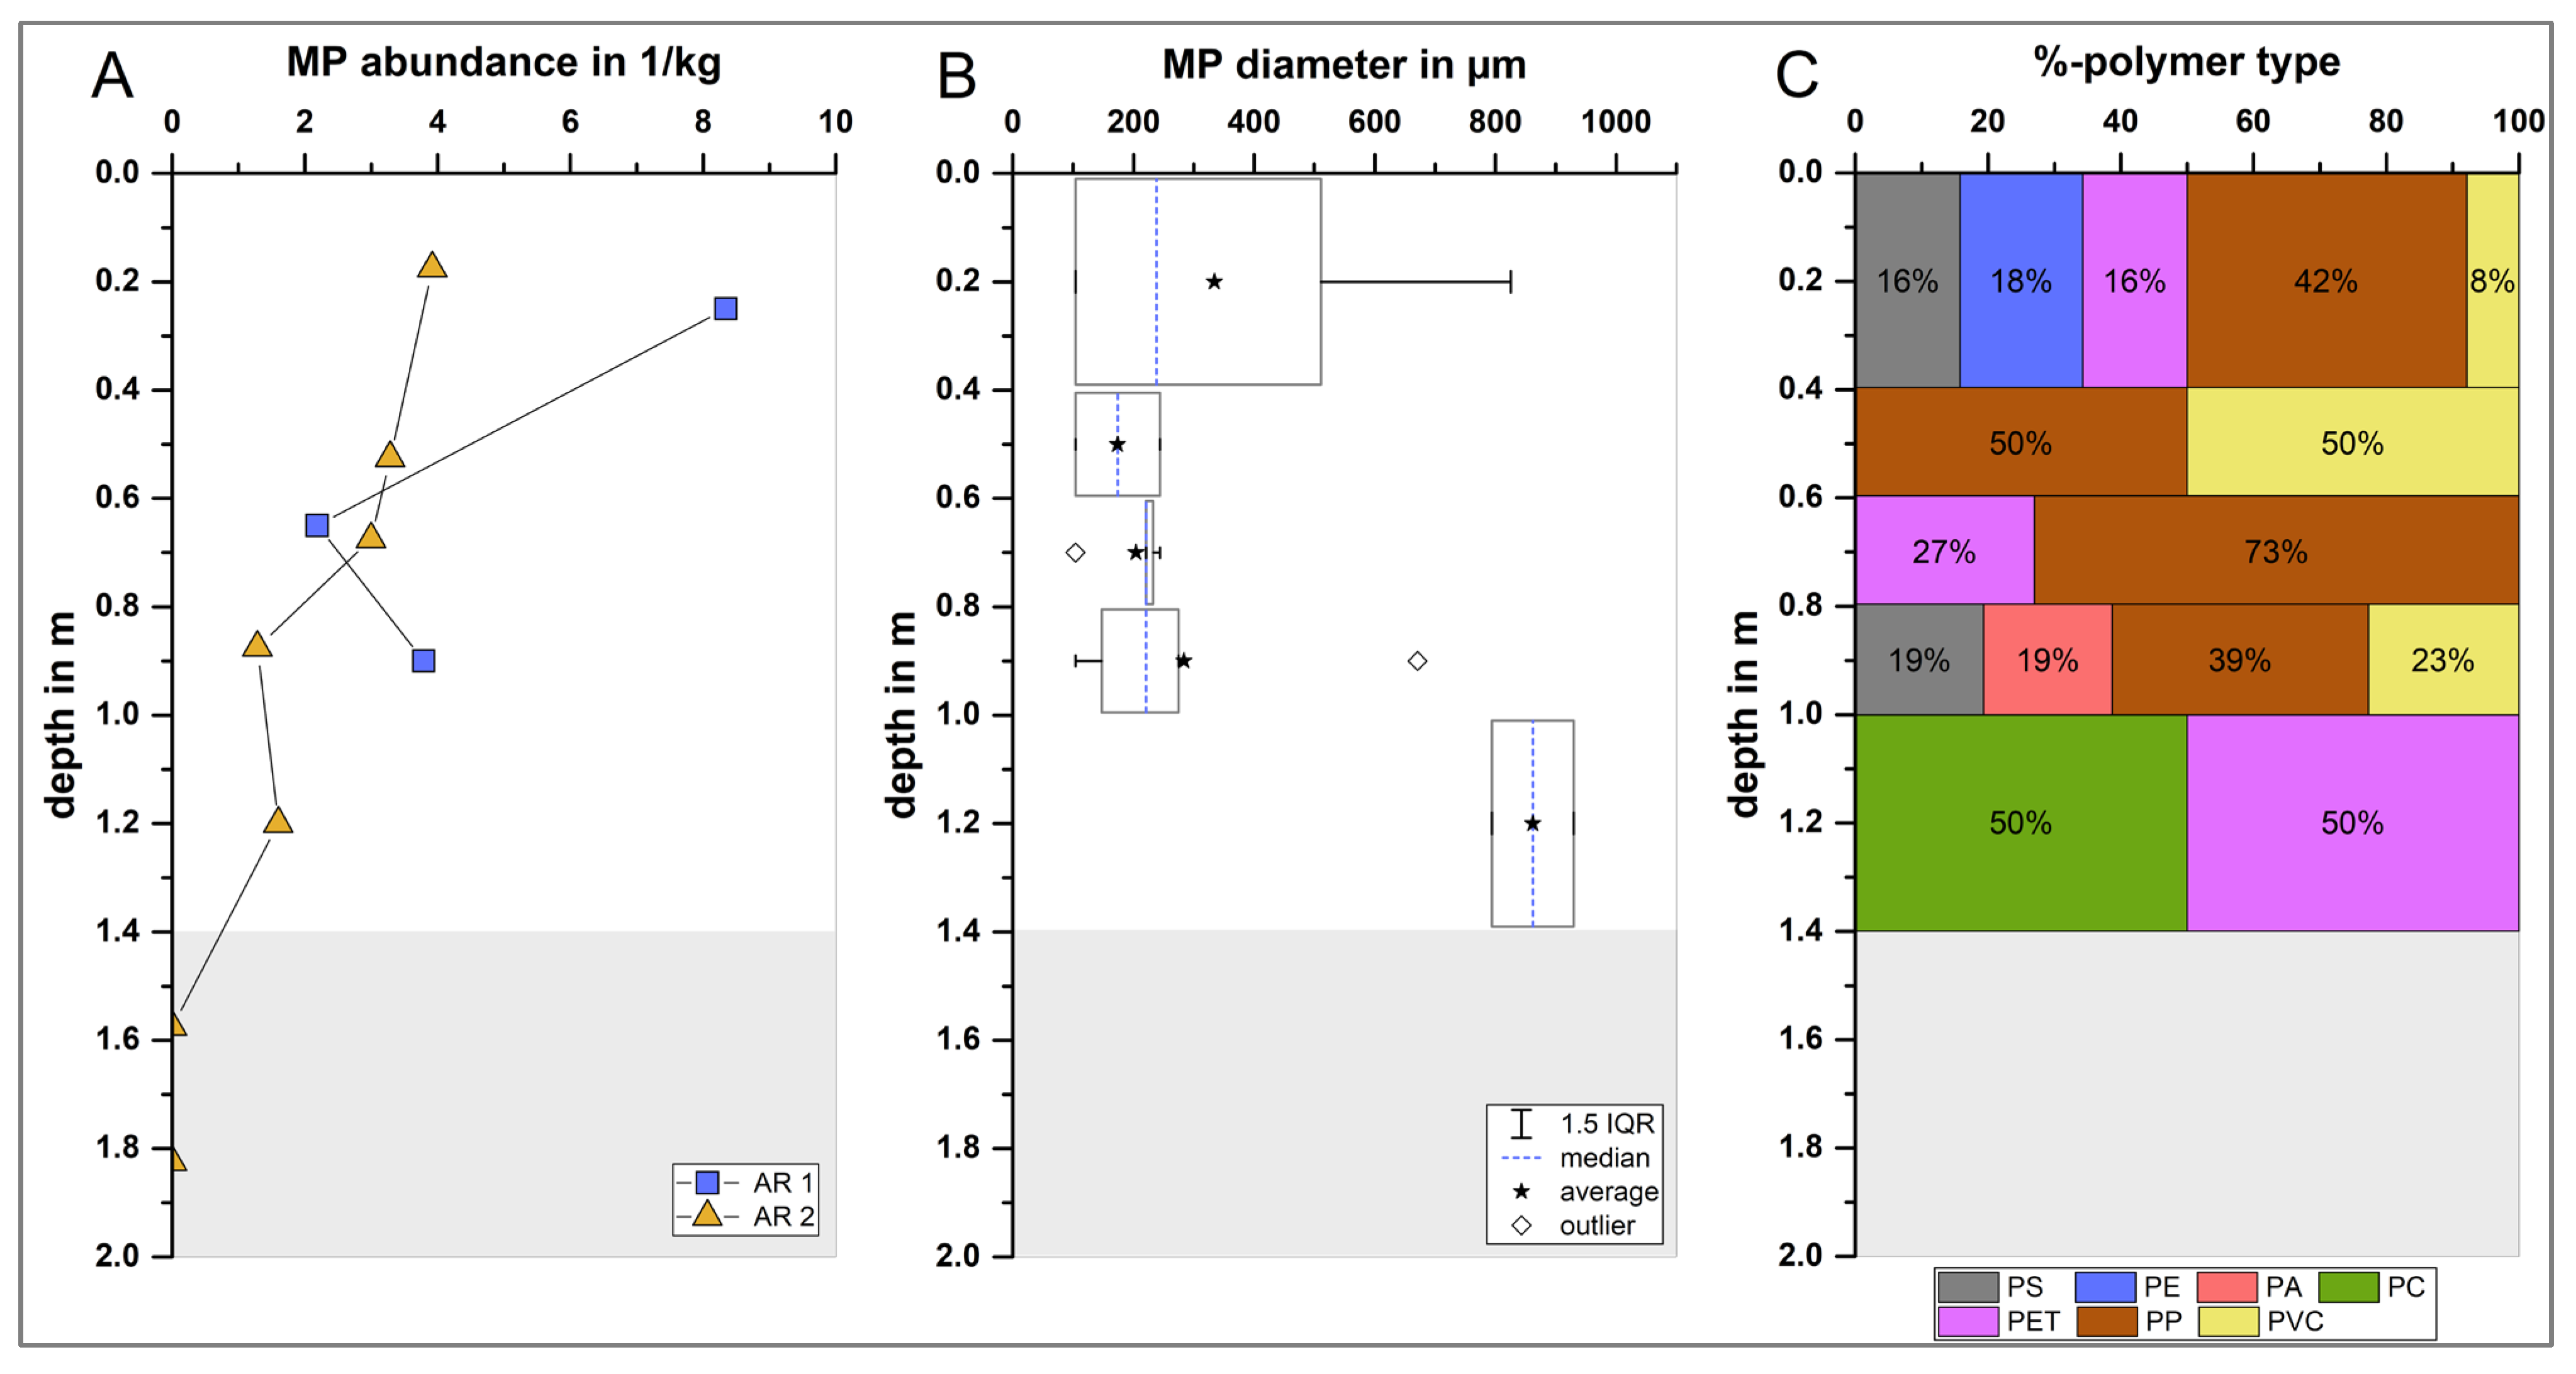
The vertical MP concentration profiles in the riverbed are shown in Figure 3A. MPs were detected in all freeze cores to a maximum depth of 140 cm. The coarse, rounded gravel sediments (≥2 mm) from 140 to 200 cm revealed no presence of MPs. The average MP abundance in the sediment was 3.1 ± 2.3 MP/kg (n = 10) in total; 5.6 ± 2.6 MP/kg (n = 3) in AR 1 (0–100 cm); and 1.8 ± 1.5 MP/kg (n = 7) in AR 2 (0–200 cm). The absolute number of MPs identified in each sediment core was 14 MPs in AR 1 and 11 MPs in AR 2.
In this study, the MP concentrations found in the gravel riverbed (~13.4% fine material) are in the lower range compared to the average MP concentration of ~21.7 MP/kg in the sand-gravelly sediments (~88% fine sediment) of the Main River in Germany [24], using the same sampling (freeze coring) and analysis methods (≥100 µm; NIR). Other previous MP studies in the Main–Rhine region (Germany) have found MP concentrations several orders of magnitude higher. Frei et al. [15] detected >50,000 MP/kg (>20–500 µm; Fourier-transform infrared microspectroscopy (µ-FTIR)) in coarse sand riverbed sediments of a small tributary of the Main River, Mani et al. [44] reported 260–5970 MP/kg (>11–500 µm; µ-FTIR) in sand–gravel riverbed sediments of the Rhine River, and Klein et al. [45] found 228–3763 MP/kg (>63 µm; Attenuated total reflection (ATR)-FTIR) in shoreline sediments of the Main and Rhine rivers. However, a direct comparison with the latter two studies is only possible to a limited extent because they investigated near-surface sediments, used sampling methods that resulted in disturbed sample structure, and employed analytical methods with different sensitivities. Nevertheless, the comparison does indicate that MP concentrations detected in riverbeds with a substantial amount of fine material are considerably higher than in the coarse gravel sediments examined in this study.
In AR 2 (0–200 cm), a decrease in MP concentration from 3.9 MP/kg to 0 MP/kg can be inferred with increasing sediment depth, which is assumed to be due to particle retention processes by filtration [14,24]. The MP concentration of AR 1 (0–100 cm) showed no clear vertical decreasing trend with increasing sediment depth, as the high MP abundance in AR 1 (80–100 cm) clearly deviates (Figure 3A). AR 1 (80–100 cm) shows a much lower cobble fraction (6.6%) than the two sediment layers above (33.3% and 35.8%), possibly causing partial retention of MPs in the finer sediments of AR 1 (80–100 cm). The overall size distribution of MPs in the sediment (AR 1 and AR 2) ranged from 100 µm to 929 µm in diameter (median 233 µm) and showed characteristic depth-specific patterns (Figure 3B). In the top layers (0–40 cm), MPs ranged from 100 µm to 825 µm in diameter (median 238 µm); in the middle layers (40–80 cm), only small MPs ranging from 100 µm to 244 µm in diameter (median 221 µm) were found; and in the deep layers (80–140 cm), the largest MPs of up to 929 µm in diameter (median 275 µm) were detected (Figure 3B). In the porous medium, the structure and size of pores or flow paths are largely determined by the hydrogeological characteristics of the area, such as sediment texture, grain size, or hydraulic conductivity. A ratio of MP size (dMP) to sediment grain size (dsed) of less than 0.11 is required for MPs to infiltrate through the sediment, as demonstrated in laboratory column experiments [13,14]. Using these sediment properties (d50,min = 12.80 mm), MPs < 1408 µm in diameter are able to infiltrate into the deep sediments (>80 cm). Therefore, in the coarse gravel sediments at the study site, advective particle transport through sediment pores by infiltrating river water is a possible mechanism to explain these relatively large-sized MPs in deep layers.
The transport of MPs in fluvial systems is assumed to follow trajectories similar to those of natural particles [46], and the basic principles of fine sediment (<2 mm) dynamics can be applied to MPs [10,13]. To date, only a few studies have examined both depth-specific MP concentration profiles and sediment characteristics, including sediment texture [24,44]. Overall, there was no significant linear relationship between depth-specific MP abundance and the corresponding fine sediment fraction (R2 = 0.02) or estimated kf values (R2 = 0.05) of the riverbed, as might be expected from filtration. Therefore, the fine sediment fraction could not be used as a direct proxy for MP distribution in riverbed sediments. These results are in agreement with Pittroff et al. [24] and Mani et al. [44], who also found no significant linear relationship (R2 = 0.09–0.22) between depth-specific MP concentrations and fine sediment fractions in sand-gravelly riverbed sediments of the Main and Rhine rivers. Because MPs are characterized by a wide range of densities, sizes, and shapes [47], MPs may behave and interact differently than sediment particles, and it is recommended to further investigate which principles from fluvial particle transport or sediment dynamics are really applicable to MPs [24,48].
Seven different polymer types (polystyrene (PS), polyethylene (PE), polypropylene (PP), polycarbonate (PC), polyvinyl chloride (PVC), polyethylene terephthalate (PET), and polyamide (PA)) were detected in the riverbed sediments with a characteristic depth-specific distribution (Figure 3C). Most different polymer types (PS, PE, PP, PVS, and PET) were identified in the top layer (0–40 cm), while PA and PC were found only in the deep sediment layers (>80 µm). Polymer types (PS and PET) with younger earliest possible occurrence (EPO) ages [26,27] of 1956 and 1973 were mainly found in deep sediment layers (100–140 cm), even deeper than polymer types (PVC, PA and PS) with older EPO ages (1912, 1935 and 1931). Furthermore, low-density and buoyant polymer types (PP and PS) were detected in deep layers (>60 cm), contrary to the more intuitive expectation that only MPs with high specific densities have the potential to sink from the water column and infiltrate into the sediment. Conversely, advection and turbulent mixing can be a driving mechanism for buoyant particles to also be transported into the riverbed [49]. Furthermore, He et al. [50] observed a relatively higher mobility for low-density MPs within the riverbed sediments, while high-density MPs tended to be more retained in the sediments. Boos et al. [51] suggested advective transport as a driving mechanism for low-density small-sized MPs exchanged between surface water and riverbed. Additional factors such as biofouling, biofilm formation, weathering, or hetero-aggregation have been previously reported to increase particle density and affect the sedimentation of buoyant MPs [10,11]. Nevertheless, density can influence particle transport and may also be responsible for the variability of MP concentrations in the riverbed. These overall patterns rule out the possibility that the riverbed sediment sequence and embedded MPs were deposited together within the last few decades and represent a clear chronological stratigraphy [26]. Rather, it may be that the riverbed sediments are subject to strong rearrangements (e.g., by high floods) or, more likely, that the low-density MPs and PVC, PA, and PS particles are advectively transported into the deeper riverbed without being retained in the top sediment layers.

3.3. MP Concentration in River Water and Groundwater

In river sections with permanent losing conditions, as prevailing in our study site, a substantial input of MPs from the river water to the riverbed by advection can be assumed, provided that MPs are present in the river water. The MP concentration found in the river water was 92 ± 5 MP/m3, with a particle size range of 112–822 µm (median 165 µm). This is in the same order of magnitude as the average MP concentrations found in other German rivers, e.g., the Elbe with ~608 MP/m3 (0.9–5326 MP/m3) [52,53,54], the Havel with ~650 MP/m3 (50–1850 MP/m3) [23], and the Rhine with ~145 MP/m3 (0.5–225 MP/m3) [55,56,57,58]. This contrasts with highly polluted sites such as the Yangtze River in China, with ~5130 MP/m3 (600–12,100 MP/m3) [59]. However, the MP concentrations found in the river water at the study site already represent a significant input source of MPs to the riverbed, which is comparable to other German rivers.
The groundwater showed a similar MP concentration of 111 ± 6 MP/m3 as the river water and a comparable particle size range of 112–676 µm (median 188 µm). This similarity seems to be consistent with the proximity of the groundwater monitoring well to the river (25 m distance from the river; Figure 1) and the predominance of highly permeable coarse sediment material (Section 3.1). Under these conditions, relatively large MPs remain mobile and are not filtered out by bank filtration. The finding that large MPs were present in the groundwater implies that smaller MPs (≤100 µm) are also likely to be transported through the riverbed under similar hydrodynamic conditions. In contrast, Munz et al. [23] reported lower concentrations of 4 MP/m3 (0–15 MP/m3, ≥100 µm; NIR) in groundwater wells (~15 m distance from the river) at a bank filtration site of the Havel River (Germany) and concluded that about 98.5% of the MPs > 100 μm were filtered out during bank filtration through the medium- to coarse-grained sandy sediment. The obtained groundwater concentrations are also slightly higher than previously reported MP concentrations of 66 ± 76 MP/m3 (≥5 µm; Raman Microspectroscopy (µ-Raman)) [40] and ~0.7 MP/m3 (0–7 MP/m3, ≥20 µm; µ-FTIR) [60] in German porous alluvial aquifers and raw drinking water that were not directly affected by bank filtration. However, a direct comparison is limited because the authors investigated study sites affected by bank filtration with low hydraulic gradients and used analytical techniques with higher sensitivities. In comparison, these concentrations are all in the minimum range compared to MP concentrations of 100–6832 × 103 MP/m3 reported in Asian groundwater from highly polluted sites [61,62].

3.4. Polymer Composition in Sediment, Groundwater, and River Water

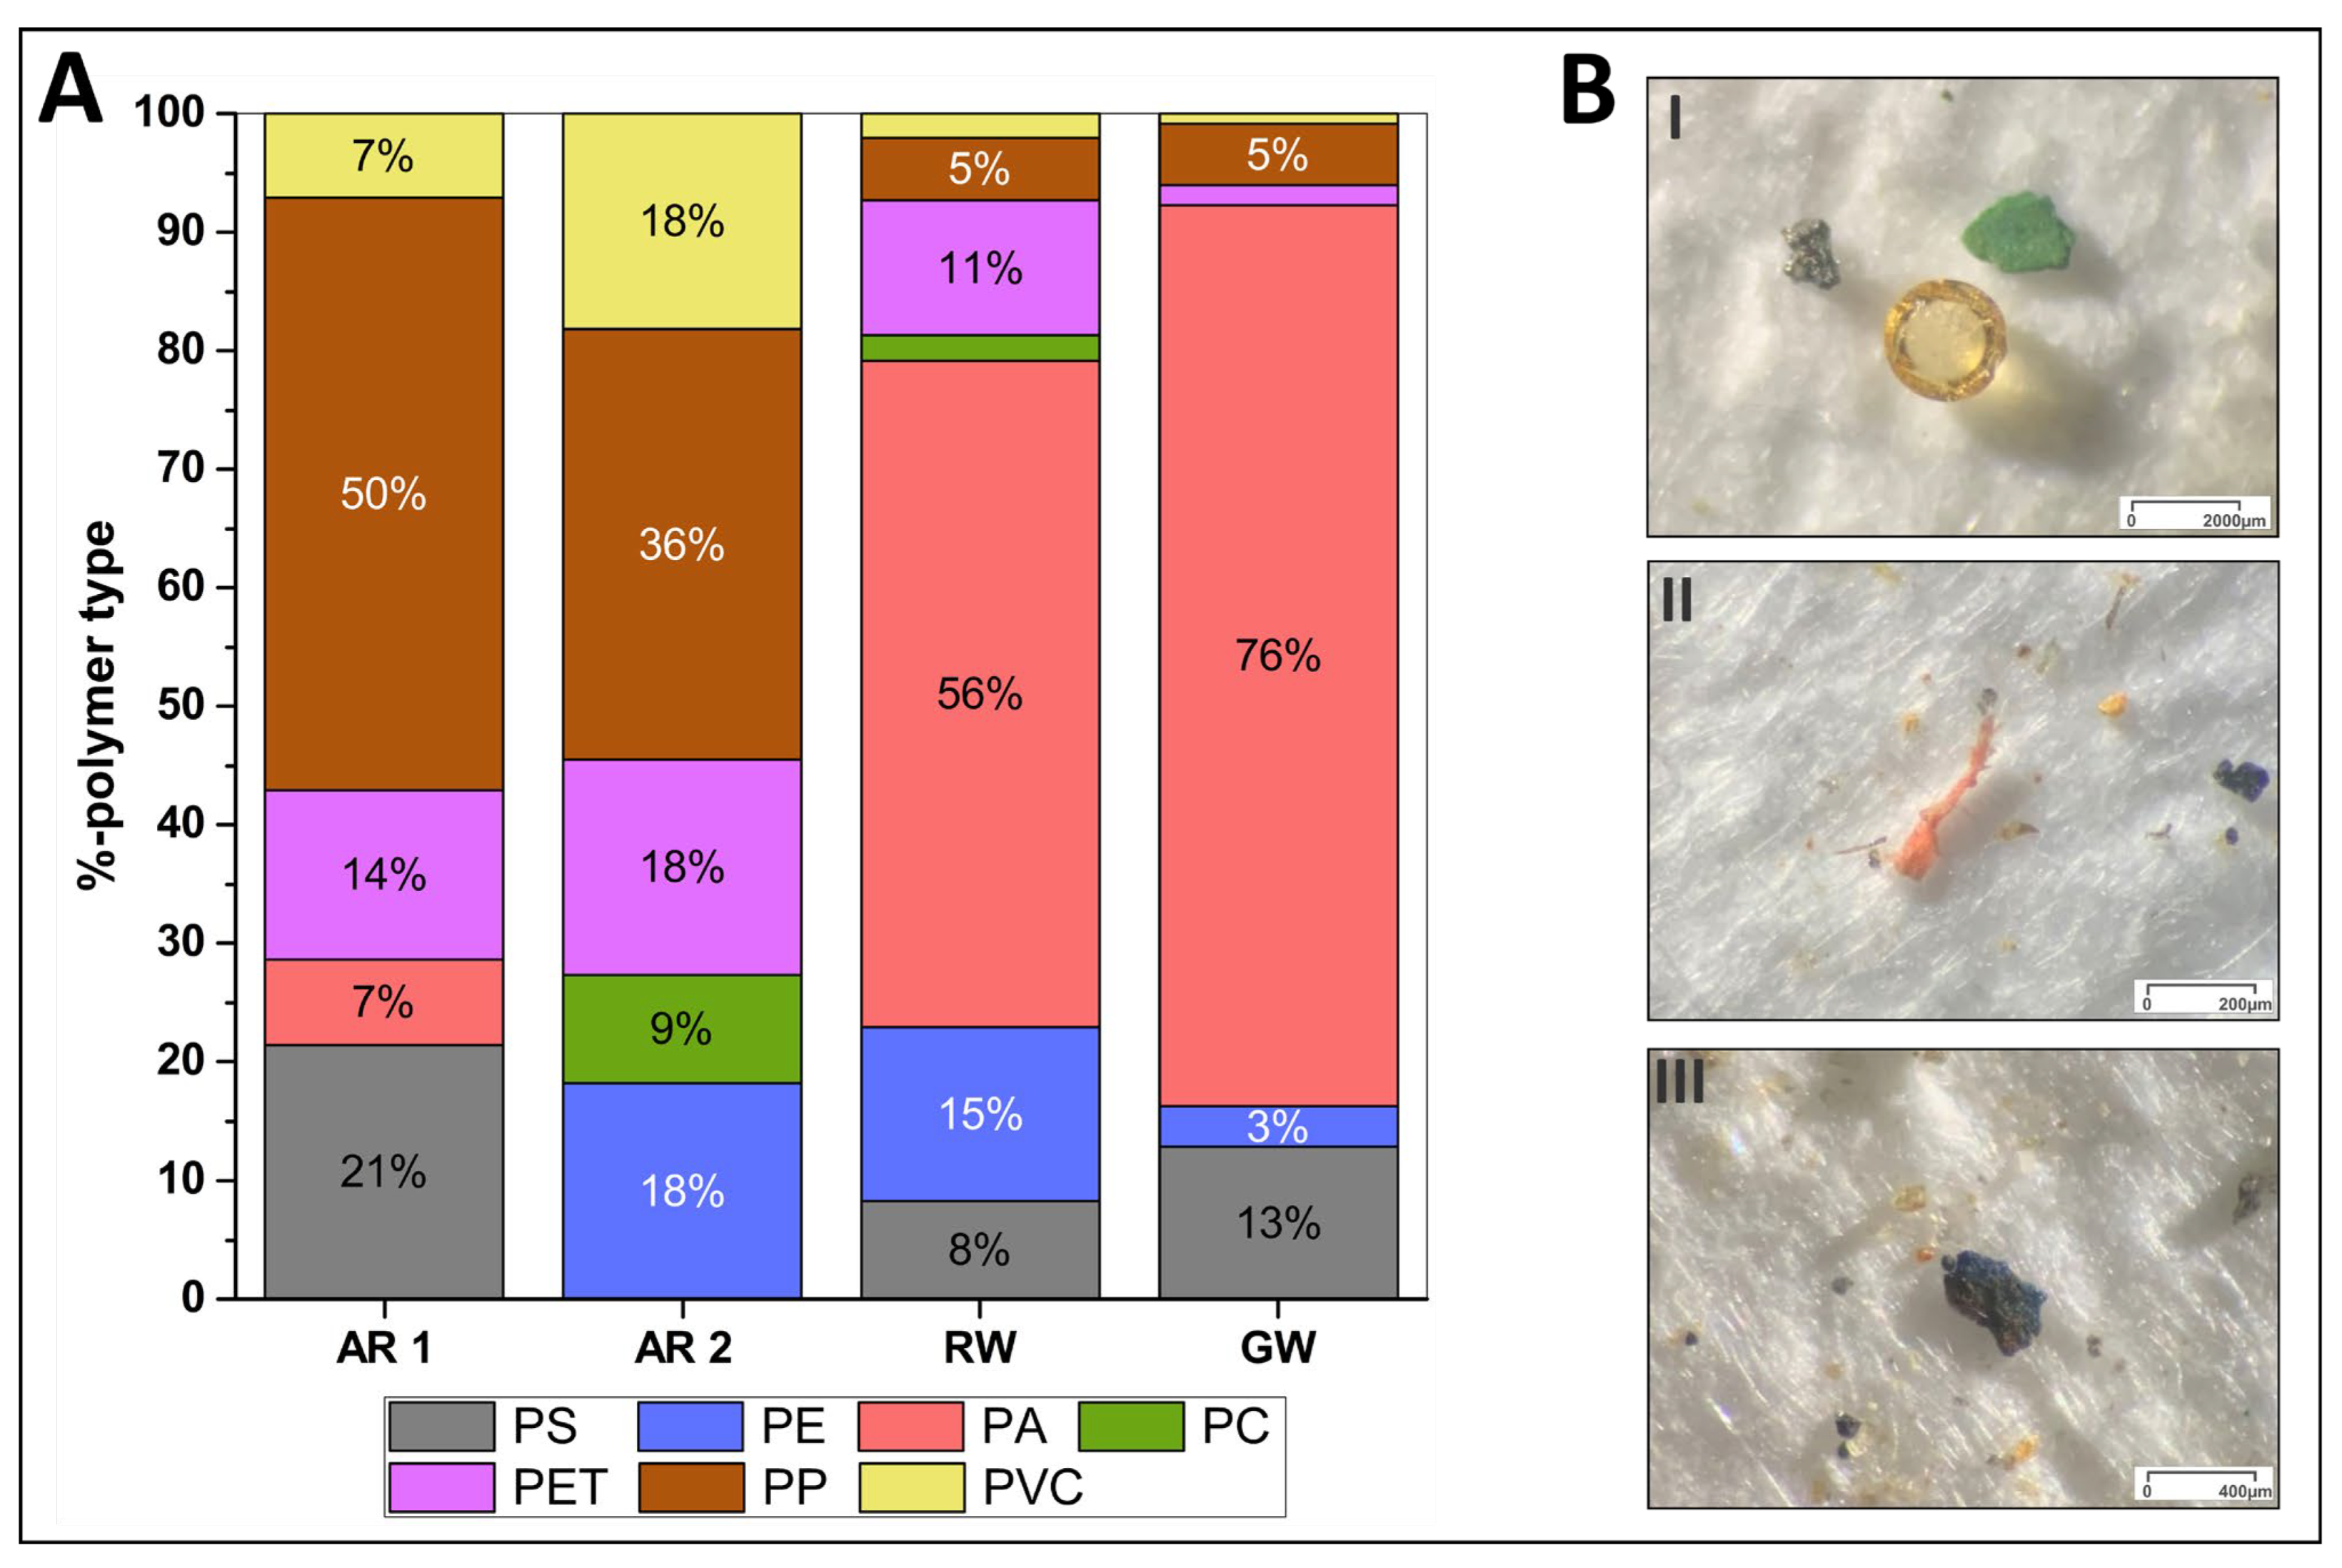
The relative polymer composition for the freeze cores, groundwater, and river water is shown in Figure 4A. A total of seven different polymer types (PS, PE, PP, PC, PVC, PET, and PA) were detected. In the two sediment cores (AR 1 and AR 2), PP was the dominant polymer type and, together with PVC and PET, accounted for >70% of the identified MPs. In AR 1, PA and PS complemented the detected polymer types, but PE and PC were not found. The opposite was observed in AR 2, where PA and PS were not present, but PE and PC were present. There is a notable discrepancy in polymer composition between water and sediment samples, but direct comparison is limited due to the one-year time span between sampling dates. River water and groundwater samples are clearly dominated by PA (56–76%), with lesser proportions of PS, PE, PET, and PVC. A small amount of PC was found only in the river water. The high proportion of PA can be attributed to occasional event-related releases from the effluent of a plastic processing facility located upstream of the study site. The occurrence of MP spheres or microbeads (Figure 4B) in rivers and riverbed sediments attributed to industrial point sources is a well-known phenomenon in MP research [55,63,64]. It can be assumed that industrial effluents were regularly discharged into the river prior to sediment sampling, but precise data on discharge intervals, volumes, or PA concentrations are not available to confirm this source attribution. The reason for the absence of PA in riverbed sediments collected one year prior to river and groundwater sampling remains unclear. The concentration and composition of MPs in surface waters may show seasonal variability due to flow and precipitation events or diffuse and variable point sources, which cannot be captured with the small number of samples in this study. This highlights the need for simultaneous sampling campaigns of long-term time series in all three compartments, including river water, sediment, and groundwater, in future studies to gain a deeper understanding of potential variability and trends. It is also noteworthy that river water, as a potential source of MPs for sediment and groundwater, contains considerably lower proportions of PP and PS (8%) than sediment (54–57%) (Figure 4A). Conversely, the proportions of PS and PE are more balanced between river water (23%) and sediment (18–21%). In addition, the polymer type composition between river water and groundwater is quite similar, which is consistent with river water recharging groundwater at the study site.

4. Conclusions

This study provides insight into the occurrence, fate, and behavior of MPs in deep gravel riverbed sediments down to 200 cm of a channelized mountain river. The depth-specific MP distribution indicates that advective particle transport is a key process in these gravel sediments. Notably, relatively large-sized MPs (here, 929 µm) can be transported into deep riverbed sediments (>80 cm) by infiltrating river water without significant retention. In addition, the comparable MP concentrations, particle size distributions, and polymer type compositions between river water and groundwater indicate that MPs can be transported from river water to groundwater over a horizontal distance of 25 m. The gravel riverbed sediment did not act as a substantial sink for MPs. This highlights the potential risk of MPs leaching into groundwater via bank filtration and further into drinking water supplies. Regulatory requirements and drinking water safety monitoring strategies should take this potential risk into account. Overall, these findings underscore the need for more detailed research with longer time series and higher spatial resolution on the occurrence, fate, and transport of MPs at the river water–sediment–groundwater interface.

Author Contributions

Conceptualization, M.P., H.-J.L., M.M. and B.V.; methodology, M.P., C.L. and M.M.; investigation, M.P., C.L., H.-J.L. and B.V.; formal analysis and data curation, M.P.; writing—original draft preparation, M.P. and M.M.; writing—review and editing, M.P. and M.M.; visualization, M.P.; funding acquisition, M.M. and H.-J.L. All authors have read and agreed to the published version of the manuscript.

Funding

This research received no external funding.

Institutional Review Board Statement

Not applicable.

Informed Consent Statement

Not applicable.

Data Availability Statement

Data are available upon request from the corresponding authors.

Acknowledgments

The authors would like to thank Alexander Dolich and Ralf Anzböck from the Federal Waterways Engineering and Research Institute (BAW) for supporting the freeze core sampling and Mathias Bochow from the Helmholtz Centre Potsdam (GFZ) for supporting the near-infrared (NIR) imaging spectroscopy.

Conflicts of Interest

The authors declare no conflicts of interest.

Abbreviations

The following abbreviations are used in this manuscript:
ATRAttenuated total reflection
CACellulose acetate
FTIRFourier-transform infrared
GFGlass fiber
GWGroundwater
HQHigh-water discharge
LODLimit of detection
MQMean volumetric discharge
MPMicroplastic particle
NIRNear-infrared
NNQLow-water discharge
PAPolyamide
PCPolycarbonate
PEPolyethylene
PETPolyethylene terephthalate
PFAPerfluoroalkoxy alkane
PPPolypropylene
PSPolystyrene
PTFEPolytetrafluoroethylene
PVCPolyvinyl chloride
RWRiver water
µ-FTIRFourier-transform infrared microspectroscopy
µ-RamanRaman microspectroscopy

References

  1. Gao, S.; Orlowski, N.; Bopf, F.K.; Breuer, L. A review on microplastics in major European rivers. WIREs Water 2024, 11, e1713. [Google Scholar] [CrossRef]
  2. Bellasi, A.; Binda, G.; Pozzi, A.; Galafassi, S.; Volta, P.; Bettinetti, R. Microplastic Contamination in Freshwater Environments: A Review, Focusing on Interactions with Sediments and Benthic Organisms. Environments 2020, 7, 30. [Google Scholar] [CrossRef]
  3. Meijer, L.J.J.; van Emmerik, T.; van der Ent, R.; Schmidt, C.; Lebreton, L.C.M. More than 1000 rivers account for 80% of global riverine plastic emissions into the ocean. Sci. Adv. 2021, 7, aaz5803. [Google Scholar] [CrossRef] [PubMed]
  4. Lebreton, L.C.M.; van der Zwet, J.; Damsteeg, J.-W.; Slat, B.; Andrady, A.L.; Reisser, J. River plastic emissions to the world’s oceans. Nat. Commun. 2017, 8, 15611. [Google Scholar] [CrossRef]
  5. Schreyers, L.J.; van Emmerik, T.; Huthoff, F.; Collas, F.P.; Wegman, C.; Vriend, P.; Boon, A.; de Winter, W.; Oswald, S.B.; Schoor, M.M.; et al. River plastic transport and storage budget. Water Res. 2024, 259, 121786. [Google Scholar] [CrossRef]
  6. van Emmerik, T.; Mellink, Y.; Hauk, R.; Waldschläger, K.; Schreyers, L.J. Rivers as Plastic Reservoirs. Front. Water 2022, 3, 786936. [Google Scholar] [CrossRef]
  7. Sangkham, S.; Aminul Islam, M.; Adhikari, S.; Kumar, R.; Sharma, P.; Sakunkoo, P.; Bhattacharya, P.; Tiwari, A. Evidence of microplastics in groundwater: A growing risk for human health. Groundw. Sustain. Dev. 2023, 23, 100981. [Google Scholar] [CrossRef]
  8. Woessner, W.W. Groundwater-Surface Water Exchange; The Groundwater Project: Waterloo, ON, USA, 2020; ISBN 978-1-7770541-5-1. [Google Scholar]
  9. Irvine, D.J.; Singha, K.; Kurylyk, B.L.; Briggs, M.A.; Sebastian, Y.; Tait, D.R.; Helton, A.M. Groundwater-Surface water interactions research: Past trends and future directions. J. Hydrol. 2024, 644, 132061. [Google Scholar] [CrossRef]
  10. Kooi, M.; Besseling, E.; Kroeze, C.; van Wezel, A.P.; Koelmans, A.A. Modeling the Fate and Transport of Plastic Debris in Freshwaters: Review and Guidance. In Freshwater Microplastics: The Handbook of Environmental Chemistry, 58th ed.; Wagner, M., Lambert, S., Eds.; Springer: Cham, Switzerland, 2018; pp. 125–152. ISBN 978-3-319-61615-5. [Google Scholar]
  11. Kaiser, D.; Kowalski, N.; Waniek, J.J. Effects of biofouling on the sinking behavior of microplastics. Environ. Res. Lett. 2017, 12, 124003. [Google Scholar] [CrossRef]
  12. Niu, L.; Li, Y.; Li, Y.; Hu, Q.; Wang, C.; Hu, J.; Zhang, W.; Wang, L.; Zhang, C.; Zhang, H. New insights into the vertical distribution and microbial degradation of microplastics in urban river sediments. Water Res. 2021, 188, 116449. [Google Scholar] [CrossRef]
  13. Waldschläger, K.; Schüttrumpf, H. Infiltration Behavior of Microplastic Particles with Different Densities, Sizes, and Shapes–From Glass Spheres to Natural Sediments. Environ. Sci. Technol. 2020, 54, 9366–9373. [Google Scholar] [CrossRef] [PubMed]
  14. Munz, M.; Loui, C.; Postler, D.; Pittroff, M.; Oswald, S.E. Transport and retention of micro-polystyrene in coarse riverbed sediments: Effects of flow velocity, particle and sediment sizes. Microplast. Nanoplast. 2024, 4, 2. [Google Scholar] [CrossRef]
  15. Frei, S.; Piehl, S.; Gilfedder, B.S.; Löder, M.G.J.; Krutzke, J.; Wilhelm, L.; Laforsch, C. Occurence of microplastics in the hyporheic zone of rivers. Sci. Rep. 2019, 9, 15256. [Google Scholar] [CrossRef] [PubMed]
  16. Wanner, P. Plastic in agricultural soils—A global risk for groundwater systems and drinking water supplies?—A review. Chemosphere 2021, 264, 128453. [Google Scholar] [CrossRef]
  17. Boos, J.-P.; Gilfedder, B.S.; Frei, S. Tracking Microplastics Across the Streambed Interface: Using Laser-Induced-Fluorescence to Quantitatively Analyze Microplastic Transport in an Experimental Flume. Water Res. 2021, 57, e2021WR031064. [Google Scholar] [CrossRef]
  18. Panno, S.V.; Kelly, W.R.; Scott, J.; Zheng, W.; McNeish, R.E.; Holm, N.; Hoellein, T.J.; Baranski, E.L. Microplastic Contamination in Karst Groundwater Systems. Groundwater 2019, 57, 189–196. [Google Scholar] [CrossRef]
  19. Murphy, H.M.; Prioleau, M.D.; Borchardt, M.A.; Hynds, P.D. Review: Epidemiological evidence of groundwater contribution to global enteric disease, 1948–2015. Hydrogeol. J. 2017, 25, 981–1001. [Google Scholar] [CrossRef]
  20. Divine, C.; Killingstad, M.; Mortensen, L.; Beciragic, A.; Dettmer, A.; Alspach, B. The Plastiverse Extends to Hydrogeologic Systems: Microplastics Are an Important Emerging Groundwater Contaminant Class. Groundw. Monit. R. 2024, 44, 15–38. [Google Scholar] [CrossRef]
  21. Johnson, A.C.; Ball, H.; Cross, R.; Horton, A.A.; Jürgens, M.D.; Read, D.S.; Vollertsen, J.; Svendsen, C. Identification and Quantification of Microplastics in Potable Water and Their Sources within Water Treatment Works in England and Wales. Environ. Sci. Technol. 2020, 54, 12326–12334. [Google Scholar] [CrossRef]
  22. Severini, E.; Ducci, L.; Sutti, A.; Robottom, S.; Sutti, S.; Celico, F. River–Groundwater Interaction and Recharge Effects on Microplastics Contamination of Groundwater in Confined Alluvial Aquifers. Water 2022, 14, 1913. [Google Scholar] [CrossRef]
  23. Munz, M.; Kreiß, J.; Krüger, L.; Schmidt, L.K.; Bochow, M.; Bednarz, M.; Bannick, C.G.; Oswald, S.E. Application of High-Resolution Near-Infrared Imaging Spectroscopy to Detect Microplastic Particles in Different Environmental Compartments. Water Air Soil Pollut. 2023, 234, 286. [Google Scholar] [CrossRef]
  24. Pittroff, M.; Loui, C.; Oswald, S.E.; Bochow, M.; Kamp, J.; Dierkes, G.; Lensing, H.-J.; Munz, M. Riverbed depth-specific microplastics distribution and potential use as process marker. Environ. Sci. Pollut. Res. 2024, 31, 45326–45340. [Google Scholar] [CrossRef] [PubMed]
  25. Yuan, B.; Gan, W.; Sun, J.; Lin, B.; Chen, Z. Depth profiles of microplastics in sediments from inland water to coast and their influential factors. Sci. Total Environ. 2023, 903, 166151. [Google Scholar] [CrossRef]
  26. Weber, C.J.; Lechthaler, S. Plastics as a stratigraphic marker in fluvial deposits. Anthropocene 2021, 36, 100314. [Google Scholar] [CrossRef]
  27. Weber, C.J.; Opp, C.; Prume, J.A.; Koch, M.; Andersen, T.J.; Chifflard, P. Deposition and in-situ translocation of microplastics in floodplain soils. Sci. Total Environ. 2022, 819, 152039. [Google Scholar] [CrossRef]
  28. Fan, Y.; Zheng, K.; Zhu, Z.; Chen, G.; Peng, X. Distribution, sedimentary record, and persistence of microplastics in the Pearl River catchment, China. Environ. Pollut. 2019, 251, 862–870. [Google Scholar] [CrossRef]
  29. Zhou, Z.; Zhang, P.; Zhang, G.; Wang, S.; Cai, Y.; Wang, H. Vertical microplastic distribution in sediments of Fuhe River estuary to Baiyangdian Wetland in Northern China. Chemosphere 2021, 280, 130800. [Google Scholar] [CrossRef] [PubMed]
  30. Bao, K.; Jiang, H.; Su, P.; Lu, P.; Yan, Z. Vertical Profiles of Microplastics in the Hyporheic Zone Sediment: A Case Study in the Yangtze River, Nanjing Section. Sustainability 2023, 15, 7895. [Google Scholar] [CrossRef]
  31. Lai, Y.; Dong, L.; Li, Q.; Li, P.; Liu, J. Sampling of micro- and nano-plastics in environmental matrixes. TrAC Trends Anal. Chem. 2021, 145, 116461. [Google Scholar] [CrossRef]
  32. Wazne, M.; Schneidewind, U.; Haverson, L.; Mermillod-Blondin, F.; Simon, L.; Nel, H.A.; Krause, S. Does what we find depend on how we sample? Measured streambed microplastic concentrations can be affected by the choice of sampling method. Sci. Total Environ. 2025, 958, 178096. [Google Scholar] [CrossRef]
  33. Strasser, D.; Lensing, H.-J.; Nuber, T.; Richter, D.; Frank, S.; Goeppert, N.; Goldscheider, N. Improved geohydraulic characterization of river bed sediments based on freeze-core sampling—Development and evaluation of a new measurement approach. J. Hydrol. 2015, 527, 133–141. [Google Scholar] [CrossRef]
  34. Stocker, Z.S.; Williams, D.D. Freezing core method for describing the vertical distribution of sediments in a streambed. Limnol. Oceanogr. 1972, 17, 136–138. [Google Scholar] [CrossRef]
  35. IRR. Technischer Bericht Dekolmationsversuch: Hochwasserschutz Alpenrhein Internationale Strecke km 65–km 91 Genehmigungsprojekt; Teil C: Sonstige Unterlagen; Internationale Rheinregulierung (IRR): St. Margrethen, Switzerland, 2023. [Google Scholar]
  36. ISO 17892-4:2016; Geotechnical Investigation and Testing—Laboratory Testing of Soil—Part 4: Determination of Particle Size Distribution. Beuth Verlag GmbH: Berlin, Germany, 2016; ICS: 93.020 13.080.20 (ISO/TC 182). [CrossRef]
  37. ISO 14688-1:2017; Geotechnical Investigation and Testing—Identification and Classification of Soil—Part 1: Identification and Description. Beuth Verlag GmbH: Berlin, Germany, 2017; ICS: 93.020 (ISO/TC 182). [CrossRef]
  38. DIN 18128:2002-12; Soil—Investigation and Testing—Determination of Ignition Loss. Beuth Verlag GmbH: Berlin, Germany, 2002. [CrossRef]
  39. Hazen, A. Some physical properties of sands and gravels with special reference to their use in filtration. In 24th Annual Report Massachusetts State Board of Health; 1892; pp. 539–556. [CrossRef]
  40. Pittroff, M.; Müller, Y.K.; Witzig, C.S.; Scheurer, M.; Storck, F.R.; Zumbülte, N. Microplastic analysis in drinking water based on fractionated filtration sampling and Raman microspectroscopy. Environ. Sci. Pollut. Res. 2021, 28, 59439–59451. [Google Scholar] [CrossRef] [PubMed]
  41. Quinn, B.; Murphy, F.; Ewins, C. Validation of density separation for the rapid recovery of microplastics from sediment. Anal. Methods 2017, 9, 1491–1498. [Google Scholar] [CrossRef]
  42. Al-Azzawi, M.S.M.; Kefer, S.; Weißer, J.; Reichel, J.; Schwaller, C.; Glas, K.; Knoop, O.; Drewes, J.E. Validation of Sample Preparation Methods for Microplastic Analysis in Wastewater Matrices—Reproducibility and Standardization. Water 2020, 12, 2445. [Google Scholar] [CrossRef]
  43. Al-Azzawi, M.S.; Knoop, O.; Drewes, J.E. Validation of sample preparation methods for small microplastics (≤10 µm) in wastewater effluents. Chem. Eng. J. 2022, 446, 137082. [Google Scholar] [CrossRef]
  44. Mani, T.; Primpke, S.; Lorenz, C.; Gerdts, G.; Burkhardt-Holm, P. Microplastic Pollution in Benthic Midstream Sediments of the Rhine River. Environ. Sci. Technol. 2019, 53, 6053–6062. [Google Scholar] [CrossRef]
  45. Klein, S.; Worch, E.; Knepper, T.P. Occurrence and Spatial Distribution of Microplastics in River Shore Sediments of the Rhine-Main Area in Germany. Environ. Sci. Technol. 2015, 49, 6070–6076. [Google Scholar] [CrossRef]
  46. Hoellein, T.J.; Shogren, A.J.; Tank, J.L.; Risteca, P.; Kelly, J.J. Microplastic deposition velocity in streams follows patterns for naturally occurring allochthonous particles. Sci. Rep. 2019, 9, 3740. [Google Scholar] [CrossRef]
  47. Rochman, C.M.; Brookson, C.; Bikker, J.; Djuric, N.; Earn, A.; Bucci, K.; Athey, S.; Huntington, A.; McIlwraith, H.; Munno, K.; et al. Rethinking microplastics as a diverse contaminant suite. Environ. Toxicol. Chem. 2019, 38, 703–711. [Google Scholar] [CrossRef]
  48. Waldschläger, K.; Brückner, M.Z.; Carney Almroth, B.; Hackney, C.R.; Adyel, T.M.; Alimi, O.S.; Belontz, S.L.; Cowger, W.; Doyle, D.; Gray, A.; et al. Learning from natural sediments to tackle microplastics challenges: A multidisciplinary perspective. Earth Sci. Rev. 2022, 228, 104021. [Google Scholar] [CrossRef]
  49. Molazadeh, M.; Liu, F.; Simon-Sánchez, L.; Vollersten, J. Buoyant microplastics in freshwater sediments—How do they get there? Sci. Total Environ. 2023, 860, 160489. [Google Scholar] [CrossRef]
  50. He, B.; Smith, M.; Egodawatta, P.; Ayoko, G.A.; Rintoul, L.; Goonetilleke, A. Dispersal and transport of microplastics in river sediments. Environ. Pollut. 2021, 279, 116884. [Google Scholar] [CrossRef] [PubMed]
  51. Boos, J.-P.; Dichgans, F.; Fleckenstein, J.H.; Gilfedder, B.S.; Frei, S. Assessing the Behavior of Microplastics in Fluvial Systems: Infiltration and Retention Dynamics in Streambed Sediments. Water Res. 2024, 60, e2023WR035532. [Google Scholar] [CrossRef]
  52. Scherer, C.; Weber, A.; Stock, F.; Vurusic, S.; Egerci, H.; Kochleus, C.; Arendt, N.; Földi, C.; Dierkes, G.; Wagner, M.; et al. Comparative assessment of microplastics in water and sediment of a large European river. Sci. Total Environ. 2020, 738, 139866. [Google Scholar] [CrossRef] [PubMed]
  53. Piehl, S.; Atwood, E.C.; Bochow, M.; Imhof, H.K.; Franke, J.; Siegert, F.; Laforsch, C. Can Water Constituents Be Used as Proxy to Map Microplastic Dispersal Within Transitional and Coastal Waters? Front. Environ. Sci. 2020, 8, 92. [Google Scholar] [CrossRef]
  54. Hildebrandt, L.; Zimmermann, T.; Primpke, S.; Fischer, D.; Gerdts, G.; Pröfrock, D. Comparison and uncertainty evaluation of two centrifugal separators for microplastic sampling. J. Hazard. Mater. 2021, 414, 125482. [Google Scholar] [CrossRef] [PubMed]
  55. Mani, T.; Blarer, P.; Storck, F.R.; Pittroff, M.; Wernicke, T.; Burkhardt-Holm, P. Repeated detection of polystyrene microbeads in the Lower Rhine River. Environ. Pollut. 2019, 245, 634–641. [Google Scholar] [CrossRef]
  56. Mani, T.; Burkhardt-Holm, P. Seasonal microplastics variation in nival and pluvial stretches of the Rhine River—From the Swiss catchment towards the North Sea. Sci. Total Environ. 2020, 707, 135579. [Google Scholar] [CrossRef]
  57. Mani, T.; Hauk, A.; Walter, U.; Burkhardt-Holm, P. Microplastics profile along the Rhine River. Sci. Rep. 2015, 5, 17988. [Google Scholar] [CrossRef]
  58. Schrank, I.; Löder, M.G.J.; Imhof, H.K.; Moses, S.R.; Heß, M.; Schwaiger, J.; Laforsch, C. Riverine microplastic contamination in southwest Germany: A large-scale survey. Front. Earth Sci. 2022, 10, 794250. [Google Scholar] [CrossRef]
  59. Xia, W.; Rao, Q.; Liu, J.; Chen, J.; Xie, P. Occurrence and characteristics of microplastics across the watershed of the world’s third-largest river. J. Hazard. Mater. 2024, 480, 135998. [Google Scholar] [CrossRef] [PubMed]
  60. Mintenig, S.M.; Löder, M.G.J.; Primpke, S.; Gerdts, G. Low numbers of microplastics detected in drinking water from ground water sources. Sci. Total Environ. 2019, 648, 631–635. [Google Scholar] [CrossRef] [PubMed]
  61. Xu, J.; Zuo, R.; Wu, G.; Liu, J.; Liu, J.; Huang, C.; Wang, Z. Global distribution, drivers, and potential hazards of microplastics in groundwater: A review. Sci. Total Environ. 2024, 954, 176194. [Google Scholar] [CrossRef]
  62. Lee, J.-Y.; Cha, J.; Ha, K.; Viaroli, S. Microplastic pollution in groundwater: A systematic review. Environ. Pollut. Bioavailab. 2024, 36, 2299545. [Google Scholar] [CrossRef]
  63. Laermanns, H.; Reifferscheid, G.; Kruse, J.; Földi, C.; Dierkes, G.; Schaefer, D.; Scherer, C.; Bogner, C.; Stock, F. Microplastic in Water and Sediments at the Confluence of the Elbe and Mulde Rivers in Germany. Front. Environ. Sci. 2021, 9, 794895. [Google Scholar] [CrossRef]
  64. Lechner, A.; Keckeis, H.; Lumesberger-Loisl, F.; Zens, B.; Krusch, R.; Tritthart, M.; Glas, M.; Schludermann, E. The Danube so colourful: A potpourri of plastic litter outnumbers fish larvae in Europe’s second largest river. Environ. Pollut. 2014, 188, 177–181. [Google Scholar] [CrossRef]
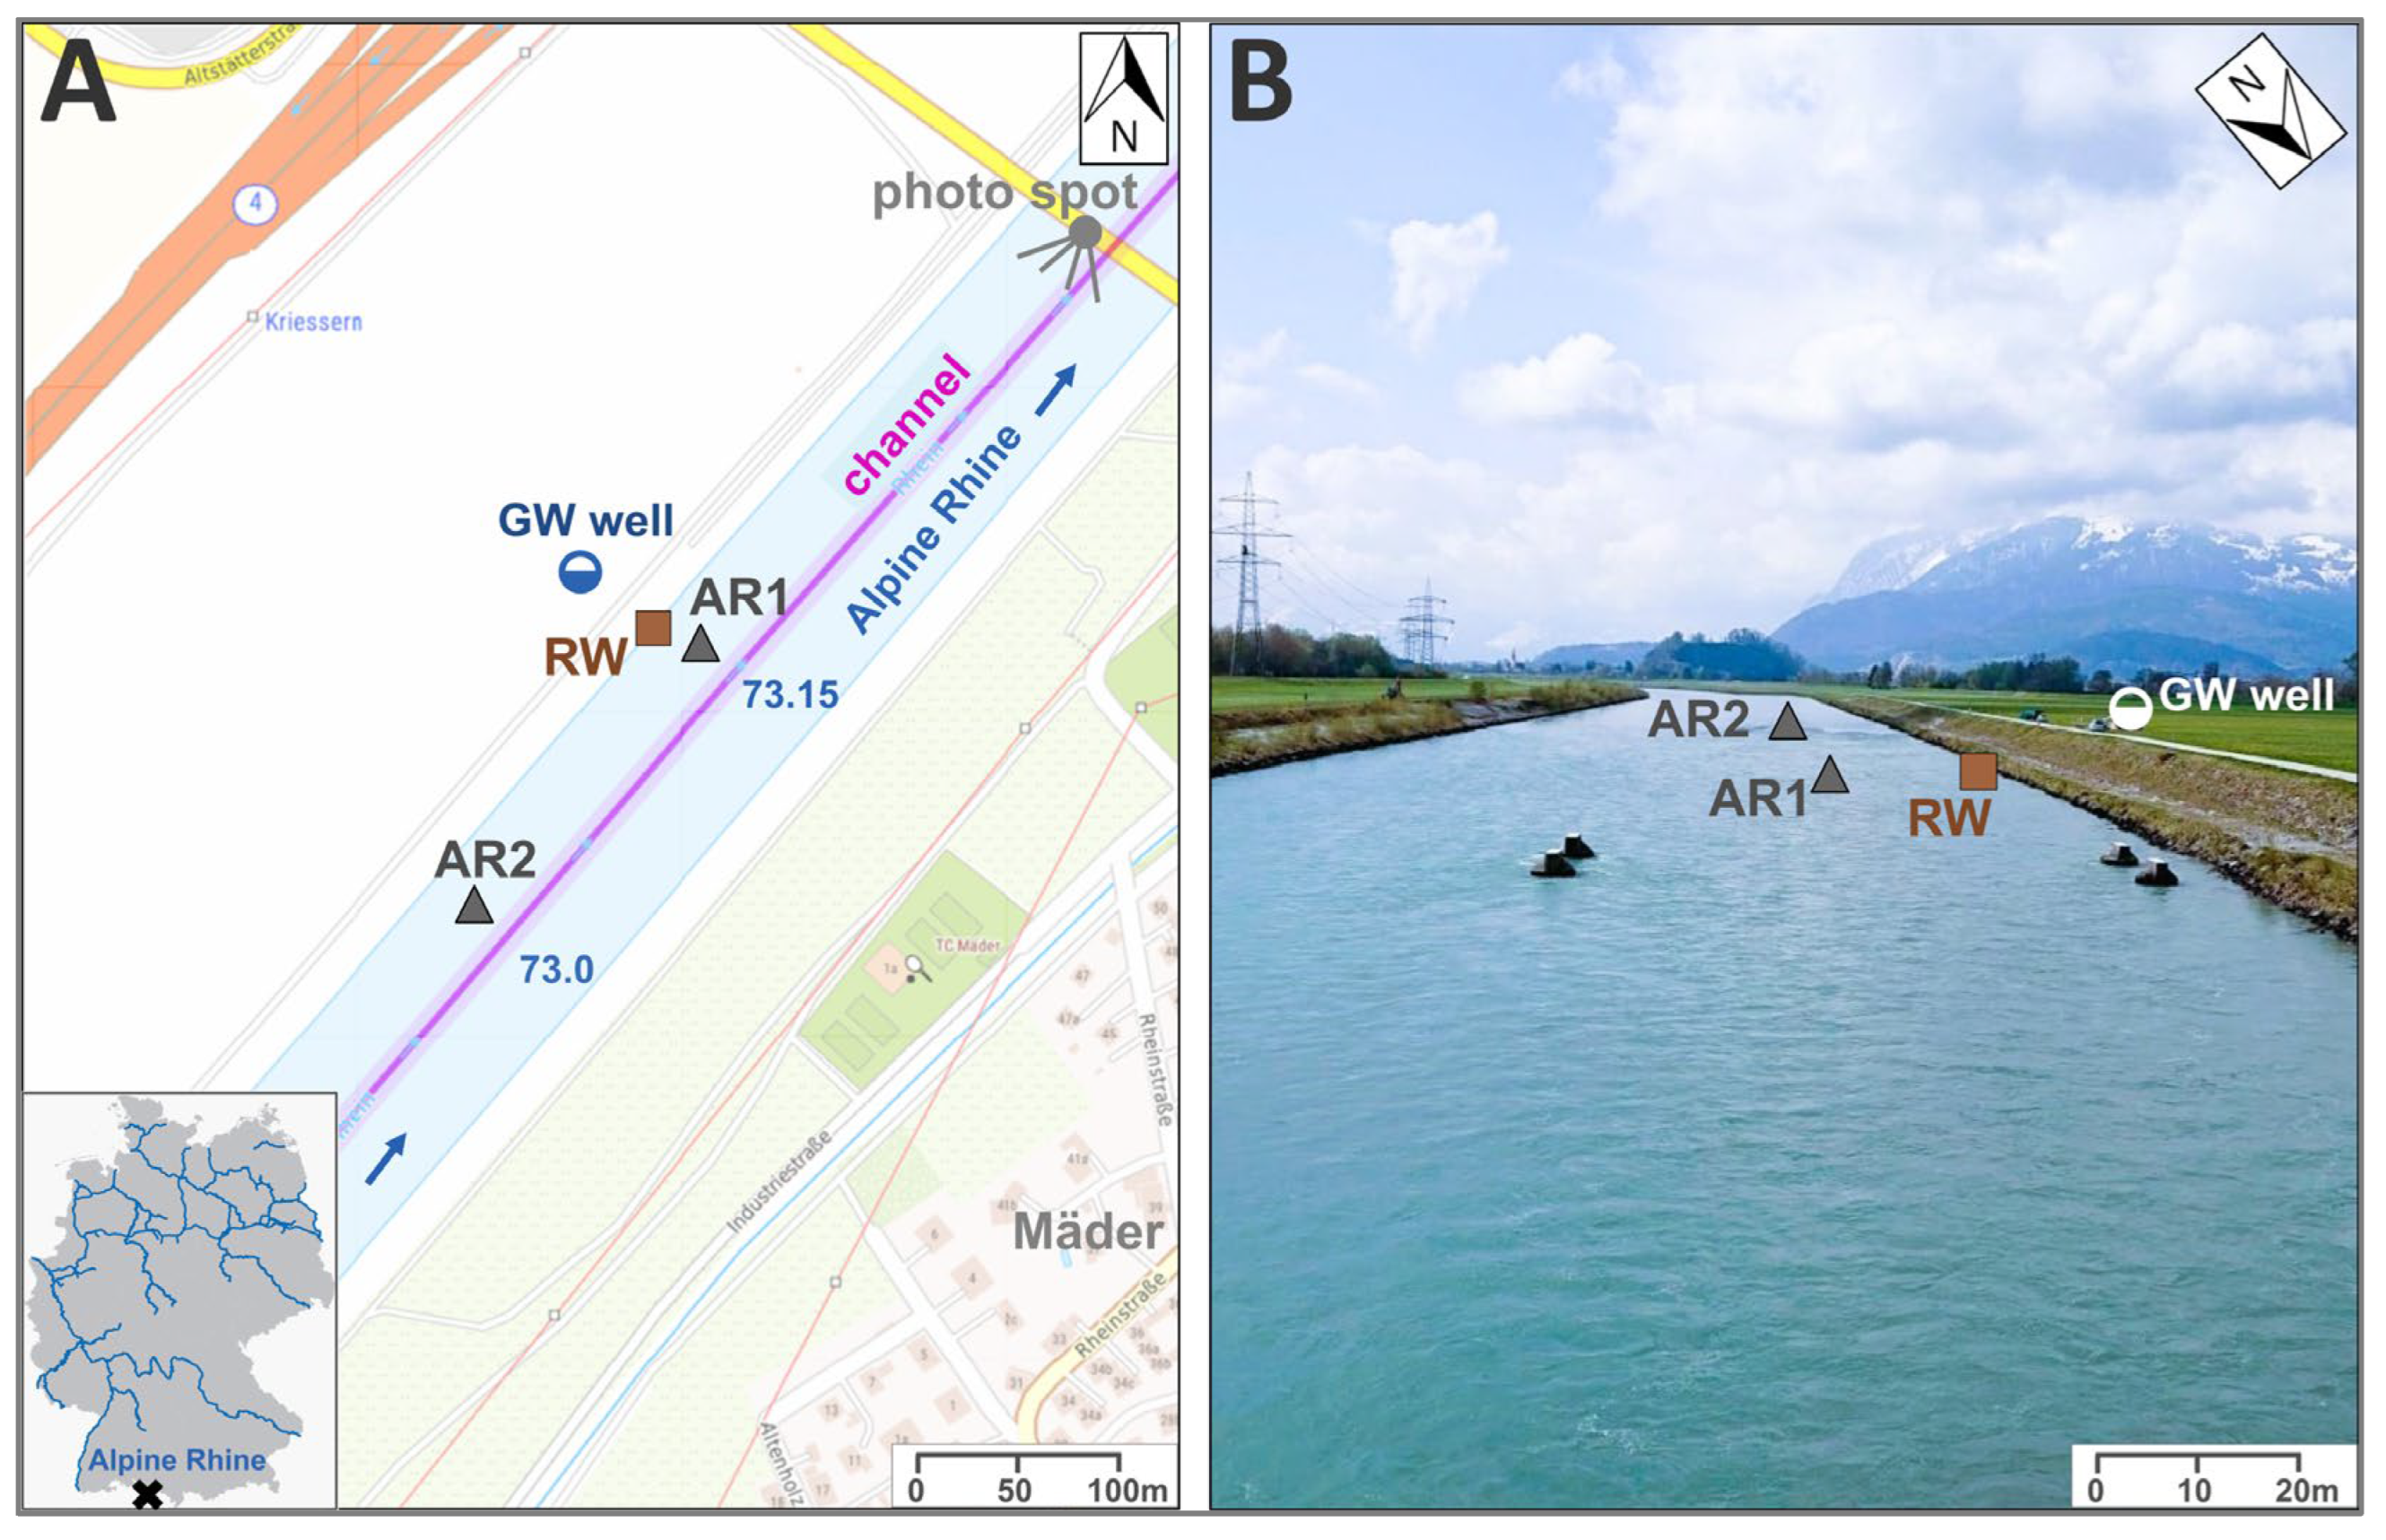
Figure 1. (A) Overview of the study site at the Alpine Rhine (73.0–73.2 river km) including the shipping channel (pink line), the groundwater (GW) monitoring well (blue half-filled circle icon), the river water (RW) sampling location (brown square icon), and the freeze core (AR 1 and AR 2) sampling points (gray triangle icons). Data source for the map: TopPlusOpen (©Federal Agency for Cartography and Geodesy). (B) Photo of the river section (looking upstream) taken from the photo spot shown in (A).
Microplastics 04 00026 g001
Figure 3. (A) Depth-specific vertical MP concentration profiles for each freeze core; the sampling depth was ascribed to the midpoint of the sampled depth segment. (B) Depth-specific MP size distribution, shown as a boxplot of all MPs found in the same depth segment. (C) Depth-specific mean polymer type fraction per depth segment. In AR 2 (140–200 cm) (gray-shaded), spectroscopic MP analysis by NIR could not be performed due to insufficient fine sediment fraction (<2 mm). No MPs were detected by visual inspection of the coarse sediment fraction (≥2 mm).
Microplastics 04 00026 g003
Figure 4. (A) Relative polymer composition for freeze cores (AR 1 and AR 2) sampled in April 2021 and groundwater (GW) and river water (RW) sampled in May 2022. (B) Three microscope images of MPs (in the center of the photo) found in deep-layer sediments >80 cm: (I) yellow polystyrene (PS) hollow sphere, (II) red polypropylene (PP) fibrous fragment, and (III) blue PS particle.
Microplastics 04 00026 g004
Table 1. Summary of total sediment dry weight of each depth-segment sample, proportion of fine sediment (<2 mm), and MP abundance normalized to total depth-segment dry weight.
Sediment CoreDepth Segment
[cm]
Sediment
Dry Weight [g]
Fine Sediment
Fraction [%]
MP Abundance
[MP/kg]
AR 10–50583215.68.3
50–80496716.42.2
80–100633014.23.8
AR 20–40510414.73.9
40–60521824.63.3
60–80278922.53.0
80–100246619.31.3
100–140285812.51.6
140–160319220 *
160–20028670.40 *
* In AR 2 (140–200 cm), spectroscopic MP analysis by NIR could not be performed due to insufficient fine sediment fraction (<2 mm). No MPs were detected by visual inspection of the coarse sediment fraction (≥2 mm).
Disclaimer/Publisher’s Note: The statements, opinions and data contained in all publications are solely those of the individual author(s) and contributor(s) and not of MDPI and/or the editor(s). MDPI and/or the editor(s) disclaim responsibility for any injury to people or property resulting from any ideas, methods, instructions or products referred to in the content.