Abstract
Microplastics (MPs), defined as plastic particles smaller than 5 mm, are an emerging global environmental and health concern due to their pervasive presence in aquatic ecosystems. This systematic review synthesizes data on the distribution, shapes, materials, and sizes of MPs in various water sources, including lakes, rivers, seas, tap water, and bottled water, between 2014 and 2024. Results reveal that river water constitutes the largest share of studies on MP pollution (30%), followed by lake water (24%), sea water (19%), bottled water (17%), and tap water (11%), reflecting their critical roles in MP transport and accumulation. Seasonal analysis indicates that MP concentrations peak in the wet season (38%), followed by the dry (32%) and transitional (30%) seasons. Spatially, China leads MP research globally (19%), followed by the USA (7.8%) and India (5.9%). MPs are predominantly composed of polyethylene (PE), polypropylene (PP), and polyethylene terephthalate (PET), with fibers and fragments being the most common shapes. Sub-millimeter MPs (<1 mm) dominate globally, with significant variations driven by anthropogenic activities, industrial discharge, and environmental factors such as rainfall and temperature. The study highlights critical gaps in understanding the long-term ecological and health impacts of MPs, emphasizing the need for standardized methodologies, improved waste management, and innovative mitigation strategies. This review underscores the urgency of addressing microplastic pollution through global collaboration and stricter regulatory measures.
1. Introduction
Microplastics (MPs), defined as plastic particles smaller than 5 mm, have become a critical environmental issue due to their widespread distribution and persistence in aquatic systems [1,2]. These particles originate from various sources, including personal care products, synthetic textiles, and the breakdown of larger plastic debris, eventually accumulating in ecosystems across the globe [3,4,5]. Microplastics are now found in lakes, rivers, seas, and even freshwater sources like drinking water, raising concerns about their ecological, economic, and potential health impacts [6,7]. Their ubiquity underscores a global crisis requiring immediate attention.
The unique characteristics of microplastics, such as their small size, durability, and ability to carry pollutants, exacerbate their risks. These particles not only persist in the environment but also adsorb harmful chemicals, making them dangerous carriers of toxins that threaten aquatic organisms and, ultimately, human health [8,9,10]. Recent studies reveal that global warming is compounding this problem by releasing previously trapped microplastics from Arctic ice [11]. This highlights the far-reaching consequences of microplastic pollution, extending beyond traditional water bodies.
In lakes, microplastic pollution has been documented in varying concentrations, often influenced by local activities such as urbanization and agriculture [12,13]. For instance, research on Poyang Lake, China, and Lake Ontario, Canada, reveals alarming levels of contamination, affecting fish and other aquatic organisms that ingest these particles [12,14]. Such findings reflect a broader trend, as lakes worldwide are similarly affected by regional human activities.
Rivers play a pivotal role in transporting microplastics from land to the oceans. These waterways carry pollutants from urban runoff, industrial discharge, and agricultural sources [15,16]. In Asia, studies on the Yellow River indicate significant seasonal variations in microplastic concentrations, influenced by monsoon patterns and agricultural runoff [17,18]. Storm events further exacerbate these issues, with regions like South Korea observing sharp increases in microplastic levels after heavy rainfall [19,20]. As critical conduits, rivers highlight the interconnected nature of terrestrial and marine pollution.
Seas and coastal waters face the brunt of microplastic pollution, with concentrations especially high near urban centers due to industrial activities and coastal runoff [21,22]. Studies in the Northwestern Pacific and the Bohai Sea reveal extensive contamination, with particles carried by ocean currents to remote regions [23]. These microplastics are ingested by marine organisms, leading to bioaccumulation and trophic transfer within food webs, which can ultimately impact human consumers [8,9,10].
Freshwater sources, including drinking water, pose direct risks to human health. Microplastics have been detected in tap water, bottled water, soft drinks and even table salt, raising concerns about human ingestion [6,24,25]. For example, studies in Bangkok, Thailand, found microplastics in both tap and bottled water, suggesting current treatment processes are insufficient [26]. Despite growing evidence, the long-term health implications of chronic exposure remain uncertain, warranting further research and improved filtration technologies [27].
Despite extensive research on microplastic pollution in aquatic environments, significant gaps remain in our understanding. Existing studies often focus on specific water systems—lakes, rivers, seas, tap water, or bottled water—without providing a comprehensive comparison across these sources [1,4]. This limits our ability to identify extensive patterns and interconnections, such as the role of rivers in transporting microplastics from terrestrial to marine ecosystems [15]. Regional and seasonal variability is frequently highlighted, but these findings are seldom synthesized to reveal global drivers like industrial activities, land use changes, and climate impacts [17,18]. Additionally, inconsistent methodologies in sampling, analysis, and reporting hinder comparability across studies, leading to fragmented knowledge [6,20].
Research also falls short in addressing the long-term health effects of microplastics in drinking water and food supplies, despite their widespread detection [25,26]. Studies identifying specific pollution sources and pathways remain sparse, particularly in underrepresented regions like Africa and South America [28,29]. Furthermore, the predominance of smaller microplastic particles (<1 mm) raises concerns about their bioavailability and potential trophic transfer, yet this aspect is inadequately explored [8,9]. This review seeks to bridge these gaps by synthesizing data across multiple water sources, analyzing regional and seasonal variations, and identifying priorities for future research on health impacts and mitigation strategies.
The aim of this study is to systematically review the presence, distribution, and impacts of microplastics in various water sources, including lakes, rivers, seas, tap water, and bottled water, providing a comprehensive synthesis of existing literature. This research seeks to address key questions:
- What are the dominant sources and types of microplastics found in each water source?
- How do regional and seasonal factors influence their distribution and abundance?
- What are the potential ecological and health impacts associated with microplastic contamination in these systems?
By answering these questions, the study aims to inform strategies for mitigation and future research priorities. Moreover, the methodology of this review details the careful development of our literature, while the results section is structured into two parts. First, we offer a concise summary of the key understandings from the reviewed articles. Next, we conduct an in-depth systematic review analysis, presenting the findings in a comprehensive fashion. Later, we outline the direction for future studies, highlighting the importance of understanding the impacts of MPs.
2. Methodology
2.1. Reporting
To comprehensively investigate the subject of microplastics in water, as illustrated in Figure 1, we conducted a systematic review according to the guidelines set forth by Preferred Reporting Items for Systematic Reviews and Meta-Analyses (PRISMA).
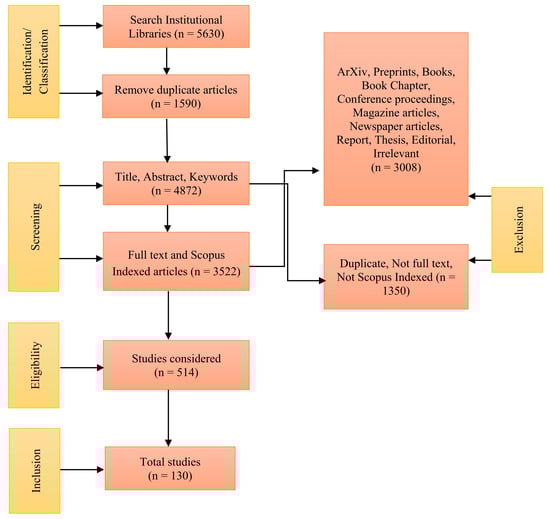
Figure 1.
PRISMA diagram for our research.
2.2. Search Strategy
This review aimed to identify and analyze articles published between January 2014 and December 2024, utilizing the institutional library. We extensively investigated the articles relevant to our topic by following a search strategy that applies a general-to-specific approach. We incorporated a handful of keywords commencing with the topic ‘Microplastics and Water’, followed by the same keywords searched within the topic. We then refine our search using the following keywords: ‘Microplastics and Lakes’, ‘Microplastics and Rivers’, ‘Microplastics and Sea Water’, ‘Microplastics and Tap Water’, and ‘Microplastics and Bottled Water’.
2.3. Inclusion and Exclusion Criteria
While extracting data, we took measures to ensure that our research was trustworthy and of superior quality. Initially, we limited our focus to English-language articles and cross-referenced each article’s sources to identify relevant literature. We organized the chosen articles in the “Author’s Sur Name and Year” format, discarding review articles, duplicate articles, books, book chapters, irrelevant articles, and others. We presumed the chosen database upheld all criteria during the peer-review procedure, ensuring high quality. We considered that all articles should be published in Scopus-indexed journals because these journals are widely recognized for their high quality, credibility, and impact in academic research. Researchers, institutions, and funding agencies prefer Scopus-indexed studies because of their rigorous peer-review process, comprehensive and reliable indexing, global recognition and accessibility, quality control, and ethical standards.
2.4. Quality and Risk of Bias Assessments
Two investigators, GS and AB, conducted the data extraction process separately to minimize potential biases. To determine the eligibility of the articles, the researchers scrutinized the article title, year, and abstract and made independent judgments. In instances of dissension, GS, who led this research, supervised the procedure and settled any divergences.
2.5. Search Findings and Study Characteristics
During our search, we initially identified 5630 articles related to microplastics in water, focusing on peer-reviewed articles published between January 2014 and December 2024, indexed in Scopus, and written in English. We further narrowed the search by focusing on specific water sources, which resulted in the following categories: 461 articles on microplastics in lakes, 1152 in rivers, 1576 in sea water, 425 in tap water, and 426 in bottled water. To ensure relevance, we considered only journal articles, excluding preprints, book chapters, books, magazines, report, thesis, short communication, etc. Following a thorough review of titles and abstracts, 514 articles were chosen for detailed full-text screening. Ultimately, 130 articles were included in the current review study. To avoid duplication, each study was assigned to a single category based on its primary research focus. If a study investigated multiple water bodies (e.g., rivers feeding into lakes), it was classified under the most relevant category based on its key findings. This ensured that no study was counted more than once in the synthesis.
3. Results
Figure 2 shows a word cloud that illustrates a diverse array of keywords derived from review articles on microplastics in freshwater ecosystems. Central themes like “microplastics”, “pollution”, “environment”, “health”, and “water” prominently reflect the critical focus of research on the widespread presence and impact of microplastics. Keywords such as “toxicity”, “aquatic”, “treatment”, and “marine” highlight the emphasis on ecological and toxicological effects, as well as potential mitigation strategies. Terms like “food”, “gut”, “human”, and “organism” signify the broader implications for food safety and health. Additionally, the prominence of “plastic”, “fibers”, and “wastewater” underscores the sources and pathways of microplastic contamination. Overall, the word cloud encapsulates the multi-disciplinary and systemic exploration of microplastic pollution, addressing its origins, impacts, and remediation within freshwater ecosystems.
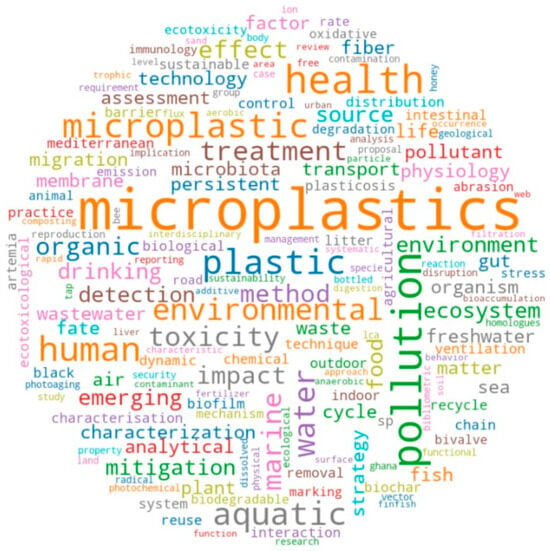
Figure 2.
Word map of microplastics research.
The pie chart in Figure 3 represents the percentage distribution of research conducted on various types of water samples to study microplastic pollution. The largest share, 30.1%, focuses on river water, indicating its critical role as a pathway for microplastics to enter larger water bodies and ecosystems. Lake water follows with 24.1%, reflecting the importance of studying closed water systems where pollutants can accumulate over time. Sea water accounts for 18.8%, highlighting the global concern over marine ecosystems as the ultimate sink for microplastics. Research on bottled water (16.5%) and tap water (10.5%) shows the growing interest in understanding microplastic contamination in drinking water sources, which directly impact human health.

Figure 3.
Percentage of research conducted on different water samples.
Figure 4 depicts the distribution of microplastics sample collections across three distinct seasonal periods: the dry season, the wet season, and a period that spans both seasons. The data highlights the effort to capture microplastic presence under varying environmental conditions, enabling a more comprehensive understanding of seasonal influences on MP distribution and transport. Approximately 32% of MP samples were collected during the dry season. This period, typically marked by minimal rainfall, likely influences the retention and deposition of MPs in the environment. With limited water flow, MPs might accumulate in specific locations, making dry season sampling crucial for understanding their static distribution patterns. The wet season accounted for 38% of MP samples, representing the largest share. The wet season is characterized by increased rainfall and surface runoff, which can facilitate the transport of MPs into water bodies, soils, and other areas. Sampling during this time provides insights into how dynamic hydrological processes, such as flooding or storm water flow, contribute to the movement and dispersal of MPs. Additionally, 30% of the samples were collected during transitional periods encompassing both the dry and wet seasons. This category likely captures the influence of seasonal transitions on MP distribution, offering insights into the combined effects of varying environmental conditions. Sampling during these periods is essential for understanding how shifts between dry and wet conditions impact MP deposition, movement, and accumulation.
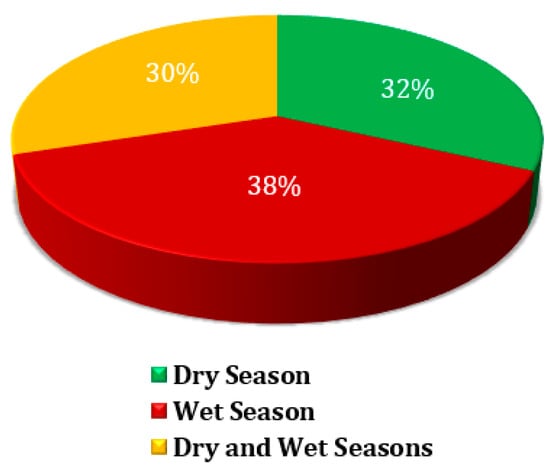
Figure 4.
Percentage of sample collections by period.
The temporal distribution of articles is shown in Figure 5. Among all the articles on MPs in freshwater environment, the oldest one was from 2014, while the latest is from 2024. The trend shows that the number of articles published started showing an upward trend from 2018 onwards. This proves that it is one of the emerging environmental pollutants. In 2023 alone, 21.1% of the articles considered in this study were published.
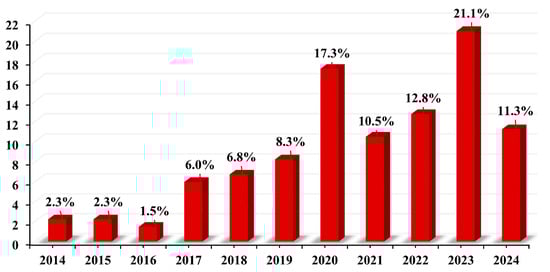
Figure 5.
Percentage of articles published between 2014 to 2024.
Figure 6 shows the percentage of articles published in different journals. Environmental Science journals make up the highest number of articles, followed by Environmental Pollution journals. This highlights the growing interdisciplinary interest in microplastics research, spanning fields such as chemistry, biology, environmental science, sustainable resource management, disaster risk reduction, and climate change. Consequently, there is a strong need for current and localized information on the presence and impact of microplastics in the environment. Addressing this need further underscores the importance of this review at the present stage.
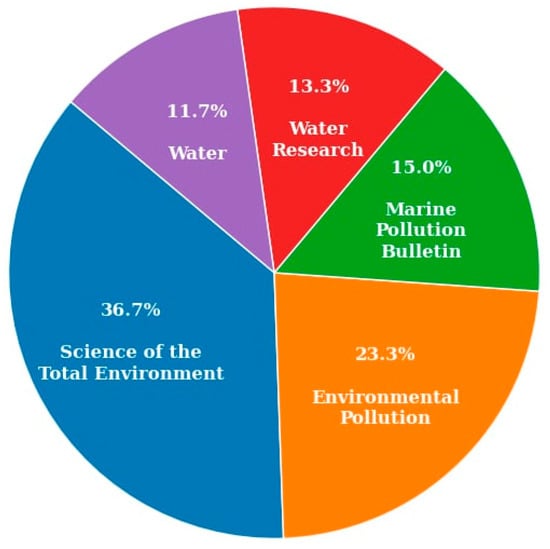
Figure 6.
Percentage of articles published in the journals.
Figure 7 shows the spatial distribution of MPs sample collection. The chart illustrates the percentage distribution of MPs samples collected across various countries, highlighting their contributions to studies on MP pollution. China accounts for the largest share, with 19% of the samples, reflecting its significant role in microplastic research. The USA follows with 7.8%, and India ranks third with 5.9%, indicating these countries’ substantial efforts in monitoring and studying microplastic pollution. The chart also highlights a notable contribution from European countries, such as Spain (4.6%), Germany (3.3%), Italy (2.6%), and Finland (2.6%). These nations, often regarded as having cleaner environments compared to many parts of the world, including the USA, show a significant percentage of MPs collection samples. This suggests that even countries with robust environmental regulations are not immune to the pervasive issue of microplastic pollution and underscores their active engagement in addressing it through research. On the other hand, African nations, such as South Africa (2.6%) and Nigeria (1.3%), also feature in the chart, albeit with smaller contributions. This reflects a growing awareness of microplastic pollution in the African continent, which faces unique challenges such as waste management infrastructure and monitoring systems. The representation of African countries in this research highlights the global reach of microplastic pollution and the importance of studying its effects across diverse ecosystems, including developing regions.
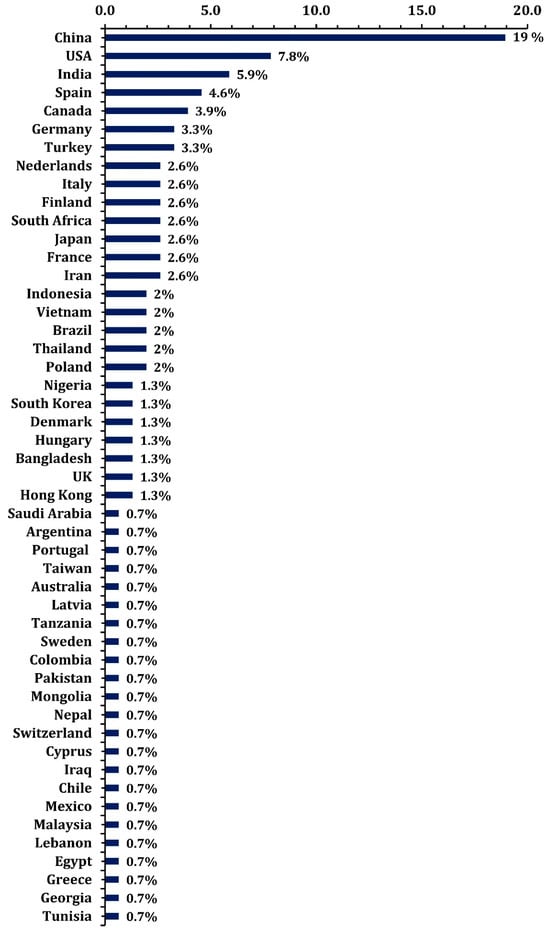
Figure 7.
The proportion of countries where microplastic samples have been collected.
4. Discussion
Microplastics, plastic particles smaller than 5 mm, have been part of the ecosystem for a long time. In 2004, Richard Thompson, a professor of Marine Biology at the University of Plymouth, and his team were the first to demonstrate that microplastic particles have existed and accumulated in the oceans since the 1960s and are now globally prevalent in our seas [30]. Since the term “microplastic” was introduced, approximately 7000 research studies have been published to date, highlighting that the rate of global plastic production has doubled over the past two decades and, according to Thompson, could triple by 2060 [31].
In the following subsections, we will discuss in detail the presence, forms, structures, and other characteristics of these microplastic particles in various aquatic environments.
4.1. Microplastics in Lakes
Table 1 summarizes the MPs pollution in lakes from different areas of the world with important characteristics of MPs like abundance, shapes, materials, colors, and sizes.
Lakes show a large global variation in microplastic pollution level. This is affected by environmental and anthropogenic factors. For instance, particulate abundance reaches up to 2 × 10⁷ particles/km2 in Lake Ontario (Canada/USA) [32] and only 0.03 particles/m3 in remote Great Slave Lake (Canada) [33]. In China, lakes along the Yangtze River have been found to have high concentrations—between 1660 and 8925 particles/m3 [34]. Seasonal studies show even more variability, with dry season concentrations of up to 8329 particles/m3 [28].
The dominant shapes of MPs vary across regions, with fibers being the most common. For example, they account for 95% of MPs in Lake Mead, USA [35], and 93–97% in Lake Phewa, Nepal, depending on the season [36]. Similarly, fibers dominate in Taihu Lake, China, comprising 48–84% of MPs [37]. Fragments are prominent in Sierra Nevada Lakes (60%) [38] and Lake Ontario (up to 42%) [32]. Lesser shapes like foam, films, and pellets are also observed, such as in the Mercy et al. [29] study of Bangladeshi lakes, where films comprise 28%.
The materials of MPs highlight diverse sources of pollution. Common polymers such as polyethylene (PE), polypropylene (PP), and polyester (PES) dominate globally, including in Lake Ontario [32] and Songshan Lake, China [39]. Specific materials like cellophane (CE) are detected in Vesijärvi Lake, Finland [40], linking pollution to packaging waste. Seasonal variations also influence material profiles, as seen in Ox-Bow Lake (Nigeria), where PET dominates in the dry season (72.63%), while PVC is prevalent during the rainy season (81.5%) [28].
The analysis of MPs colors offers insights into pollution origins and degradation. Transparent, blue, and black are globally prevalent. For instance, blue dominates in Taihu Lake, China (50–63%) [37], and Sierra Nevada Lakes, Spain (53%) [38]. In Vesijärvi Lake, Finland, 87% of MPs are white or transparent [41]. Unique regional patterns include gold fragments in Luruaco Lake, Colombia [42], hinting at localized sources.
Microplastics size distribution predominantly skews toward smaller particles. Sub-millimeter MPs (<1 mm) dominate globally, such as in Mahodand Lake, Pakistan, where 57% of MPs are 300–500 μm [43], and Ox-Bow Lake, Nigeria, where sizes below 1 mm comprise 75–80% of MPs [28]. Larger MPs (<5 mm) are observed less frequently, as in Poyang Lake, China [12]. Vesijärvi Lake (Finland) reports fragment sizes of 1100 ± 230 μm and fibers at 430 ± 49 μm [41].
Seasonal and environmental factors significantly influence MPs distribution. For example, dry season concentrations in Ox-Bow Lake, Nigeria, are much higher than rainy season levels, indicating reduced dilution during dry periods [28]. Snow and ice in Vesijärvi Lake, Finland, contain MPs, with concentrations in snow reaching 117.1 ± 18.4 MPs/L, compared to 7.8 ± 1.2 MPs/L in ice [40]. Seasonal studies in Lake Phewa, Nepal, show higher MPs concentrations during the dry season [36].

Table 1.
Abundance of microplastics in lakes, and their shapes, materials, colors, and sizes.
Table 1.
Abundance of microplastics in lakes, and their shapes, materials, colors, and sizes.
| Ref. | Region, Sampling Collection Year, and Abundance | Shape of MPs | Materials of MPs | Color of MPs | Sizes of MPs |
|---|---|---|---|---|---|
| [12] | Poyang lake, China, November 2017, 5–34 items/L | Fiber (41.2%), Film, Fragment, Pellet | PP (38.5%), PE (32.3%), Nylon, PVC (6.2%) | White, Black, Colored (48.9%), Transparent (35.9%) | Less than 0.5 mm (73.1%) |
| [13] | Flathead lake, USA, Summer, 2018, 8 × 10⁴–4.22 × 10⁵ particles/km2, MPs: 100 μm–5 mm | Fiber (55.2–98.5%), Sheet, Fragment, Line | PE, PET, PP, PVC, PS | - | - |
| [14] | Lake Ontario, Canada, 0.8 particles/L | Fiber (28%), Film (27%), Foam (8%), Fragment (34%), others | PET, PE, PVC, PP, PA, CA | White | - |
| [28] | Ox-Bow lake, Nigeria, December 2018 to June 2019, Dry season: 1004–8329 particles/m3, Rainy season: 201–8369 particles/m3 | Fiber, Pellet, Fragment, Bead, Film, Flake | Dry season: PET (72.63%), PP (6.3%), PVC (10.9%), HDPE (7.7%), Rainy season: PVC (81.5%), PA (1.7%), PET (2.6%) | Rainy season: Green (61.2%), Dry season: Red (42.4%), Black, Yellow, Blue, White, Purple | Dry season: 0.02–0.5 mm (4.3%), 0.51–1 mm (6.7%), 1–3 mm (74.9%), 3–5 mm (14.1%), Rainy season: 0.02–0.5 mm (4.9%), 0.51–1 mm (89.1%), 1–3 mm (4.7%), 3–5 mm (2.3%) |
| [29] | Dhanmondi, Gulshan, Hatir Jheel lakes, Bangladesh, September 2021, 8 to 36 items/L | Film (28%), Pellet (25%), Fiber (23%), Fragment (21%), Foam (1%) | HDPE (40%), LDPE (30%), PP (10%), PVC (10%), PC (10%) | Transparent (50%), Black (20%), Red (7%), White (9%), Blue (14%) | <100 μm (30%), 101–200 μm (20%), 201–400 μm (23%), 401–600 μm (7%), 601–800 μm (5%), 801–1000 μm (9%), >1000 μm (7%) |
| [32] | Lake Ontario, Lake Erie, Lake Superior, Canada and USA, 2018–2019, max. 2 × 10⁷ particles/km2 | Lake Ontario: Fragment (37%), Foam (11%), Commercial fragments (19 %), Irregular Microbeads (17%), Lake Erie: Fragment (41%), Foam (12%), Irregular Microbeads (25%), Spherical microbeads (11%), Lake Superior: Fragment (42%), Foam (41%) | PE (61%), PS (12%), PP (16%), PVC | Transparent (50%), White (17%), Grey (15%) | 1.00–4.75 mm, 0.335–1.00 mm (80%) |
| [33] | Great Slave lake, Canada, July to August 2021, 0.03–2.04 particles/m3 | Mostly Fiber, Fragment, Film, Foam | PP, PE, PA, PET, PS, etc. | Colored | - |
| [34] | 20 lakes of Hanjiang, & Yangtze rivers of Wuhan, China, April 2016, 1660 ± 639.1 to 8925 ± 1591 n/m3 | Fiber (52.9 to 95.6%), Pallet, Film, Granule | PET, PE, PP, Nylon, PS | Colored (50.4% to 86.9%), Transparent, Blue, Purple, Red | <2 mm (>80%) |
| [35] | Lake mead, USA, July to October 2018, 0.44–9.7 particles/m3 | Fiber (95%), Fragment, Film, Pallet | PES (65.7%), PP (6.5%), Rayon (6.7%) | Blue, Red and Black (75%), Yellow, White, Transparent, Green, Gray | - |
| [36] | Lake Phewa, Nepal, February & July 2021, Dry: 2.96 ± 1.83 particles/L, Wet: 1.51 ± 0.62 particles/L | Fiber: Dry season (93.04%), Wet season (96.69%), Film, Foam, Fragment | - | Transparent (Dry: 40.51%, Wet: 31.41%), White, Red, Blue, Black, Yellow, Green, Purple | Dry season: 1.0–5.0 mm (0%) 0.2–1.0 mm (100%) Wet season: 1.0–5.0 mm (1%) 0.2–1.0 mm (99%) |
| [37] | Taihu lake, China, Year: August 2015, 3.4–25.8 items/L | Fiber (48–84%), Pellet, Film, Fragment | Cellophane | Blue (50–63%), Green, Yellow, Red, White, Black, Transparent | 5–100 μm, 100–1000 μm, 1000–5000 μm |
| [38] | 35 Lakes, Sierra Nevada, Spain, Avg: 21.3 particles/L | Fragment (60%), Fiber (39%) Sphere (1%) | - | Blue (53%), Transparent (28%), Red (8%), White (2.5%), Black (2%) | <50 μm (26%), 50–100 μm (16%), 100–200 μm (19%), 200–300 μm (11%), 300–500 μm (11%), >500 μm (17%) |
| [39] | Songshan lake, Dongguan, China, March 2018, 2.29 ± 0.98 items/m3 | Film (60.7%), Fragment (24.2%), Foam (3.9%), Fiber (11.2%) | PE, PP, PE-PP, PS, PVC | Transparent (41%), Black (17%), Blue (16%), White (14%), Red (8%), Green (4%) | 0.18–0.6 mm (43.3%), 0.112–0.18 mm (38.1%), 0.6–2 mm (12.4%), 2–5 mm (6.2%) |
| [40] | Vesijärvi lake, Finland, March 2018, Snow: 117.1 ± 18.4 MPs/L, Ice: 7.8 ± 1.2 MPs/L | Fiber, Fragment | Snow: PP/PE (19.6%), PA (14.6%), PE-PET (2.4%), CE (39%), Ice: CE (45.8%), PE/PP (16.6%), PA (8.3%), PU (2.1%) | - | 100–700 μm |
| [42] | Lake Saimaa, Finland, Avg: 0.7 ± 0.1 n/L | Fiber (40%), Fragment | PP, PE, PS, PES (41%), PMMA, PA, PVC | Transparent/White (87%), Brown, Blue, Grey, Red | Fragment (1100 ± 230 μm), Fiber (430 ± 49 μm), 100–500 μm (59%) |
| [43] | Mahodand Lake, Pakistan, June & July, 2019, 0–5 MPs/L | Fiber (50%), Sheet (28%), Fragment (22%) | LDPE (44.4%), PVC (30.5%), HDPE (5.5%) | - | 300–500 μm (57%), 150–300 μm (28%), 50–150 μm (15%) |
| [44] | Lake Hovsgol, Mongolia, July, 2013, Avg: 20,264 particles/km2 | Fragment (40%), Film (38%), Line/Fiber (20%), Pellet (1%), Foam (1%) | - | - | 0.36–1 mm, 10–4.75 mm, >4.75 mm |
| [45] | West and South Dongting lakes, China, April 2018, West: 616.67 to 2216.67 items/m3, South: 716.67 to 2316.67 items/m3 | Fiber (12.17 to 77.42%), Fragment, Pallet, Film | PS (38%), PET (28%), PP (16%), PE (12%) | Transparent, White, Blue, Black, Red, Blue, Green | <0.5 mm, 0.5–5.0 mm |
| [46] | Xianjia, Meixi, Yang, Yue, Yuejin, Nianjia, Dong, Donggua lakes, China, 2425 ± 247.5 items/m3 to 7050 ± 1060.66 items/m3 | Line, Film, Foam, Fragment | PP (33.75%), PE (27.5%), PS (13.75%), PVC (3.75%), PET (11.25%), PA (7.5%) | Transparent | <2 mm (89.5%) |
| [47] | Al-Asfar lake, Saudi Arabia: 0.7 to 7.8 items/L; Al-Hubail lake, Saudi Arabia: 1.1 to 9.0 items/L, Year: Winter, 2017–2018 | Fiber (83%), Fragment (17%) | - | - | <250 μm (30%), Between 250 and 500 μm (70%) |
| [48] | Florentino Ameghino dam, Pico 1 lake, Pico 4 lake, Los Niños lake, Vintter lake, La Plata lake, Fontana lake, Toro lake, Musters lake, Argentina, December 2018, 0.3–1.9 particles/m3 | Fiber (66.7–96.4%), Foam, Fragment, Film, Rubber | PET (38.3%), PU (11.8%), PS (2.9%), PP (2.9%) | Blue (42%), Black (37%), Yellow, Red, White, Green, brown | <1 mm (70.7%), 1–2 mm, 2–3 mm, 3–4 mm, 4–5 mm, >5 mm |
| [49] | Lake Superior, USA, May & July 2018, 9000 to 40,000 particles/ km2 | Fiber (70%), Fragment, Film, Foam, Bead | PE (93%), PP (77%), PS (78%), PET (81%), PVC (12%) | Translucent, Transparent, Blue, White, Black, Yellow, Green, Grey, Purple, Pink, Silver | <4 mm, >0.45 μm |
| [50] | Lake Sassolo, Switzerland, June 2019, 6.8 particles/L | Fiber (36%), Fragment, Film, Pellet, Bead | PE (76.92%), PP (23.08%) | Green, Transparent | 125 to 5000 μm |
| [51] | Lake Michigan (LM), Lake Erie (LE), USA, September, 2013, September 2014, LM: 65.2 p/kg, LE: 431 p/kg | Fiber/Line (>0.355 mm): 91% in LM, 75% in LE, Fragment (>0.355 mm): 1.5% in LM, 10.2% in LE, Pellet/Bead (>0.355 mm): 1.2% in LM, 3.4% in LE, Film (>0.355 mm): 0.9% in LM, 6.4% in LE, Foam (>0.355 mm): 5% in LM, and 5.4% in LE | LM: PET, HDPE, LE: PP, PVC | - | 0.36−1 mm, >1 mm |
| [52] | Bay Mau, Ho Tay, Yen So, Cong Vien, Hoa Phu lakes, Vietnam, 70 to 611 items/m3 | Mostly Fiber, Fragment | - | - | Up to 5000 μm |
| [53] | Vellayani lake, Kerala, India, March 2022, 4.1 particles/L | Film (5%), Fiber (95%) | PES (95%), PP (5%) | White (30%), Colored (70%) | <1000 μm (71%), ˃1000 μm (29%) |
| [54] | Masurian Lakes (30) Poland, July 2019, 0.27 to 1.57 MPs/L | Fragment (36.7%), Film (25.6%), Foam (3.4%), Fiber (30.4%) | - | Blue (30.6%), Black (4.3%), Red (12.7%), Green (10.4%), Transparent (21.3%) | 0.5–1 mm (10.3%), 1–2 mm (19%), 2–3 mm (15.9%), 3–4 mm (14.9%), 4–5 mm (35.0%) |
| [55] | Lake Balaton, Hungary, July 2022, Avg: 5.5 particles/m3 | - | PP, PE, PA, PES | - | 50–100 μm |
| [56] | Lake Balaton, Hungary, July 2022, 1.50 to 106.84 MPs/m3, Avg: 21.0 ± 12.5 MPs/m3 | Fiber (13%), Fragment (87%) | PE (33.29%), PP (31.22%), PS, PVC, PU, PA | - | 50 and 100 μm (26.27%), <500 μm (90%) |
| [57] | 7 lakes in Da Nang City, Vietnam, Year: Apr & Dec 2021, Dry: 293.3 ± 23.1–6510 ± 380.4 items/m3, Wet: 366.7 ± 23.1–1143.3 ± 110.2 items/m3 | Fiber: 44.25% to 75.98% (Dry), 64.54% to 80.17% (Wet). Fragment: 20.78% to 45.86% (Dry), 13.36% to 28.18% (Wet) | PP (47.8%), PE (43.5%) | Blue: 18.47% to 49.35% (Dry), 12.10% to 50% (Wet). White: 22.85% to 50% (Dry), 16.06% to 41.13% (Wet), Black: 14.68% to 33.82% | 1000–2000 μm: Dry (35.4–59.6%), Wet: 34.4–56.4%) |
| [58] | Tembisa (TL), Braamfontein (BL), Silver (SL) Lakes, South Africa, March to June 2023, TL: 4 to 20 particles/L, BL: 9.0 to 31 particles/L, SL: 4.7 to 16 particles/L | BL: Fiber (77%), Fragment (9.68%), Pellet (2.47%), Film (1.9%), TL: Fiber (83.6%), Fragment (13.8%), Film (1.5%), Pellet (1.0%), SL: Fiber (77.7%), Fragment (15.1%), Pellet (0.63%), Film (6.6%) | HDPE, PU, PET | BL: Fiber (Black, 37.5%, Green, 33.1%, Blue, 15%), TL: Fiber (Black, 33.6%, Green, 28.1%, Blue, 24.5%), SL: Fiber (Blue, 30.4%, Black, 26.7%, Transparent, 17.4%) | BL: <1 mm (80%) TL: <1 mm (75%) SL: <1 mm (72%) |
4.2. Microplastics in Rivers
Microplastics (MPs) pollution in rivers varies widely across the globe, reflecting differences in environmental and anthropogenic factors. Some rivers, such as the Seine River in France, show a high prevalence of common polymers like polypropylene (PP) and polyethylene (PE), which are linked to industrial and urban waste [59]. In contrast, smaller river systems like the Gallatin River in the United States report much lower concentrations, ranging from 0 to 0.675 particles per cubic meter [60]. Seasonal variations significantly influence the abundance of MPs in rivers. For example, the Yellow River in China demonstrates that concentrations during the dry season can be more than double those recorded in the wet season due to reduced water flow and dilution effects [17].
The shapes of microplastics in rivers are diverse, but fibers are often the dominant form. Fibers, typically originating from textiles and synthetic fabrics, make up a significant proportion of MPs in many rivers worldwide. For example, they account for 79.1% of MPs in the Yangtze River, China [61], 93.12% in the Lower Yellow River, China [17], and an astonishing 99.4% in the Orange-Vaal River, South Africa [62]. Fragments, which result from the breakdown of larger plastic items, are also common, particularly in industrial and urban environments like the Rhine River, Netherlands, where they constitute 37.5% of detected particles [63]. Films, granules, and other shapes such as spherules are observed in specific contexts, often tied to localized sources of pollution, such as packaging waste and cosmetic products.
The composition of microplastics in rivers often reflects the specific sources of pollution in the surrounding area. Common polymers like polyethylene (PE), polypropylene (PP), and polyethylene terephthalate (PET) are frequently identified in rivers worldwide. These materials dominate in regions with significant industrial activities or high population densities. For instance, the Saigon River in Vietnam shows a prevalence of PE and PET, which are likely linked to urban and industrial discharge [16]. In other cases, less common materials, such as rayon and polyester (PES), are detected in rivers like the Qiantang in China, where textile industries are a major source of pollution [64].
The color distribution of microplastics in rivers provides valuable clues about their sources and the processes they have undergone. Transparent, blue, and black particles are the most commonly reported globally. The prominence of blue fibers in rivers such as the Ganges in India, where they account for 74% of detected MPs, suggests a significant contribution from textile and fabric waste [65]. Similarly, black particles are prevalent in the Ergene River, Turkey, making up nearly half of the MPs detected, possibly indicating industrial soot or tire wear particles [66].
The size distribution of microplastics in rivers is typically skewed toward smaller particles. Sub-millimeter MPs (<1 mm) often dominate, as they are formed through the degradation of larger plastic items and are difficult to filter out in water treatment processes. For example, particles smaller than 500 μm constitute 80% of the MPs detected in the Pearl River, China [67]. In the Nakdong River, South Korea, 74% of MPs are under 300 μm, further demonstrating the predominance of small particles [20]. Larger MPs, such as those over 5 mm, are much rarer and are usually associated with localized sources of industrial discharge, as observed in the Seine River, France [59].
Seasonal and environmental factors play a crucial role in shaping the distribution and concentration of microplastics in rivers. Seasonal fluctuations, particularly differences between wet and dry seasons, often lead to significant variations in MPs abundance. During the dry season, reduced water flow and dilution lead to higher concentrations of MPs, as seen in the Yellow River, China [17]. In colder regions, snow and ice accumulation can influence MPs transport and deposition, as observed in the Hillsborough River, USA, where particles are trapped in seasonal ice formations [68]. All these details are presented in Table 2.
Table 2.
Abundance of microplastics in rivers, and their shapes, materials, colors, and sizes.
4.3. Microplastics in Tap Water
Table 3 summarizes the abundance and characteristics of microplastics found in tap water. Microplastics have been detected in tap water worldwide, raising growing concerns about their presence and potential health impacts. Studies show significant regional variation in microplastic concentrations. For example, Tong et al. [7] reported 440 ± 220 particles/L in samples from various Chinese cities, with fragments (53.85–100%), fibers (1.18–30.77%), and spheres (2.27–36.36%) as the dominant shapes. These particles were primarily composed of polyethylene (PE), polypropylene (PP), and polystyrene (PS). Similarly, Mukotaka et al. [92] found concentrations ranging from 1.9 to 225 particles/L in samples from Japan, the USA, and European countries, with fragments and fibers being the predominant shapes and particle sizes ranging from 19.2 μm to 4.2 mm.
Table 3.
Abundance of microplastics in tap water, and their shapes, materials, colors, and sizes.
Regional differences in material composition and particle size are evident. Chanpiwat and Damrongsiri [26] detected 0.4–2.4 particles/L in tap water from Bangkok, Thailand, with fragments (85.6%) and PE (47.9%) being the most common. In Barcelona, Spain, Vega-Herrera et al. [93] reported smaller microplastics, ranging from 0.7 to 20 μm, primarily composed of PE and PP. Sultan et al. [94] identified fiber (52%) and fragment (43%) shapes in Mosul City, Iraq, with PVC (50–52%) and PET (12–14%) as the dominant materials. The diversity in sizes, from <50 μm (90%) in Iran [95] to particles larger than 1 mm in South Africa [58], underscores the complexity of microplastic contamination in tap water.
4.4. Microplastics in Bottled Water
Microplastics are a widespread contaminant in bottled water, with significant variations in their concentration, shapes, materials, and sizes across regions and bottle types. Globally, microplastic contamination in bottled water ranges from as low as 8.5 ± 10.2 particles/L in Iran [102] to concentrations as high as 2649 ± 2857 particles/L in Germany [103]. Common shapes include fragments, fibers, and films, with fragments being the most dominant, often comprising up to 90% of the total microplastics [104]. Fibers, although less abundant, are a significant component in certain regions, such as Spain, where they account for 68.1% of microplastics in PET bottles [105].
The materials of microplastics in bottled water are diverse, reflecting the polymers used in manufacturing bottles, caps, and packaging. Polyethylene (PE), polypropylene (PP), and polyethylene terephthalate (PET) are the most frequently identified materials. For instance, Mason et al. [106] reported that PP constitutes 54% of microplastics in bottled water from various countries, while PET was prominent in studies from Spain [107] and Thailand [108]. Interestingly, some studies also identified lesser-known materials like polystyrene (PS), nylon, and rubber [99].
Microplastic sizes in bottled water exhibit significant variation. Particles smaller than 50 μm are prevalent, particularly in studies from Hong Kong, where <50 μm particles were detected in concentrations as high as 17,817 particles/L [97]. In contrast, larger particles ranging from 500 to 5000 μm have been observed in regions such as India [109]. Color variations also provide insights into their origin, with transparent and blue particles being the most common, suggesting a link to bottle and cap materials [109,110].All the details are presented in Table 4.
Table 4.
Abundance of microplastics in bottled water, and their shapes, materials, colors, and sizes.
4.5. Microplastics in Sea
Microplastics are pervasive contaminants in marine environments, with their abundance, shapes, materials, and sizes varying widely across different seas and oceans. In the Mediterranean Sea, Cózar et al. [121] reported concentrations ranging from 22 to 1934 g/km2, with fragments (87.7%) dominating the particle shapes, alongside pellets, films, and foams. Similarly, in the Sea of Japan, Isobe et al. [122] found an average of 3.7 items/m3, primarily composed of fragments between 1 mm and 10 mm in size.
Regional studies reveal the prevalence of fibers as a dominant shape in certain seas. For example, in the Baltic Sea, fibers accounted for 82% of microplastics, with materials like polypropylene (PP) and polyethylene (PE) being the most common [123]. Likewise, in the Atlantic Ocean, Kanhai et al. [124] reported that fibers constituted 94% of microplastics, predominantly rayon and acrylic, with particles ranging between 0.25 and 5 mm in size. In the East China Sea and Arctic Ocean, fibers made up 83.8% of particles, with polyethylene terephthalate (PET) and rayon as the primary materials [125].
Microplastic materials reflect the polymers used in industrial and domestic applications, with PE and PP being ubiquitous across marine environments. For instance, PE and PP were the most frequently identified materials in the Baltic Sea [126] and the Tyrrhenian and Ionian Seas [127]. In the Arctic Ocean, particles were composed of polydimethylsiloxane (PDMS), PU, and PET, highlighting regional industrial influences [128].
Microplastic sizes in the sea range widely, from microplastics smaller than 0.3 mm in the Korean Southwest Sea [129] to larger particles exceeding 5 mm in the Bohai Sea [22]. White and transparent microplastics are frequently observed, suggesting contributions from degraded plastics and fishing gear, as seen in the Bohai Sea [130] and the Gulf of Gabes [131]. All the details are presented in Table 5.
Table 5.
Abundance of microplastics in sea water, and their shapes, materials, colors, and sizes.
4.6. Microplastics in Human, Domestic Animals, Birds, and Aquatic Organisms
Microplastics have become pervasive pollutants in aquatic environments, posing significant threats to ecosystems and human health [143]. Water serves as the primary medium for MPs dissemination, making aquatic organisms the most vulnerable to their effects. MPs are introduced into water bodies through various sources, including the breakdown of larger plastics and industrial discharges, leading to their ingestion by a wide range of aquatic species, from plankton to fish [8]. This ingestion can result in physical blockages, malnutrition, and exposure to toxic chemicals that MPs often adsorb, such as persistent organic pollutants (POPs) and heavy metals [144]. These pollutants bioaccumulate and biomagnify as MPs move up the food chain, ultimately affecting higher organisms, including humans and terrestrial animals [145].
The transfer of MPs from aquatic ecosystems to terrestrial organisms occurs via direct consumption of contaminated water and seafood. For instance, studies have reported that humans ingest MPs through seafood, such as shellfish and fish, which are often contaminated due to their filter-feeding behavior or consumption of smaller organisms with MPs in their systems [146]. In domestic animals, the use of contaminated water for drinking or irrigation also contributes to MPs exposure, potentially leading to health issues, including gastrointestinal blockages and toxicity [147]. Birds, especially those feeding near water bodies, are similarly affected; they ingest MPs directly or indirectly through their prey, leading to digestive tract damage and chemical exposure that disrupts reproduction and growth [148]. More research is required to better understand the health risks that microplastics may pose to domestic animals and the potential for human exposure through animal-derived products. Investigations have revealed the presence of notable amounts of microplastics in the food, feces, and tissues of domestic animals, highlighting extensive environmental pollution. Initial findings indicate that certain cooking and processing techniques may help lower microplastic contamination in animal-based products, but further studies are essential to validate these findings [149].
Human health is significantly impacted by microplastics (MPs), as these particles have been detected in human blood, lungs, and even placental tissues [150]. MPs enter the human body through various pathways, including ingestion, inhalation, and dermal exposure. Once internalized, they can traverse biological barriers, such as the intestinal lining, blood-brain barrier, and placental barrier, leading to systemic distribution and accumulation in vital organs [151]. These accumulations are associated with inflammation, oxidative stress, and long-term health risks, particularly in vulnerable populations.
The gastrointestinal tract is a primary site for MP entry and transport, mainly through the consumption of contaminated food and water. MPs can penetrate intestinal epithelial cells via endocytosis, phagocytosis, and intercellular gaps, leading to disruptions in barrier integrity, alterations in gut microbiota, and systemic inflammation [152]. Research indicates that MPs in the gut impair nutrient absorption and enzymatic functions, contributing to oxidative stress, histopathological changes, and exacerbating gastrointestinal diseases such as inflammatory bowel disease [153]. MPs also carry toxic substances, such as persistent organic pollutants (POPs) and heavy metals, which further amplify their negative effects on health [144]. Additionally, MPs’ ability to release toxic additives and contaminants exacerbates inflammatory responses and disrupts gut microbiota composition, further contributing to metabolic dysfunctions [154].
These disruptions in the gastrointestinal system are associated with broader metabolic dysfunctions, as MPs in the gut have been shown to increase systemic inflammation and oxidative stress [155]. Furthermore, MPs can induce histopathological changes that impair intestinal barrier integrity, which may worsen preexisting gastrointestinal conditions [151]. Addressing the impacts of MPs requires further research and improved measures to mitigate exposure through food and water sources.
Inhalation of MPs represents a significant exposure route, particularly in urban and industrialized environments where atmospheric MPs concentrations are higher [156]. MPs in the respiratory system can bypass mucociliary defenses, lodging in lung tissues and even entering the bloodstream. This translocation raises concerns about systemic inflammation and oxidative stress, which are linked to cardiovascular impacts such as atherosclerosis and thrombosis [157,158]. Long-term exposure to airborne MPs has also been associated with increased risks of chronic respiratory conditions, including asthma, chronic obstructive pulmonary disease (COPD), and pulmonary fibrosis [159].
Smaller MPs and nanoplastics (NPs) pose additional concerns due to their ability to penetrate deeper into the alveolar regions of the lungs, increasing the likelihood of translocation into systemic circulation. Once in the bloodstream, MPs can accumulate in detoxification organs such as the liver and spleen, compounding their potential for systemic harm [157]. Furthermore, MPs have been found in bronchoalveolar lavage fluid, emphasizing their possible role in exacerbating existing respiratory diseases [159].
Emerging research has also identified MPs in the human placenta, highlighting concerns about their impact on fetal development and maternal health. MPs have been shown to traverse the maternal-fetal barrier, with studies linking their presence to oxidative stress, hormonal imbalances, and adverse pregnancy outcomes such as preterm birth and low birth weight [160]. Additionally, MPs in the placenta have been associated with disruptions in the placental microbiome, which may lead to cascading effects on both maternal and neonatal health [161,162]. Exposure to MPs during pregnancy has further been implicated in developmental delays and neurotoxic effects in offspring, underscoring the need for stricter regulations on plastic production and pollution [163].
Dermal exposure to MPs, although less studied, remains another potential pathway for systemic distribution. MPs in personal care products such as exfoliants and creams can penetrate the skin through compromised barriers, hair follicles, or sweat glands [164]. Once absorbed, MPs can enter the lymphatic system and bloodstream, posing additional risks. This exposure is further complicated by chemical additives like bisphenols and phthalates, which are known endocrine disruptors and can interfere with hormonal balance [165].
The potential systemic effects of MPs extend beyond individual organ systems. Studies have detected MPs in the circulatory system, where they interact with cellular components, potentially inducing hemolysis, platelet aggregation, and vascular endothelial damage [166]. MPs in blood can also reach neural tissues, crossing the blood-brain barrier and contributing to neuroinflammatory conditions, cognitive deficits, and other neurodegenerative diseases [158]. In reproductive health, MPs have been detected in semen and testes, with evidence linking their presence to reduced sperm quality, hormonal disruptions, and oxidative stress, ultimately affecting fertility [2].
The pervasive presence of MPs in the environment and their diverse pathways into the human body necessitate urgent action to mitigate exposure. Effective measures include improving waste management systems, advancing water filtration technologies, and conducting longitudinal studies to better understand the chronic ecological and health impacts of MPs. Additionally, public health campaigns and stricter regulatory frameworks are critical to addressing this growing concern. Policy interventions must focus on reducing human exposure to MPs across all pathways while protecting vulnerable populations, including children, pregnant women, and individuals with preexisting conditions. All these details are presented in Figure 8.
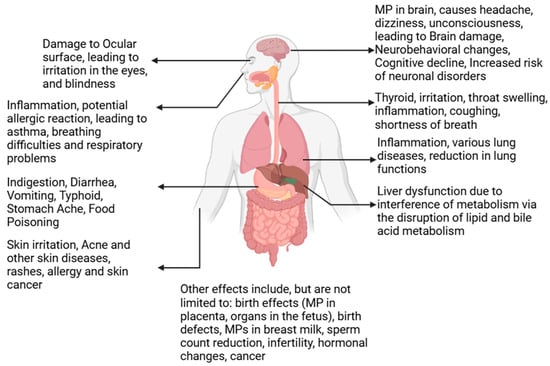
Figure 8.
Effects of microplastics on humans.
5. Conclusions
This review demonstrates the widespread occurrence of microplastics across aquatic environments, from remote lakes to highly urbanized rivers and seas, as well as in drinking and bottled water. The variability in MP abundance, composition, and characteristics reflects the influence of local environmental factors, industrial activities, and water treatment efficiencies. Despite significant progress in identifying MP sources and impacts, knowledge gaps remain regarding their chronic health effects, bioaccumulation pathways, and ecological consequences. The prevalence of MPs in drinking water sources, in particular, calls for immediate action to enhance filtration technologies and establish global standards for monitoring and reporting MP pollution. Addressing these challenges requires interdisciplinary efforts to integrate scientific research with policymaking and community engagement.
6. Future Research Directions
One of the most pressing areas for future research is understanding the health impacts of MP ingestion, particularly through drinking water and food. While studies have detected MPs in human blood, tissues, and organs, the long-term effects of chronic exposure remain poorly understood. Research should focus on identifying potential toxicological pathways, including the role of MPs as vectors for harmful chemicals and pathogens, and their implications for human health, especially in vulnerable populations like children and pregnant women. Biomonitoring studies, particularly those on MP accumulation in human tissues, are crucial to strengthening the evidence regarding health risks, although this falls outside the scope of the current review.
Another critical need is the standardization of methodologies for sampling, analyzing, and reporting MP concentrations. The lack of uniform protocols across studies has led to inconsistencies, making it difficult to compare results and draw generalized conclusions. Future research should prioritize the development and adoption of standardized procedures that account for variations in particle sizes, shapes, and materials, enabling more reliable global assessments of MP pollution. Further efforts are also needed to address the duplication of studies in different categories, ensuring accurate synthesis and avoiding overrepresentation of specific research areas.
Understanding the ecological effects of MPs and their bioaccumulation across trophic levels is another key area requiring attention. Studies have highlighted the ingestion of MPs by aquatic organisms, but the extent of their accumulation and potential transfer through the food web is still unclear. Research should aim to quantify these processes and evaluate the ecological and economic consequences, such as impacts on fisheries and biodiversity. Additionally, investigating the interactions between MPs and natural organic matter, heavy metals, and persistent organic pollutants will deepen our understanding of the long-term fate of MPs in the environment.
Mitigation technologies also demand further exploration, particularly in the context of water treatment and filtration systems. Developing advanced and cost-effective methods to remove MPs from drinking water and wastewater will be crucial for reducing human exposure and environmental contamination. Innovations in membrane technology, adsorption techniques, and microplastic degradation methods should be a focal point for future studies. A comparative analysis of these technologies across regions would also be valuable to inform global strategies for MP pollution control.
Moreover, a significant research gap exists in understanding MP pollution in underrepresented regions, such as Africa and South America. While developed nations have conducted extensive studies, data from low- and middle-income countries are limited, despite these regions often experiencing higher levels of plastic waste mismanagement. Expanding research efforts to these areas will provide a more comprehensive understanding of global MP distribution and inform targeted mitigation strategies.
Finally, translating research findings into actionable policies is essential to addressing the microplastic crisis. Future studies should focus on providing robust evidence to support the development of regulations for plastic production, recycling, and environmental release. By linking scientific discoveries with policymaking, researchers can help create sustainable solutions that minimize the generation and spread of MPs while promoting global collaboration to tackle this pervasive issue. Comparative analyses of regulatory frameworks across different regions could also provide valuable insights for global policymakers.
While this review focused on inland waters, there is a growing need to expand research to include studies from different regions, particularly Europe. Future research should consider the Danube River Basin and similar areas where microplastic pollution is a significant concern. Expanding the geographical scope will provide a more comprehensive understanding of microplastic distribution globally.
Author Contributions
Conceptualization, G.S.; methodology, A.B.; software, A.B.; formal analysis, G.S. and A.B.; investigation, G.S. and A.B.; resources, G.S. and A.B.; data curation, G.S.; writing—original draft preparation, G.S. and A.B.; writing—review and editing, G.S. and A.B.; visualization, G.S. and A.B.; supervision, G.S. All authors have read and agreed to the published version of the manuscript.
Funding
This research received no external funding.
Institutional Review Board Statement
Not applicable.
Informed Consent Statement
Not applicable.
Data Availability Statement
Not applicable.
Acknowledgments
During the preparation of this manuscript, the author(s) used ChatGPT 3.5 for the purposes of language and grammar checking. The authors have reviewed and edited the output and take full responsibility for the content of this publication.
Conflicts of Interest
The authors declare no conflicts of interest.
Abbreviations
| PE | Polyethylene |
| PP | Polypropylene |
| PPS | Polyphenylene Sulfite |
| PS | Polystyrene |
| PET | Polyethylene Terephathalate |
| PMS | Poly alpha-Methylstyrene |
| PTFE | Polytetrafluoroethylene |
| PC | Polycarbonate |
| PMMA | Poly Methyl Methacrylate |
| PBT | Polybutylene Terephthalate |
| PB | Polybutene |
| PVC | Poly Vinyl Chloride |
| LDPE | Low-Density Polyethylene |
| PU | Polyurethane |
| PBS | Polybutylene Succinate |
| PPC | Polypropylene Carbonate |
| PA | Polyamide |
| UA | Urethane Acrylate |
| PVA | Polyvinyl Alcohol |
| PES | Polyethersulfone |
| HDPE | High-Density Polyethylene |
| CE | Cellulose |
| PI | Polyisoprene |
| PBD | Polybutadiene |
| PDMS | Polydimethylsiloxanes |
| ABS | Acrylonitrile Butadiene Styrene |
| CA | Cellulose Acetate |
| EVAc | Ethylene Vinyl Acetate |
| EVOH | Ethylene Vinyl-alcohol |
| PAN | Polyacrylonitrile |
| PEEK | Poly-Ether-Ether-Ketone |
| POM | Polyoxymethylene |
| PPSU | Polyphenylene Sulfone |
| PSU | Polysulfone |
| PLA | Polylactic Acid |
| SI | Silicone |
| SEBS | Styrene-Ethylene-Butylene |
| PDMS | Polydimethyl Siloxane |
| SIL | Polysiloxane |
References
- Leslie, H.A.; Brandsma, S.H.; van Velzen, M.J.M.; Vethaak, A.D. Microplastics en route: Field measurements in the Dutch river delta and Amsterdam canals, wastewater treatment plants, North Sea sediments and biota. Environ. Int. 2017, 101, 133–142. [Google Scholar] [CrossRef] [PubMed]
- Huang, X.; Saha, S.C.; Saha, G.; Francis, I.; Luo, Z. Transport and deposition of microplastics and nanoplastics in the human respiratory tract. Environ. Adv. 2024, 16, 100525. [Google Scholar] [CrossRef]
- Li, J.; Liu, H.; Paul Chen, J. Microplastics in freshwater systems: A review on occurrence, environmental effects, and methods for microplastics detection. Water Res. 2018, 137, 362–374. [Google Scholar] [CrossRef]
- Luo, W.; Su, L.; Craig, N.J.; Du, F.; Wu, C.; Shi, H. Comparison of microplastic pollution in different water bodies from urban creeks to coastal waters. Environ. Pollut. (1987) 2019, 246, 174–182. [Google Scholar] [CrossRef] [PubMed]
- Saha, S.C.; Saha, G. Effect of microplastics deposition on human lung airways: A review with computational benefits and challenges. Heliyon 2024, 10, e24355. [Google Scholar] [CrossRef]
- Kosuth, M.; Mason, S.A.; Wattenberg, E.V.; Zhou, Z. Anthropogenic contamination of tap water, beer, and sea salt. PLoS ONE 2018, 13, e0194970. [Google Scholar] [CrossRef] [PubMed]
- Tong, H.; Jiang, Q.; Hu, X.; Zhong, X. Occurrence and identification of microplastics in tap water from China. Chemosphere 2020, 252, 126493. [Google Scholar] [CrossRef]
- Wright, S.L.; Thompson, R.C.; Galloway, T.S. The physical impacts of microplastics on marine organisms: A review. Environ. Pollut. 2013, 178, 483–492. [Google Scholar] [CrossRef]
- Rochman, C.M.; Hoh, E.; Hentschel, B.T.; Kaye, S. Long-Term Field Measurement of Sorption of Organic Contaminants to Five Types of Plastic Pellets: Implications for Plastic Marine Debris. Environ. Sci. Technol. 2013, 47, 1646–1654. [Google Scholar] [CrossRef]
- Saha, G.; Saha, S.C. Tiny Particles, Big Problems: The Threat of Microplastics to Marine Life and Human Health. Processes 2024, 12, 1401. [Google Scholar] [CrossRef]
- Obbard, R.W.; Sadri, S.; Wong, Y.Q.; Khitun, A.A.; Baker, I.; Thompson, R.C. Global warming releases microplastic legacy frozen in Arctic Sea ice. Earth’s Future 2014, 2, 315–320. [Google Scholar] [CrossRef]
- Yuan, W.; Liu, X.; Wang, W.; Di, M.; Wang, J. Microplastic abundance, distribution and composition in water, sediments, and wild fish from Poyang Lake, China. Ecotoxicol. Environ. Saf. 2019, 170, 180–187. [Google Scholar] [CrossRef] [PubMed]
- Xiong, X.; Tappenbeck, T.H.; Wu, C.; Elser, J.J. Microplastics in Flathead Lake, a large oligotrophic mountain lake in the USA. Environ. Pollut. 2022, 306, 119445. [Google Scholar] [CrossRef] [PubMed]
- Grbić, J.; Helm, P.; Athey, S.; Rochman, C.M. Microplastics entering northwestern Lake Ontario are diverse and linked to urban sources. Water Res. 2020, 174, 115623. [Google Scholar] [CrossRef]
- Rodrigues, M.O.; Abrantes, N.; Gonçalves, F.J.M.; Nogueira, H.; Marques, J.C.; Gonçalves, A.M.M. Spatial and temporal distribution of microplastics in water and sediments of a freshwater system (Antuã River, Portugal). Sci. Total Environ. 2018, 633, 1549. [Google Scholar] [CrossRef]
- Lahens, L.; Strady, E.; Kieu-Le, T.-C.; Dris, R.; Boukerma, K.; Rinnert, E.; Gasperi, J.; Tassin, B. Macroplastic and microplastic contamination assessment of a tropical river (Saigon River, Vietnam) transversed by a developing megacity. Environ. Pollut. 2018, 236, 661–671. [Google Scholar] [CrossRef]
- Han, M.; Niu, X.; Tang, M.; Zhang, B.-T.; Wang, G.; Yue, W.; Kong, X.; Zhu, J. Distribution of microplastics in surface water of the lower Yellow River near estuary. Sci. Total Environ. 2020, 707, 135601. [Google Scholar] [CrossRef]
- Liu, R.; Li, Z.; Liu, F.; Dong, Y.; Jiao, J.; Sun, P.; RM, E.-W. Microplastic pollution in Yellow River, China: Current status and research progress of biotoxicological effects. China Geol. 2021, 4, 585–592. [Google Scholar] [CrossRef]
- Hitchcock, J.N. Storm events as key moments of microplastic contamination in aquatic ecosystems. Sci. Total Environ. 2020, 734, 139436. [Google Scholar] [CrossRef]
- Eo, S.; Hong, S.H.; Song, Y.K.; Han, G.M.; Shim, W.J. Spatiotemporal distribution and annual load of microplastics in the Nakdong River, South Korea. Water Res. 2019, 160, 228–237. [Google Scholar] [CrossRef]
- Pan, Z.; Guo, H.; Chen, H.; Wang, S.; Sun, X.; Zou, Q.; Zhang, Y.; Lin, H.; Cai, S.; Huang, J. Microplastics in the Northwestern Pacific: Abundance, distribution, and characteristics. Sci. Total Environ. 2019, 650 Pt 2, 1913–1922. [Google Scholar] [CrossRef]
- Zhang, W.; Zhang, S.; Zhao, Q.; Qu, L.; Ma, D.; Wang, J. Spatio-temporal distribution of plastic and microplastic debris in the surface water of the Bohai Sea, China. Mar. Pollut. Bull. 2020, 158, 111343. [Google Scholar] [CrossRef] [PubMed]
- Gunaalan, K.; Almeda, R.; Lorenz, C.; Vianello, A.; Iordachescu, L.; Papacharalampos, K.; Rohde Kiær, C.M.; Vollertsen, J.; Nielsen, T.G. Abundance and distribution of microplastics in surface waters of the Kattegat/Skagerrak (Denmark). Environ. Pollut. 2023, 318, 120853. [Google Scholar] [CrossRef] [PubMed]
- Altunisik, A. Prevalence of microplastics in commercially sold soft drinks and human risk assessment. J. Environ. Manag. 2023, 336, 117720. [Google Scholar] [CrossRef] [PubMed]
- Pratesi, C.B.A.L.; Santos Almeida, M.A.; Cutrim Paz, G.S.; Ramos Teotonio, M.H.; Gandolfi, L.; Pratesi, R.; Hecht, M.; Zandonadi, R.P. Presence and quantification of microplastic in urban tap water: A pre-screening in Brasilia, Brazil. Sustainability 2021, 13, 6404. [Google Scholar] [CrossRef]
- Chanpiwat, P.; Damrongsiri, S. Abundance and characteristics of microplastics in freshwater and treated tap water in Bangkok, Thailand. Environ. Monit. Assess. 2021, 193, 258. [Google Scholar] [CrossRef]
- Yang, L.; Kang, S.; Luo, X.; Wang, Z. Microplastics in drinking water: A review on methods, occurrence, sources, and potential risks assessment. Environ. Pollut. 2024, 348, 123857. [Google Scholar] [CrossRef]
- Oni, B.A.; Ayeni, A.O.; Agboola, O.; Oguntade, T.; Obanla, O. Comparing microplastics contaminants in (dry and raining) seasons for Ox- Bow Lake in Yenagoa, Nigeria. Ecotoxicol. Environ. Saf. 2020, 198, 110656. [Google Scholar] [CrossRef]
- Mercy, F.T.; Alam, A.K.M.R.; Akbor Md, A. Abundance and characteristics of microplastics in major urban lakes of Dhaka, Bangladesh. Heliyon 2023, 9, e14587. [Google Scholar] [CrossRef]
- Thompson, R.C.; Olsen, Y.; Mitchell, R.P.; Davis, A.; Rowland, S.J.; Anthony, W.G.; John McGonigle, D.; Russell, A.E. Lost at sea: Where is all the plastic? Science 2004, 304, 838. [Google Scholar] [CrossRef]
- Schiffman, R. Plastics Pioneer Richard Thompson on the Scourge of Marine Microplastics. Yale Environment 360. Available online: https://e360.yale.edu/features/richard-thompson-interview (accessed on 5 December 2024).
- Jasmine, T.Y.; Helm, P.A.; Diamond, M.L. Source-specific categorization of microplastics in nearshore surface waters of the Great Lakes. J. Great Lakes Res. 2024, 50, 102256. [Google Scholar] [CrossRef]
- Bourdages, M.P.; Provencher, J.F.; Hurtubise, J.; Johnson, N.; Vermaire, J.C. Microplastics and anthropogenic microparticles in surface waters from Yellowknife Bay, Great Slave Lake, Northwest Territories, Canada. J. Great Lakes Res. 2024, 50, 102348. [Google Scholar] [CrossRef]
- Wang, W.; Ndungu, A.W.; Li, Z.; Wang, J. Microplastics pollution in inland freshwaters of China: A case study in urban surface waters of Wuhan, China. Sci. Total Environ. 2017, 575, 1369–1374. [Google Scholar] [CrossRef] [PubMed]
- Deng, H.; Wei, R.; Luo, W.; Hu, L.; Li, B.; Di, Y.; Shi, H. Microplastic pollution in water and sediment in a textile industrial area. Environ. Pollut. 2020, 258, 113658. [Google Scholar] [CrossRef]
- Malla-Pradhan, R.; Suwunwong, T.; Phoungthong, K.; Joshi, T.P.; Pradhan, B.L. Microplastic pollution in urban Lake Phewa, Nepal: The first report on abundance and composition in surface water of lake in different seasons. Environ. Sci. Pollut. Res. Int. 2022, 29, 39928–39936. [Google Scholar] [CrossRef]
- Su, L.; Xue, Y.; Li, L.; Yang, D.; Kolandhasamy, P.; Li, D.; Shi, H. Microplastics in Taihu Lake, China. Environ. Pollut. 2016, 216, 711–719. [Google Scholar] [CrossRef]
- Godoy, V.; Calero, M.; González-Olalla, J.M.; Martín-Lara, M.A.; Olea, N.; Ruiz-Gutierrez, A.; Villar-Argaiz, M. The human connection: First evidence of microplastics in remote high mountain lakes of Sierra Nevada, Spain. Environ. Pollut. 2022, 311, 119922. [Google Scholar] [CrossRef]
- Tang, N.; Yu, Y.; Cai, L.; Tan, X.; Zhang, L.; Huang, Y.; Li, B.; Peng, J.; Xu, X. Distribution Characteristics and Source Analysis of Microplastics in Urban Freshwater Lakes: A Case Study in Songshan Lake of Dongguan, China. Water 2022, 14, 1111. [Google Scholar] [CrossRef]
- Scopetani, C.; Chelazzi, D.; Cincinelli, A.; Esterhuizen-Londt, M. Assessment of microplastic pollution: Occurrence and characterisation in Vesijärvi lake and Pikku Vesijärvi pond, Finland. Environ. Monit. Assess. 2019, 191, 652. [Google Scholar] [CrossRef]
- Viitala, M.; Steinmetz, Z.; Sillanpää, M.; Mänttäri, M.; Sillanpää, M. Historical and current occurrence of microplastics in water and sediment of a Finnish lake affected by WWTP effluents. Environ. Pollut. 2022, 314, 120298. [Google Scholar] [CrossRef]
- Rojas-Luna, R.A.; Oquendo-Ruiz, L.; García-Alzate, C.A.; Arana, V.A.; García-Alzate, R.; Trilleras, J. Identification, Abundance, and Distribution of Microplastics in Surface Water Collected from Luruaco Lake, Low Basin Magdalena River, Colombia. Water 2023, 15, 344. [Google Scholar] [CrossRef]
- Bilal, M.; Ul Hassan, H.; Siddique, M.A.M.; Khan, W.; Gabol, K.; Ullah, I.; Sultana, S.; Abdali, U.; Mahboob, S.; Khan, M.S.; et al. Microplastics in the Surface Water and Gastrointestinal Tract of Salmo trutta from the Mahodand Lake, Kalam Swat in Pakistan. Toxics 2022, 11, 3. [Google Scholar] [CrossRef]
- Free, C.M.; Jensen, O.P.; Mason, S.A.; Eriksen, M.; Williamson, N.J.; Boldgiv, B. High-levels of microplastic pollution in a large, remote, mountain lake. Mar. Pollut. Bull. 2014, 85, 156–163. [Google Scholar] [CrossRef] [PubMed]
- Jiang, C.; Yin, L.; Wen, X.; Du, C.; Wu, L.; Long, Y.; Liu, Y.; Ma, Y.; Yin, Q.; Zhou, Z.; et al. Microplastics in sediment and surface water of west Dongting lake and south Dongting lake: Abundance, source and composition. Int. J. Environ. Res. Public Health 2018, 15, 2164. [Google Scholar] [CrossRef]
- Yin, L.; Jiang, C.; Wen, X.; Du, C.; Zhong, W.; Feng, Z.; Long, Y.; Ma, Y. Microplastic pollution in surface water of urban lakes in Changsha, china. Int. J. Environ. Res. Public Health 2019, 16, 1650. [Google Scholar] [CrossRef] [PubMed]
- Picó, Y.; Alvarez-Ruiz, R.; Alfarhan, A.H.; El-Sheikh, M.A.; Alshahrani, H.O.; Barceló, D. Pharmaceuticals, pesticides, personal care products and microplastics contamination assessment of Al-Hassa irrigation network (Saudi Arabia) and its shallow lakes. Sci. Total Environ. 2020, 701, 135021. [Google Scholar] [CrossRef] [PubMed]
- Alfonso, M.B.; Scordo, F.; Seitz, C.; Mavo Manstretta, G.M.; Ronda, A.C.; Arias, A.H.; Tomba, J.P.; Silva, L.I.; Perillo, G.M.E.; Piccolo, M.C. First evidence of microplastics in nine lakes across Patagonia (South America). Sci. Total Environ. 2020, 733, 139385. [Google Scholar] [CrossRef]
- Minor, E.C.; Lin, R.; Burrows, A.; Cooney, E.M.; Grosshuesch, S.; Lafrancois, B. An analysis of microlitter and microplastics from Lake Superior beach sand and surface-water. Sci. Total Environ. 2020, 744, 140824. [Google Scholar] [CrossRef]
- Velasco, A.N.d.J.; Rard, L.; Blois, W.; Lebrun, D.; Lebrun, F.; Pothe, F.; Stoll, S. Microplastic and fibre contamination in a remote Mountain lake in Switzerland. Water 2020, 12, 2410. [Google Scholar] [CrossRef]
- Lenaker, P.L.; Corsi, S.R.; Mason, S.A. Spatial Distribution of Microplastics in Surficial Benthic Sediment of Lake Michigan and Lake Erie. Environ. Sci. Technol. 2021, 55, 373–384. [Google Scholar] [CrossRef]
- Strady, E.; Dang, T.H.; Dao, T.D.; Dinh, H.N.; Do, T.T.D.; Duong, T.N.; Duong, T.T.; Hoang, D.A.; Kieu-Le, T.C.; Le, T.P.Q.; et al. Baseline assessment of microplastic concentrations in marine and freshwater environments of a developing Southeast Asian country, Viet Nam. Mar. Pollut. Bull. 2021, 162, 111870. [Google Scholar] [CrossRef] [PubMed]
- Immanuvel David, T.; Sheela, M.S.; Krishnakumar, S.; Muhammed Siyad, A.; Abimanyu, A.; Vikasini, V.K.; Monisha, T.; Dineshbabu, S. Distribution and characterization of microplastics and ecological risks in Vellayani Lake, Kerala, India. Total Environ. Res. Themes 2023, 7, 100065. [Google Scholar] [CrossRef]
- Pol, W.; Stasińska, E.; Żmijewska, A.; Więcko, A.; Zieliński, P. Litter per liter–Lakes’ morphology and shoreline urbanization index as factors of microplastic pollution: Study of 30 lakes in NE Poland. Sci. Total Environ. 2023, 881, 163426. [Google Scholar] [CrossRef]
- Svigruha, R.; Prikler, B.; Farkas, A.; Ács, A.; Fodor, I.; Tapolczai, K.; Schmidt, J.; Bordós, G.; Háhn, J.; Harkai, P.; et al. Presence, variation, and potential ecological impact of microplastics in the largest shallow lake of Central Europe. Sci. Total Environ. 2023, 883, 163537. [Google Scholar] [CrossRef] [PubMed]
- Prikler, B.; Svigruha, R.; Háhn, J.; Harkai, P.; Fodor, I.; Kaszab, E.; Kriszt, B.; Tóth, G.; Szabó, I.; Csenki, Z.; et al. Spatial Variations in Microplastics in the Largest Shallow Lake of Central Europe and Its Protecting Wetland Area. Water 2024, 16, 1014. [Google Scholar] [CrossRef]
- Tran-Nguyen, Q.A.; Le, T.M.; Nguyen, H.N.Y.; Nguyen, Q.T.; Trinh-Dang, M. Microplastics in the surface water of urban lakes in central Vietnam: Pollution level, characteristics, and ecological risk assessment. Case Stud. Chem. Environ. Eng. 2024, 9, 100622. [Google Scholar] [CrossRef]
- Ramaremisa, G.; Tutu, H.; Saad, D. Detection and characterisation of microplastics in tap water from Gauteng, South Africa. Chemosphere 2024, 356, 141903. [Google Scholar] [CrossRef] [PubMed]
- Gasperi, J.; Dris, R.; Bonin, T.; Rocher, V.; Tassin, B. Assessment of floating plastic debris in surface water along the Seine River. Environ. Pollut. 2014, 195, 163–166. [Google Scholar] [CrossRef]
- Barrows, A.P.W.; Christiansen, K.S.; Bode, E.T.; Hoellein, T.J. A watershed-scale, citizen science approach to quantifying microplastic concentration in a mixed land-use river. Water Res. 2018, 147, 382–392. [Google Scholar] [CrossRef]
- Zhao, S.; Zhu, L.; Wang, T.; Li, D. Suspended microplastics in the surface water of the Yangtze Estuary System, China: First observations on occurrence, distribution. Mar. Pollut. Bull. 2014, 86, 562–568. [Google Scholar] [CrossRef]
- Weideman, E.A.; Perold, V.; Ryan, P.G. Limited long-distance transport of plastic pollution by the Orange-Vaal River system, South Africa. Sci. Total Environ. 2020, 727, 138653. [Google Scholar] [CrossRef] [PubMed]
- Mani, T.; Hauk, A.; Walter, U.; Burkhardt-Holm, P. Microplastics profile along the Rhine River. Sci. Rep. 2015, 5, 17988. [Google Scholar] [CrossRef] [PubMed]
- Zhao, W.; Huang, W.; Yin, M.; Huang, P.; Ding, Y.; Ni, X.; Xia, H.; Liu, H.; Wang, G.; Zheng, H.; et al. Tributary inflows enhance the microplastic load in the estuary: A case from the Qiantang River. Mar. Pollut. Bull. 2020, 156, 111152. [Google Scholar] [CrossRef]
- Napper, I.E.; Baroth, A.; Barrett, A.C.; Bhola, S.; Chowdhury, G.W.; Davies, B.F.R.; Duncan, E.M.; Kumar, S.; Nelms, S.E.; Hasan Niloy, M.N.; et al. The abundance and characteristics of microplastics in surface water in the transboundary Ganges River. Environ. Pollut. 2021, 274, 116348. [Google Scholar] [CrossRef]
- Akdogan, Z.; Guven, B.; Kideys, A.E. Microplastic distribution in the surface water and sediment of the Ergene River. Environ. Res. 2023, 234, 116500. [Google Scholar] [CrossRef]
- Yan, M.; Nie, H.; Xu, K.; He, Y.; Hu, Y.; Huang, Y.; Wang, J. Microplastic abundance, distribution and composition in the Pearl River along Guangzhou city and Pearl River estuary, China. Chemosphere 2019, 217, 879–886. [Google Scholar] [CrossRef] [PubMed]
- Haberstroh, C.J.; Arias, M.E.; Yin, Z.; Wang, M.C. Effects of hydrodynamics on the cross-sectional distribution and transport of plastic in an urban coastal river. Water Environ. Res. 2020, 93, 186–200. [Google Scholar] [CrossRef]
- Vermaire, J.C.; Pomeroy, C.; Herczegh, S.M.; Haggart, O.; Murphy, M. Microplastic abundance and distribution in the open water and sediment of the Ottawa River, Canada, and its tributaries. Facets 2017, 2, 301–314. [Google Scholar] [CrossRef]
- Kapp, K.J.; Yeatman, E. Microplastic hotspots in the Snake and Lower Columbia rivers: A journey from the Greater Yellowstone Ecosystem to the Pacific Ocean. Environ. Pollut. 2018, 241, 1082–1090. [Google Scholar] [CrossRef]
- Alam, F.C.; Sembiring, E.; Muntalif, B.S.; Suendo, V. Microplastic distribution in surface water and sediment river around slum and industrial area (case study: Ciwalengke River, Majalaya district, Indonesia). Chemosphere 2019, 224, 637645. [Google Scholar] [CrossRef]
- Ding, L.; Mao, R.f.; Guo, X.; Yang, X.; Zhang, Q.; Yang, C. Microplastics in surface waters and sediments of the Wei River, in the northwest of China. Sci. Total Environ. 2019, 667, 427–434. [Google Scholar] [CrossRef] [PubMed]
- Tan, X.; Yu, X.; Cai, L.; Wang, J.; Peng, J. Microplastics and associated PAHs in surface water from the Feilaixia Reservoir in the Beijiang River, China. Chemosphere 2019, 221, 834–840. [Google Scholar] [CrossRef]
- Ferraz, M.; Bauer, A.L.; Valiati, V.H.; Schulz, U.H. Microplastic concentrations in raw and drinking water in the Sinos River, Southern Brazil. Water 2020, 12, 3115. [Google Scholar] [CrossRef]
- Lestari, P.; Trihadiningrum, Y.; Wijaya, B.A.; Yunus, K.A.; Firdaus, M. Distribution of microplastics in Surabaya River, Indonesia. Sci. Total Environ. 2020, 726, 138560. [Google Scholar] [CrossRef]
- Scherer, C.; Weber, A.; Stock, F.; Vurusic, S.; Egerci, H.; Kochleus, C.; Arendt, N.; Foeldi, C.; Dierkes, G.; Wagner, M.; et al. Comparative assessment of microplastics in water and sediment of a large European river. Sci. Total Environ. 2020, 738, 139866. [Google Scholar] [CrossRef] [PubMed]
- Tien, C.-J.; Wang, Z.-X.; Chen, C.S. Microplastics in water, sediment and fish from the Fengshan River system: Relationship to aquatic factors and accumulation of polycyclic aromatic hydrocarbons by fish. Environ. Pollut. 2020, 265, 114962. [Google Scholar] [CrossRef]
- Campanale, C.; Stock, F.; Massarelli, C.; Kochleus, C.; Bagnuolo, G.; Reifferscheid, G.; Uricchio, V.F. Microplastics and their possible sources: The example of Ofanto river in southeast Italy. Environ. Pollut. 2020, 258, 113284. [Google Scholar] [CrossRef]
- Amrutha, K.; Warrier, A.K. The first report on the source-to-sink characterization of microplastic pollution from a riverine environment in tropical India. Sci. Total Environ. 2020, 739, 140377. [Google Scholar] [CrossRef] [PubMed]
- Chauhan, J.S.; Semwal, D.; Nainwal, M.; Badola, N.; Thapliyal, P. Investigation of microplastic pollution in river Alaknanda stretch of Uttarakhand. Environ. Dev. Sustain. 2021, 23, 16819–16833. [Google Scholar] [CrossRef]
- Li, S.; Wang, Y.; Liu, L.; Lai, H.; Zeng, X.; Chen, J.; Liu, C.; Luo, Q. Temporal and spatial distribution of microplastics in a coastal region of the Pearl River Estuary, China. Water 2021, 13, 1618. [Google Scholar] [CrossRef]
- Bian, P.; Liu, Y.; Zhao, K.; Hu, Y.; Zhang, J.; Kang, L.; Shen, W. Spatial variability of microplastic pollution on surface of rivers in a mountain-plain transitional area: A case study in the Chin Ling-Wei River Plain, China. Ecotoxicol. Environ. Saf. 2022, 232, 113298. [Google Scholar] [CrossRef] [PubMed]
- Kundu, M.N.; Komakech, H.C.; Lugomela, G. Analysis of Macro- and Microplastics in Riverine, Riverbanks, and Irrigated Farms in Arusha, Tanzania. Arch. Environ. Contam. Toxicol. 2022, 82, 142–157. [Google Scholar] [CrossRef]
- Soltani, N.; Keshavarzi, B.; Moore, F.; Busquets, R.; Nematollahi, M.J.; Javid, R.; Gobert, S. Effect of land use on microplastic pollution in a major boundary waterway: The Arvand River. Sci. Total Environ. 2022, 830, 154728. [Google Scholar] [CrossRef] [PubMed]
- Vaid, M.; Mehra, K.; Sarma, K.; Gupta, A. Investigations on the co-occurrence of microplastics and other pollutants in River Yamuna, Delhi. Water Sci. Technol. Water Supply 2022, 22, 8767–8777. [Google Scholar] [CrossRef]
- Qian, Y.; Shang, Y.; Zheng, Y.; Jia, Y.; Wang, F. Temporal and spatial variation of microplastics in Baotou section of Yellow River, China. J. Environ. Manag. 2023, 338, 117803. [Google Scholar] [CrossRef]
- Rajan, K.; Khudsar, F.A.; Kumar, R. Urbanization and population resources affect microplastic concentration in surface water of the River Ganga. J. Hazard. Mater. Adv. 2023, 11, 100342. [Google Scholar] [CrossRef]
- Khedre, A.M.; Ramadan, S.A.; Ashry, A.; Alaraby, M. Abundance and risk assessment of microplastics in water, sediment, and aquatic insects of the Nile River. Chemosphere 2024, 353, 141557. [Google Scholar] [CrossRef]
- Zhao, W.; Jiang, J.; Liu, M.; Tu, T.; Wang, L.; Zhang, S. Exploring correlations between microplastics, microorganisms, and water quality in an urban drinking water source. Ecotoxicol. Environ. Saf. 2024, 275, 116249. [Google Scholar] [CrossRef]
- Gupta, P.; Saha, M.; Naik, A.; Kumar, M.M.; Rathore, C.; Vashishth, S.; Maitra, S.P.; Bhardwaj, K.D.; Thukral, H. A comprehensive assessment of macro and microplastics from Rivers Ganga and Yamuna: Unveiling the seasonal, spatial and risk factors. J. Hazard. Mater. 2024, 469, 133926. [Google Scholar] [CrossRef]
- Liu, S.; Li, Y.; Wang, F.; Gu, X.; Li, Y.; Liu, Q.; Li, L.; Bai, F. Temporal and spatial variation of microplastics in the urban rivers of Harbin. Sci. Total Environ. 2024, 910, 168373. [Google Scholar] [CrossRef]
- Mukotaka, A.; Kataoka, T.; Nihei, Y. Rapid analytical method for characterization and quantification of microplastics in tap water using a Fourier-transform infrared microscope. Sci. Total Environ. 2021, 790, 148231. [Google Scholar] [CrossRef] [PubMed]
- Vega-Herrera, A.; Llorca, M.; Borrell-Diaz, X.; Redondo-Hasselerharm, P.E.; Abad, E.; Villanueva, C.M.; Farré, M. Polymers of micro (nano) plastic in household tap water of the Barcelona Metropolitan Area. Water Res. 2022, 220, 118645. [Google Scholar] [CrossRef] [PubMed]
- Sultan, M.H.; Al-Ahmady, K.K.; Mhemid, R.K.S. Microplastics Evaluation in Tap Water in Left Side Districts of Mosul City, Iraq. J. Ecol. Eng. 2023, 24, 353–362. [Google Scholar] [CrossRef] [PubMed]
- Taghipour, H.; Ghayebzadeh, M.; Ganji, F.; Mousavi, S.; Azizi, N. Tracking microplastics contamination in drinking water in Zahedan, Iran: From source to consumption taps. Sci. Total Environ. 2023, 872, 162121. [Google Scholar] [CrossRef]
- Feld, L.; Da Silva, V.H.; Murphy, F.; Hartmann, N.B.; Strand, J. A study of microplastic particles in Danish tap water. Water 2021, 13, 2097. [Google Scholar] [CrossRef]
- Tse, Y.T.; Chan, S.M.N.; Sze, E.T.P. Quantitative Assessment of Full Size Microplastics in Bottled and Tap Water Samples in Hong Kong. Int. J. Environ. Res. Public Health 2022, 19, 13432. [Google Scholar] [CrossRef]
- Gálvez-Blanca, V.; Edo, C.; González-Pleiter, M.; Albentosa, M.; Bayo, J.; Beiras, R.; Fernández-Piñas, F.; Gago, J.; Gómez, M.; Gonzalez-Cascon, R.; et al. Occurrence and size distribution study of microplastics in household water from different cities in continental Spain and the Canary Islands. Water Res. 2023, 238, 120044. [Google Scholar] [CrossRef]
- Li, H.; Zhu, L.; Ma, M.; Wu, H.; An, L.; Yang, Z. Occurrence of microplastics in commercially sold bottled water. Sci. Total Environ. 2023, 867, 161553. [Google Scholar] [CrossRef]
- Zhou, G.; Wu, Q.; Wei, X.-F.; Chen, C.; Ma, J.; Crittenden, J.C.; Liu, B. Tracing microplastics in rural drinking water in Chongqing, China: Their presence and pathways from source to tap. J. Hazard. Mater. 2023, 459, 132206. [Google Scholar] [CrossRef]
- Adediran, G.A.; Cox, R.; Jürgens, M.D.; Morel, E.; Cross, R.; Carter, H.; Pereira, M.G.; Read, D.S.; Johnson, A.C. Fate and behaviour of Microplastics (>25 µm) within the water distribution network, from water treatment works to service reservoirs and customer taps. Water Res. 2024, 255, 121508. [Google Scholar] [CrossRef]
- Makhdoumi, P.; Amin, A.A.; Karimi, H.; Pirsaheb, M.; Kim, H.; Hossini, H. Occurrence of microplastic particles in the most popular Iranian bottled mineral water brands and an assessment of human exposure. J. Water Process Eng. 2021, 39, 101708. [Google Scholar] [CrossRef]
- Oßmann, B.E.; Sarau, G.; Holtmannspötter, H.; Pischetsrieder, M.; Christiansen, S.H.; Dicke, W. Small-sized microplastics and pigmented particles in bottled mineral water. Water Res. 2018, 141, 307–316. [Google Scholar] [CrossRef]
- Gambino, I.; Malitesta, C.; Bagordo, F.; Grassi, T.; Panico, A.; Fraissinet, S.; De Donno, A.; De Benedetto, G.E. Characterization of microplastics in water bottled in different packaging by Raman spectroscopy. Environ. Sci. Water Res. Technol. 2023, 9, 3391–3397. [Google Scholar] [CrossRef]
- Gálvez-Blanca, V.; Edo, C.; González-Pleiter, M.; Fernández-Piñas, F.; Leganés, F.; Rosal, R. Microplastics and non-natural cellulosic particles in Spanish bottled drinking water. Sci. Rep. 2024, 14, 11089. [Google Scholar] [CrossRef] [PubMed]
- Mason, S.A.; Welch, V.G.; Neratko, J. Synthetic Polymer Contamination in Bottled Water. Front. Chem. 2018, 6, 407. [Google Scholar] [CrossRef]
- Vega-Herrera, A.; Garcia-Torné, M.; Borrell-Diaz, X.; Abad, E.; Llorca, M.; Villanueva, C.M.; Farré, M. Exposure to micro (nano) plastics polymers in water stored in single-use plastic bottles. Chemosphere 2023, 343, 140106. [Google Scholar] [CrossRef] [PubMed]
- Kankanige, D.; Babel, S. Smaller-sized micro-plastics (MPs) contamination in single-use PET-bottled water in Thailand. Sci. Total Environ. 2020, 717, 137232. [Google Scholar] [CrossRef]
- Sekar, V.; Shaji, S.; Sundaram, B. Microplastic prevalence and human exposure in the bottled drinking water in the west Godavari region of Andhra Pradesh, India. J. Contam. Hydrol. 2024, 264, 104346. [Google Scholar] [CrossRef]
- Altunisik, A. Microplastic pollution and human risk assessment in Turkish bottled natural and mineral waters. Environ. Sci. Pollut. Res. Int. 2023, 30, 39815. [Google Scholar] [CrossRef]
- Zuccarello, P.; Ferrante, M.; Cristaldi, A.; Copat, C.; Grasso, A.; Sangregorio, D.; Fiore, M.; Oliveri Conti, G. Exposure to Microplastics (<10 μm) associated to plastic bottles mineral water consumption: The first quantitative study. Water Res. 2019, 157, 365–371. [Google Scholar] [CrossRef]
- Weisser, J.; Beer, I.; Hufnagl, B.; Hofmann, T.; Lohninger, H.; Ivleva, N.P.; Glas, K. From the well to the bottle: Identifying sources of microplastics in mineral water. Water 2021, 13, 841. [Google Scholar] [CrossRef]
- Zhou, X.J.; Wang, J.; Li, H.Y.; Zhang, H.M.; Zhang, D.L. Microplastic pollution of bottled water in China. J. Water Process Eng. 2021, 40, 101884. [Google Scholar] [CrossRef]
- Huang, Y.; Wong, K.K.; Li, W.; Zhao, H.; Wang, T.; Stanescu, S.; Boult, S.; van Dongen, B.; Mativenga, P.; Li, L. Characteristics of nano-plastics in bottled drinking water. J. Hazard. Mater. 2022, 424, 127404. [Google Scholar] [CrossRef] [PubMed]
- Praveena, S.M.; Shamsul Ariffin, N.I.; Nafisyah, A.L. Microplastics in Malaysian bottled water brands: Occurrence and potential human exposure. Environ. Pollut. 2022, 315, 120494. [Google Scholar] [CrossRef]
- Ibeto, C.N.; Enyoh, C.E.; Ofomatah, A.C.; Oguejiofor, L.A.; Okafocha, T.; Okanya, V. Microplastics pollution indices of bottled water from South Eastern Nigeria. Int. J. Environ. Anal. Chem. 2023, 103, 8176–8195. [Google Scholar] [CrossRef]
- Nacaratte, F.; Cuevas, P.; Becerra-Herrera, M.; Manzano, C.A. Early screening of suspected microplastics in bottled water in the Santiago Metropolitan Region of Chile. Environ. Pollut. 2023, 334, 122118. [Google Scholar] [CrossRef]
- Nizamali, J.; Mintenig, S.M.; Koelmans, A.A. Assessing microplastic characteristics in bottled drinking water and air deposition samples using laser direct infrared imaging. J. Hazard. Mater. 2023, 441, 129942. [Google Scholar] [CrossRef]
- Nocon, W.; Moraczewska-Majkut, K.; Wisniowska, E. Microplastics in bottled water and bottled soft drinks. Desalination Water Treat. 2023, 312, 64–69. [Google Scholar] [CrossRef]
- Vitali, C.; Peters, R.J.B.; Janssen, H.-G.; Undas, A.K.; Munniks, S.; Ruggeri, F.S.; Nielen, M.W.F. Quantitative image analysis of microplastics in bottled water using artificial intelligence. Talanta 2024, 266, 124965. [Google Scholar] [CrossRef]
- Cózar, A.; Sanz-Martín, M.; Martí, E.; González-Gordillo, J.I.; Ubeda, B.; Gálvez, J.Á.; Irigoien, X.; Duarte, C.M. Plastic accumulation in the Mediterranean Sea. PLoS ONE 2015, 10, e0121762. [Google Scholar] [CrossRef]
- Isobe, A.; Uchida, K.; Tokai, T.; Iwasaki, S. East Asian seas: A hot spot of pelagic microplastics. Mar. Pollut. Bull. 2015, 101, 618–623. [Google Scholar] [CrossRef]
- Gewert, B.; Ogonowski, M.; Barth, A.; MacLeod, M. Abundance and composition of near surface microplastics and plastic debris in the Stockholm Archipelago, Baltic Sea. Mar. Pollut. Bull. 2017, 120, 292–302. [Google Scholar] [CrossRef]
- Kanhai, L.D.K.; Officer, R.; Lyashevska, O.; Thompson, R.C.; O’Connor, I. Microplastic abundance, distribution and composition along a latitudinal gradient in the Atlantic Ocean. Mar. Pollut. Bull. 2017, 115, 307–314. [Google Scholar] [CrossRef] [PubMed]
- Huang, Y.; Zhang, W.; Zhang, S.; Jin, F.; Fang, C.; Ma, X.; Wang, J.; Mu, J. Systematical insights into distribution and characteristics of microplastics in near-surface waters from the East Asian Seas to the Arctic Central Basin. Sci. Total Environ. 2022, 814, 151923. [Google Scholar] [CrossRef] [PubMed]
- Aigars, J.; Barone, M.; Suhareva, N.; Putna-Nimane, I.; Dimante-Deimantovica, I. Occurrence and spatial distribution of microplastics in the surface waters of the Baltic Sea and the Gulf of Riga. Mar. Pollut. Bull. 2021, 172, 112860. [Google Scholar] [CrossRef]
- Galli, M.; Tepsich, P.; Baini, M.; Panti, C.; Rosso, M.; Vafeiadou, A.; Pantelidou, M.; Moulins, A.; Fossi, M.C. Microplastic abundance and biodiversity richness overlap: Identification of sensitive areas in the Western Ionian Sea. Mar. Pollut. Bull. 2022, 177, 113550. [Google Scholar] [CrossRef]
- Ikenoue, T.; Nakajima, R.; Mishra, P.; Ramasamy, E.V.; Fujiwara, A.; Nishino, S.; Murata, A.; Watanabe, E.; Itoh, M. Floating microplastic inventories in the southern Beaufort Sea, Arctic Ocean. Front. Mar. Sci. 2023, 10, 1288301. [Google Scholar] [CrossRef]
- Min, B.K.; Jeong, H.H.; Ju, M.J.; Ko, U.; Dae, K.H.; Kim, H.J.; Cho, C.R.; Soh, H.Y.; Ishibashi, Y.; Cho, H.S. Baseline Study on Microplastic Distribution in the Open Surface Waters of the Korean Southwest Sea. Water 2023, 15, 2393. [Google Scholar] [CrossRef]
- Zhang, W.; Zhang, S.; Wang, J.; Wang, Y.; Mu, J.; Wang, P.; Lin, X.; Ma, D. Microplastic pollution in the surface waters of the Bohai Sea, China. Environ. Pollut. 2017, 231, 541–548. [Google Scholar] [CrossRef]
- Zayen, A.; Sayadi, S.; Chevalier, C.; Boukthir, M.; Ben Ismail, S.; Tedetti, M. Microplastics in surface waters of the Gulf of Gabes, southern Mediterranean Sea: Distribution, composition and influence of hydrodynamics. Estuar. Coast. Shelf Sci. 2020, 242, 106832. [Google Scholar] [CrossRef]
- Aytan, U.; Valente, A.; Senturk, Y.; Usta, R.; Esensoy Sahin, F.B.; Mazlum, R.E.; Agirbas, E. First evaluation of neustonic microplastics in Black Sea waters. Mar. Environ. Res. 2016, 119, 22–30. [Google Scholar] [CrossRef] [PubMed]
- Cincinelli, A.; Scopetani, C.; Chelazzi, D.; Lombardini, E.; Martellini, T.; Katsoyiannis, A.; Fossi, M.C.; Corsolini, S. Microplastic in the surface waters of the Ross Sea (Antarctica): Occurrence, distribution and characterization by FTIR. Chemosphere 2017, 175, 391–400. [Google Scholar] [CrossRef]
- Schmidt, N.; Thibault, D.; Galgani, F.; Paluselli, A.; Sempéré, R. Occurrence of microplastics in surface waters of the Gulf of Lion (NW Mediterranean Sea). Prog. Oceanogr. 2018, 163, 214–220. [Google Scholar] [CrossRef]
- Tunçer, S.; Artüz, O.B.; Demirkol, M.; Artüz, M.L. First report of occurrence, distribution, and composition of microplastics in surface waters of the Sea of Marmara, Turkey. Mar. Pollut. Bull. 2018, 135, 283–289. [Google Scholar] [CrossRef] [PubMed]
- Mu, J.; Zhang, S.; Qu, L.; Jin, F.; Fang, C.; Ma, X.; Zhang, W.; Wang, J. Microplastics abundance and characteristics in surface waters from the Northwest Pacific, the Bering Sea, and the Chukchi Sea. Mar. Pollut. Bull. 2019, 143, 58–65. [Google Scholar] [CrossRef]
- Nematollahi, M.J.; Moore, F.; Keshavarzi, B.; Vogt, R.D.; Nasrollahzadeh Saravi, H.; Busquets, R. Microplastic particles in sediments and waters, south of Caspian Sea: Frequency, distribution, characteristics, and chemical composition. Ecotoxicol. Environ. Saf. 2020, 206, 111137. [Google Scholar] [CrossRef]
- Uurasjärvi, E.; Pääkkönen, M.; Setälä, O.; Koistinen, A.; Lehtiniemi, M. Microplastics accumulate to thin layers in the stratified Baltic Sea. Environ. Pollut. 2021, 268, 115700. [Google Scholar] [CrossRef]
- D’Angelo, A.; Trenholm, N.; Loose, B.; Glastra, L.; Strock, J.; Kim, J. Microplastics Distribution within Western Arctic Seawater and Sea Ice. Toxics 2023, 11, 792. [Google Scholar] [CrossRef]
- Dereszewska, A.; Krasowska, K.; Popek, M. Microplastics in Harbour Seawaters: A Case Study in the Port of Gdynia, Baltic Sea. Sustainability 2023, 15, 6678. [Google Scholar] [CrossRef]
- Ikenoue, T.; Nakajima, R.; Fujiwara, A.; Onodera, J.; Itoh, M.; Toyoshima, J.; Watanabe, E.; Murata, A.; Nishino, S.; Kikuchi, T. Horizontal distribution of surface microplastic concentrations and water-column microplastic inventories in the Chukchi Sea, western Arctic Ocean. Sci. Total Environ. 2023, 855, 159564. [Google Scholar] [CrossRef]
- Leistenschneider, C.; Wu, F.; Primpke, S.; Gerdts, G.; Burkhardt-Holm, P. Unveiling high concentrations of small microplastics (11–500 μm) in surface water samples from the southern Weddell Sea off Antarctica. Sci. Total Environ. 2024, 927, 172124. [Google Scholar] [CrossRef]
- Li, B.; Ding, Y.; Cheng, X.; Sheng, D.; Xu, Z.; Rong, Q.; Wu, Y.; Zhao, H.; Ji, X.; Zhang, Y. Polyethylene microplastics affect the distribution of gut microbiota and inflammation development in mice. Chemosphere 2020, 244, 125492. [Google Scholar] [CrossRef] [PubMed]
- Koelmans, A.A.; Besseling, E.; Foekema, E.M. Leaching of plastic additives to marine organisms. Environ. Pollut. 2014, 187, 49–54. [Google Scholar] [CrossRef] [PubMed]
- Diepens, N.J.; Koelmans, A.A. Accumulation of plastic debris and associated contaminants in aquatic food webs. Environ. Sci. Technol. 2018, 52, 8510–8520. [Google Scholar] [CrossRef] [PubMed]
- Browne, M.A.; Dissanayake, A.; Galloway, T.S.; Lowe, D.M.; Thompson, R.C. Ingested microscopic plastic translocates to the circulatory system of the mussel, Mytilus edulis. Environ. Sci. Technol. 2008, 42, 5026–5031. [Google Scholar] [CrossRef]
- Gallo, F.; Fossi, C.; Weber, R.; Santillo, D.; Sousa, J.; Ingram, I.; Nadal, A.; Romano, D. Marine litter plastics and microplastics and their toxic chemicals components: The need for urgent preventive measures. Environ. Sci. Eur. 2018, 30, 13. [Google Scholar] [CrossRef]
- Provencher, J.F.; Bond, A.L.; Mallory, M.L. Marine birds and plastic debris in Canada: A national synthesis, and a way forward. Environ. Rev. 2014, 23, 1–13. [Google Scholar] [CrossRef]
- Bhowmik, A.; Saha, G.; Saha, S.C. Microplastics in Animals: The Silent Invasion. Pollutants 2024, 4, 490–497. [Google Scholar] [CrossRef]
- Schwabl, P.; Köppel, S.; Königshofer, P.; Bucsics, T.; Trauner, M.; Reiberger, T.; Liebmann, B. Detection of microplastics in human stool: A prospective case series. Ann. Intern. Med. 2019, 171, 453–457. [Google Scholar] [CrossRef]
- Li, Y.; Chen, L.; Zhou, N.; Chen, Y.; Ling, Z.; Xiang, P. Microplastics in the human body: A comprehensive review of exposure, distribution, migration mechanisms, and toxicity. Sci. Total Environ. 2024, 946, 174215. [Google Scholar] [CrossRef]
- Yan, Z.; Liu, Y.; Zhang, T.; Zhang, F.; Ren, H.; Zhang, Y. Analysis of Microplastics in Human Feces Reveals a Correlation between Fecal Microplastics and Inflammatory Bowel Disease Status. Environ. Sci. Technol. 2022, 56, 414–421. [Google Scholar] [CrossRef] [PubMed]
- Fournier, S.B.; D’Errico, J.N.; Adler, D.S.; Kollontzi, S.; Goedken, M.J.; Fabris, L.; Yurkow, E.J.; Stapleton, P.A. Nanopolystyrene translocation and fetal deposition after acute lung exposure during late-stage pregnancy. Part. Fibre Toxicol. 2020, 17, 55. [Google Scholar] [CrossRef] [PubMed]
- Smith, M.; Love, D.C.; Rochman, C.M.; Neff, R.A. Microplastics in seafood and the implications for human health. Curr. Environ. Health Rep. 2018, 5, 375–386. [Google Scholar] [CrossRef]
- Zhu, M.; Li, P.; Xu, T.; Zhang, G.; Xu, Z.; Wang, X.; Zhao, L.; Yang, H. Combined exposure to lead and microplastics increased risk of glucose metabolism in mice via the Nrf2/NF-κB pathway. Environ. Toxicol. 2024, 39, 2502–2511. [Google Scholar] [CrossRef]
- Amato-Lourenço, L.F.; Carvalho-Oliveira, R.; Júnior, G.R.; dos Santos Galvão, L.; Ando, R.A.; Mauad, T. Presence of airborne microplastics in human lung tissue. Environ. Sci. Technol. Lett. 2020, 7, 928–931. [Google Scholar] [CrossRef]
- Vethaak, A.D.; Legler, J. Microplastics and human health. Science 2021, 371, 672–674. [Google Scholar] [CrossRef] [PubMed]
- Shan, S.; Zhang, Y.; Zhao, H.; Zeng, T.; Zhao, X. Polystyrene nanoplastics penetrate across the blood-brain barrier and induce activation of microglia in the brain of mice. Chemosphere 2022, 298, 134261. [Google Scholar] [CrossRef]
- Qiu, L.; Lu, W.; Tu, C.; Li, X.; Zhang, H.; Wang, S.; Chen, M.; Zheng, X.; Wang, Z.; Lin, M.; et al. Evidence of microplastics in bronchoalveolar lavage fluid among never-smokers: A prospective case series. Environ. Sci. Technol. 2023, 57, 2435–2444. [Google Scholar] [CrossRef]
- Liu, S.; Liu, X.; Guo, J.; Yang, R.; Wang, H.; Sun, Y.; Chen, B.; Dong, R. The association between microplastics and microbiota in placentas and meconium: The first evidence in humans. Environ. Sci. Technol. 2022, 57, 17774–17785. [Google Scholar] [CrossRef]
- Hunt, K.; Davies, A.; Fraser, A.; Burden, C.; Howell, A.; Buckley, K.; Harding, S.; Bakhbakhi, D. Exposure to microplastics and human reproductive outcomes: A systematic review. BJOG Int. J. Obstet. Gynaecol. 2024, 131, 675–683. [Google Scholar] [CrossRef]
- Sharma, R.K.; Kumari, U.; Kumar, S. Impact of Microplastics on Pregnancy and Fetal Development: A Systematic Review. Cureus 2024, 16, e60712. [Google Scholar] [CrossRef] [PubMed]
- Liu, Z.; Huang, Y.; Jiao, Y.; Chen, Q.; Wu, D. Polystyrene nanoplastic induces ROS production and affects the MAPK-HIF-1/NF-κB-mediated antioxidant system in Daphnia pulex. Aquat. Toxicol. 2020, 220, 105420. [Google Scholar] [CrossRef] [PubMed]
- Roy, P.; Mohanty, A.K.; Misra, M. Microplastics in ecosystems: Their implications and mitigation pathways. Environ. Science. Adv. 2022, 1, 9–29. [Google Scholar] [CrossRef]
- Galloway, T.S.; Lewis, C.N. Marine microplastics spell big problems for future generations. Proc. Natl. Acad. Sci. USA 2016, 113, 2331–2333. [Google Scholar] [CrossRef]
- Pan, C.; Hong, R.; Wang, K.; Shi, Y.; Fan, Z.; Liu, T.; Chen, H. Chronic exposure to polystyrene microplastics triggers osteoporosis by breaking the balance of osteoblast and osteoclast differentiation. Toxicology 2025, 510, 154017. [Google Scholar] [CrossRef]

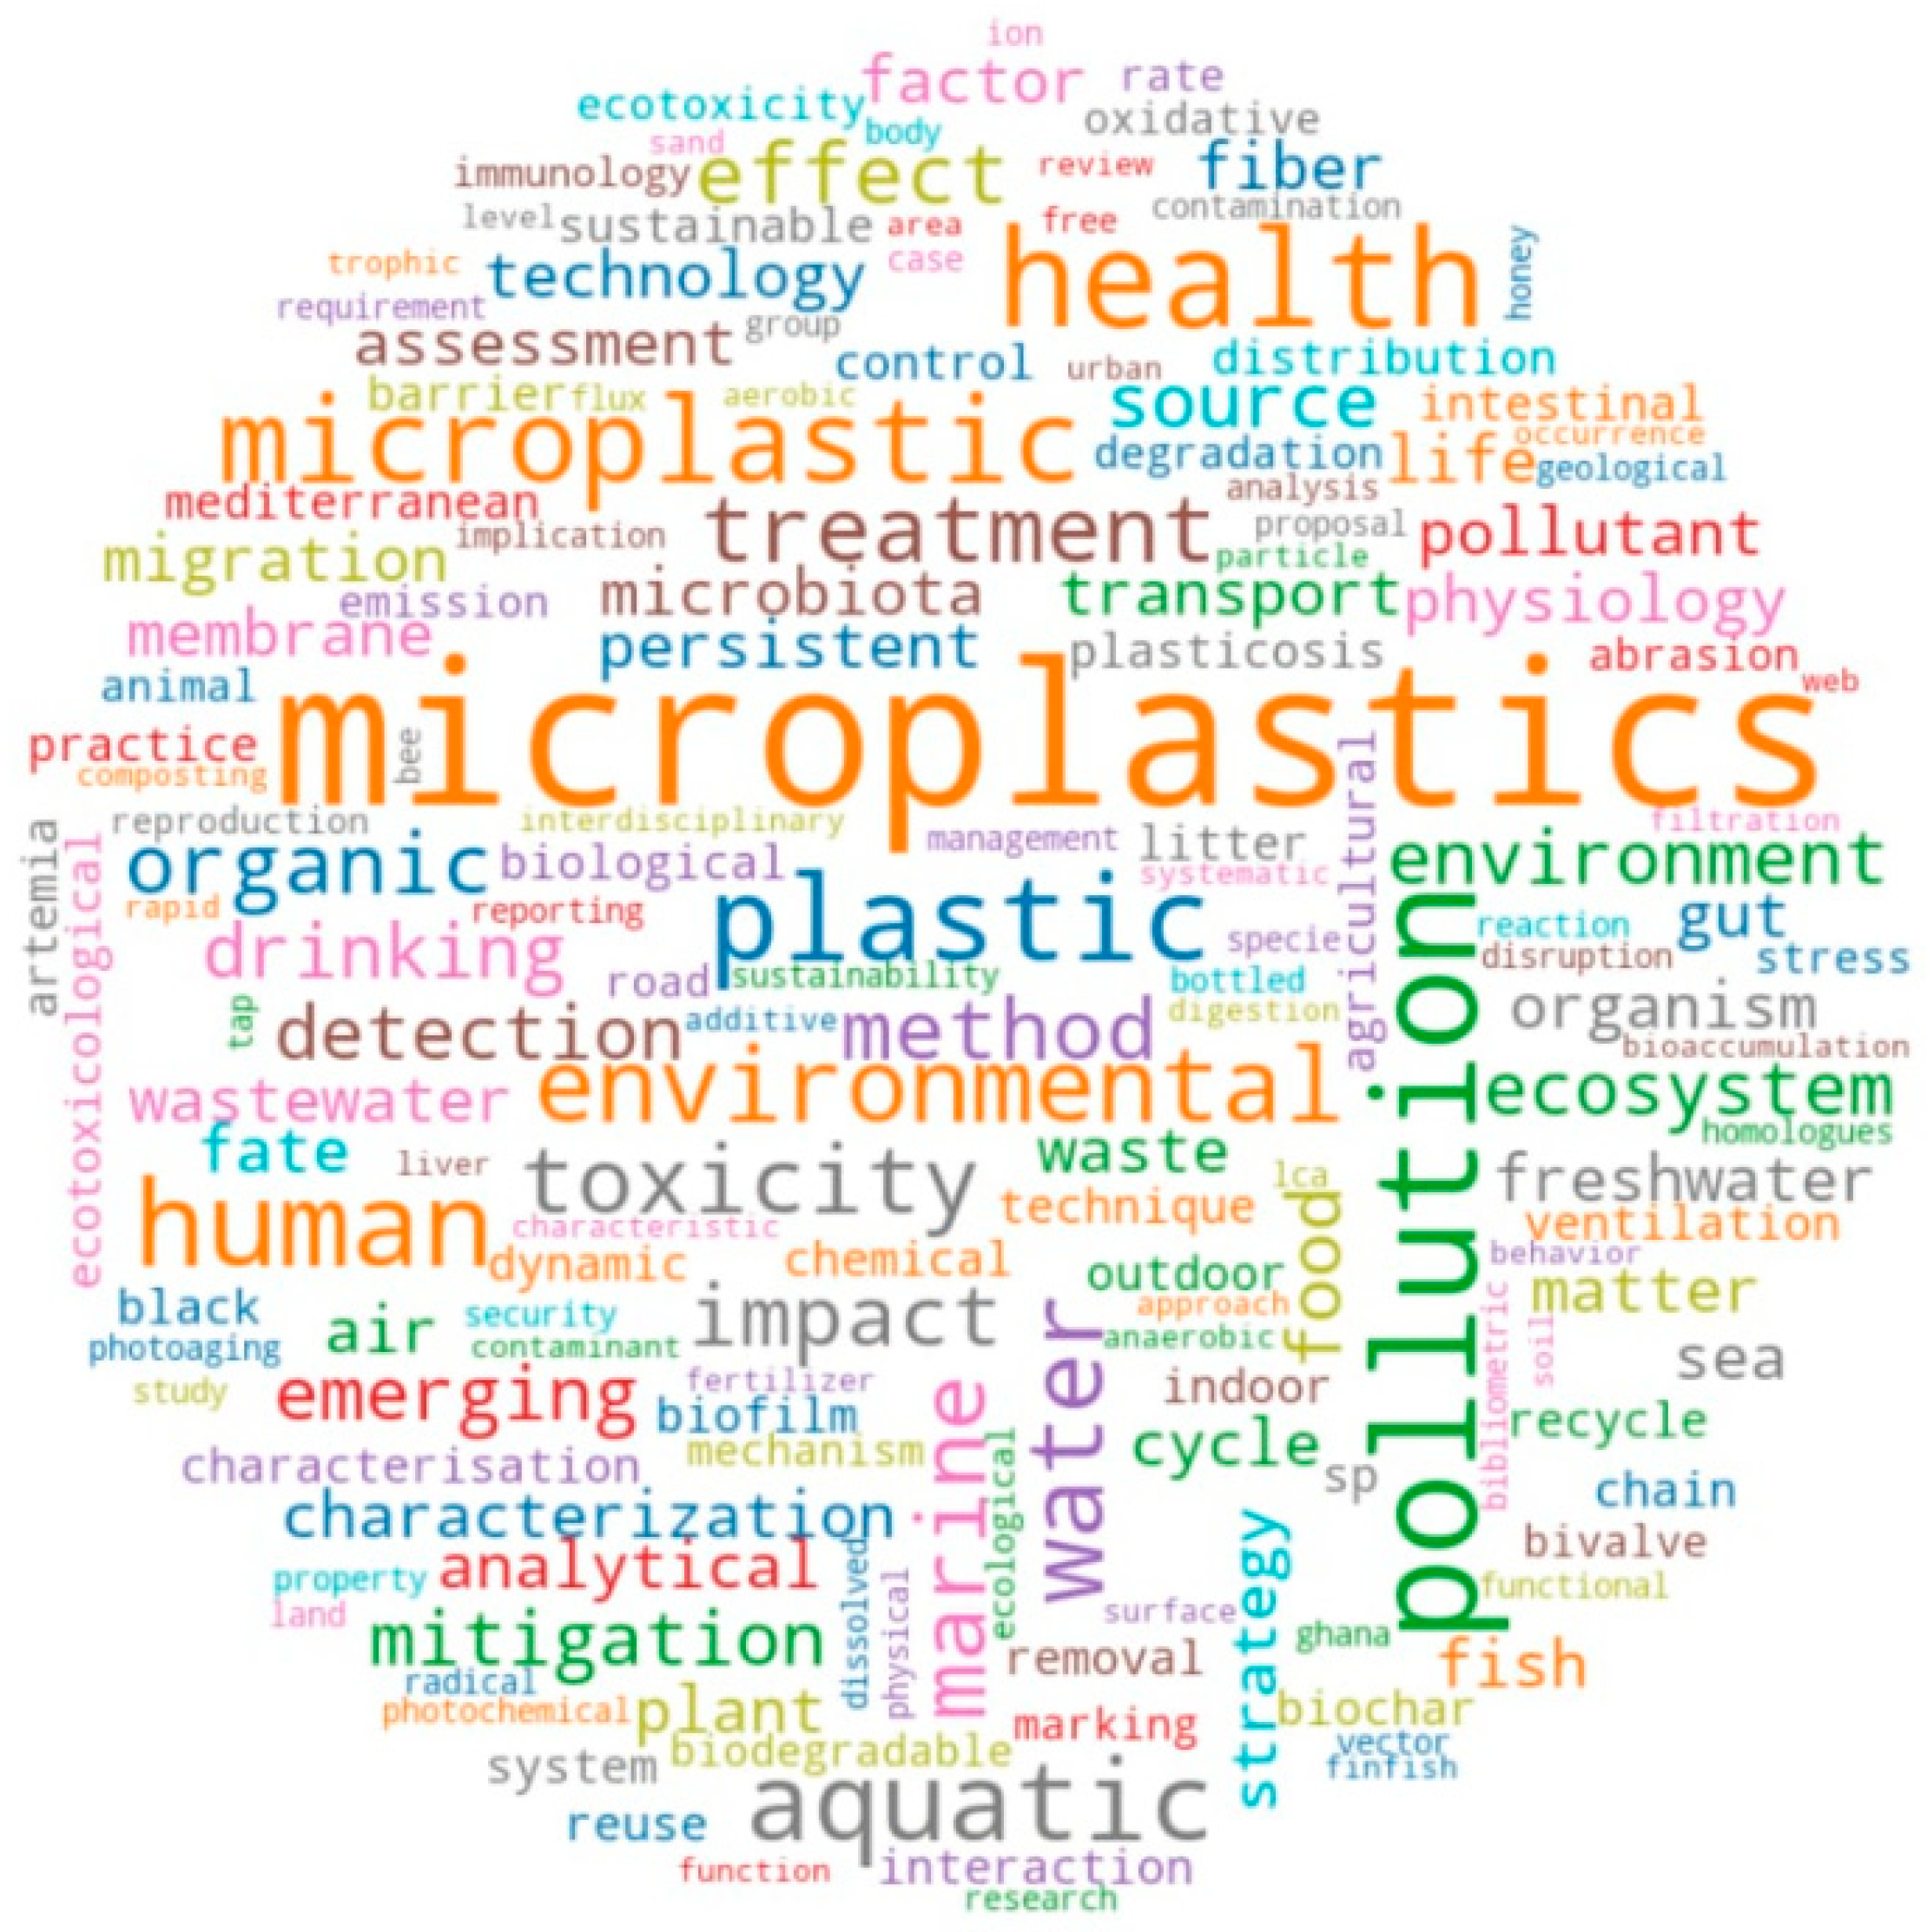
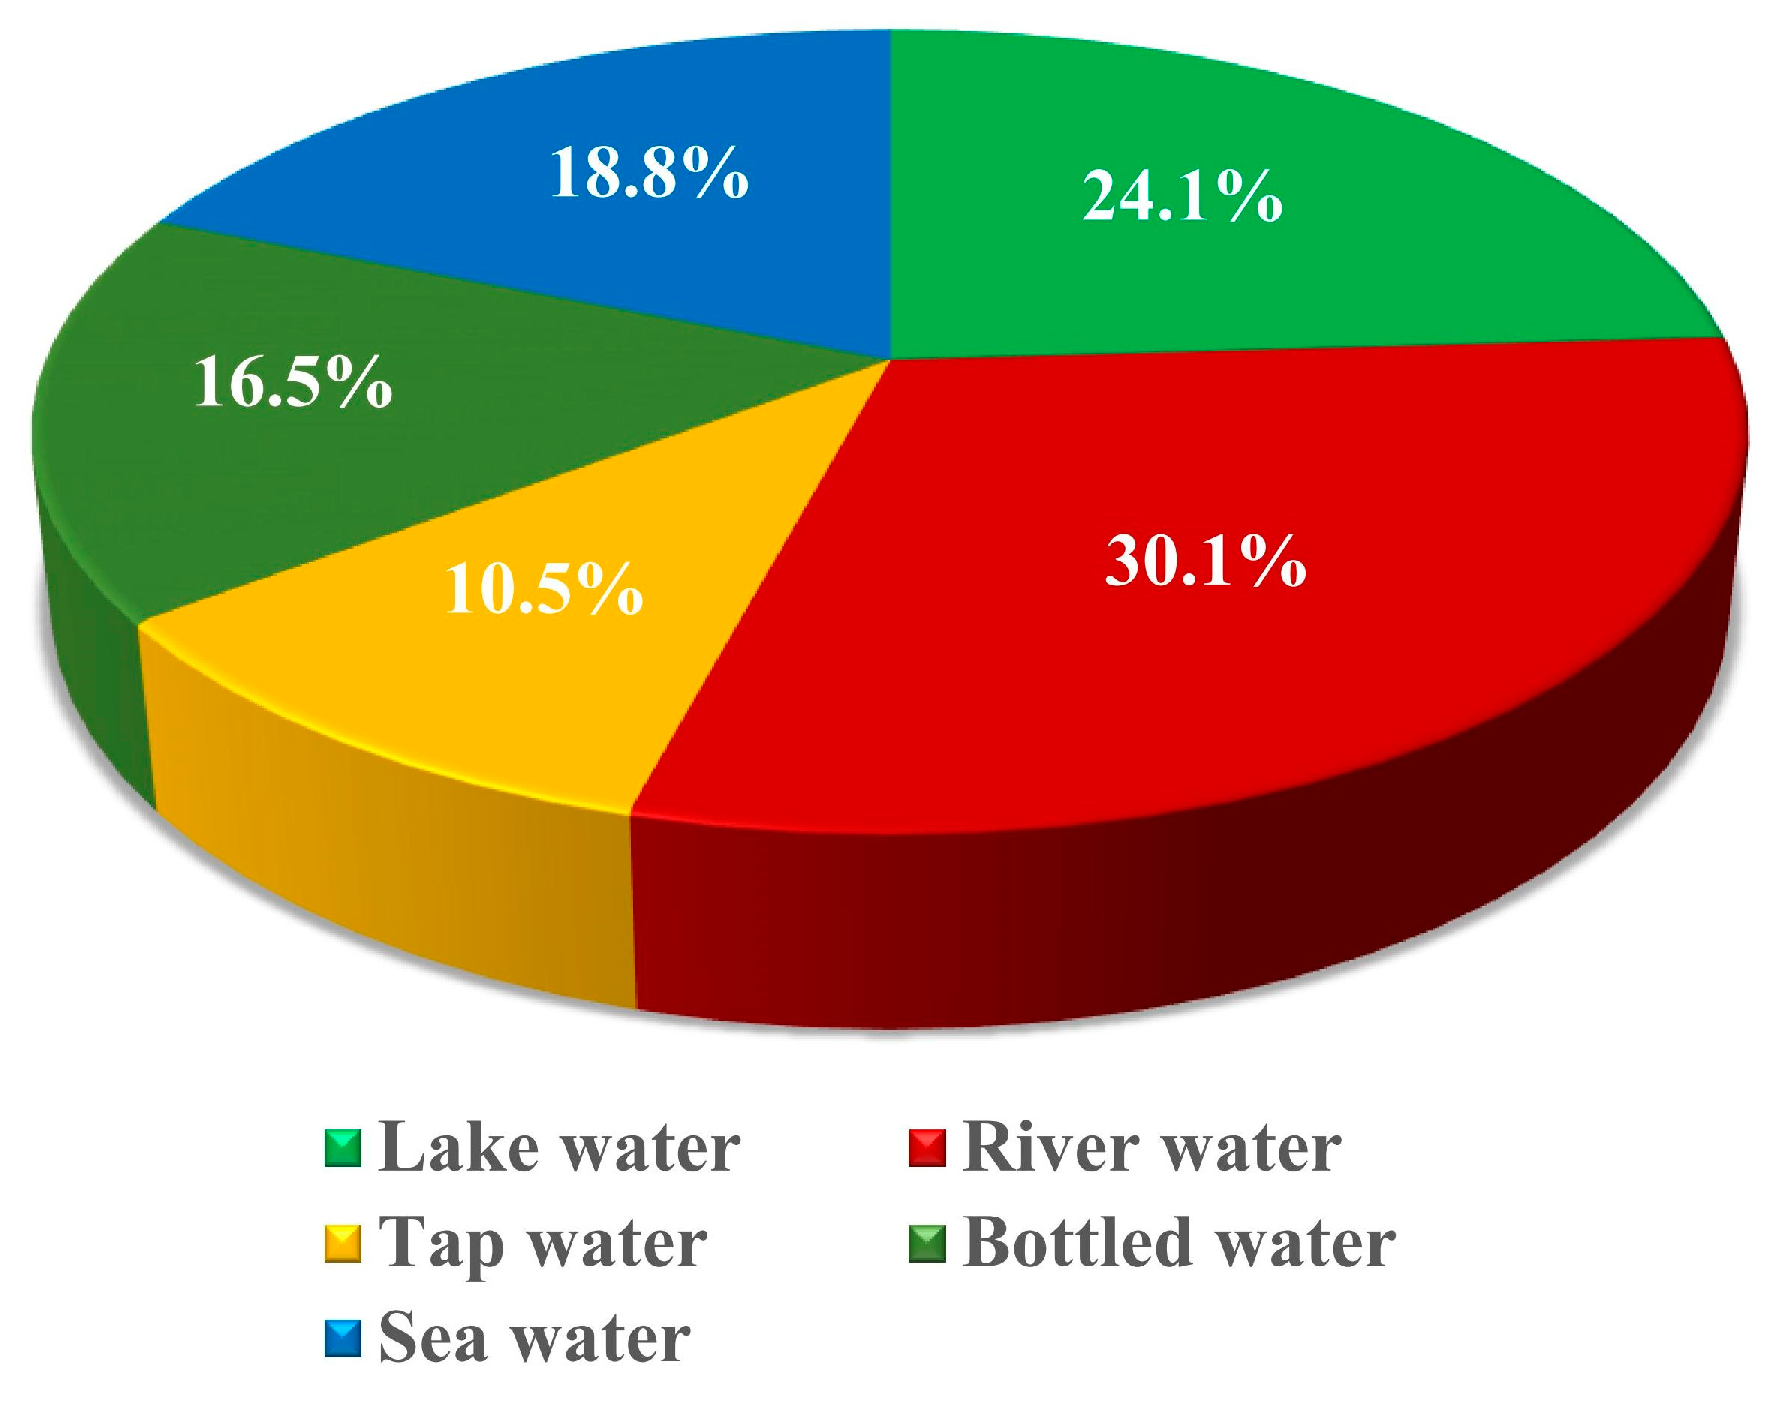
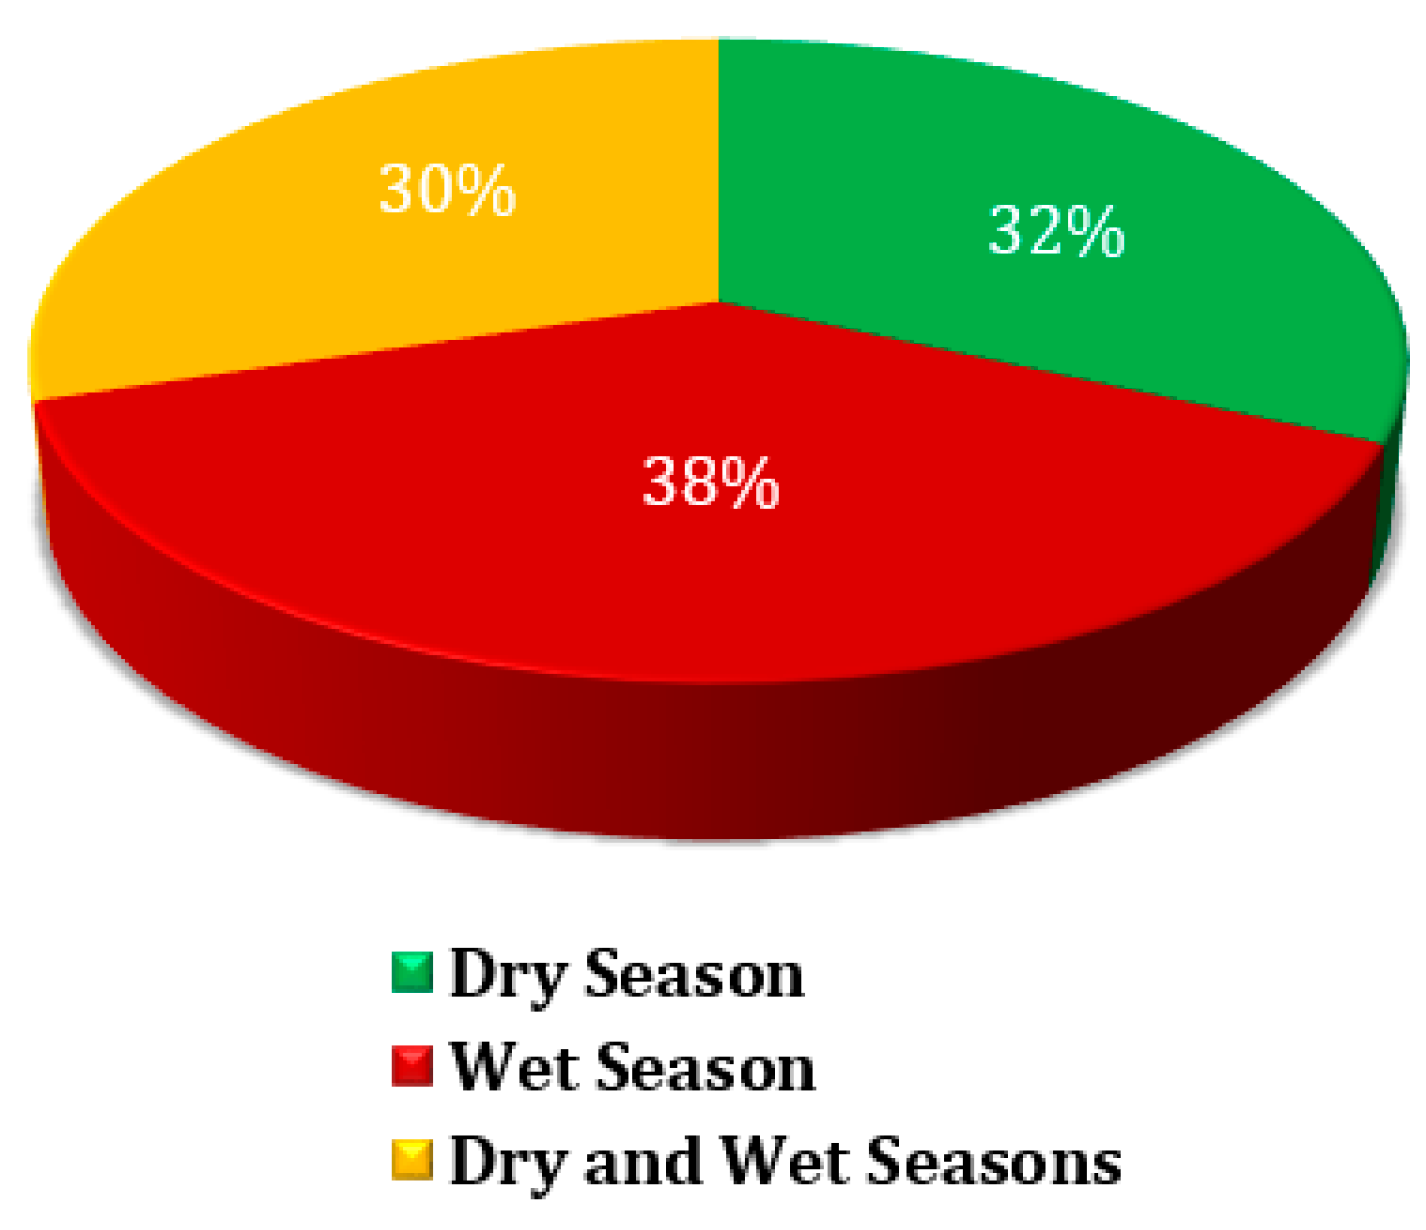


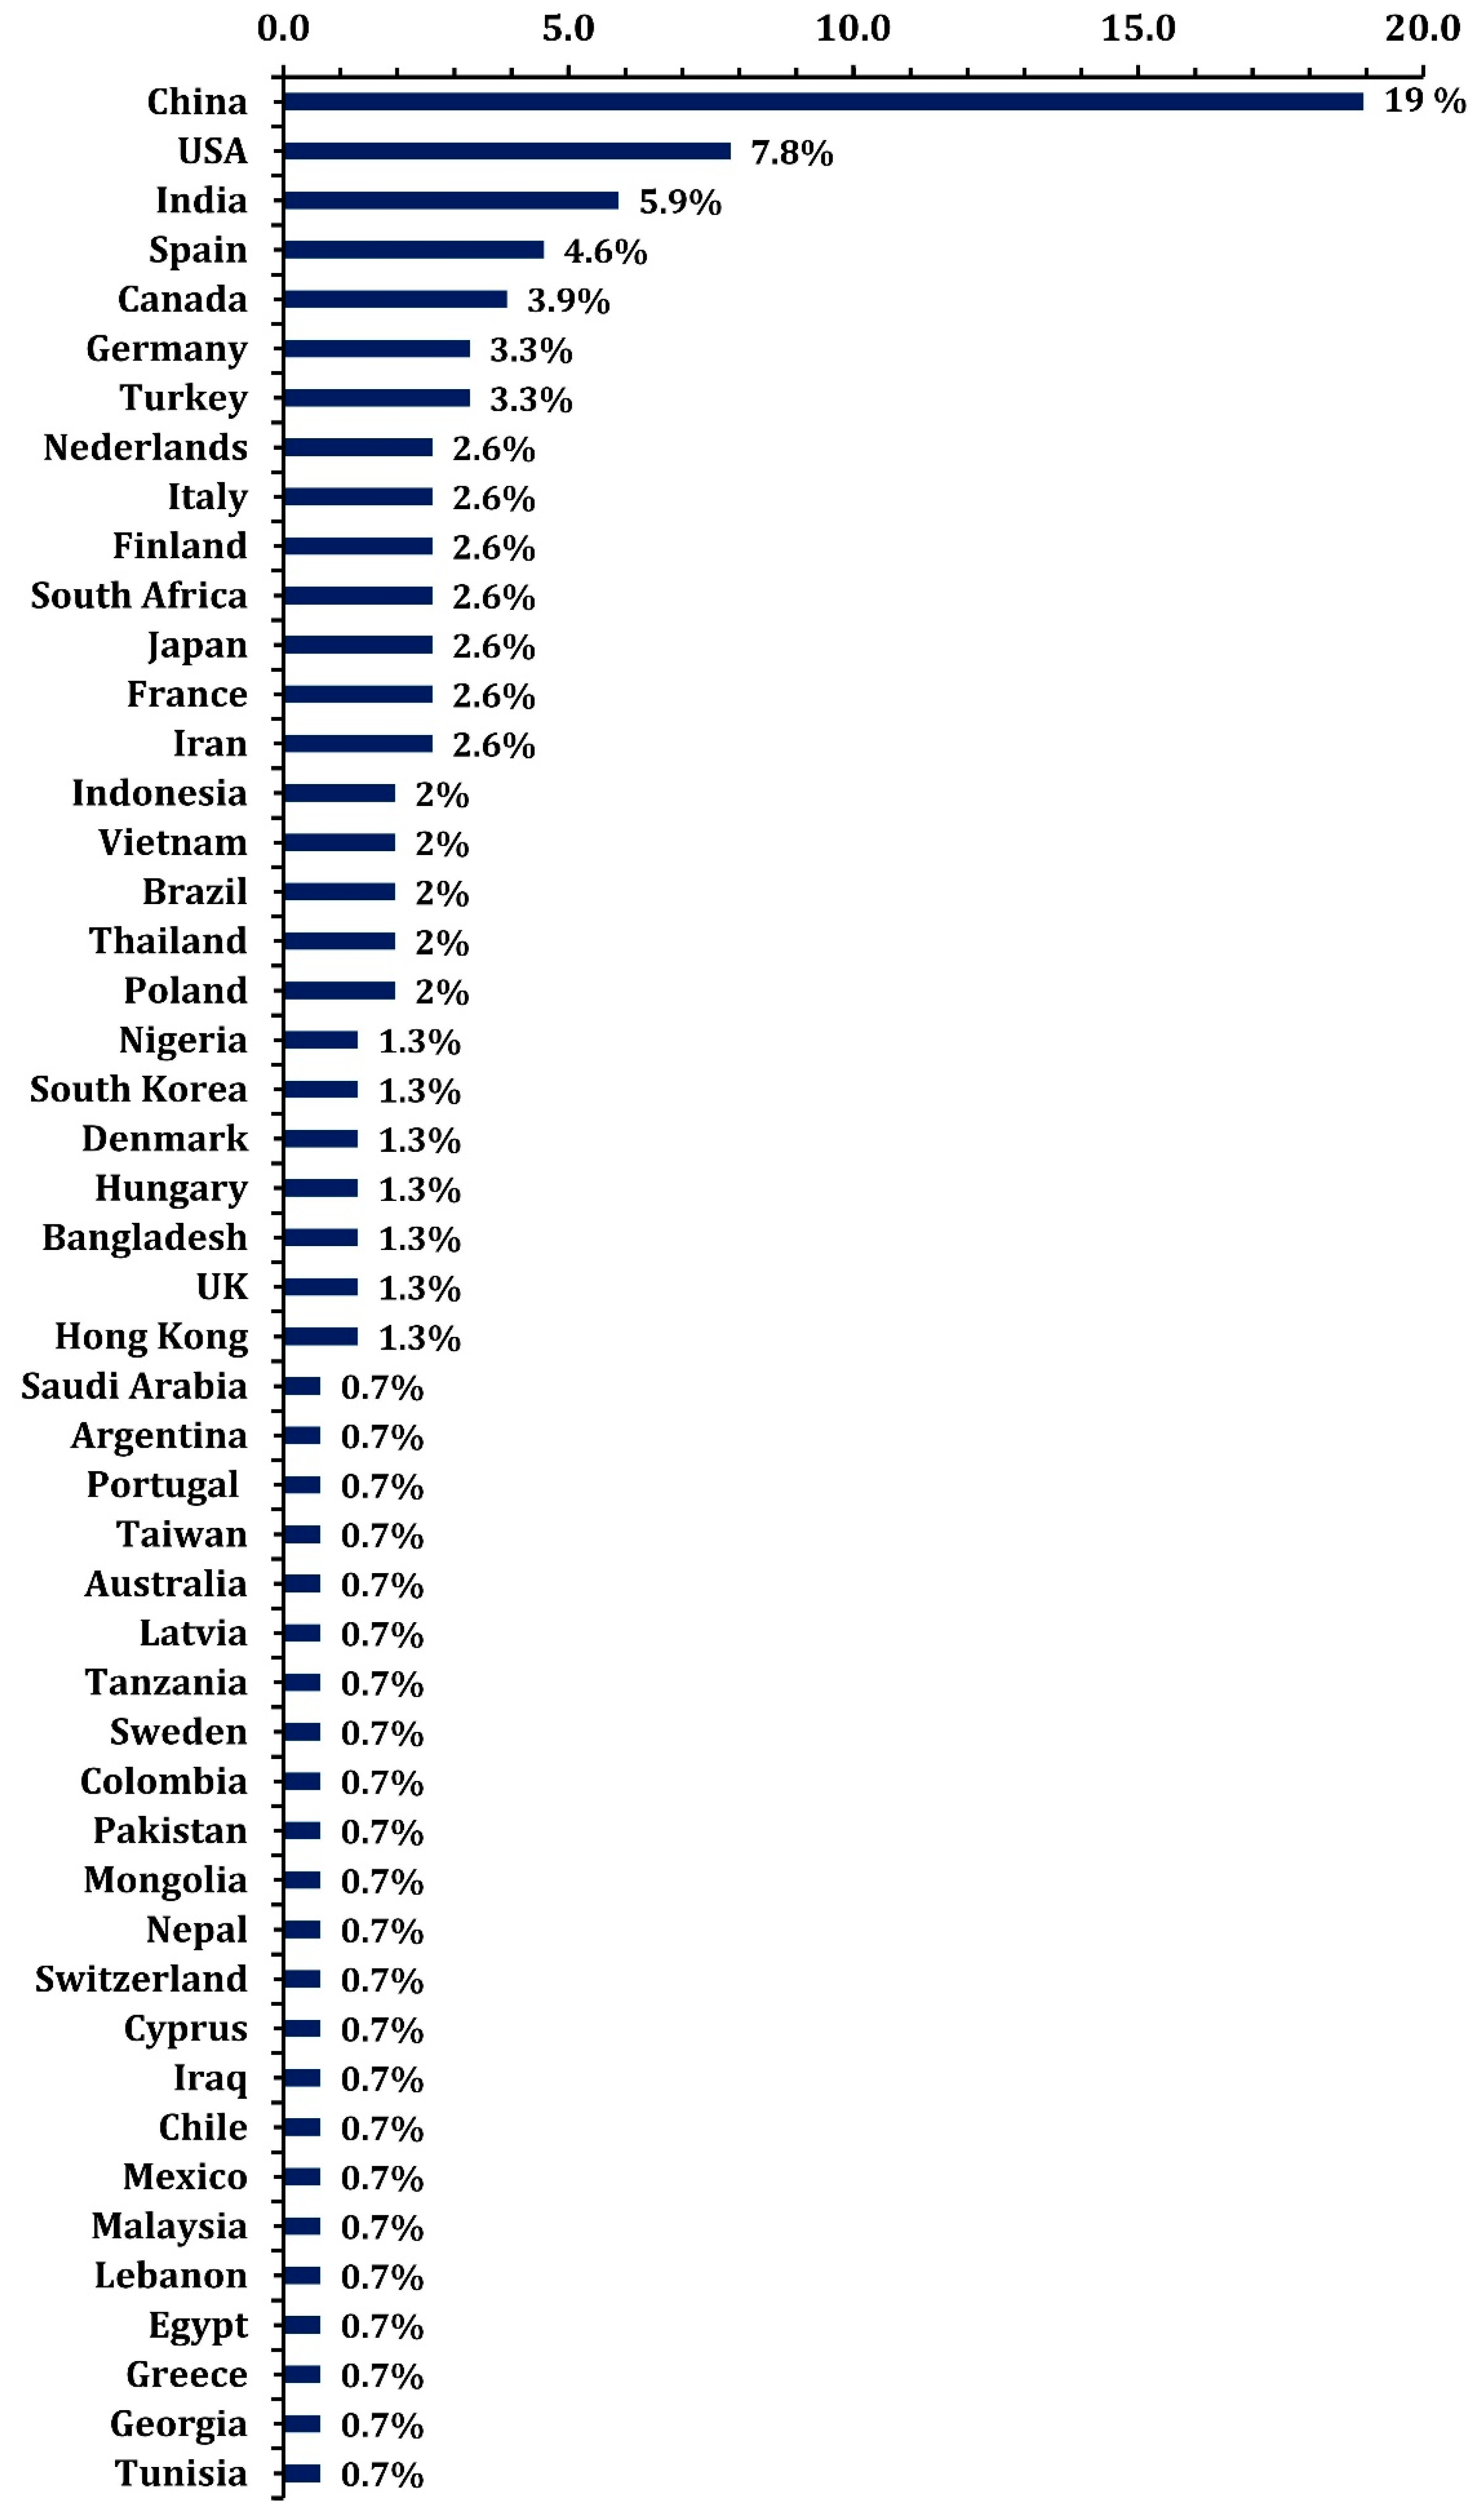
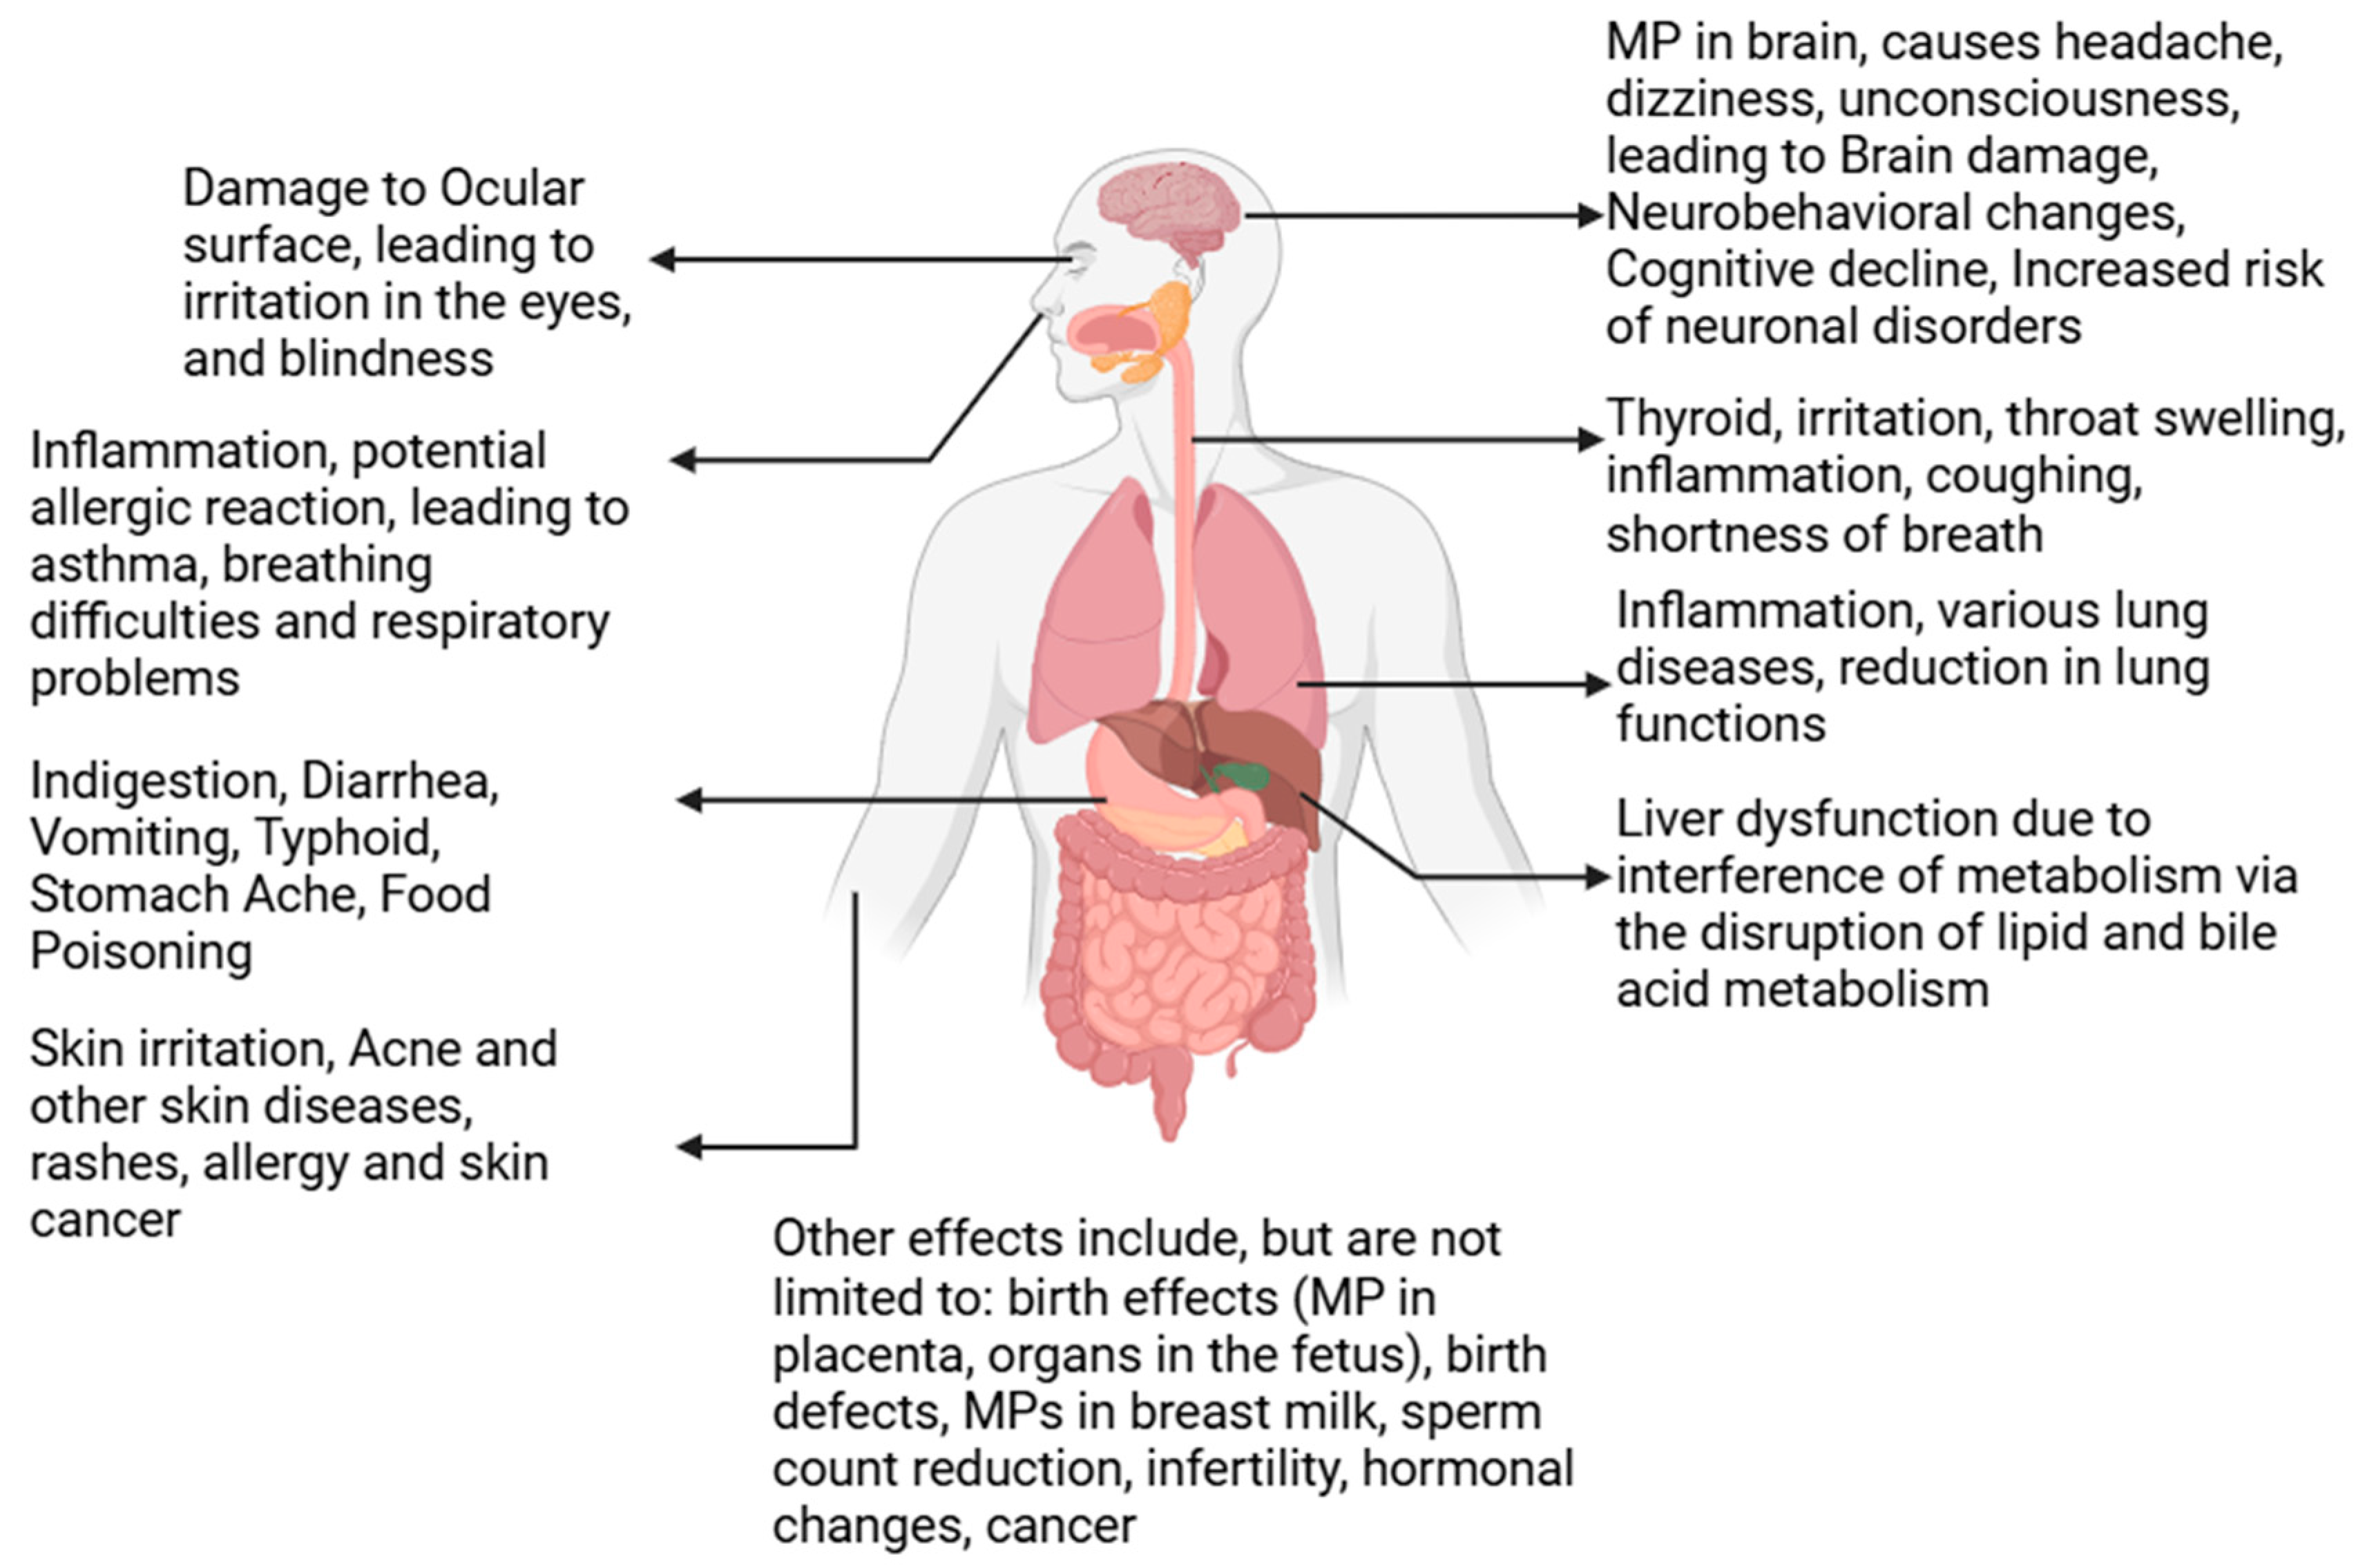
Disclaimer/Publisher’s Note: The statements, opinions and data contained in all publications are solely those of the individual author(s) and contributor(s) and not of MDPI and/or the editor(s). MDPI and/or the editor(s) disclaim responsibility for any injury to people or property resulting from any ideas, methods, instructions or products referred to in the content. |
© 2025 by the authors. Licensee MDPI, Basel, Switzerland. This article is an open access article distributed under the terms and conditions of the Creative Commons Attribution (CC BY) license (https://creativecommons.org/licenses/by/4.0/).