
Reduction in the Input of Microplastics into the Aquatic Environment via Wastewater Treatment Plants in Germany

 ,
,
Abstract
1. Introduction
1.1. State of Knownledge and Motivation
1.2. Challenges in MP Quantification
2. Materials and Methods
2.1. Reference Material
2.2. Operation Procedure
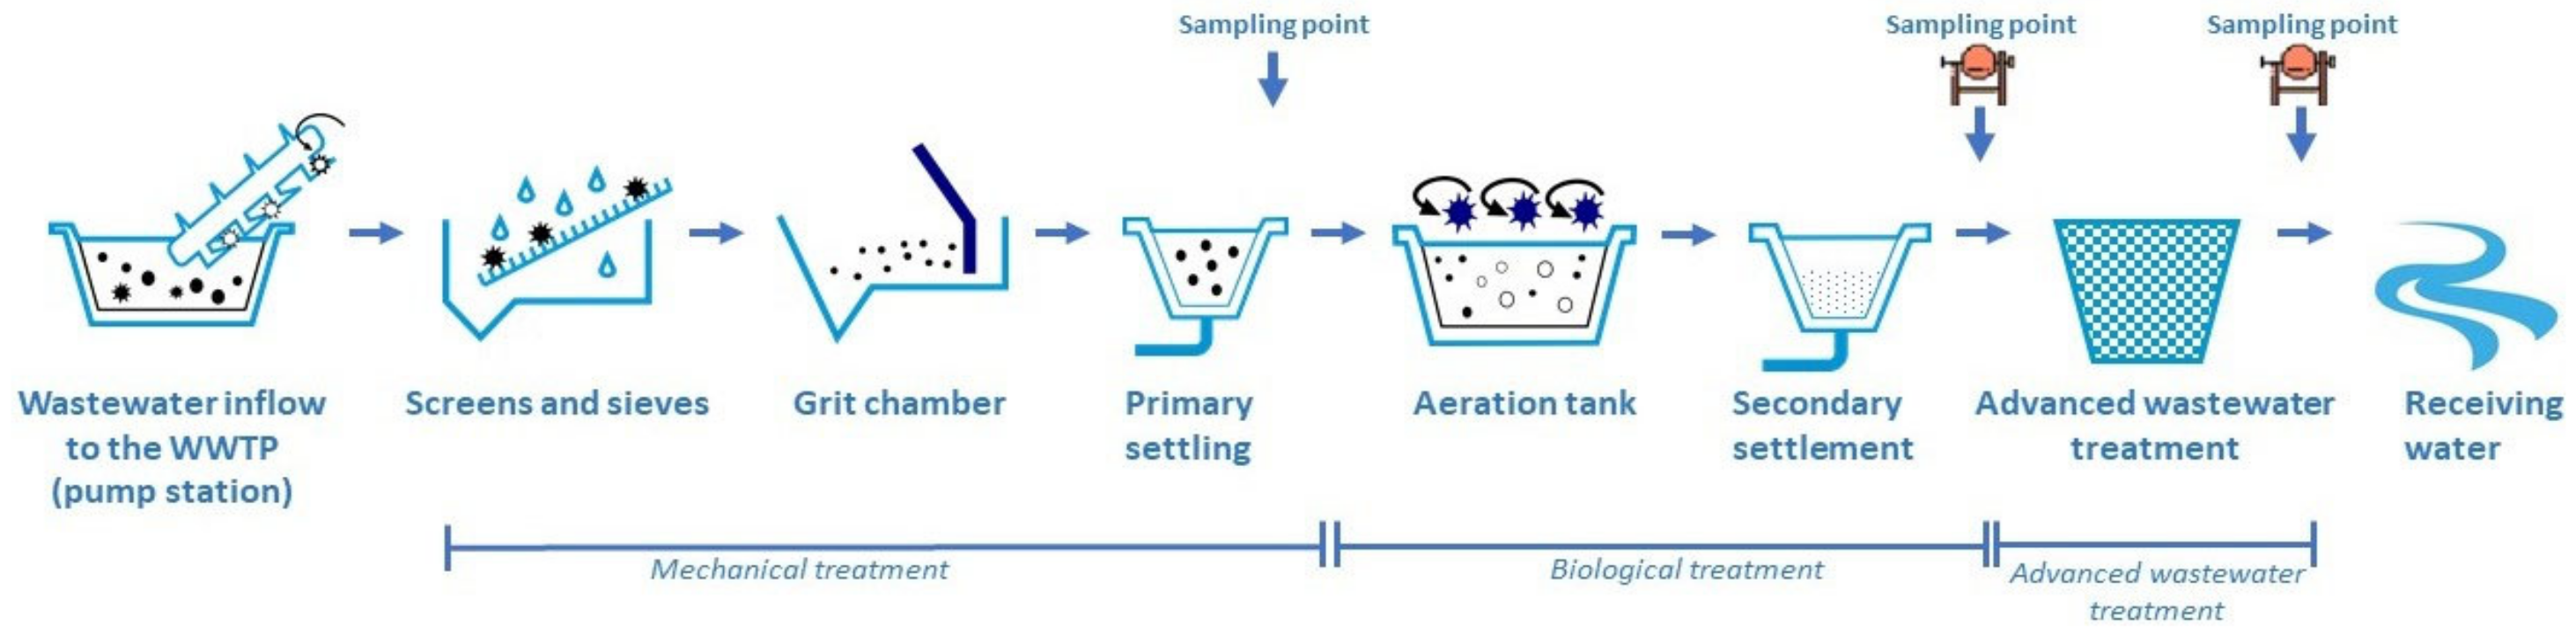
2.3. Investigated WWTPs
2.4. Sampling
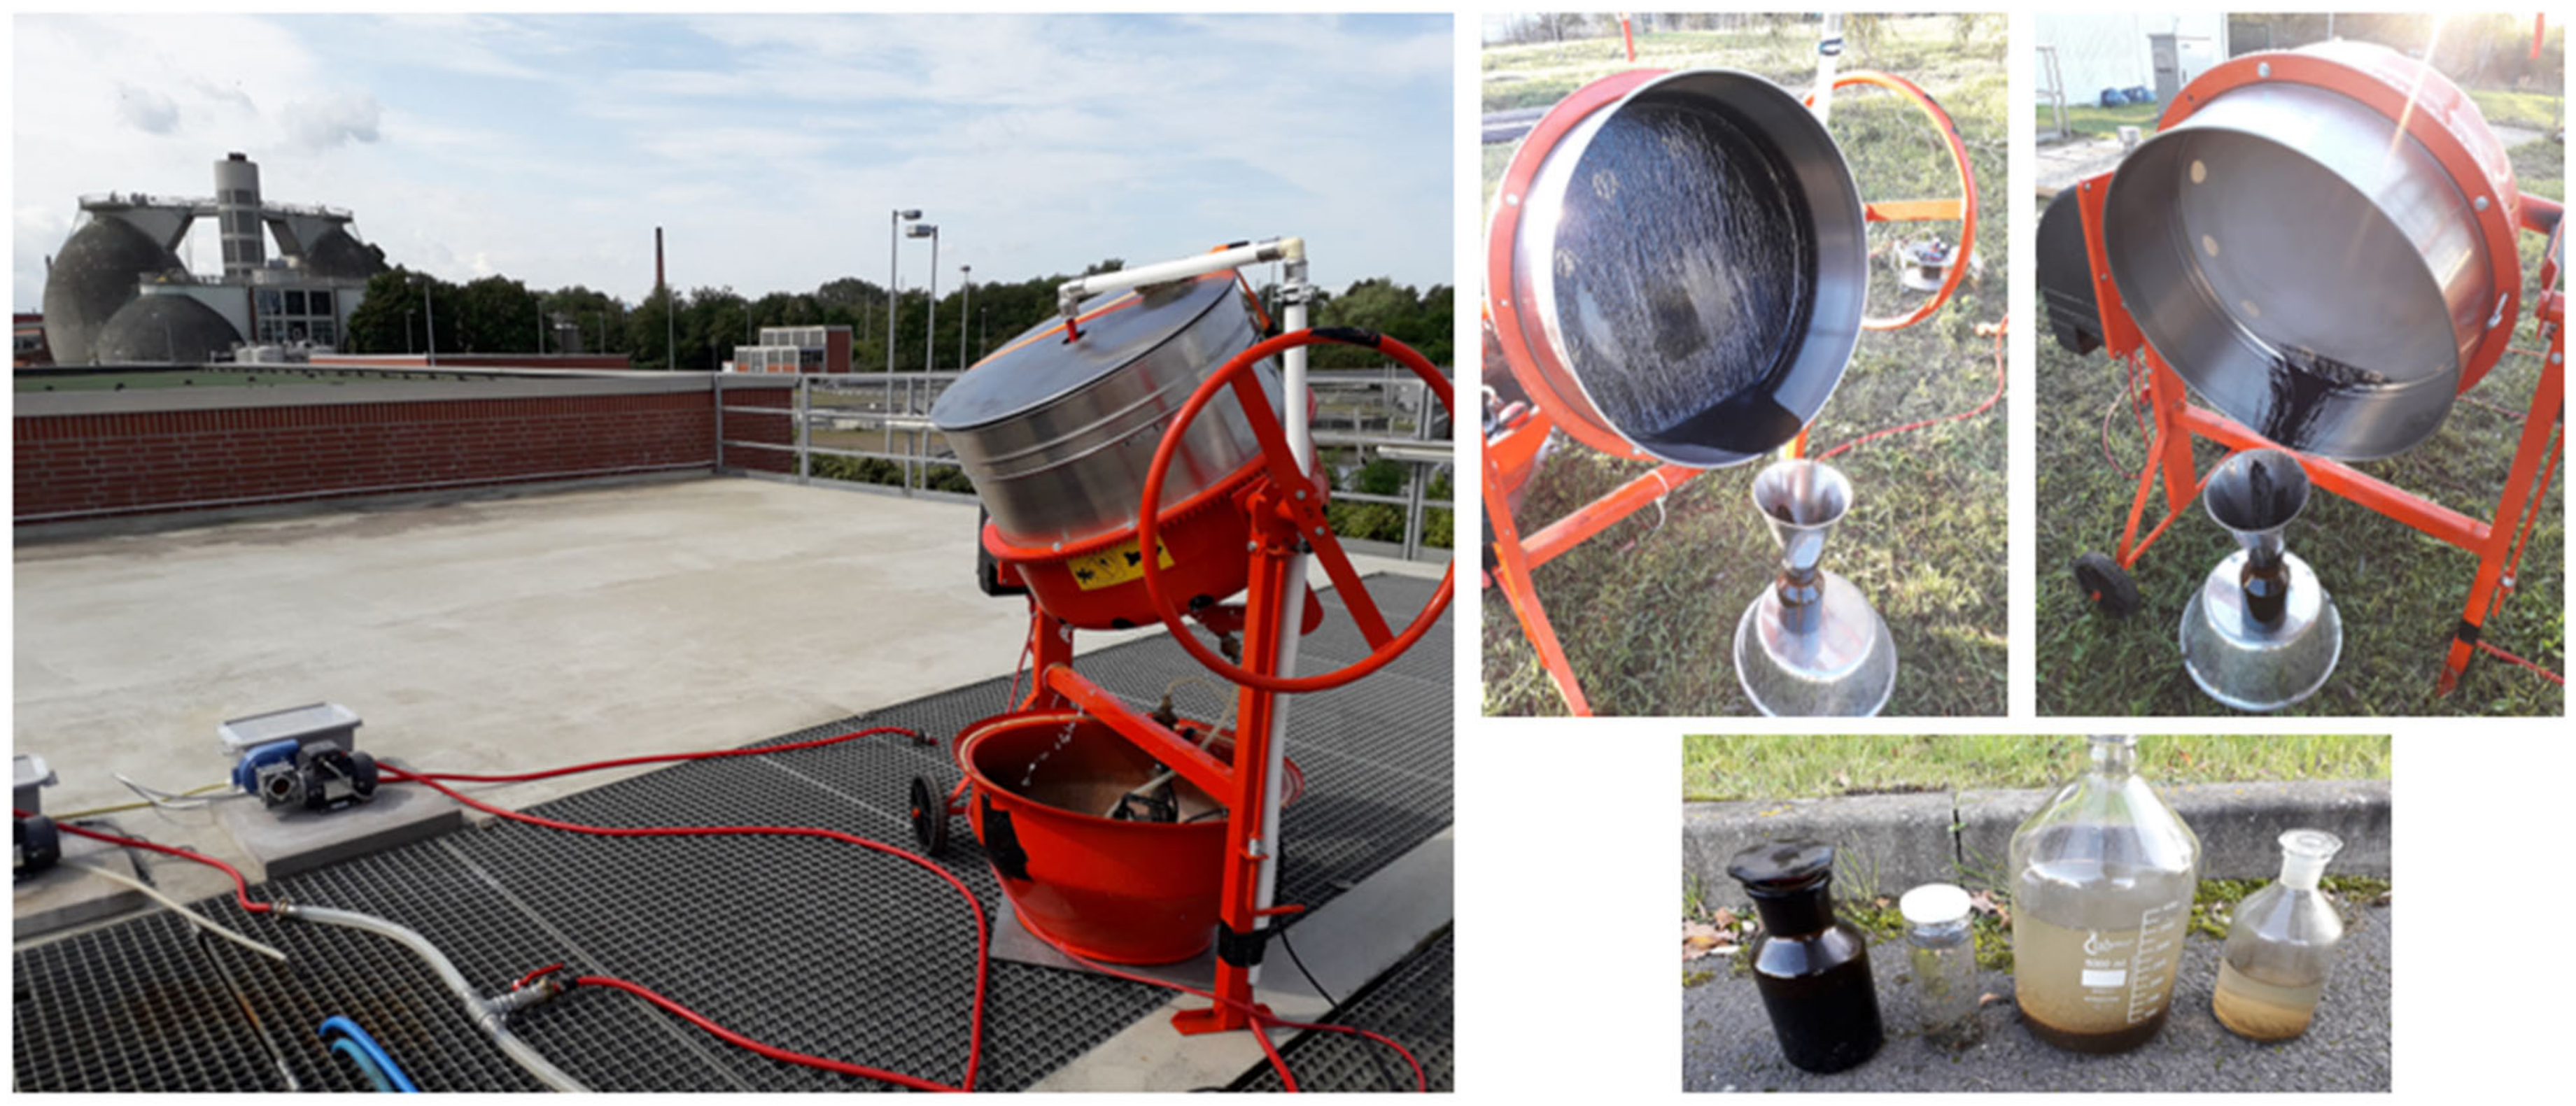
2.5. Sampling Preparation in the Field
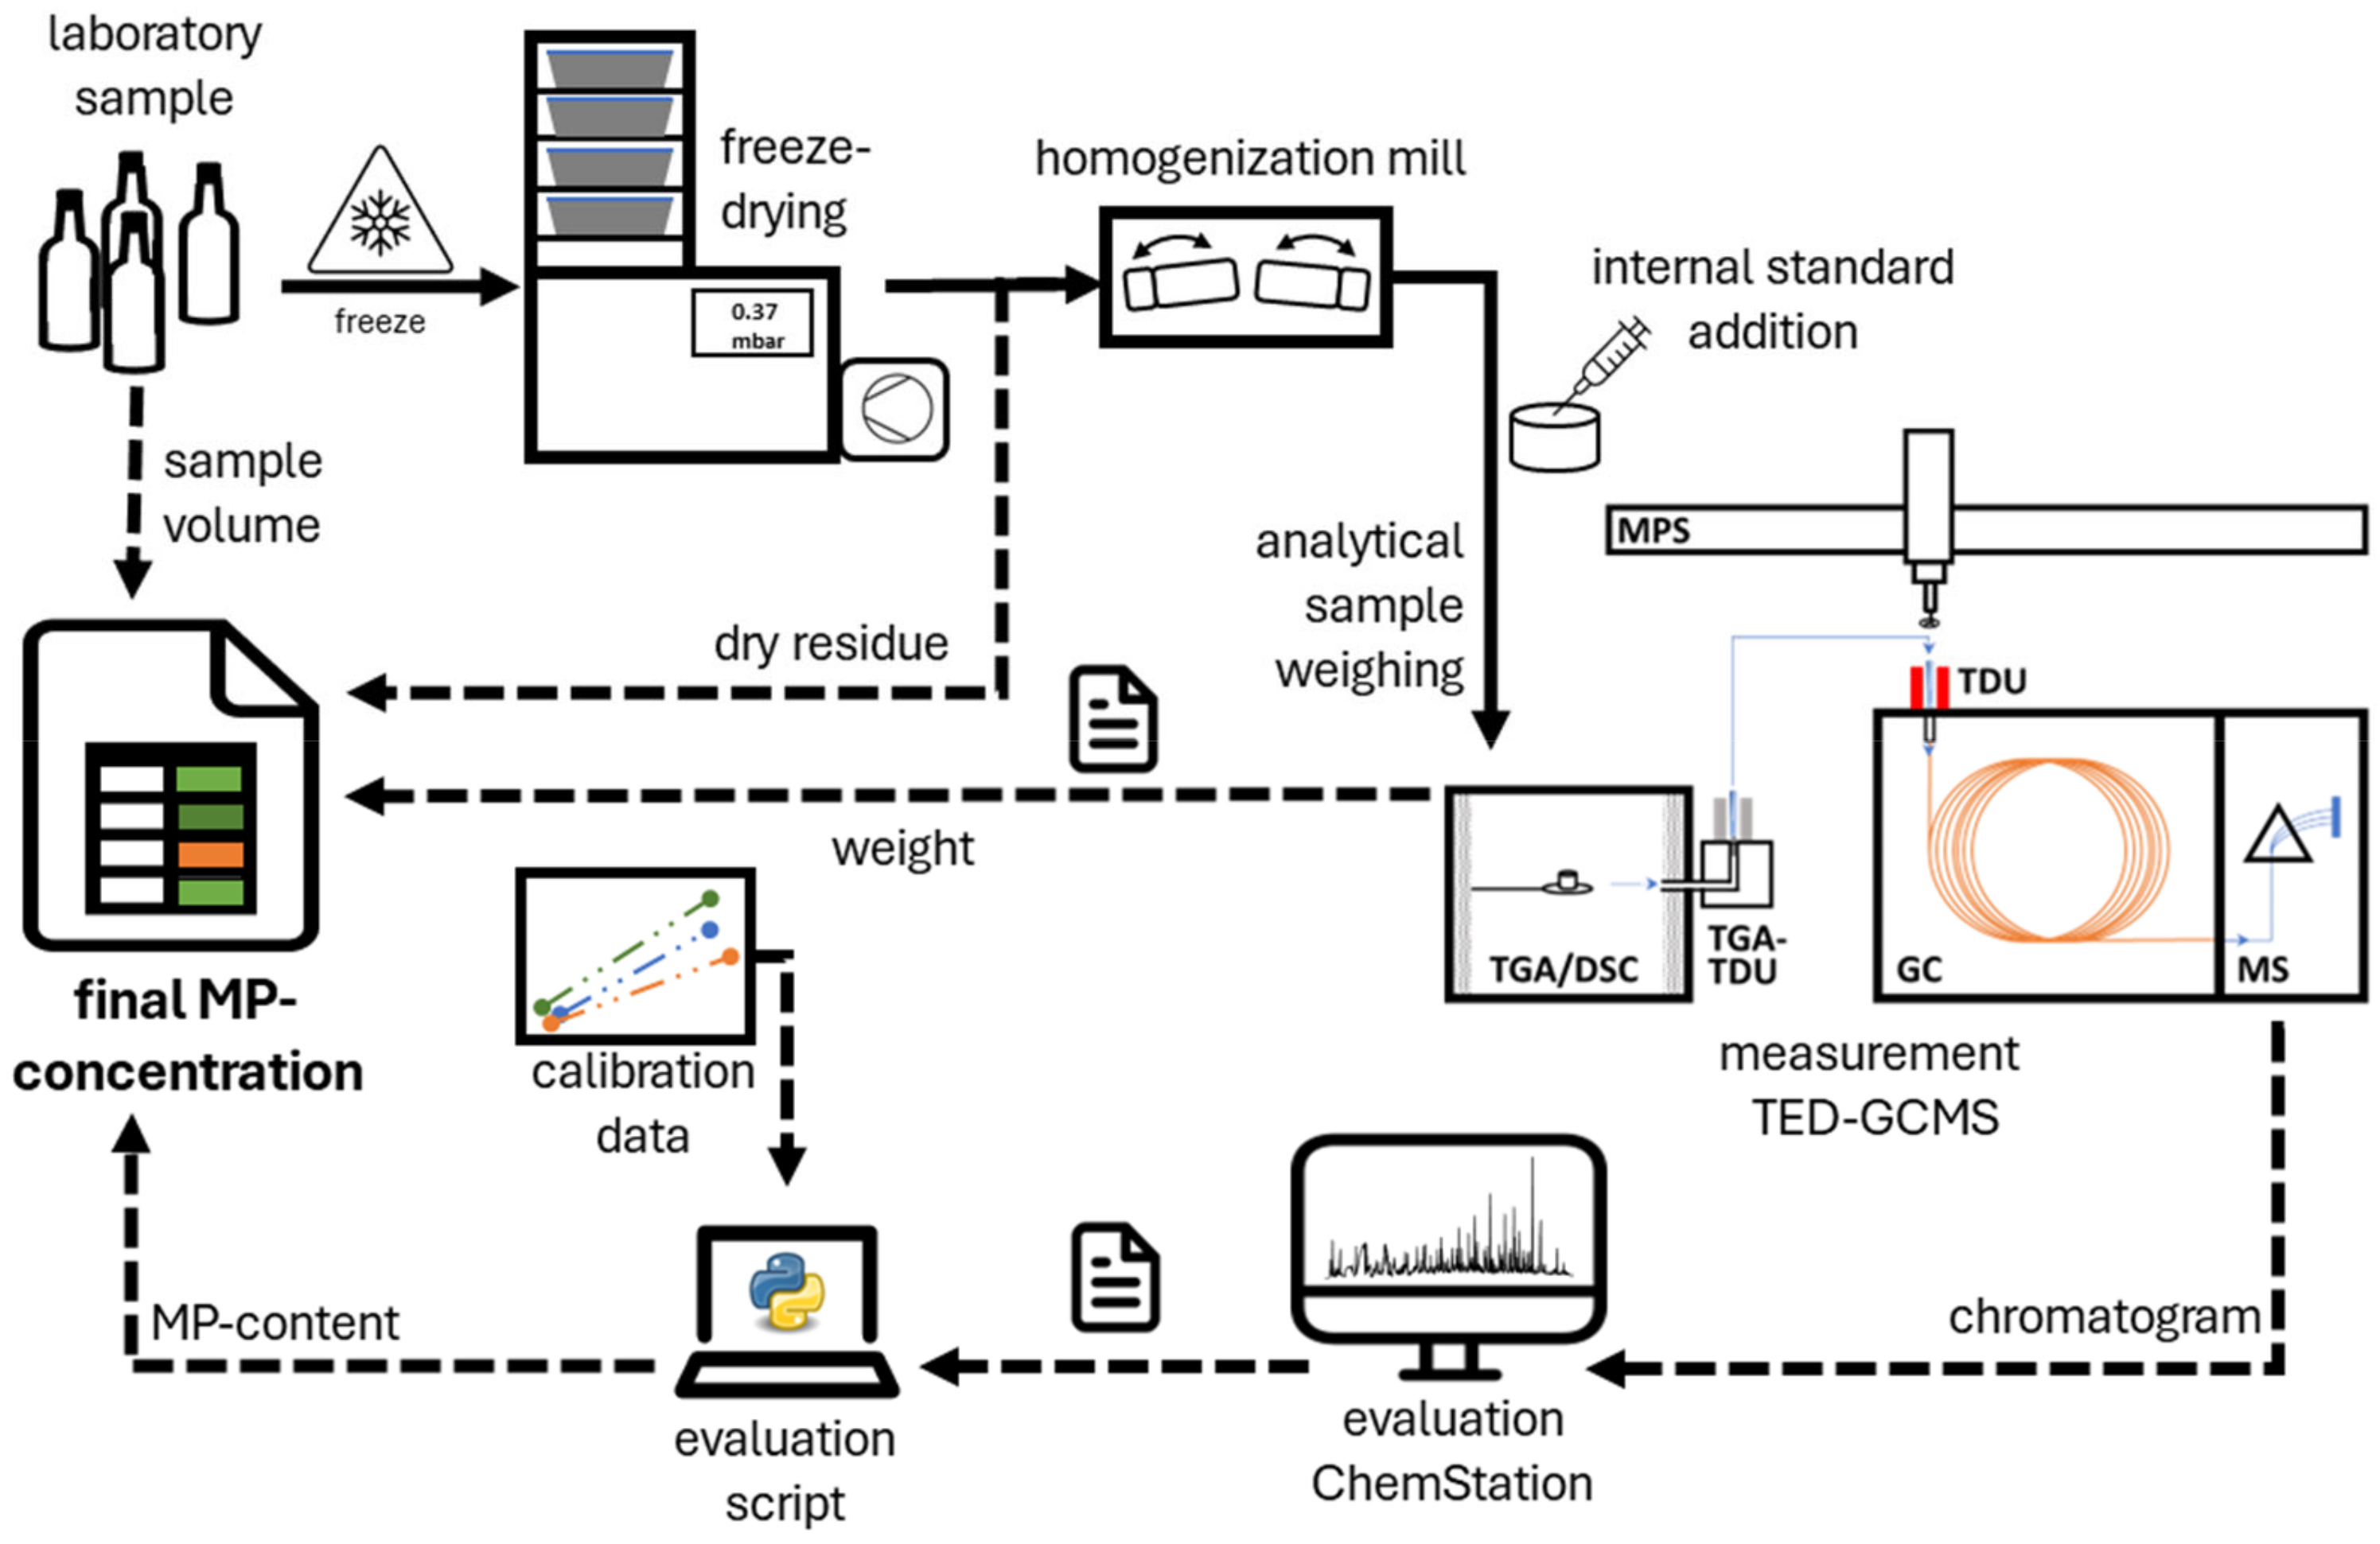
2.6. Sample Preparation in Lab
2.7. Detection
2.8. Evaluation
2.9. Calibration
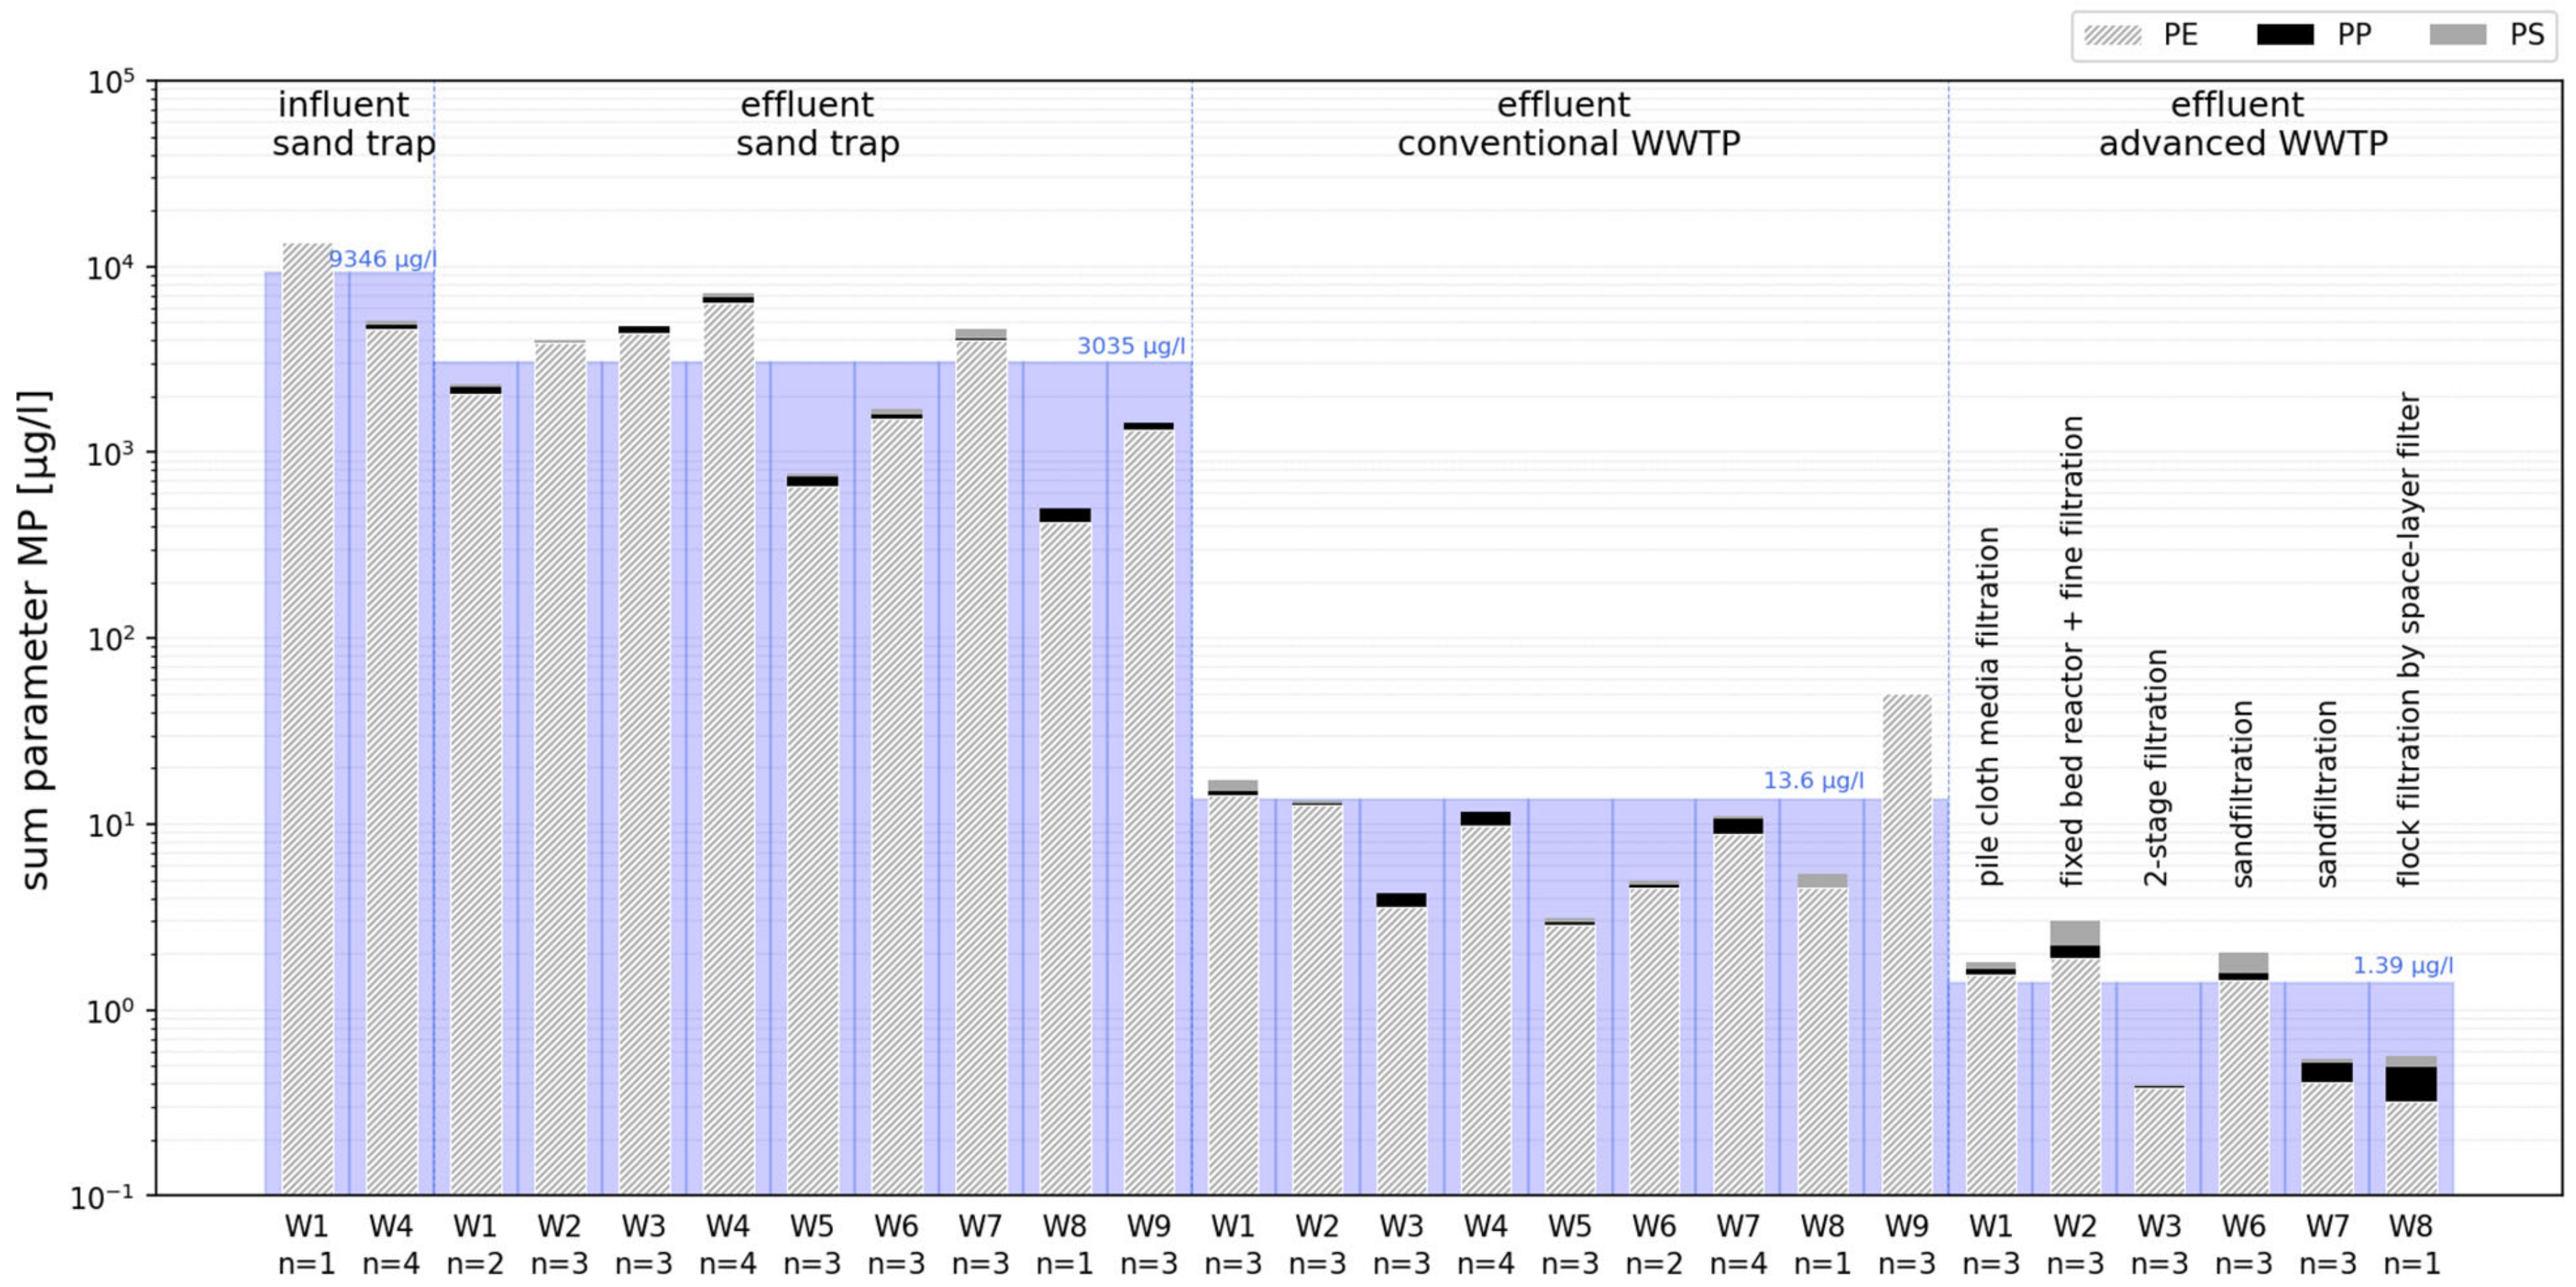
3. Results
4. Discussion
4.1. Mass Concentration
4.2. Camparison to Particle Size
4.3. Distribution of Plastic Types
4.4. Evaluation of the Measurement Technology
4.5. Recommendations for Action and Regulation
5. Conclusions
Author Contributions
Funding
Institutional Review Board Statement
Informed Consent Statement
Data Availability Statement
Conflicts of Interest
Appendix A

| Polymer | Polymer Marker Abbr. | Substance | LoD | LoQ | Retention Time (min) | Quantifier (m/z) | Qualifier (m/z) |
|---|---|---|---|---|---|---|---|
| PE | PE1_55 | 1,11-dodecadiene | 2.5 | 6.8 | 16 | 55 | 55, 95, 109 |
| PE2_55 | 1,12-tridecadiene | 2.1 | 5.9 | 19 | 55 | 55, 67, 95 | |
| PE3_55 | 1,13-tetradecadiene | 1.4 | 3.9 | 21 | 55 | 55, 95, 109 | |
| PE4_55 | 1,14-pentadecadiene | 2.7 | 8.1 | 24 | 55 | 55, 95, 109 | |
| PE5_55 | 1,15-hexadecadiene | 0.1 | 0.2 | 26 | 55 | 55, 96, 110 | |
| PE1_81 | 1,11-dodecadiene | 2.0 | 5.5 | 16 | 81 | 81, 95, 109 | |
| PE2_82 | 1,12-tridecadiene | 0.4 | 1.3 | 19 | 81 | 81, 67, 95 | |
| PE3_82 | 1,13-tetradecadiene | 2.4 | 7.1 | 21 | 81 | 81, 95, 109 | |
| PE4_82 | 1,14-pentadecadiene | 1.8 | 5.2 | 24 | 81 | 81, 95, 109 | |
| PE5_82 | 1,15-hexadecadiene | 1.4 | 4.3 | 26 | 81 | 81, 96, 110 | |
| PMMA | PMMA1 | methyl-methacrylate | 0.6 | 1.7 | 4 | 100 | 69, 41, 39 |
| PP | PP1 | 2,4-dimethylhept-1-ene | 1.7 | 5.2 | 6 | 70 | 126, 83, 210 |
| PP2 | 2,4,6-trimethylnon-1-ene | 6.3 | 15.9 | 13 | 111 | 69, 125, 210 | |
| PP3 | 2,4,6-trimethylnon-1-ene | 3.5 | 9.6 | 13 | 111 | 69, 125, 210 | |
| PP4 | 2,4,6,8-tetramethylundec-1-ene | 1.3 | 3.3 | 19.7 | 111 | 69, 125, 210 | |
| PP5 | 2,4,6,8-tetramethylundec-1-ene | 0.8 | 3.4 | 19.8 | 111 | 69, 125, 210 | |
| PP6 | 2,4,6,8-tetramethylundec-1-ene | 2.2 | 6.2 | 20.1 | 111 | 69, 125, 210 | |
| PS | PS1 | styrene | 0.9 | 5.6 | 8 | 104 | 78, 51 |
| PS2 | 2,4-diphenyl-1-butene | 1.5 | 4.1 | 30 | 91 | 104, 208 | |
| PS3 | 2,4,6-triphenyl-1-hexene | 3.2 | 7.3 | 43 | 91 | 117, 207 | |
| PET | PET1 | methylbenzoate | 6.7 | 18.4 | 13 | 105 | 77, 136, 51 |
| PET2 | vinylbenzoate | 6.2 | 18.0 | 15 | 105 | 77, 51 | |
| PET3 | ethylbenzoate | 5.2 | 15.3 | 16 | 105 | 77, 122, 150 | |
| PET4 | benzoic acid | 8.5 | 25.4 | 18 | 105 | 122, 77, 51 | |
| PET5 | diethyl terephthalate | 5.2 | 15.3 | 27 | 177 | 149, 105, 121 | |
| PET6 | divinyl terephthalate | 8.5 | 25.4 | 26 | 175 | 104, 76 | |
| PA | PA1 | ε-caprolactam | 2.3 | 6.6 | 19 | 113 | 30, 84, 55 |
| SBR | SBR1 | 4-phenylcyclohexene | 1.4 | 3.7 | 20 | 158 | 104, 78, 117 |
Appendix B
| TGA | |
|---|---|
| Model | METTLER TOLEDO |
| Weigh-in weight (sample) | 10 mg |
| Weighed sample (pure substances) | 2–200 µg |
| Method gas flow | 30 mL min |
| Shielding gas | 20 mL min |
| Total gas flow | 50 mL min |
| Heating rate | 10.5 °C |
| Heating range | 25–600 °C |
| Thermal desorption | |
| Parameter | Wert |
| Model | GERSTEL TDU 2 |
| Mode | splitless |
| Gas flow | 34 mL/min He |
| Transfer temperature | 280 °C |
| Heating rate | 40–200 °C |
| Cryotrapping and injection | |
| Type | GERSTEL CIS4 |
| Operating mode | Solvent Vent |
| Split mode | Low split, 1:3 |
| Heating range | −100–270 °C |
| Heat rate | 12 °C/s |
| Gas chromatography | |
| Model type | Agilent 7890B GC System |
| Column | Agilent HP-5MS |
| Pressure range | 6.3 psi |
| Gas Flow | 1 mL/min He |
| Heating range | 30–300 °C |
| Heating rate | 5 °C/min |
| Mass spectrometry | |
| Model name | Agilent 5977B GC/MSD |
| Interface Temperature | 325 °C |
| Ion source temperature | 230 °C |
| Quadrupole temperature | 150 °C |
| Ionisation Mode | EI, 70 eV |
| Mode | Scan, 35–350 m/z |
References
- Elsner, P. DOMININGHAUS-Kunststoffe: Eigenschaften und Anwendungen, 8th ed.; Springer: Dordrecht, The Netherlands, 2011; Available online: http://gbv.eblib.com/patron/FullRecord.aspx?p=968733 (accessed on 20 March 2024).
- Hale, R.C.; Seeley, M.E.; La Guardia, M.J.; Mai, L.; Zeng, E.Y. A Global Perspective on Microplastics. JGR Ocean. 2020, 125, e2018JC014719. [Google Scholar] [CrossRef]
- ISO/TR 21960:2020 (en); Plastics-Environmental Aspects-State of Knowledge and Methodologies. Technical Report. ICS: 13.020.01 83.080.01. International Organization for Standardization (PUBL): Geneva, Switzerland, 2020.
- Abbasi, S.; Keshavarzi, B.; Moore, F.; Turner, A.; Kelly, F.J.; Dominguez, A.O.; Jaafarzadeh, N. Distribution and potential health impacts of microplastics and microrubbers in air and street dusts from Asaluyeh County, Iran. Environ. Pollut. 2019, 244, 153–164. [Google Scholar] [CrossRef] [PubMed]
- Guo, J.-J.; Huang, X.-P.; Xiang, L.; Wang, Y.-Z.; Li, Y.-W.; Li, H.; Cai, Q.-Y.; Mo, C.-H.; Wong, M.-H. Source, migration and toxicology of microplastics in soil. Environ. Int. 2020, 137, 105263. [Google Scholar] [CrossRef] [PubMed]
- Wang, T.; Hu, M.; Song, L.; Yu, J.; Liu, R.; Wang, S.; Wang, Z.; Sokolova, I.M.; Huang, W.; Wang, Y. Coastal zone use influences the spatial distribution of microplastics in Hangzhou Bay, China. Environ. Pollut. 2020, 266 Pt 2, 115137. [Google Scholar] [CrossRef] [PubMed]
- Han, M.; Niu, X.; Tang, M.; Zhang, B.-T.; Wang, G.; Yue, W.; Kong, X.; Zhu, J. Distribution of microplastics in surface water of the lower Yellow River near estuary. Sci. Total Environ. 2020, 707, 135601. [Google Scholar] [CrossRef] [PubMed]
- Mintenig, S.M.; Int-Veen, I.; Löder, M.G.J.; Primpke, S.; Gerdts, G. Identification of microplastic in effluents of waste water treatment plants using focal plane array-based micro-Fourier-transform infrared imaging. Water Res. 2017, 108, 365–372. [Google Scholar] [CrossRef] [PubMed]
- Talvitie, J.; Mikola, A.; Koistinen, A.; Setälä, O. Solutions to microplastic pollution-Removal of microplastics from wastewater effluent with advanced wastewater treatment technologies. Water Res. 2017, 123, 401–407. [Google Scholar] [CrossRef] [PubMed]
- Breitbarth, M.; Urban, A. Kunststoffe in kommunalen Kläranlagen: Eintrag und Verteilung in ausgewählten Kläranlagen. Kunststoffe Kommunalen Kläranlagen 2018, 2018, 800–807. [Google Scholar] [CrossRef]
- Long, Z.; Pan, Z.; Wang, W.; Ren, J.; Yu, X.; Lin, L.; Lin, H.; Chen, H.; Jin, X. Microplastic abundance, characteristics, and removal in wastewater treatment plants in a coastal city of China. Water Res. 2019, 155, 255–265. [Google Scholar] [CrossRef] [PubMed]
- Ziajahromi, S.; Neale, P.A.; Rintoul, L.; Leusch, F.D.L. Wastewater treatment plants as a pathway for microplastics: Development of a new approach to sample wastewater-based microplastics. Water Res. 2017, 112, 93–99. [Google Scholar] [CrossRef]
- Pivokonsky, M.; Cermakova, L.; Novotna, K.; Peer, P.; Cajthaml, T.; Janda, V. Occurrence of microplastics in raw and treated drinking water. Sci. Total Environ. 2018, 643, 1644–1651. [Google Scholar] [CrossRef] [PubMed]
- Lares, M.; Ncibi, M.C.; Sillanpää, M.; Sillanpää, M. Occurrence, identification and removal of microplastic particles and fibers in conventional activated sludge process and advanced MBR technology. Water Res. 2018, 133, 236–246. [Google Scholar] [CrossRef] [PubMed]
- Gies, E.A.; LeNoble, J.L.; Noël, M.; Etemadifar, A.; Bishay, F.; Hall, E.R.; Ross, P.S. Retention of microplastics in a major secondary wastewater treatment plant in Vancouver, Canada. Mar. Pollut. Bull. 2018, 133, 553–561. [Google Scholar] [CrossRef] [PubMed]
- Sun, J.; Dai, X.; Wang, Q.; van Loosdrecht, M.C.M.; Ni, B.-J. Microplastics in wastewater treatment plants: Detection, occurrence and removal. Water Res. 2019, 152, 21–37. [Google Scholar] [CrossRef] [PubMed]
- Blair, R.M.; Waldron, S.; Gauchotte-Lindsay, C. Average daily flow of microplastics through a tertiary wastewater treatment plant over a ten-month period. Water Res. 2019, 163, 114909. [Google Scholar] [CrossRef] [PubMed]
- Zhang, Y.; Pu, S.; Lv, X.; Gao, Y.; Ge, L. Global trends and prospects in microplastics research: A bibliometric analysis. J. Hazard. Mater. 2020, 400, 123110. [Google Scholar] [CrossRef] [PubMed]
- Rolsky, C.; Kelkar, V.; Driver, E.; Halden, R.U. Municipal sewage sludge as a source of microplastics in the environment. Curr. Opin. Environ. Sci. Health 2020, 14, 16–22. [Google Scholar] [CrossRef]
- Kang, P.; Ji, B.; Zhao, Y.; Wei, T. How can we trace microplastics in wastewater treatment plants: A review of the current knowledge on their analysis approaches. Sci. Total Environ. 2020, 745, 140943. [Google Scholar] [CrossRef] [PubMed]
- Renner, G.; Schmidt, T.C.; Schram, J. Analytical methodologies for monitoring micro(nano)plastics: Which are fit for purpose? Curr. Opin. Environ. Sci. Health 2018, 1, 55–61. [Google Scholar] [CrossRef]
- Al-Azzawi, M.S.M.; Funck, M.; Kunaschk, M.; Von der Esch, E.; Jacob, O.; Freier, K.P.; Schmidt, T.C.; Elsner, M.; Ivleva, N.P.; Tuerk, J.; et al. Microplastic sampling from wastewater treatment plant effluents: Best-practices and synergies between thermoanalytical and spectroscopic analysis. Water Res. 2022, 219, 118549. [Google Scholar] [CrossRef] [PubMed]
- Primpke, S.; Christiansen, S.H.; Cowger, W.; De Frond, H.; Deshpande, A.; Fischer, M.; Holland, E.B.; Meyns, M.; O’Donnell, B.A.; Ossmann, B.E.; et al. Critical Assessment of Analytical Methods for the Harmonized and Cost-Efficient Analysis of Microplastics. Appl. Spectrosc. 2020, 74, 1012–1047. [Google Scholar] [CrossRef] [PubMed]
- Rocha-Santos, T.; Duarte, A.C. A critical overview of the analytical approaches to the occurrence, the fate and the behavior of microplastics in the environment. TrAC Trends Anal. Chem. 2015, 65, 47–53. [Google Scholar] [CrossRef]
- Pei, W.; Hu, R.; Liu, H.; Wang, L.; Lai, Y. Advanced Raman spectroscopy for nanoplastics analysis: Progress and perspective. TrAC Trends Anal. Chem. 2023, 166, 117188. [Google Scholar] [CrossRef]
- Alam, F.C.; Sembiring, E.; Muntalif, B.S.; Suendo, V. Microplastic distribution in surface water and sediment river around slum and industrial area (case study: Ciwalengke River, Majalaya district, Indonesia). Chemosphere 2019, 224, 637–645. [Google Scholar] [CrossRef] [PubMed]
- Tan, X.; Yu, X.; Cai, L.; Wang, J.; Peng, J. Microplastics and associated PAHs in surface water from the Feilaixia Reservoir in the Beijiang River, China. Chemosphere 2019, 221, 834–840. [Google Scholar] [CrossRef] [PubMed]
- Fischer, M.; Scholz-Böttcher, B.M. Simultaneous Trace Identification and Quantification of Common Types of Microplastics in Environmental Samples by Pyrolysis-Gas Chromatography-Mass Spectrometry. Environ. Sci. Technol. 2017, 51, 5052–5060. [Google Scholar] [CrossRef]
- Dümichen, E.; Barthel, A.-K.; Braun, U.; Bannick, C.G.; Brand, K.; Jekel, M.; Senz, R. Analysis of polyethylene microplastics in environmental samples, using a thermal decomposition method. Water Res. 2015, 85, 451–457. [Google Scholar] [CrossRef]
- Nguyen, N.B.; Kim, M.-K.; Le, Q.T.; Ngo, D.N.; Zoh, K.-D.; Joo, S.-W. Spectroscopic analysis of microplastic contaminants in an urban wastewater treatment plant from Seoul, South Korea. Chemosphere 2021, 263, 127812. [Google Scholar] [CrossRef]
- Peñalver, R.; Arroyo-Manzanares, N.; López-García, I.; Hernández-Córdoba, M. An overview of microplastics characterization by thermal analysis. Chemosphere 2020, 242, 125170. [Google Scholar] [CrossRef]
- Eisentraut, P.; Dümichen, E.; Ruhl, A.S.; Jekel, M.; Albrecht, M.; Gehde, M.; Braun, U. Two Birds with One Stone—Fast and Simultaneous Analysis of Microplastics: Microparticles Derived from Thermoplastics and Tire Wear. Environ. Sci. Technol. Lett. 2018, 5, 608–613. [Google Scholar] [CrossRef]
- Duemichen, E.; Eisentraut, P.; Celina, M.; Braun, U. Automated thermal extraction-desorption gas chromatography mass spectrometry: A multifunctional tool for comprehensive characterization of polymers and their degradation products. J. Chromatography. A 2019, 1592, 133–142. [Google Scholar] [CrossRef] [PubMed]
- Goedecke, C.; Dittmann, D.; Eisentraut, P.; Wiesner, Y.; Schartel, B.; Klack, P.; Braun, U. Evaluation of thermoanalytical methods equipped with evolved gas analysis for the detection of microplastic in environmental samples. J. Anal. Appl. Pyrolysis 2020, 152, 104961. [Google Scholar] [CrossRef]
- Elert, A.M.; Becker, R.; Duemichen, E.; Eisentraut, P.; Falkenhagen, J.; Sturm, H.; Braun, U. Comparison of different methods for MP detection: What can we learn from them, and why asking the right question before measurements matters? Environ. Pollut. 2017, 231 Pt 2, 1256–1264. [Google Scholar] [CrossRef] [PubMed]
- Zarfl, C. Promising techniques and open challenges for microplastic identification and quantification in environmental matrices. Anal. Bioanal. Chem. 2019, 411, 3743–3756. [Google Scholar] [CrossRef] [PubMed]
- Kittner, M.; Eisentraut, P.; Dittmann, D.; Braun, U. Decomposability versus detectability: First validation of TED-GC/MS for microplastic detection in different environmental matrices. Appl. Res. 2023, 3, e202200078. [Google Scholar] [CrossRef]
- Dierkes, G.; Lauschke, T.; Becher, S.; Schumacher, H.; Földi, C.; Ternes, T. Quantification of microplastics in environmental samples via pressurized liquid extraction and pyrolysis-gas chromatography. Anal. Bioanal. Chem. 2019, 411, 6959–6968. [Google Scholar] [CrossRef] [PubMed]
- Hurley, R.R.; Lusher, A.L.; Olsen, M.; Nizzetto, L. Validation of a Method for Extracting Microplastics from Complex, Organic-Rich, Environmental Matrices. Environ. Sci. Technol. 2018, 52, 7409–7417. [Google Scholar] [CrossRef]
- Fuhr, L.; Buschmann, D.R.; Freund, J. Plastikatlas: Daten und Fakten über eine Welt voller Kunststoff, 1st ed.; Heinrich-Böll-Stiftung (PUBL): Berlin, Germany, 2019. [Google Scholar]
- Dümichen, E.; Eisentraut, P.; Bannick, C.G.; Barthel, A.-K.; Senz, R.; Braun, U. Fast identification of microplastics in complex environmental samples by a thermal degradation method. Chemosphere 2017, 174, 572–584. [Google Scholar] [CrossRef] [PubMed]
- German Federal Statistical Office (Statistisches Bundesamt). Abwasserwirtschaft-in-Deutschland. 2021. Available online: https://de.statista.com/statistik/studie/id/43772/dokument/abwasserwirtschaft-in-deutschland/ (accessed on 20 March 2024).
- DIN EN ISO 5667-1:2023-04; Wasserbeschaffenheit_-Probenahme_-Teil_1: Anleitung zur Erstellung von Probenahmeprogrammen und Probenahmetechniken (ISO_5667-1:2020). Deutsche Fassung EN_ISO_5667-1:2022; Deutsches Institut für Normung e.V. (PUBL), Beuth-Verlag: Berlin, Germany, 2022.
- DIN 38402-11:2009-02; Deutsche Einheitsverfahren zur Wasser-, Abwasser- und Schlammuntersuchung_- Allgemeine Angaben (Gruppe_A)_- Teil_11: Probenahme von Abwasser_(A_11). Berlin, Deutsches Institut für Normung e.V. (PUBL), Beuth-Verlag: Berlin, Germany, 2022.
- DIN 32645:2008-11; Chemical Analysis—Decision Limit, Detection Limit and Determination Limit under Repeatability Conditions—Terms, Methods, Evaluation. Deutsches Institut für Normung e.V. (PUBL), Beuth-Verlag: Berlin, Germany, 2008.
- ISO 11352:2012 (en); Water Quality—Estimation of Measurement Uncertainty Based on Validation and Quality Control Data. ICS:13.060.45; International Standard; International Organization for Standardization (PUBL): Geneva, Switzerland, 2012.
- Spelthahn, V.; Griebel, K.; Dolny, R.; Lechthaler, S.; Pinnekamp, J. (Eds.) Mikroplastik aus Mischsystemen: 52. Essener Tagung für Wasserwirtschaft: 20. bis 22. März 2019 im Eurogress Aachen; Gesellschaft zur Förderung der Siedlungswasserwirtschaft an der RWTH Aachen e.V: Aachen, Germany, 2019. [Google Scholar]
- Lee, J.-H.; Kim, M.-J.; Kim, C.-S.; Cheon, S.-J.; Choi, K.-I.; Kim, J.; Jung, J.; Yoon, J.-K.; Lee, S.-H.; Jeong, D.-H. Detection of microplastic traces in four different types of municipal wastewater treatment plants through FT-IR and TED-GC-MS. Environ. Pollut. 2023, 333, 122017. [Google Scholar] [CrossRef] [PubMed]
- Altmann, K.; Goedecke, C.; Bannick, C.; Abusafia, A.; Scheid, C.; Steinmetz, H.; Paul, A.; Beleites, C.; Braun, U. Identification of microplastic pathways within a typical European urban wastewater system. Appl. Res. 2023, 2, e202200078. [Google Scholar] [CrossRef]
- Funck, M.; Al-Azzawi, M.S.; Yildirim, A.; Knoop, O.; Schmidt, T.C.; Drewes, J.E.; Tuerk, J. Release of microplastic particles to the aquatic environment via wastewater treatment plants: The impact of sand filters as tertiary treatment. Chem. Eng. J. 2021, 426, 130933. [Google Scholar] [CrossRef]
- Majewsky, M.; Bitter, H.; Eiche, E.; Horn, H. Determination of microplastic polyethylene (PE) and polypropylene (PP) in environmental samples using thermal analysis (TGA-DSC). Sci. Total Environ. 2016, 568, 507–511. [Google Scholar] [CrossRef] [PubMed]
- Xu, Y.; Ou, Q.; Wang, X.; Hou, F.; Li, P.; van der Hoek, J.P.; Liu, G. Assessing the Mass Concentration of Microplastics and Nanoplastics in Wastewater Treatment Plants by Pyrolysis Gas Chromatography-Mass Spectrometry. Environ. Sci. Technol. 2023, 57, 3114–3123. [Google Scholar] [CrossRef] [PubMed]
- German Federal Statistical Office (Statistisches Bundesamt). Wasserwirtschaft: Klärschlammentsorgung aus der Biologischen Abwasserbehandlung in Deutschland und ins Ausland 2022. 2023. Available online: https://www.destatis.de/DE/Themen/Gesellschaft-Umwelt/Umwelt/Wasserwirtschaft/Tabellen/ks-016b-klaerschlammentsorgung_biologische_awb-2022.html?view=main[Print] (accessed on 20 March 2024).
- Büks, F.; Kaupenjohann, M. Global concentrations of microplastics in soils—A review. SOIL 2020, 6, 649–662. [Google Scholar] [CrossRef]
- Hansen, A.A.; Vollertsen, J. Microplastic in Danish Wastewater: Sources, Occurrences and Fate. Available online: https://www.researchgate.net/publication/316966942_Microplastic_in_Danish_wastewater_Sources_occurrences_and_fate (accessed on 20 March 2024).
- Jones, E.R.; van Vliet, M.T.H.; Qadir, M.; Bierkens, M.F. Country-level and gridded estimates of wastewater production, collection, treatment and reuse. Earth Syst. Sci. Data 2021, 13, 237–254. [Google Scholar] [CrossRef]
- Ulrike, B.; Ulf, S.; Hannes, S.; Korinna, A.; Claus, B.; Roland, B.; Hajo, B.; Mathias, B.; Georg, D.; Kristina, E.; et al. Analysis of Microplastics: Sampling, Preparation and Detection Methods. 2021. Available online: https://bmbf-plastik.de/sites/default/files/2021-12/Status%20Report_Analysis%20of%20Microplastics_PidU_May_2021_0.pdf (accessed on 20 March 2024).
- Lee, H.; Kim, Y. Treatment characteristics of microplastics at biological sewage treatment facilities in Korea. Mar. Pollut. Bull. 2018, 137, 1–8. [Google Scholar] [CrossRef]
- Park, H.-J.; Oh, M.-J.; Kim, P.-G.; Kim, G.; Jeong, D.-H.; Ju, B.-K.; Lee, W.-S.; Chung, H.-M.; Kang, H.-J.; Kwon, J.-H. National Reconnaissance Survey of Microplastics in Municipal Wastewater Treatment Plants in Korea. Environ. Sci. Technol. 2020, 54, 1503–1512. [Google Scholar] [CrossRef]
- Okoffo, E.D.; Thomas, K.V. Mass quantification of nanoplastics at wastewater treatment plants by pyrolysis-gas chromatography-mass spectrometry. Water Res. 2024, 254, 121397. [Google Scholar] [CrossRef] [PubMed]
- Liu, W.; Zhang, J.; Liu, H.; Guo, X.; Zhang, X.; Yao, X.; Cao, Z.; Zhang, T. A review of the removal of microplastics in global wastewater treatment plants: Characteristics and mechanisms. Environ. Int. 2021, 146, 106277. [Google Scholar] [CrossRef] [PubMed]
- Franco, A.A.; Arellano, J.M.; Albendín, G.; Rodríguez-Barroso, R.; Quiroga, J.M.; Coello, M.D. Microplastic pollution in wastewater treatment plants in the city of Cádiz: Abundance, removal efficiency and presence in receiving water body. Sci. Total Environ. 2021, 776, 145795. [Google Scholar] [CrossRef]
- Gündoğdu, S.; Çevik, C.; Güzel, E.; Kilercioğlu, S. Microplastics in municipal wastewater treatment plants in Turkey: A comparison of the influent and secondary effluent concentrations. Environ. Monit. Assess. 2018, 190, 626. [Google Scholar] [CrossRef] [PubMed]
- Wenzel, M.; Fischer, B.; Renner, G.; Schoettl, J.; Wolf, C.; Schram, J.; Schmidt, T.C.; Tuerk, J. Efficient and sustainable microplastics analysis for environmental samples using flotation for sample pre-treatment. Green Anal. Chem. 2022, 3, 100044. [Google Scholar] [CrossRef]
- Kittner, M.; Kerndorff, A.; Ricking, M.; Bednarz, M.; Obermaier, N.; Lukas, M.; Asenova, M.; Bordós, G.; Eisentraut, P.; Hohenblum, P.; et al. Microplastics in the Danube River Basin: A First Comprehensive Screening with a Harmonized Analytical Approach. ACS EST Water 2022, 2, 1174–1181. [Google Scholar] [CrossRef]
| Abb. of WWTPs | Size Class | Population Equivalent [P.E.] | Annual Discharge [m3/y] | Process Structure | Sampling Period (24 h Composite Sample) |
|---|---|---|---|---|---|
| W1 | 5 | 428,000 | 19,185,643 | Conv. mech.-biol. WWTP 1 with additional 2-stage filtration (1. fixed bed reactor with methanol dosing; 2. fine filtration with FeClSO4 dosing) | 06./07.08.2019 08./09.06.2021 09./10.06.2021 |
| W2 | 5 | 400,000 | 15,977,064 | Conv. mech.-biol. WWTP 1 with additional biological aerated filter | 23./24.07.2019 01./02.06.2021 02./03.06.2021 |
| W3 | 5 | 350,000 | 15,512,500 | Conv. mech.-biol. WWTP 1 with additional pile cloth media filtration in pilot operation | 30./31.10.2019 01.-04.11.2019 04./05.11.2019 |
| W4 | 5 | 275,000 | 17,898,200 | Conventional mechanical–biological wastewater treatment | 16./17.06.2020 18./19.06.2020 27./28.10.2020 28./29.10.2020 |
| W5 | 4 | 70,000 | 6,237,647 | Conventional mechanical–biological wastewater treatment | 18./19.05.2021 19./20.05.2021 20./21.05.2021 |
| W6 | 4 | 93,000 | 1,788,410 | Conventional mechanical–biological wastewater treatment with additional continuous sand filtration (grain size 1–2 mm) | 30./31.07.2019 14./15.06.2021 16./17.06.2021 |
| W7 | 4 | 20,000 | 557,972 | Conventional mechanical–biological wastewater treatment with additional continuous sand filtration (grain size 1–2 mm) | 13./14.08.2019 21./22.06.2021 22./23.06.2021 |
| W8 | 4 | 100,000 | 1,012,199 | Conventional mechanical–biological wastewater treatment with additional flock filtration by space-layer filter (0.7–8 mm grain size) | 15./16.08.2019 |
| W9 | 3 | 15,000 | Not stated | Conventional mechanical–biological treatment in a Sequencing Batch Reactor (SBR) | 17./18.08.2022 18./19.08.2022 23./24.08.2022 |
| Type of Wastewater | Sampling Technique | Sampling Volume [l] |
|---|---|---|
| Wastewater with high solids content | Peristaltic pump (automatic sampler) | 1–25 |
| Wastewater with low solid content | Peristaltic/submersible pump | 800–5000 |
Disclaimer/Publisher’s Note: The statements, opinions and data contained in all publications are solely those of the individual author(s) and contributor(s) and not of MDPI and/or the editor(s). MDPI and/or the editor(s) disclaim responsibility for any injury to people or property resulting from any ideas, methods, instructions or products referred to in the content. |
© 2024 by the authors. Licensee MDPI, Basel, Switzerland. This article is an open access article distributed under the terms and conditions of the Creative Commons Attribution (CC BY) license (https://creativecommons.org/licenses/by/4.0/).
Share and Cite
Lau, P.; Stein, J.; Reinhold, L.; Barjenbruch, M.; Fuhrmann, T.; Urban, I.; Bauerfeld, K.; Holte, A. Reduction in the Input of Microplastics into the Aquatic Environment via Wastewater Treatment Plants in Germany. Microplastics 2024, 3, 276-292. https://doi.org/10.3390/microplastics3020017
Lau P, Stein J, Reinhold L, Barjenbruch M, Fuhrmann T, Urban I, Bauerfeld K, Holte A. Reduction in the Input of Microplastics into the Aquatic Environment via Wastewater Treatment Plants in Germany. Microplastics. 2024; 3(2):276-292. https://doi.org/10.3390/microplastics3020017
Chicago/Turabian StyleLau, Philipp, Julia Stein, Luisa Reinhold, Matthias Barjenbruch, Tim Fuhrmann, Ingo Urban, Katrin Bauerfeld, and Andrea Holte. 2024. "Reduction in the Input of Microplastics into the Aquatic Environment via Wastewater Treatment Plants in Germany" Microplastics 3, no. 2: 276-292. https://doi.org/10.3390/microplastics3020017
APA StyleLau, P., Stein, J., Reinhold, L., Barjenbruch, M., Fuhrmann, T., Urban, I., Bauerfeld, K., & Holte, A. (2024). Reduction in the Input of Microplastics into the Aquatic Environment via Wastewater Treatment Plants in Germany. Microplastics, 3(2), 276-292. https://doi.org/10.3390/microplastics3020017