
Intra-Laboratory Calibration Exercise for Quantification of Microplastic Particles in Fine-Grained Sediment Samples: Special Focus on the Influence of User Experience

 ,
,  , and
, and 
Abstract
:
1. Introduction
2. Materials and Methods
2.1. Laboratories and Operators Involved in the Exercise
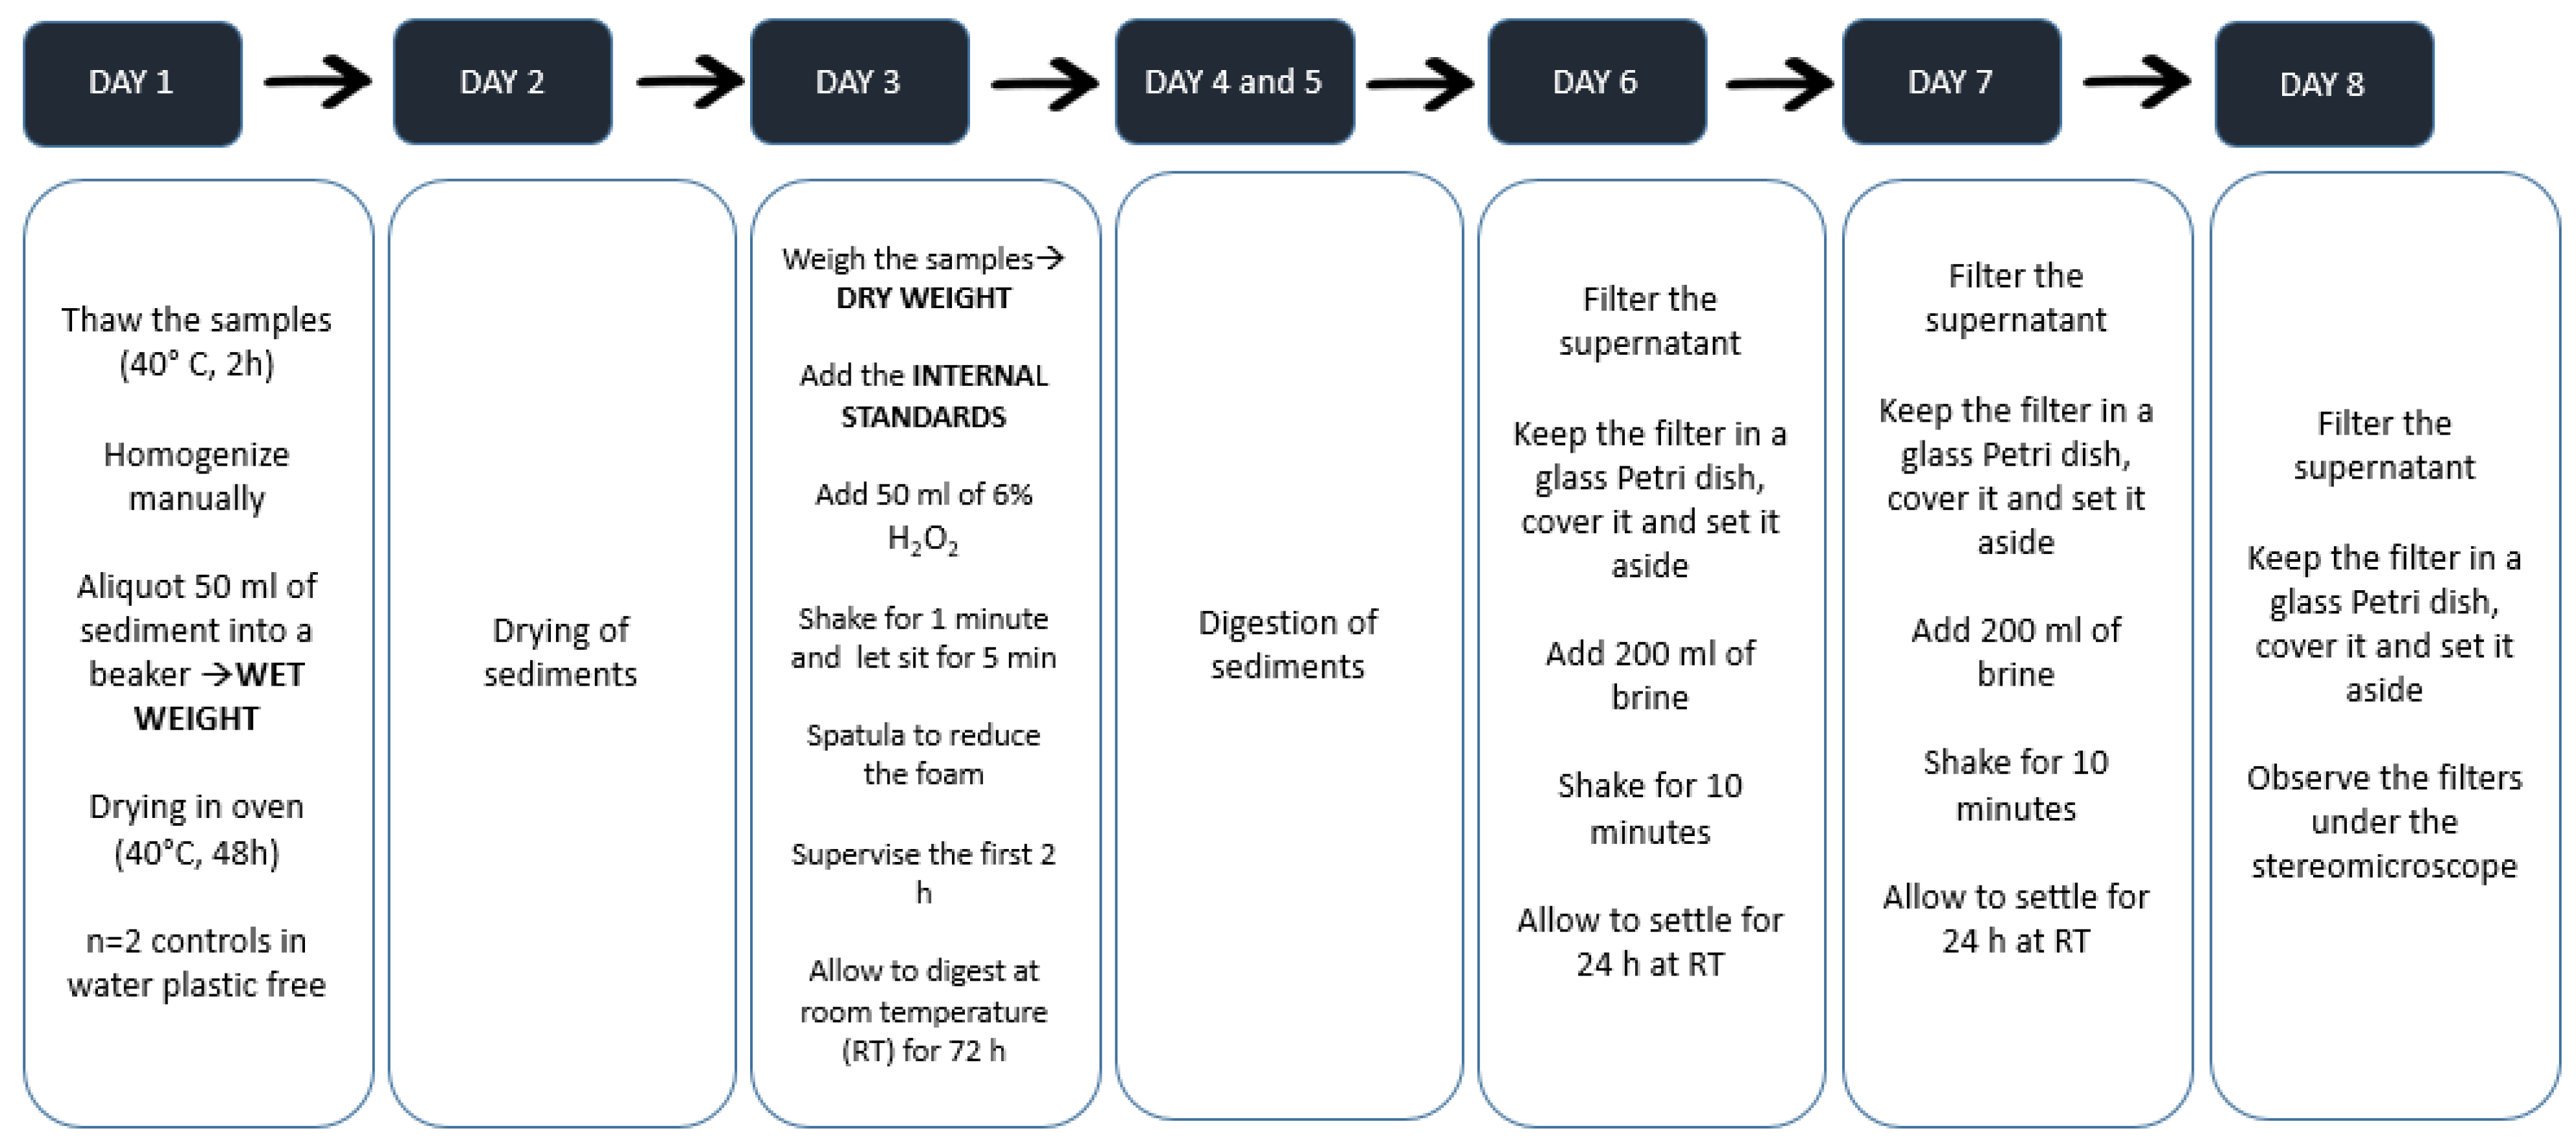
2.2. Protocols and Instructions for the Execution of the Exercise
2.3. Preparation of Microplastic Particles
2.4. Sampling and Preparation of Sediments
2.5. Quality Assurance
2.6. Data Processing and Statistical Analysis
3. Results
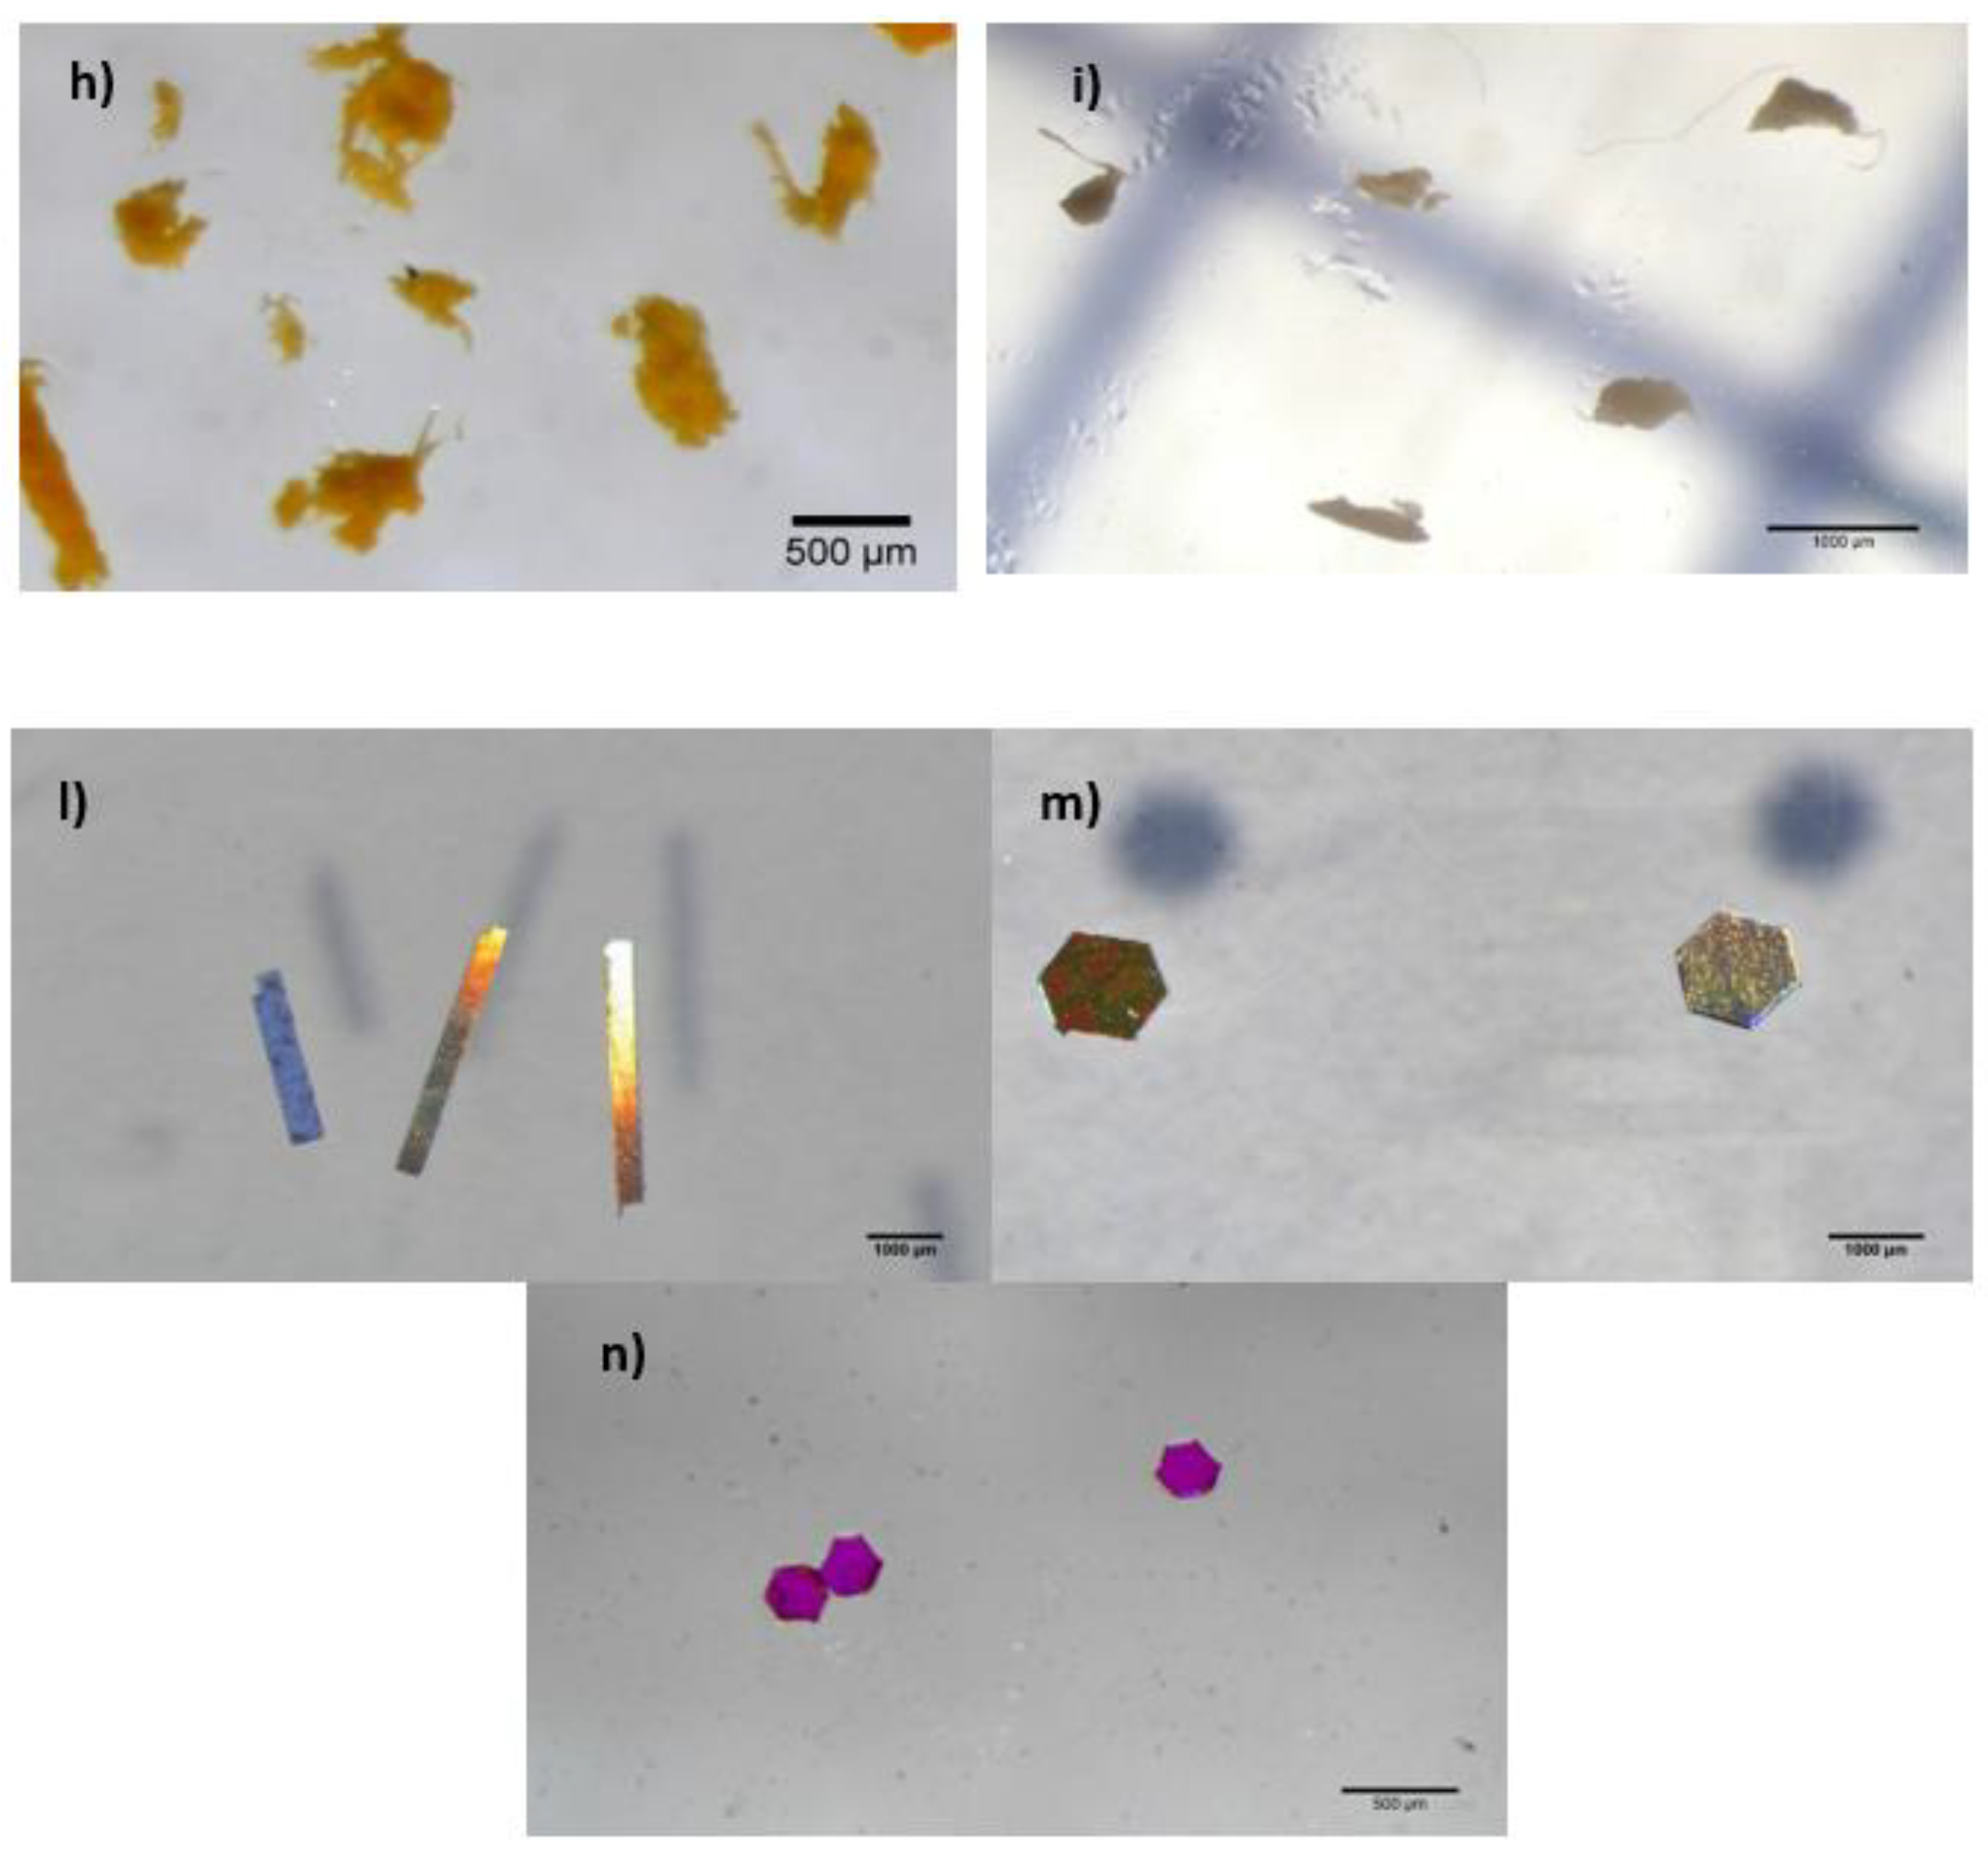
3.1. Microplastic Alterations Due to 6% Hydrogen Peroxide
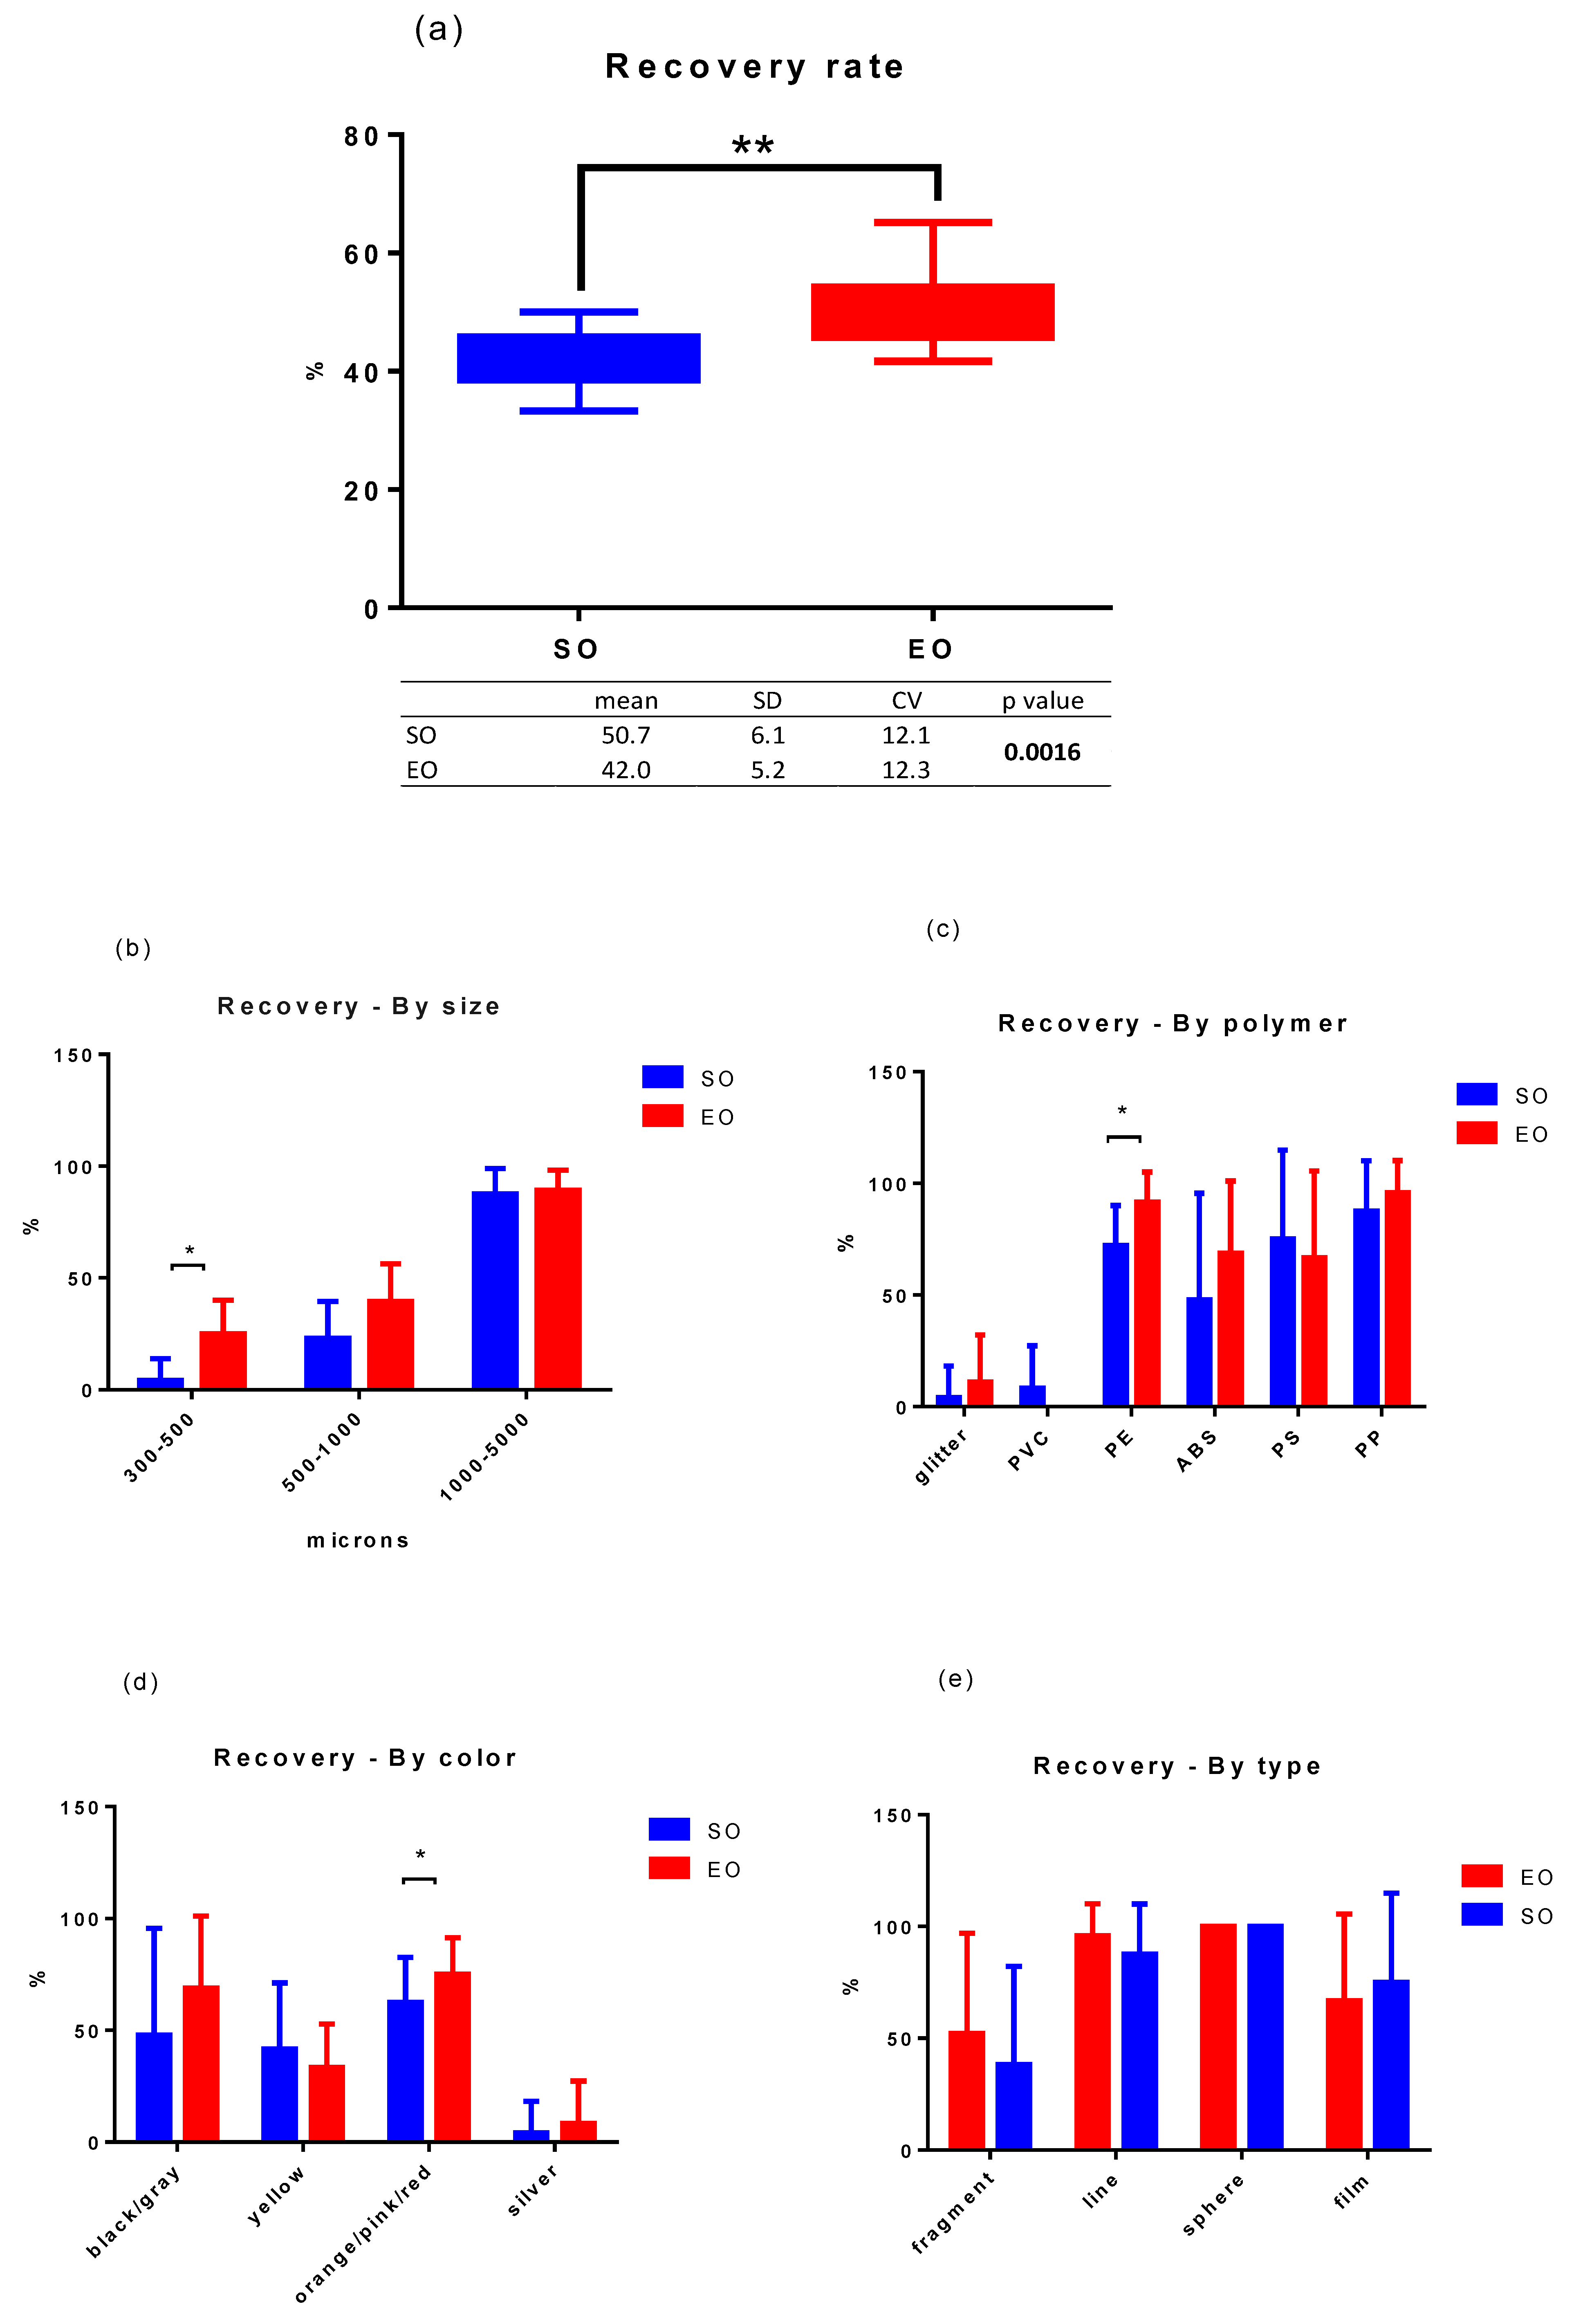
3.2. Expert Operator’s Recovery Rates (by Polymer Density, Size, Type and Color)
3.2.1. Effect of Additional Extraction Steps
3.2.2. Effect of Double Reading
3.2.3. Influence of the Color of the Filter
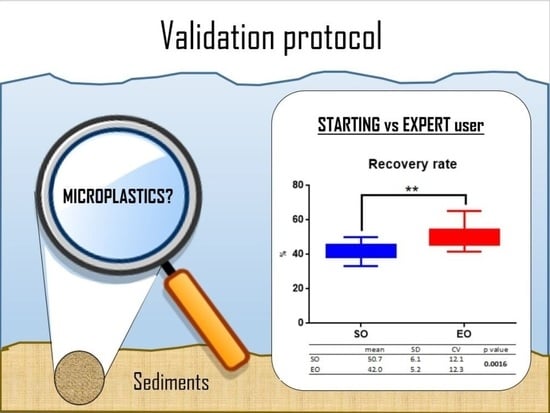
3.3. Experience Effect
3.3.1. Starting Operator’s Recovery Rates
3.3.2. Filter Reading Error
4. Discussion
- (i)
- NaCl solution provides the best cost-benefit ratio, but it is ineffective for extracting high-density polymers
- (ii)
- The recovery rate by size, polymer density, type and color
- (iii)
- The reasons of low recovery rate
- (iv)
- Strategies to increase the recovery rate
- (v)
- The operator’s experience qualitatively affected the recovery rate
- (vi)
- The possible reasons of error
- (vii)
- Methodological shortcomings in the extraction of GLITTER
5. Conclusions
Supplementary Materials
Author Contributions
Funding
Institutional Review Board Statement
Informed Consent Statement
Data Availability Statement
Conflicts of Interest
References
- Hartmann, N.B.; Hüffer, T.; Thompson, R.C.; Hassellöv, M.; Verschoor, A.; Daugaard, A.E.; Rist, S.; Karlsson, T.M.; Brennholt, N.; Cole, M.; et al. Are We Speaking the Same Language? Recommendations for a Definition and Categorization Framework for Plastic Debris. Environ. Sci. Technol. 2019, 53, 1039–1047. [Google Scholar] [CrossRef] [PubMed]
- Bergmann, M.; Gutow, L.; Klages, M. Nanoplastics in the Aquatic Environment. Critical Review. In Marine Anthropogenic Litter; Springer: Berlin/Heidelberg, Germany, 2015; pp. 325–440. [Google Scholar]
- Arthur, J.B.; Bamford, H. Proceedings of the International Research Workshop on the Occurrence, Effects and Fate of Microplastic Marine Debris. In NOAA Technical Memorandum NOS-OR&R-30. 2009; p. 530. Available online: https://repository.library.noaa.gov/view/noaa/2509 (accessed on 4 April 2022).
- GESAMP. Guidelines for the Monitoring and Assessment of Plastic Litter in the Ocean; GESAMP: London, UK, 2019; 130p, Available online: http://www.gesamp.org/publications/guidelines-for-the-monitoring-and-assessment-of-plastic-litter-in-the-ocean (accessed on 4 April 2022).
- Suaria, G.; Avio, C.G.; Mineo, A.; Lattin, G.L.; Magaldi, M.G.; Belmonte, G.; Moore, C.J.; Regoli, F.; Aliani, S. The Mediterranean Plastic Soup: Synthetic polymers in Mediterranean surface waters. Sci. Rep. 2016, 6, 37551. [Google Scholar] [CrossRef] [PubMed]
- Baini, M.; Fossi, M.C.; Galli, M.; Caliani, I.; Campani, T.; Finoia, M.G.; Panti, C. Abundance and characterization of microplastics in the coastal waters of Tuscany (Italy): The application of the MSFD monitoring protocol in the Mediterranean Sea. Mar. Pollut. Bull. 2018, 133, 543–552. [Google Scholar] [CrossRef]
- Harris, P.T. The fate of microplastic in marine sedimentary environments: A review and synthesis. Mar. Pollut. Bull. 2020, 158, 111398. [Google Scholar] [CrossRef] [PubMed]
- Vandermeersch, G.; Van Cauwenberghe, L.; Janssen, C.R.; Marques, A.; Granby, K.; Fait, G.; Kotterman, M.J.; Diogène, J.; Bekaert, K.; Robbens, J.; et al. A critical view on microplastic quantification in aquatic organisms. Environ. Res. 2015, 143, 46–55. [Google Scholar] [CrossRef]
- Renzi, M.; Guerranti, C.; Blašković, A. Microplastic contents from maricultured and natural mussels. Mar. Pollut. Bull. 2018, 131, 248–251. [Google Scholar] [CrossRef]
- Sharma, S.; Vikas, S.; Subhankar, C. Microplastics in the Mediterranean Sea: Sources, Pollution Intensity, Sea Health, and Regulatory Policies. Front. Mar. Sci. 2021, 8, 634934. [Google Scholar] [CrossRef]
- Jambeck, J.R.; Geyer, R.; Wilcox, C.; Siegler, T.R.; Perryman, M.; Andrady, A.; Narayan, R.; Law, K.L. Plastic waste inputs from land into the ocean. Science 2015, 347, 768–771. [Google Scholar] [CrossRef]
- Woodall, L.C.; Sanchez-Vidal, A.; Canals, M.; Paterson, G.L.J.; Coppock, R.; Sleight, V.; Calafat, A.; Rogers, A.D.; Narayanaswamy, B.E.; Thompson, R.C. The deep sea is a major sink for microplastic debris. R. Soc. Open Sci. 2014, 1, 140317. Available online: http://rsos.royalsocietypublishing.org/content/1/4/140317.abstract (accessed on 4 April 2022). [CrossRef] [PubMed]
- Reinold, S.; Herrera, A.; Stile, N.; Saliu, F.; Hernández-González, C.; Martinez, I.; Ortega, Z.; Marrero, M.D.; Lasagni, M.; Gómez, M. An annual study on plastic accumulation in surface water and sediment cores from the coastline of Tenerife (Canary Island, Spain). Mar. Pollut. Bull. 2021, 173, 113072. [Google Scholar] [CrossRef] [PubMed]
- Lobelle, D.; Cunliffe, M. Early microbial biofilm formation on marine plastic debris. Mar. Pollut. Bull. 2011, 62, 197–200. [Google Scholar] [CrossRef] [PubMed]
- Rummel, C.D.; Jahnke, A.; Gorokhova, E.; Kühnel, D.; Schmitt-Jansen, M. Impacts of Biofilm Formation on the Fate and Potential Effects of Microplastic in the Aquatic Environment. Environ. Sci. Technol. Lett. 2017, 4, 258–267. [Google Scholar] [CrossRef]
- Tsangaris, C.; Panti, C.; Compa, M.; Pedà, C.; Digka, N.; Baini, M.; D’Alessandro, M.; Alomar, C.; Patsiou, D.; Giani, D.; et al. Interlaboratory comparison of microplastic extraction methods from marine biota tissues: A harmonization exercise of the Plastic Busters MPAs project. Mar. Pollut. Bull. 2021, 164, 111992. [Google Scholar] [CrossRef] [PubMed]
- Cadiou, J.-F.; Gerigny, O.; Koren, Š.; Zeri, C.; Kaberi, H.; Alomar, C.; Panti, C.; Fossi, M.; Adamopoulou, A.; Digka, N.; et al. Lessons learned from an intercalibration exercise on the quantification and characterisation of microplastic particles in sediment and water samples. Mar. Pollut. Bull. 2020, 154, 111097. [Google Scholar] [CrossRef] [PubMed]
- De Lazzari, A.; Rampazzo, G.; Pavoni, B. Geochemistry of sediments in the Northern and Central Adriatic Sea. Estuarine, Coast. Shelf Sci. 2004, 59, 429–440. [Google Scholar] [CrossRef]
- Green, D.S.; Jefferson, M.; Boots, B.; Stone, L. All that glitters is litter? Ecological impacts of conventional versus biodegradable glitter in a freshwater habitat. J. Hazard. Mater. 2020, 402, 124070. [Google Scholar] [CrossRef] [PubMed]
- Tagg, A.S.; do Sul, J.A.I. Is This Your Glitter? An Overlooked but Potentially Environmentally-Valuable Microplastic. Mar. Pollut. Bull. 2019, 146, 50–53. [Google Scholar] [CrossRef]
- Perosa, M.; Guerranti, C.; Renzi, M.; Bevilacqua, S. Taking the sparkle off the sparkling time. Mar. Pollut. Bull. 2021, 170, 112660. [Google Scholar] [CrossRef]
- Raju, S.; Carbery, M.; Kuttykattil, A.; Senthirajah, K.; Lundmark, A.; Rogers, Z.; Scb, S.; Evans, G.; Palanisami, T. Improved methodology to determine the fate and transport of microplastics in a secondary wastewater treatment plant. Water Res. 2020, 173, 115549. [Google Scholar] [CrossRef]
- Enders, K.; Lenz, R.; Sul, J.A.I.D.; Tagg, A.S.; Labrenz, M. When every particle matters: A QuEChERS approach to extract microplastics from environmental samples. MethodsX 2020, 7, 100784. [Google Scholar] [CrossRef] [PubMed]
- Galgani, F.; Giorgetti, A.; Vinci, M.; Le Moigne, M.; Moncoiffe, G.; Brosich, A.; Molina, E.; Lipizer, M.; Holdsworth, N.; Schlitzer, R.; et al. Proposal for Gathering and Managing Data Sets on Marine Micro-Litter on a European Scale; EMODnet: Oostende, Belgium, 2019. [Google Scholar]
- Konechnaya, O.; Lüchtrath, S.; Dsikowitzky, L.; Schwarzbauer, J. Optimized Microplastic Analysis Based on Size Fractionation, Density Separation and μ-FTIR. Water Sci. Technol. 2020, 81, 834–844. [Google Scholar] [CrossRef]
- Romano, E.; Ausili, A.; Bergamin, L.; Celia Magno, M.; Pierfranceschi, G.; Venti, F. Analisi Granulometriche Dei Sedimenti Marini; Linee Guida SNPA 18/2018; ISPRA: Roma, Italy, 2018. [Google Scholar]
- Sánchez-Nieva, J.; Perales, J.A.; González-Leal, J.M.; Rojo-Nieto, E. A new analytical technique for the extraction and quantification of microplastics in marine sediments focused on easy implementation and repeatability. Anal. Methods 2017, 9, 6371–6378. [Google Scholar] [CrossRef]
- Vermeiren, P.; Muñoz, C.; Ikejima, K. Microplastic identification and quantification from organic rich sediments: A validated laboratory protocol. Environ. Pollut. 2020, 262, 114298. [Google Scholar] [CrossRef]
- Reed, S.; Clark, M.; Thompson, R.; Hughes, K.A. Microplastics in marine sediments near Rothera Research Station, Antarctica. Mar. Pollut. Bull. 2018, 133, 460–463. [Google Scholar] [CrossRef]
- Vianello, A.; Boldrin, A.; Guerriero, P.; Moschino, V.; Rella, R.; Sturaro, A.; Da Ros, L. Microplastic particles in sediments of Lagoon of Venice, Italy: First observations on occurrence, spatial patterns and identification. Estuar. Coast. Shelf Sci. 2013, 130, 54–61. [Google Scholar] [CrossRef]
- Imhof, H.K.; Schmid, J.; Niessner, R.; Ivleva, N.P.; Laforsch, C. A novel, highly efficient method for the separation and quantification of plastic particles in sediments of aquatic environments. Limnol. Oceanogr. Methods 2012, 10, 524–537. [Google Scholar] [CrossRef]
- Scherer, C.; Weber, A.; Stock, F.; Vurusic, S.; Egerci, H.; Kochleus, C.; Arendt, N.; Foeldi, C.; Dierkes, G.; Wagner, M.; et al. Comparative Assessment of Microplastics in Water and Sediment of a Large European River Sci. Total Environ. 2020, 738, 139866. [Google Scholar] [CrossRef]
- Ballent, A.; Corcoran, P.L.; Madden, O.; Helm, P.A.; Longstaffe, F.J. Sources and sinks of microplastics in Canadian Lake Ontario nearshore, tributary and beach sediments. Mar. Pollut. Bull. 2016, 110, 383–395. [Google Scholar] [CrossRef] [PubMed]
- Yurtsever, M. Tiny, Shiny, and Colorful Microplastics: Are Regular Glitters a Significant Source of Microplastics? Mar. Pollut. Bull. 2019, 146, 678–682. [Google Scholar] [CrossRef]


| Size Classes | Type | Shape | Polymer | Color | Precursor | Items Added | Total per Size Class | Total per Beaker |
|---|---|---|---|---|---|---|---|---|
| 300–500 µm | fragments | broken edges | PVC | yellow | industrial foil | 2 | 4 | 24 |
| fragments | broken edges | ABS | gray | industrial dust | 2 | |||
| 500–1000 µm | fragments | broken edges | PVC | yellow | industrial foil | 2 | 4 | |
| fragments | angular edges | PE | orange | beverage lids | 2 | |||
| 1000–5000 µm | fragments | angular edges | PE | orange | beverage lids | 2 | 10 | |
| fragments | broken edges | ABS | gray | industrial dust | 2 | |||
| filaments | / | PP | orange | lanyards | 2 | |||
| films | broken edges | PS | yellow | food container | 2 | |||
| sphere | spheruloid | PE | pink | body cleanser | 2 | |||
| GLITTER | / | exagonal | PMMA | silver | hair gel for kids | 2 | 6 | |
| exagonal | PMMA | pink | purpurine | 2 | ||||
| rectangular | PE | silver | purpurine | 2 |
| Recovery Rate (%) | |||||||
|---|---|---|---|---|---|---|---|
| SO | EO | p Value | |||||
| mean | SD | CV | mean | SD | CV | ||
| GLOBAL | 42.0 | 5.2 | 12.3 | 50.7 | 6.1 | 12.1 | 0.0016 |
| 300–500 µum | 4.2 | 9.7 | 233.5 | 25.0 | 15.1 | 60.3 | 0.0124 |
| 500–1000 µm | 22.9 | 16.7 | 72.9 | 39.6 | 16.7 | 42.2 | 0.2303 |
| 1000–5000 µm | 87.5 | 11.4 | 13.0 | 89.2 | 9.0 | 10.1 | 0.8378 |
| glitter | 4.2 | 14.0 | 336.4 | 11.1 | 21.1 | 189.7 | 0.1887 |
| PVC | 8.3 | 19.0 | 228.4 | 0.0 | 0.0 | - | 0.1092 |
| PE | 72.2 | 17.9 | 24.8 | 91.7 | 13.3 | 14.5 | 0.0224 |
| ABS | 47.9 | 47.7 | 99.6 | 68.8 | 32.3 | 47.0 | 0.1184 |
| PS | 75.0 | 39.9 | 53.2 | 66.7 | 38.9 | 58.4 | 0.6399 |
| PP | 87.5 | 22.6 | 25.8 | 95.8 | 14.4 | 15.1 | 0.5901 |
| black/gray | 47.9 | 47.7 | 99.6 | 68.8 | 32.3 | 47.0 | 0.1184 |
| yellow | 41.7 | 29.5 | 70.7 | 33.3 | 19.5 | 58.4 | 0.3856 |
| orange/pink/red | 54.6 | 18.3 | 33.5 | 68.1 | 17.4 | 25.6 | 0.0477 |
| silver | 4.2 | 14.1 | 338.8 | 8.3 | 19.0 | 228.4 | 0.6662 |
| fragment | 38.2 | 44.0 | 115.2 | 52.1 | 44.8 | 85.9 | 0.0644 |
| line | 87.5 | 22.6 | 25.8 | 95.8 | 14.4 | 15.1 | 0.5901 |
| sphere | 100.0 | 0.0 | 0.0 | 100.0 | 0.0 | 0.0 | >0.9999 |
| film | 75.0 | 39.9 | 53.2 | 66.7 | 38.9 | 58.4 | 0.6399 |
| # of Particles Not Registered by SO | |
|---|---|
| mean | 2.9 |
| SD | 2.5 |
| min | 1.0 |
| max | 7.0 |
| OVER | 16.0 |
| UNDER | 19.0 |
| SIZE | COLOR | TYPE | ||||||||||||||
|---|---|---|---|---|---|---|---|---|---|---|---|---|---|---|---|---|
| 300–500 | 500–1000 | 1000–5000 | TOTAL | Black/Gray | Yellow | Orange/Pink/Red | Silver | TOTAL | Fragment | LINE | SPHERE | FILM | TOTAL | |||
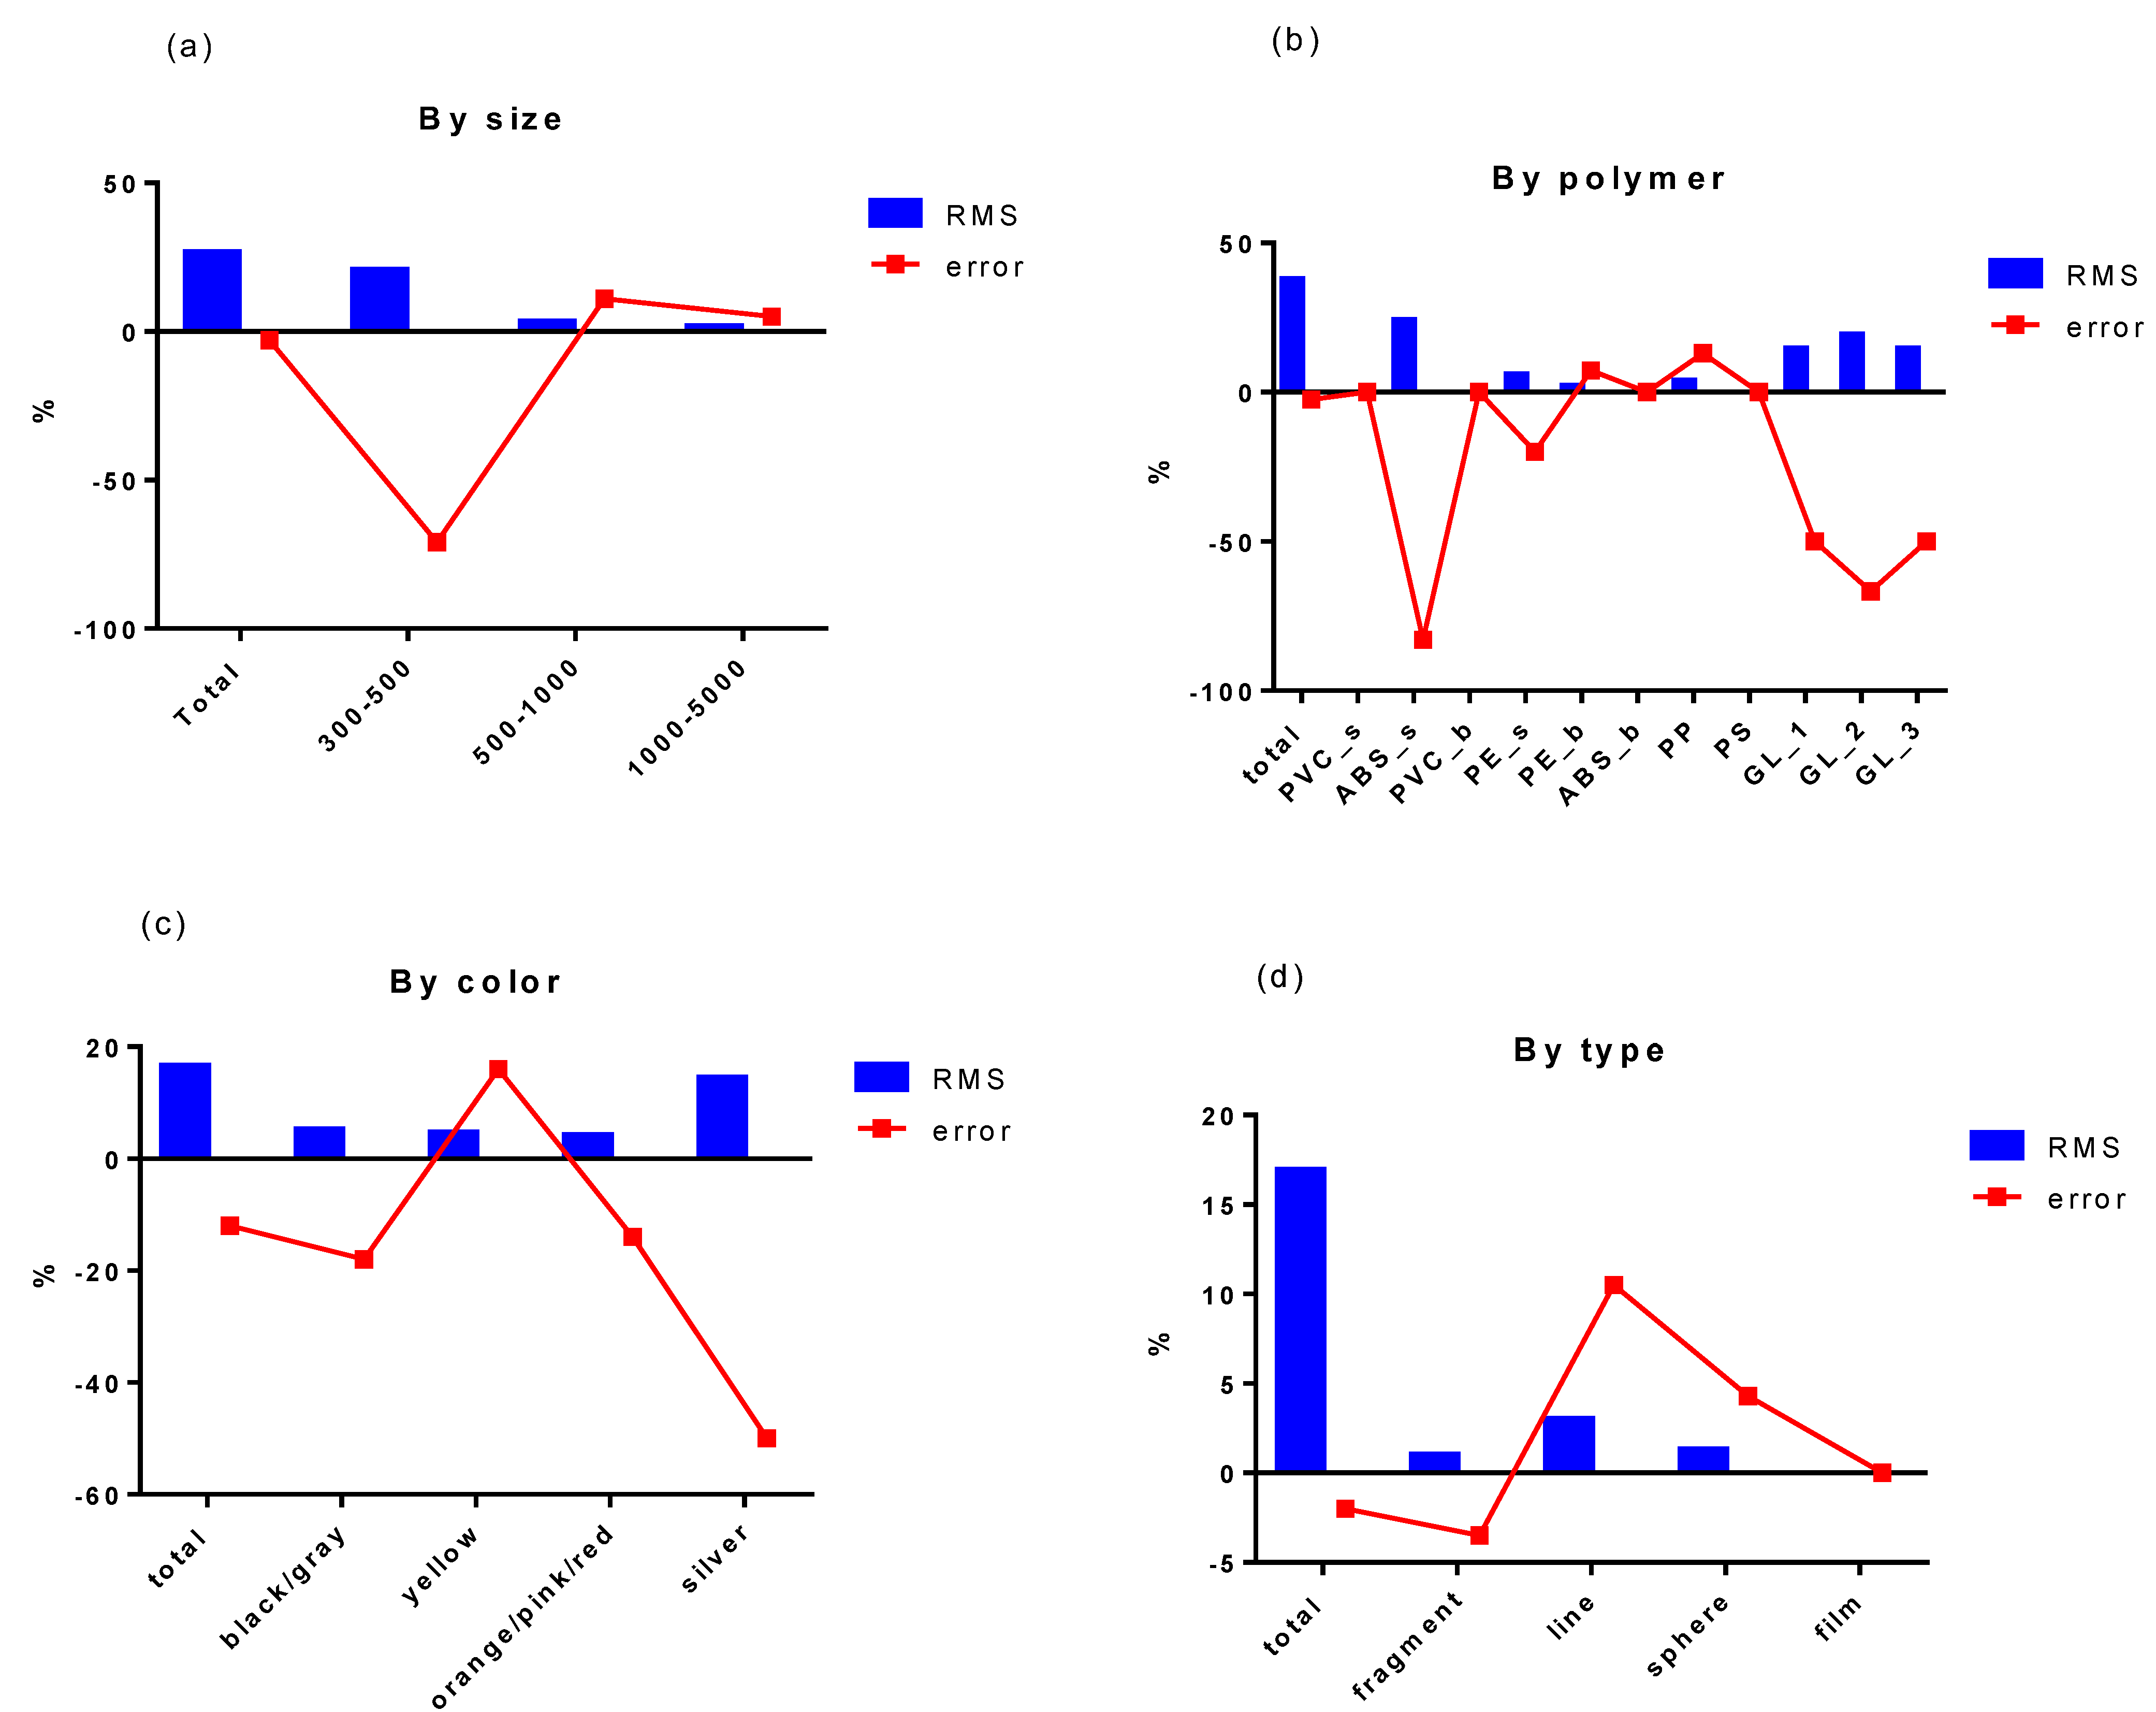
| RMS | 20.6 | 3.2 | 1.6 | 26.6 | 5.2 | 4.6 | 4.1 | 14.4 | 16.5 | 1.0 | 3.0 | 1.3 | 0.0 | 16.9 | ||
| error (%) | −71.4 | 11.1 | 5.5 | −2.6 | −17.9 | 15.8 | −14.3 | −50.0 | −11.6 | −3.5 | 10.5 | 4.3 | 0.0 | −2.4 | ||
| POLYMER TYPE | ||||||||||||||||
| PVC_s | ABS_s | PVC_b | PE_s | PE_b | ABS_b | PP | PS | GLITTER 1 | GLITTER 2 | GLLITTER 3 | TOTAL | |||||
| RMS | 0.0 | 24.1 | nd | 5.8 | 2.1 | 0.0 | 3.8 | 0.0 | 14.4 | 19.2 | 14.4 | 37.7 | ||||
| error (%) | 0.0 | −83.3 | nd | −20.0 | 7.3 | 0.0 | 13.3 | 0.0 | −50.0 | −66.7 | −50.0 | −2.5 | ||||
Publisher’s Note: MDPI stays neutral with regard to jurisdictional claims in published maps and institutional affiliations. |
© 2022 by the authors. Licensee MDPI, Basel, Switzerland. This article is an open access article distributed under the terms and conditions of the Creative Commons Attribution (CC BY) license (https://creativecommons.org/licenses/by/4.0/).
Share and Cite
Piccardo, M.; Priami, G.S.; Anselmi, S.; Bevilacqua, S.; Renzi, M. Intra-Laboratory Calibration Exercise for Quantification of Microplastic Particles in Fine-Grained Sediment Samples: Special Focus on the Influence of User Experience. Microplastics 2022, 1, 440-455. https://doi.org/10.3390/microplastics1030032
Piccardo M, Priami GS, Anselmi S, Bevilacqua S, Renzi M. Intra-Laboratory Calibration Exercise for Quantification of Microplastic Particles in Fine-Grained Sediment Samples: Special Focus on the Influence of User Experience. Microplastics. 2022; 1(3):440-455. https://doi.org/10.3390/microplastics1030032
Chicago/Turabian StylePiccardo, Manuela, Gabriele Salvatore Priami, Serena Anselmi, Stanislao Bevilacqua, and Monia Renzi. 2022. "Intra-Laboratory Calibration Exercise for Quantification of Microplastic Particles in Fine-Grained Sediment Samples: Special Focus on the Influence of User Experience" Microplastics 1, no. 3: 440-455. https://doi.org/10.3390/microplastics1030032
APA StylePiccardo, M., Priami, G. S., Anselmi, S., Bevilacqua, S., & Renzi, M. (2022). Intra-Laboratory Calibration Exercise for Quantification of Microplastic Particles in Fine-Grained Sediment Samples: Special Focus on the Influence of User Experience. Microplastics, 1(3), 440-455. https://doi.org/10.3390/microplastics1030032