Article

Impaired Growth Performance of Wami Tilapia Juveniles (Oreochromis urolepis) (Norman, 1922) Due to Microplastic Induced Degeneration of the Small Intestine

1
Department of Aquatic Sciences and Fisheries Technology, School of Aquatic Sciences and Fisheries Technology, University of Dar es Salaam, Dar es Salaam 60091, Tanzania
2
Department of Biology, College of Natural and Mathematical Sciences, University of Dodoma, Dodoma P.O. Box 259, Tanzania
3
Department of Chemistry, Dar es Salaam University College of Education, Dar es Salaam P.O. Box 2329, Tanzania
4
Department of Veterinary Anatomy and Pathology, Sokoine University of Agriculture, Morogoro P.O. Box 3016, Tanzania
5
Norwegian Research Centre (NORCE), Nygårdsporten 112, NO-5008 Bergen, Norway
*
Authors to whom correspondence should be addressed.
Microplastics 2022, 1(3), 334-345; https://doi.org/10.3390/microplastics1030025
Submission received: 13 May 2022 / Revised: 13 June 2022 / Accepted: 21 June 2022 / Published: 28 June 2022

Abstract

:
Microplastics-induced histopathological changes in gastrointestinal tracts of fish have been widely reported. However, the translation of adverse effects in the gut to impacts on growth are understudied. This study investigated the effect of MP-induced small intestinal histomorphological changes on growth performance of Oreochromis urolepis juveniles. Sixty larvae were exposed in control (0), 1, 10, and 100 polyethylene microplastic particles (PE MPs)/mL treatment groups. On day 65, juveniles were euthanized, dissected, and biometric data were taken. Small intestine histomorphological lesion index (HLI) was calculated following histological preparation using routine hematoxylin and eosin procedure. Results showed increase in HLI proportional to PE MPs exposure dose. These deteriorations equally reduced growth in final weight, weight gain and total length (One-Way ANOVA, p > 0.05), and Specific Growth Rate (SGR) (Kruskal–Wallis Test, p > 0.05), though there were insignificant differences between treatment groups. Condition factors of fishes in control and 1 PE MPs differed significantly and with other treatment groups (Tukey HSD, p < 0.05). Small intestines HLI correlated significantly with growth pattern (Spearman, r = 1.00, p = 0.01), condition factors (Pearson, r = −0.995, p < 0.05), final weight, weight gain, and total length (Spearman, r = −1.00, p = 0.01) but not with SGR. The allometric growth pattern changed towards isometric corresponding to increasing HLI. These findings suggest that MPs damaged small intestine structure and thus impaired digestion and nutrients absorption functions which disrupted growth. Such effects may impair juveniles’ ability to escape enemies, find food, and eventually reproduce, and therefore require further study.

Graphical Abstract

1. Introduction

The ubiquitous presence of plastic pollution in both marine and freshwater aquatic environments has been intensely researched with regards to their biotic interactions [1,2]. Water birds, invertebrates, gastropods, and fish are commonly found to contain microplastics (MPs, denoted as plastic < 5 mm) in their feces [3] and gastrointestinal tracts [4,5]. Such ubiquity reduces food accessibility and [6] and jeopardizes fish welfare [7]. Various studies reveal that the ingestion of MPs by fish [8] causes not only false satiation but also histopathological impairment with subsequent effects on physiological status [9,10,11,12,13].
Fish in the wild are vulnerable to MP ingestion and retention at all life stages from larvae [14] to adulthood [5], regardless of whether they are pelagic or benthic. The majority of MPs are less dense than water, but may flocculate or biofoul to become denser and sink to the bottom, making them available in all habitats across pelagic and benthic profiles [15,16]. Most fish undergo a feeding shift from filter feeders [17] to herbivores, carnivores, or omnivores [5,18] as exhibited by Oreochromis urolepis [19], which increase their susceptibility to MP intake. Therefore, fish can unintentionally ingest MPs by mistaking it for food or through the food chain by feeding on individuals in lower trophic level that contain MPs [20,21,22].
Fish growth is an aspect of interest in aquaculture and fisheries management due to its importance to yield and population size structure. Growth is influenced by intrinsic and extrinsic factors (e.g., food, oxygen, temperature, pH, pollution). Of these factors, food availability and assimilation is the most imperative factor influencing fish growth [23]. Fish exhibit a high growth rate when changing from larvae to juveniles which last until they reach maturity [24,25]. Attainment of desired size and weight is essential in escaping predators, searching for food, and fecundity size to ensure recruitment of adults and reproduction performance [26]. To compensate, fish take up a substantial amount of food from their habitats through well-developed feeding modes to sustain their needs [20]. Such demand coupled with the availability of plastics facilitate MPs intake. Studies on retrieval of MPs from gastrointestinal tracts [5,8,27] and their damage are under broad scrutiny. However, the information of the effect of MPs ingestion on fish growth is limited both in Africa and globally.
The effects of MPs in fish guts are relatively well studied. Physical damage in gastrointestinal tracts have been widely reported on various fish species [13,28,29]. O. niloticus exposed to a various dose of MPs for 15 d revealed proportional degeneration of a number of intestinal cells [28]. Girella laevifrons treated with MPs for 45 d showed severe inflammation and regressive change to intestinal tissues. Like most histopathological studies, the aforementioned studies did not investigate growth as an endpoint. Moreover, the few studies elucidating the influence of MPs to growth have not been linked with a histopathological aspect. For example, Cyprinus carpio larvae exposed to polyvinyl chloride MPs for 60 days revealed inhibition of growth and oxidative stress [30].
Our previous study investigated the ingestion of fluorescent green polyethylene microsphere (denoted as ‘PE MPs’) by Wami Tilapia (Oreochromis urolepis) (Norman, 1922) and their histomorphological impact after exposure and depuration phases [13]. We found that small intestine histological tissues were damaged, and the effect persisted even after the depuration period. Owing to the digestive and absorption functions of small intestines, their damage may lead to malnutrition and stress that are likely to impair physiology of fish including growth. However, studies coupling histopathological effects of MP exposure to fish growth are scarce.
Following our previous research [13], the present study aimed to investigate the association between MPs-induced degeneration of small intestine with growth impairment of Oreochromis urolepis [31]. Fish were chronically exposed (65 days) to concentrations of 1, 10, and 100 PE MPs/mL and whilst the highest concentration exceeds environmental relevance, such high doses are commonly employed within experimental studies to determine the potential effects and mechanisms of MP exposure to aquatic biota [32,33,34]. Similarly, whilst it is also established that pristine microbeads lack environmental relevance, again the use of a standard MP type is well described in the ecotoxicological literature [32,33,34]. It is hypothesized that chronic exposure to PE MPs would cause intestinal damage of Oreochromis urolepis growing from larvae to juveniles, leading to nutritional deficit and an eventual effect on fish growth performance.

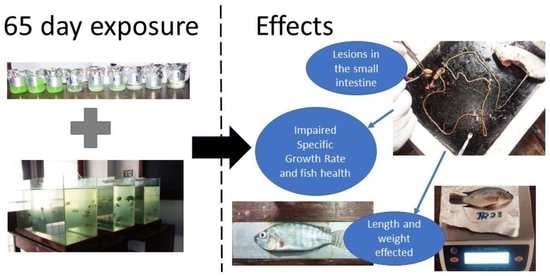
2. Materials and Methods

2.1. Fish Larvae (Fries) Production

Adult O. urolepis Eccles [31] fish were introduced into concrete tanks of approximately 6.7 m3 filled to 80% of their volume with freshwater at the University of Dar es Salaam Kunduchi campus. The 24 h acclimatized fish were fed twice a day with commercial feeds (De Heus, Lot A4, Vinh Long province, Vietnam) equal to 5% of body weight until fertilization. The fertilized eggs were then transferred into an indoor hatchery. Five days post-hatching larvae (fries) were randomly distributed between 12 aerated 100 L aquaria having 40 L filtered freshwater at a photoperiod cycle of 16: 8 h light and dark.

2.2. PE MPs Exposure Dose Preparation

The PE MPs with a density of 1.00 g/cc (product ID of UVPMS-BG) and size range 38–45 μm were purchased from Cospheric LLC, Santa Barbara, CA 93160, USA, order # 117,025, and were similar to those used by Mbugani et al. [13]. Tween 80 surfactants (product number: P8074) were supplied by Sigma-Aldrich (Sigma-Aldrich, 3050 Spruce Street, Saint Louis, MO 63103, USA).
The 1, 10, and 100 PE MPs/mL treatments were prepared in triplicates equivalent to 0.0031 g, 0.0308 g, and 0.3077 g of PE MPs in 40 L of filtered and dechlorinated freshwater respectively. Each suspension was prepared first by adding a given concentration of PE MPs in 20 mL from stock solution made by mixing 0.5 mL (0.1%) Tween 80 Bio-compatible surfactant with 500 mL of hot distilled water, thoroughly mixed by shaking with WiseShaker Model SHR-2D at 150 rpm for a duration of an hour. The resulting suspension was poured into the aquaria of the respective treatment group when the fish larvae were introduced.

2.3. Experimental Exposure Set Up

Twenty fish larvae (fries) weighing approximately 0.015 ± 0.004 g to 0.017 ± 0.003 g were stocked in each triplicate aquaria of control (no MPs), 1, 10, and 100 PE MPs/mL treatment groups. Initially, fries were fed with powdered feed equal to 10% of body weight in three portions per day which changed according to fish growth size, similar to Mbugani et al. [13]. In the last month, fish were fed 5% of body weight juvenile pellets (protein content 40%). Eighty percent of water was renewed and, except control, immediately spiked by the respective dose of PE MPs in every two days. All aquaria were aerated to enhance oxygen concentration in water. Water temperature and pH were measured twice a day while oxygen twice a week. Ammonia concentrations were measured once a week.

2.4. Examination of PE MPs Ingestion and Determination of Growth Performance

On day 65 of exposure, 12 h past the last feeding, juvenile fish were introduced into a 2 L beaker filled three-quarters with distilled water, euthanized with four drops of clove oil, weighed, and their total length measured. Some growth performances were determined from the following equations:
The length–weight relationship equation (Equation (1)) as used by Maganira et al. [25]:
W   =   aL b
when log transformed is expressed as (Equation (2))
LogW   =   Loga   +   bLogL
where the value of ‘b’ is 3 for isometric growth pattern fish and <3 or >3 for those exhibiting allometric growth patterns. It is advised to calculate the value of ‘b’ because 3 is not uniform across fish age class and for the majority of fish species [25]. The ‘b’ value of each treatment group was substituted to calculate condition factors (indices) of fish according to Fulton’s equation (Equation (3)):
K   = 100 Wf L b
Specific Growth Rate (SGR) is calculated according to Crane et al. [35] (Equation (4)):
SGR   ( %   day 1 ) = ( e g 1 ) × 100
where: Wf = Final weight of fish (g); Wi = initial weight of fish; L = Total final length of fish (cm); a = Rate of change of weight with length (intercept); b = Weight per unit length (slope) or growth pattern; K = Condition factor; T = duration of PEs exposure period; and g = instantaneous growth rate (Equation (5)).
e g = ( Wf Wi ) 1 T
Weight   gain   =   Wf Wi
For PE MPs ingestion examination, half of the small intestine (estimated duodenum to jujenum) were introduced into a Sedgewick rafter and observed under fluorescent microscope using 485 nm light filter. Another section of small intestine (estimated part of jujenum and ileum) of approximately 3 cm was digested in 10 mL of KOH in a water bath according to Karami et al. [36] with modifications on the incubation period of 72 h. The average amount of MPs were determined by counting from triplicate volumes of digest.

2.5. Small Intestine Histomorphological Lesion Indices Diagnosis

The small intestine tissue sections from jujenum and ileum were collected and immediately fixed in 20 mL of 10% buffered formaldehyde for 48 h. Thereafter, the tissues were processed and stained with hematoxylin and eosin following a standard procedure [13]. The small intestine histomorphological lesions indices were obtained after evaluation of villi, epithelial cells, cryptic gland and goblets cells damages, leucocyte infiltration, and blood congestion according to Bernet et al. [37]. Each lesion was assigned an importance factor and the degree of observed damage was scored. The reaction indices were obtained by multiplying the importance factors and score values. The degree of damage of an organ (small intestine) was represented by the organ index, which was the sum of its reaction indices.

2.6. Data Analysis

Data were checked for normality using Shapiro–Wilk Test and homoscedacity with Levene Test, and non-parametric data were log transformed. One-Way ANOVA was used to compare means between treatments, followed by Tukey HSD post-hoc Test. Where parametric conditions were unfulfilled even after log-transformation of data, Kruskal–Wallis test was applied followed by Dunn test. Chi-square Goodness-of-fit test tested whether the occurrence of histomorphological lesion indices between treatment groups was significantly different. The association of small intestinal histomorphological lesion indices with growth performance were determined by Correlation test. In all cases, data were considered significant different when p-value ≤ 0.05. All statistical data analyses were performed using IBM SPSS Statistics version 23 for Windows. The graphs were drawn using Python version 3.10.

3. Results

3.1. Water Quality Parameters

All water parameters remained within the optimal range for O. urolepis growth. The means of dissolved oxygen and temperature between treatment groups were not significant different (Table 1). The mean pH values varied significantly between control and 10 MP PE/mL, as well as control and 100 MP PE/mL treatment groups (One-Way ANOVA, Tukey HSD, p < 0.05). Dissolved ammonia was fluctuating but did not exceed 0.176 mg/L as prevented by regular two-day interval water renewal.

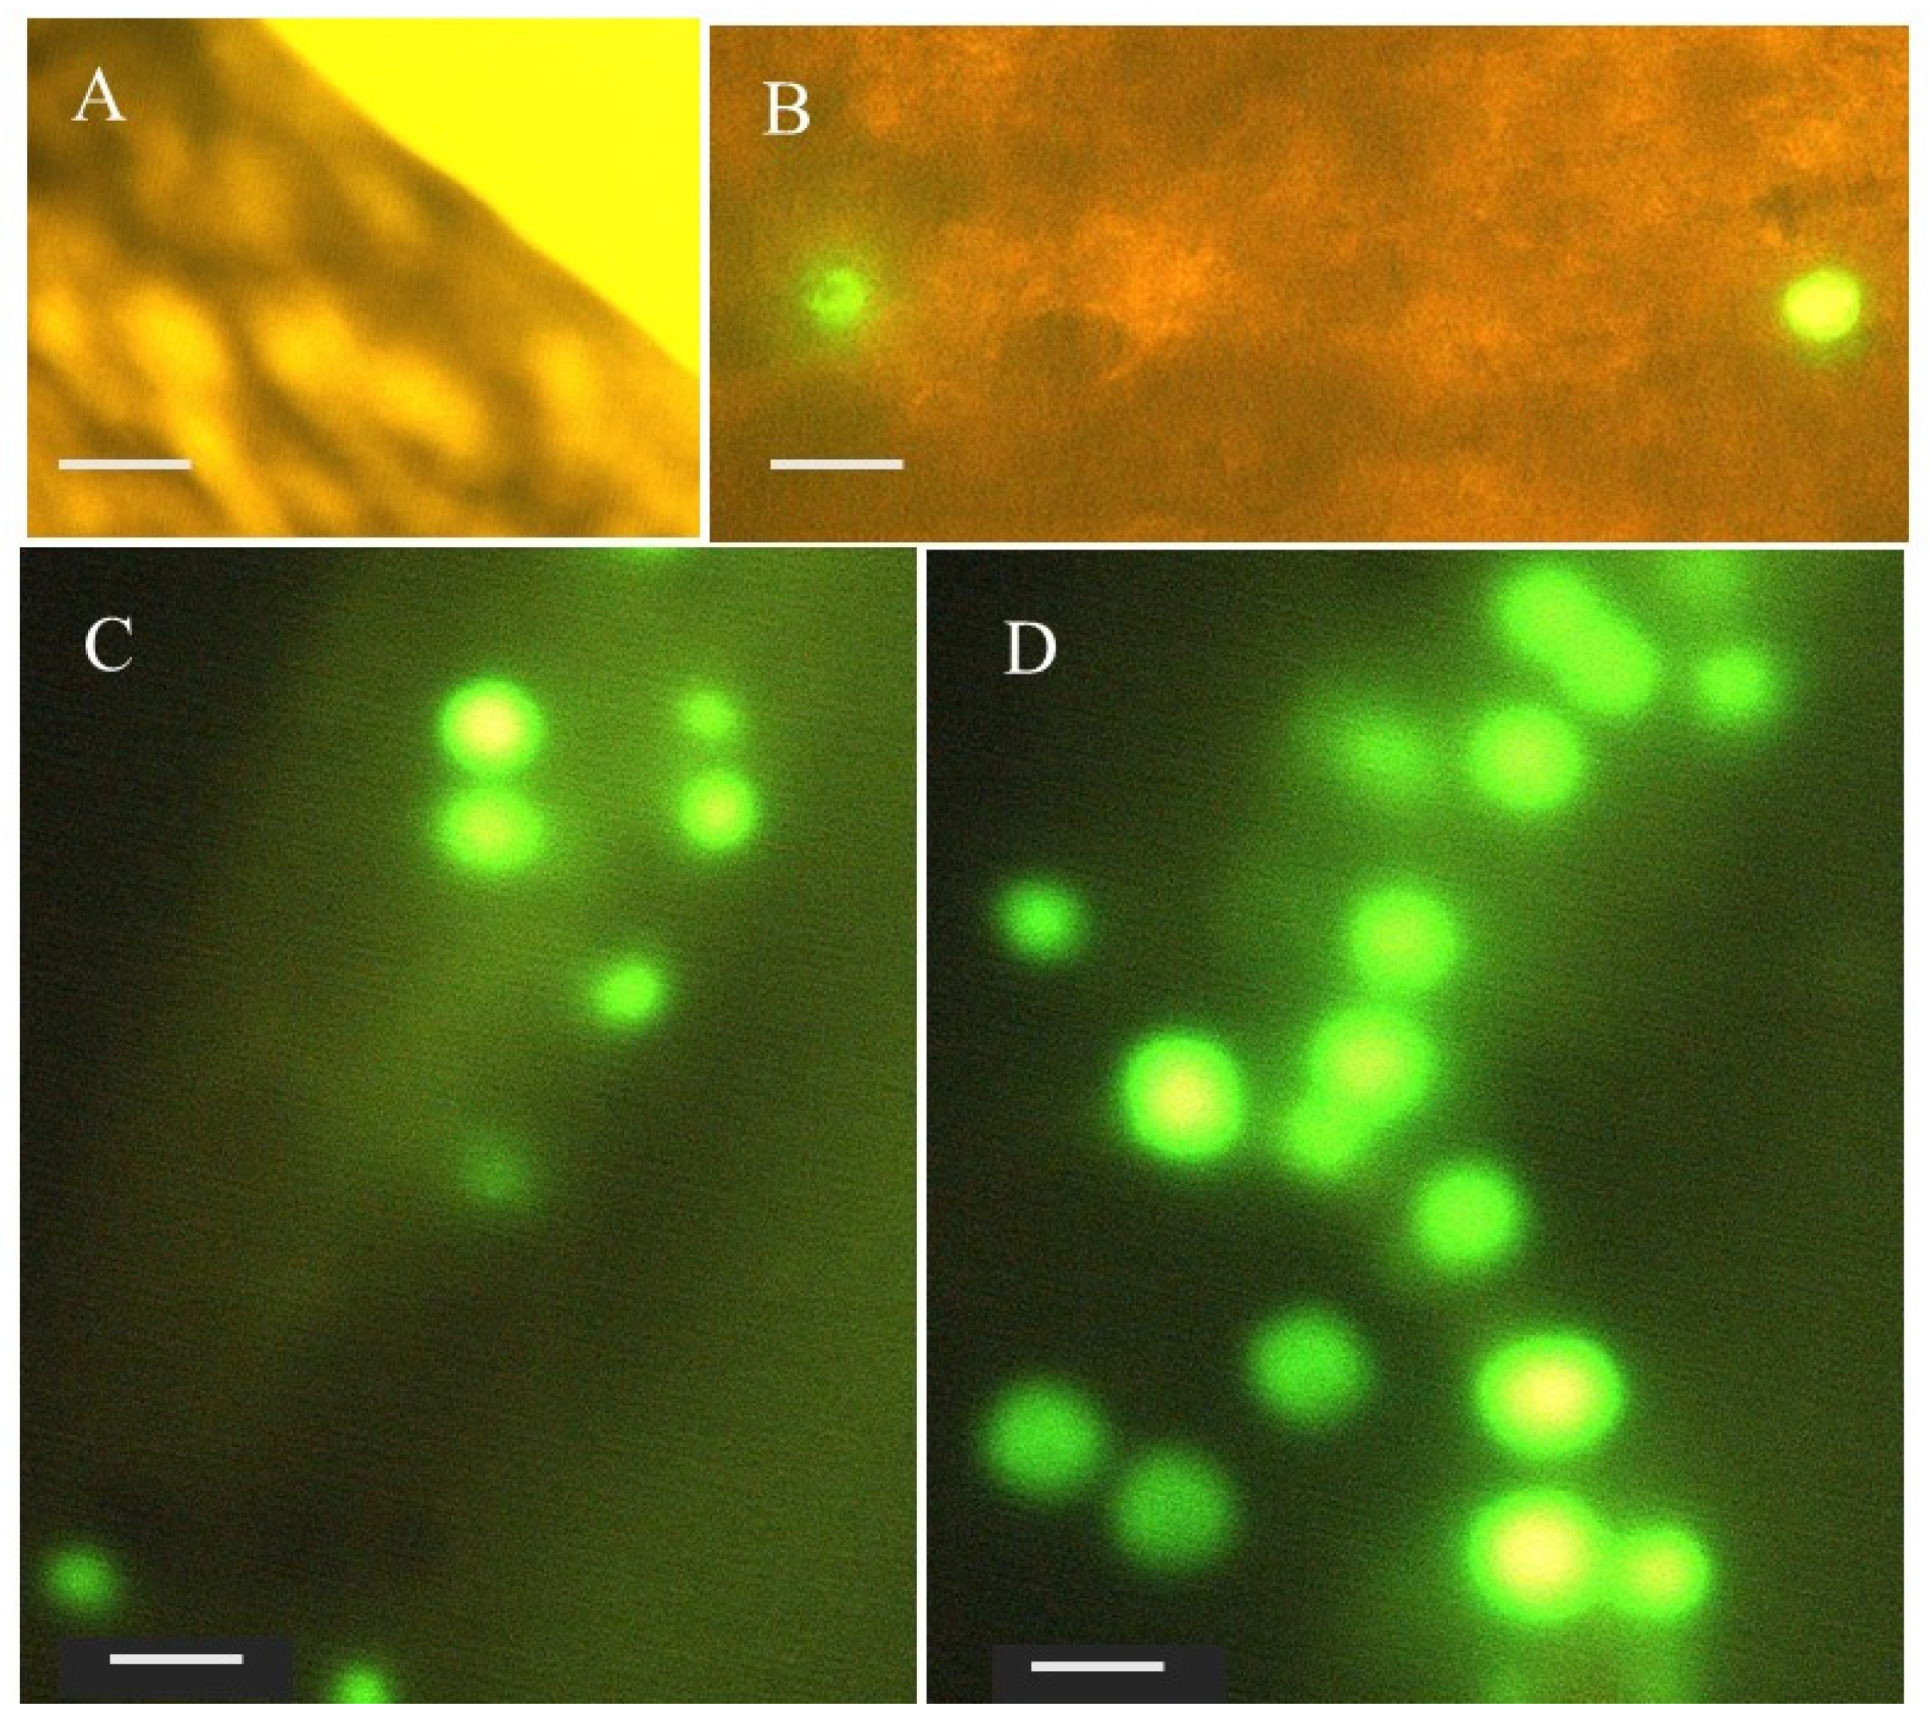
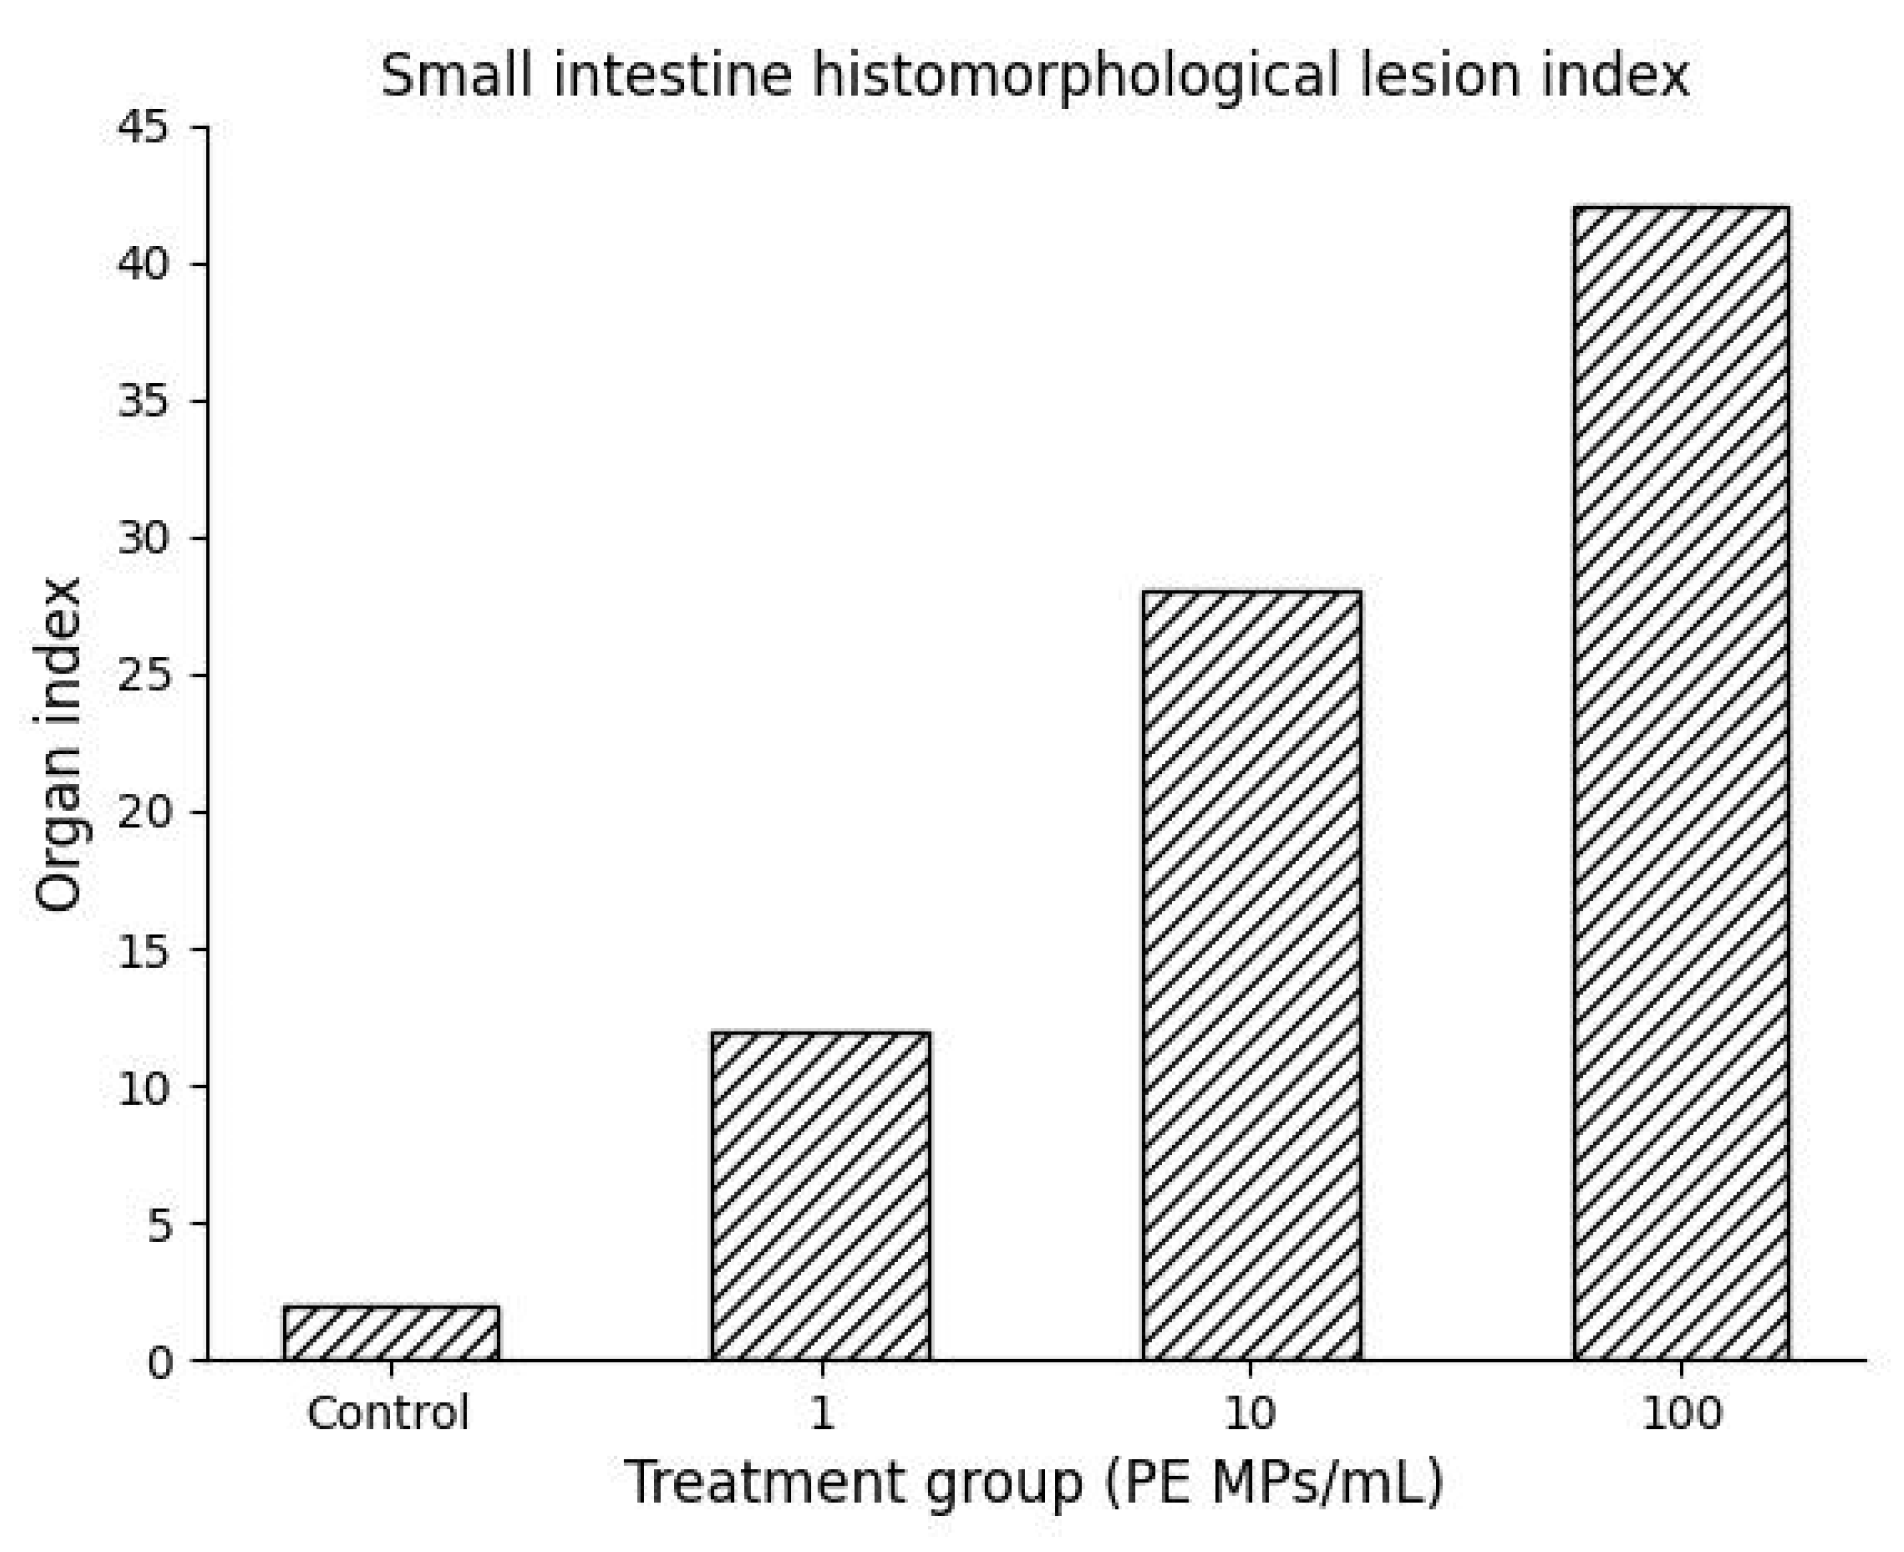
3.2. PE MPs Ingestion and Small Intestines Histomorphological Alteration

No PE MPs were found in small intestines of O. urolepis juveniles in the control group. A progressive increase was observed in fish juveniles proportional to PE MPs exposure dose (Figure 1).
The occurrence of histomorphological lesion indices in the small intestine of fish significantly increased with PE MPs dose (χ2 = 44.38; df = 2; p < 0.05). The detailed lesions are summarized in Table 2 and Figure 2.

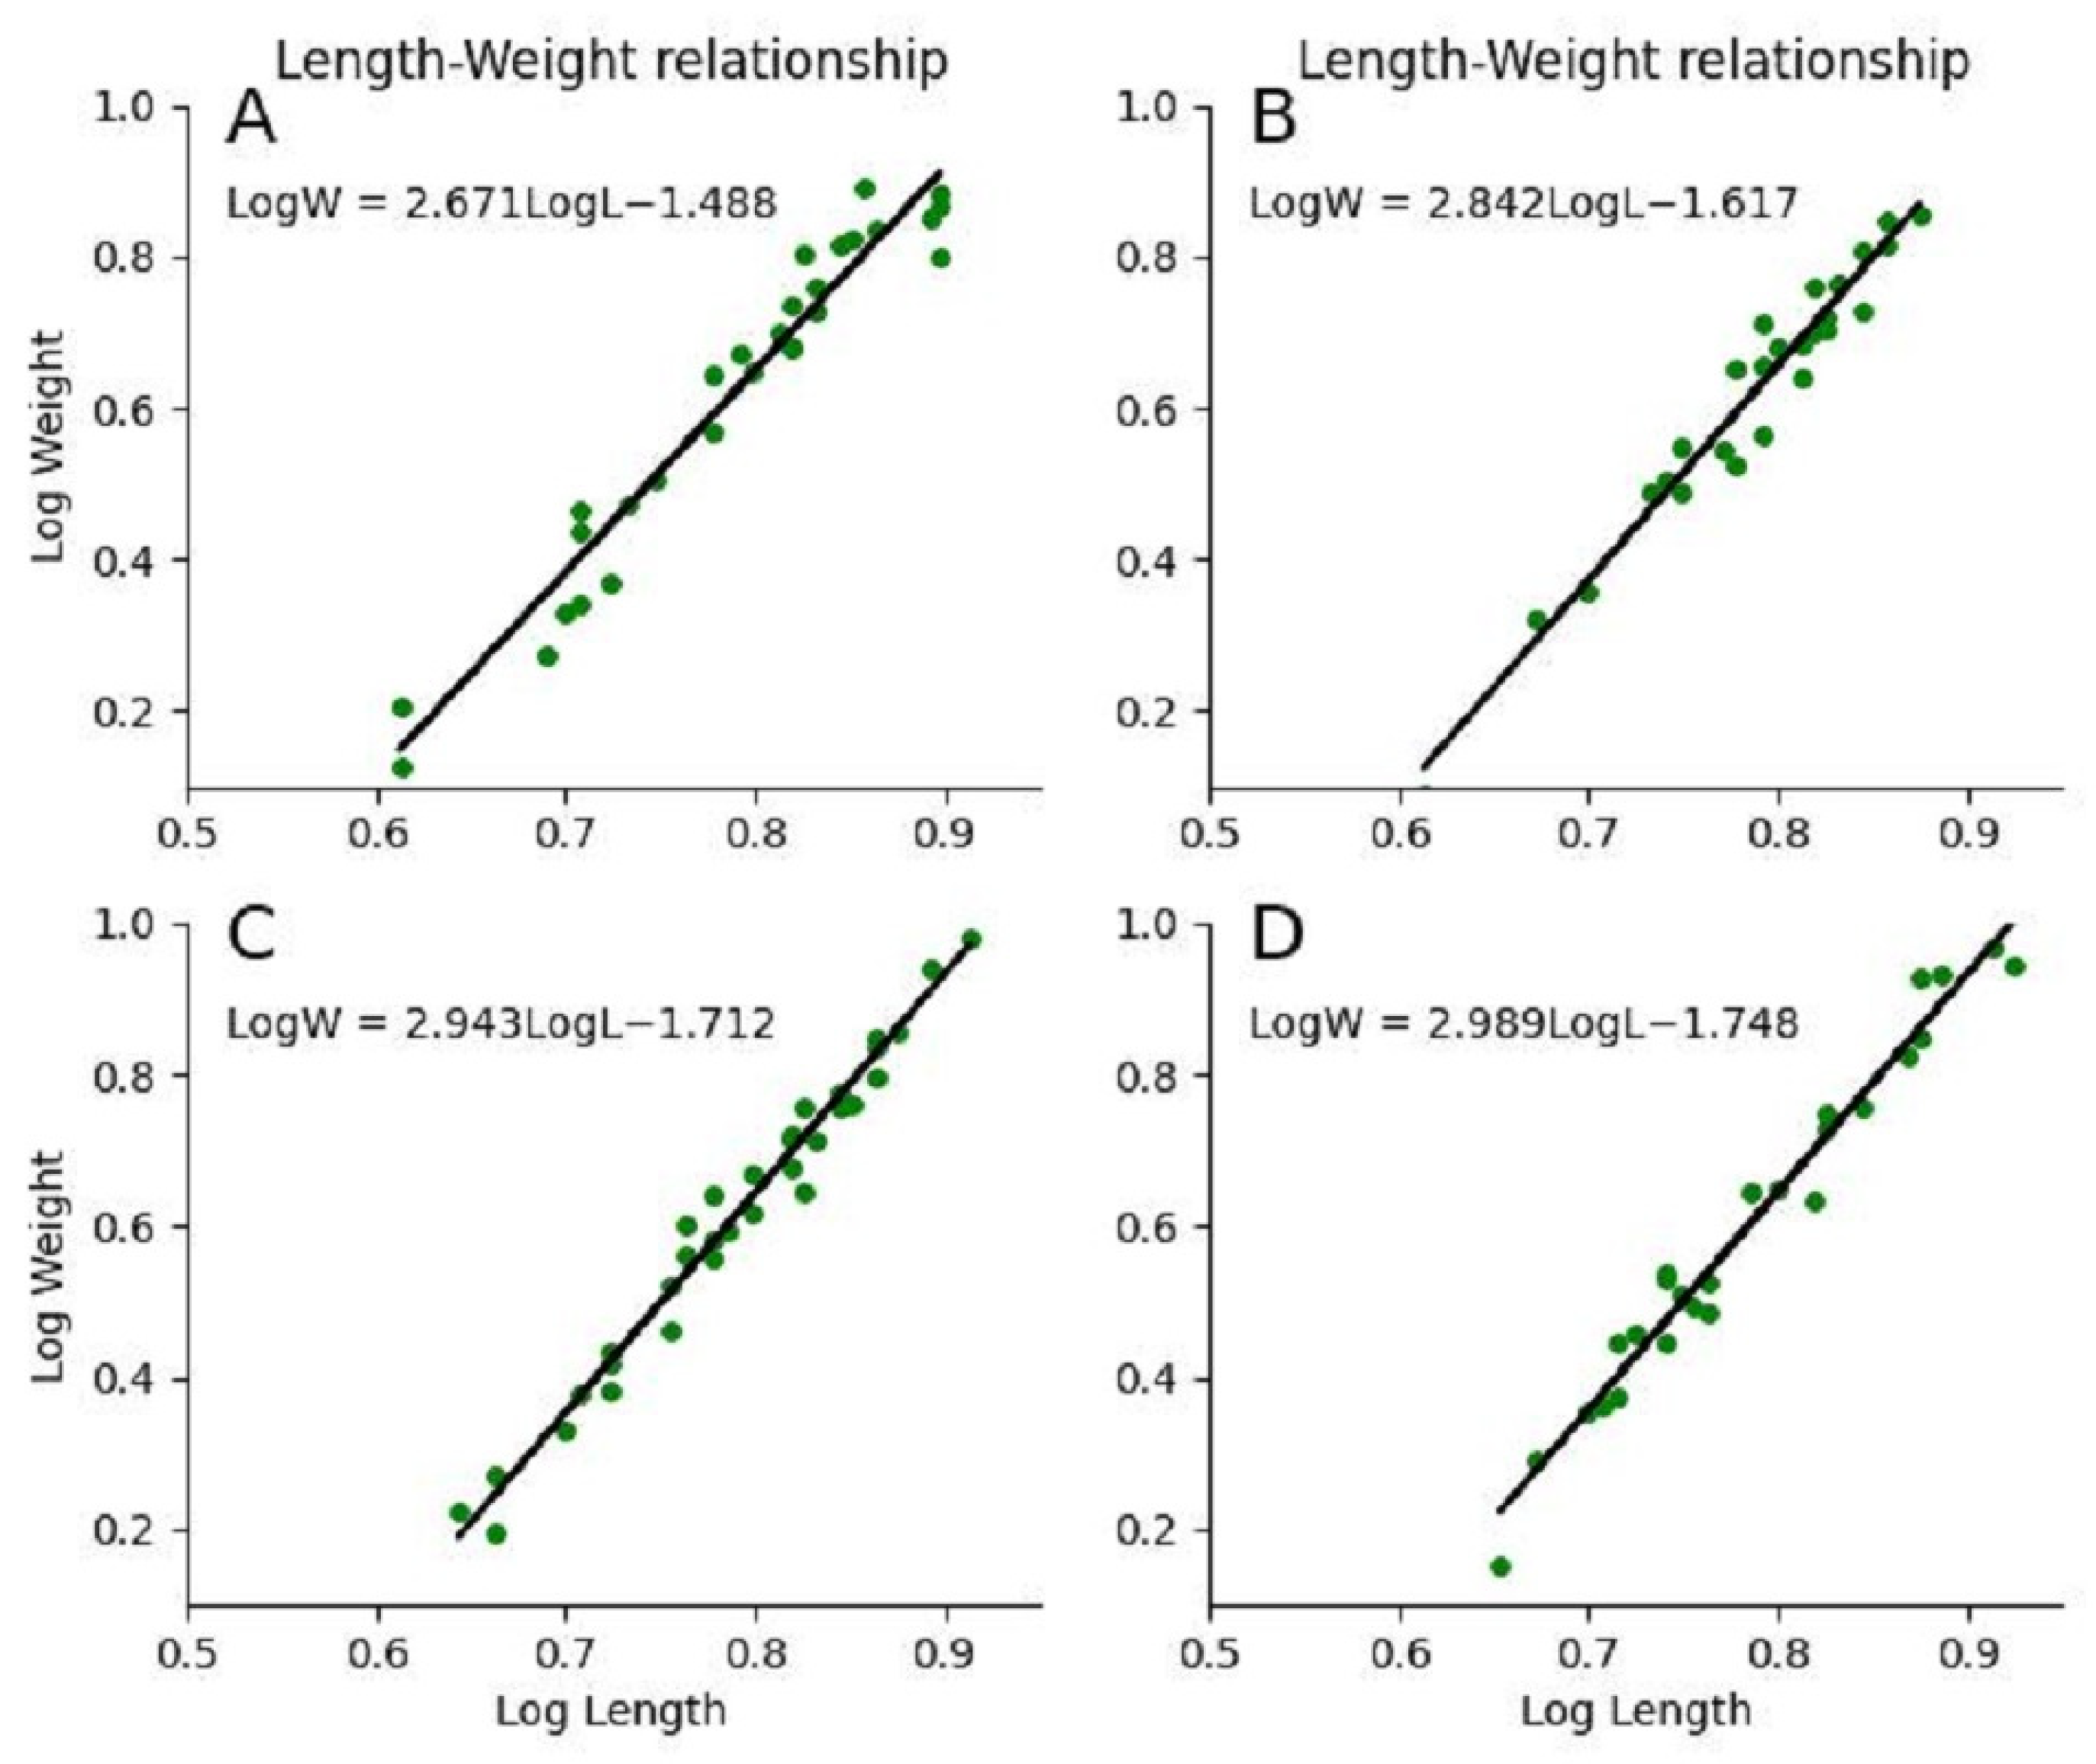
3.3. Effect of Histomorphological Damage on Growth Performance

All data for total length, final weight, weight gain, and condition factors conformed to normality and homoscedasticity conditions (p > 0.05) except SGR. The R2 values indicated a strong relationship between fish weight and length which increased with PE MP exposure dose (Figure 3 and Table 3). In comparison, growth patterns and the means of final weights, weight gain, total lengths, SGR, and condition factors of fish juveniles varied between treatment groups (Table 3). The measured means of total lengths size, final weights, and weight gain of fishes declined with increased PE MPs exposure dose, although not significantly (One-Way ANOVA, p > 0.05). Fish condition factors which entail information about fish health status differed significantly between treatment groups (one-Way ANOVA, p < 0.05). The highest means value of condition factor was computed for the control group and declined significantly with the addition of PE MPs exposure dose in treatment groups (Figure 4). The post-hoc test revealed significant variation of control and 1 PE MPs/mL groups, and with the rest of treatment groups (Tukey HSD, p <0.05) but an insignificant variation between 10 and 100 PE MPs/mL (Tukey HSD, p > 0.05). The SGR varied between treatment groups relatively similar in trend as condition factors, though insignificant (Kruskal–Wallis Test, p > 0.05; Table 3).
Fish small intestinal histomorphological lesion indices correlated strongly significantly with growth pattern (Spearman, r = 1.00, p = 0.01), and means of condition factors (Pearson, r = −0.995, p < 0.05), final weight, weight gain, and total length (Spearman, r = −1.00, p = 0.01) but not with SGR (Spearman, r = −0.80, p > 0.05). All treatment groups displayed negative allometric growth patterns (Table 3).

4. Discussion

4.1. Ingestion of MPs and Associated Histomorphological Changes

The results of the current study showed that the ingested PE MPs significantly inflicted histomorphological alterations in small intestines of O. urolepis juveniles in PE MPs in a dose-dependent manner. Lei et al. [38] observed cracking of villi and splitting of enterocytes upon exposure of adult zebrafish (Danio rerio) to a mixture of MPs types with size of 70 μm for 10 days. The 90 days chronic exposure of European sea bass (Dicentrarchus labrax) to polyvinyl chloride resulted in the detachment of mucosal epithelium from the lamina propria, fusion and beheading of villi, and hyperplasia of goblet cells at the top of the villi on the 60th day [39]. Apart from Ahrendt et al. [29], who applied a pathological lesion indices evaluation tool, corroborating our study, the majority of studies did not reach that length of observation. It was concluded that presence of MPs in the small intestine causes histopathological lesions and compromises nutrients availability and energy metabolism, leading to significant deterioration of fish welfare [9].

4.2. Effect of Histomorphological Alteration on Growth Performance

Under normal environmental conditions and good nutritional status, tilapians length increases exponentially from larvae to juveniles and declines towards adulthood, unlike their weight [25,40]. To achieve this, younger fish consume a substantial amount of food if available to extract sufficient nutrients using numerous villi covered with microvilli to enhance surface area for absorptive function of the small intestines [41]. As a result, juvenile fish exhibit a more negative allometric pattern than adult fish [42]. In our study, despite supplying a relatively similar quantity of feed to all treatment groups, a variation in growth occurred. It is regarded that small intestines PE MPs-induced damage impaired digestion and absorption processes in fish. This led to malnutrition and subsequent energy and nutrients deficit, resulting in retardation in length and decline in final weight and weight gain (Table 2) of the exposed fish. The growth patterns of our juvenile fish exposed to the highest dose of PE MPs were relatively close to adult O. urolepis [25,43], reflecting the effect of MP-induced small intestine malfunction. The similar results were obtained after exposing planktivorous reef fish (Acanthochromis polyacanthus) [44] and glassfish (Ambassis dussumieri) [45] to MPs particles, besides lacking a histopathological explanation. Our recent study showed that ingestion does lead to intestinal damage [13], and here we demonstrated the impact of that damage as being a departure from the conventional growth of tilapia juveniles as further affirmed by coefficient of determination (Table 3).
Condition factors convey information on fish health status and whether a fish can make good use of its food source [40,46], leading to growth. In a given fish species, condition factors normally change due to age class [25], season, sex, environmental conditions [47], and slightly due to population density [40]. Evidence of decline in condition factors were reported in O. urolepis [25,48], O. niloticus [47], and Anguilla Anguilla [49] due to hypersalinity, season, and pollution respectively. Salinity, season, and age, however, could not be regarded as the main source of variation in our study as water and fish larvae came from a single source and almost all water quality parameters (temperature, oxygen, ammonia, salinity) were relatively constant. The recorded significant variation of pH was largely due to possible dissolution of carbon dioxide formed by respiration, but nonetheless lied within the optimal growth range for tilapia [50]. Tran-Duy et al. [23] revealed that small-weight fish consume a substantial amount of oxygen and release a corresponding amount of carbon dioxide, as exhibited by our fish, resulting in the decline of pH converse to the increase in MPs dose. PE MPs-induced damage to O. urolepis small intestine, as supported by Qiao et al. [10] and Lei et al. [38], might have caused oxidative stress and insufficient nutrient assimilation that impaired condition factors. The condition factor in our control group fish was high compared with those of hybrid of O. niloticus and O. urolepis juveniles stocked in varying stocking density for 63 d [40]. In our study, condition factor decreased with the rise in PE MPs-induced histomorphological lesion indices (Figure 2). Girella laevifrons [20] collected from MPs prone intertidal pools showed a similar trend despite lacking information on intestinal histormophological status, which was later demonstrated by Ahrendt et al. [29] using poly (styrene-co-divinylbenzene) MPs.
In most fish species, SGR typically declines with increasing in fish body weight [51]. Conversely, other studies reveal that SGR of O. urolepis is directly proportional to the weight gain [40,48], which is similar to our study. Within fish species, however, the variation in SGR is influenced by age and extrinsic factors such as salinity [48], temperature, ammonia, pH, and oxygen [23,52], which in our study all lied within the optimal range of fish growth. Studies reported high SGR in low stocking density [40], with salinity of 25 and high oxygen concentration in O. nilotius sub-adults [23]. In our study, fish abundance was relatively similar in all treatment groups, and hence stocking density did not account for variation in growth performance. These means oxygen concentrations were similar, despite being below the recommended value of 5 mg/L for tilapia in the 10 PE MPs/mL treatment group [25]. However Shoko et al. [50] described that omnivorous fish including O. urolepis have low metabolic rates and require relatively low quantities of oxygen. Therefore, PE MPs-induced histomorphological impairment of fish small intestine remains the sole reason for the variation of SGR between treatment groups, although insignificant.
In the natural setting, climate and fishing have been influencing fish growth at different scales [53]. Climate change heavily affects the nutrient supply, habitat, fishing, and adaptation [53]. The recent recognition of plastics as an emerging pollutant have worsened the already existing problem [54]. Their ubiquity in pelagic zones may smoothen phytoplankton, which comprise the foundation of food chain, impairing primary production and eventual food availability to fish. On the other hand, ingestion of plastics induces false satiation, and may cause gastrointestinal blockage and histopathological damage to fish [13]. This may lead to starvation or reduced growth [55].
Research on MPs interaction with freshwater fish including Oreochromis spp is scarce [1] and in most cases uses juveniles or adults [45]. Attempting to correlate histomorphological damage to growth is ecologically vital, but it is important to note that the concentrations, type, and size of MPs employed in our study are not typical of those encountered in freshwater bodies studies in Africa or globally [6,56,57]. Such high exposures with a standard homogenous bead particle are commonly found in literature with the justification of trying to understand the effects and mechanisms of MP exposure [13,29,34,58,59]. Extending MP research to include greater environmental realism with respect to a diversity of shapes, sizes, morphologies, and aging is a current concern [32,33,34,59,60]. Nevertheless, the present study elucidates an important insight into the effects on growth and threat may extend to recruitment of larvae and juvenile fish in nursery grounds [45] and have an impact at the population level.

5. Conclusions

Freshwater ecology supports a multitude of organisms and provides numerous sources of proteins, particularly to land-locked countries in Africa and across the globe. As a result, they are under huge pressure for resources and from indiscriminate pollution including by plastics. This study showed how MP exposure to the newborn O. urolepis fish may affect digestive and absorptive function of the small intestine, leading to nutrient deficit and subsequent impairment on growth and fish health.
Therefore, the existing trend of plastic, both macro and micro, production and its input into aquatic environments may interfere with energy uptake and the process of larvae recruitment to adult fish. The decline in fish size has a great impact on fecundity as small-bodied fish produce few eggs. Moreover, the resulting malnutrition may impair the reproductive capability of fish, which requires further investigation. Moreover, the stunted growth in fish may result in small-sized fish that jeopardize the human economy and food security. Future studies on the effect of MPs on reproduction are required.

Author Contributions

Conceptualization, J.J.M., D.A.S. and F.R.K.; methodology, J.J.M. and D.A.S.; software, J.J.M. and W.H.K.; validation, J.J.M., D.A.S., D.J. and F.R.K.; formal analysis, J.J.M. and W.H.K.; investigation, J.J.M. and D.A.S.; resources, J.J.M., D.A.S., J.F.M. and D.J.; data curation, J.J.M., W.H.K. and F.R.K.; writing—original draft preparation, J.J.M.; writing—review and editing, F.R.K., D.A.S. and W.H.K.; visualization, D.A.S. and W.H.K.; supervision, D.A.S., F.R.K. and J.F.M.; project administration, D.A.S. and D.J.; funding acquisition, D.A.S., F.R.K. and D.J. All authors have read and agreed to the published version of the manuscript.

Funding

This research was funded by WIOMSA under MASMA MICROMARINE PROJECT, grant number MASMA/OP/2018/03 and United Republic of Tanzania under Ministry of Education, Science and Technology under funding number FB.100/294/01/83.

Institutional Review Board Statement

The animal study protocol was approved by the Office of Deputy Chancellor Research of the UNIVERSITY of DAR ES SALAAM.

Data Availability Statement

The data presented in this study are available on request from the corresponding author.

Acknowledgments

Authors acknowledge technical assistance offered by Michael Stewart Kellwa and Richard. Authors also thank WIOMSA and United Republic of Tanzania under Ministry of Education, Sciences and Technology for funding.

Conflicts of Interest

The authors declare no conflict of interest.

References

  1. Lusher, A.; Hollman, P.; Mendoza-Hill, J. Microplastics in Fisheries and Aquaculture: Status of Knowledge on Their Occurrence and Implications for Aquatic Organisms and Food Safety; FAO Fisheries and Aquaculture Technical Paper: Rome, Italy, 2017. [Google Scholar]
  2. Schmidt, C.; Krauth, T.; Wagner, S. Export of Plastic Debris by Rivers into the Sea. Environ. Sci. Technol. 2017, 51, 12246–12253. [Google Scholar] [CrossRef] [PubMed]
  3. Reynolds, C.; Ryan, P.G. Micro-plastic ingestion by waterbirds from contaminated wetlands in South Africa. Mar. Pollut. Bull. 2018, 126, 330–333. [Google Scholar] [CrossRef] [PubMed]
  4. Khan, F.R.; Shashoua, Y.; Crawford, A.; Drury, A.; Sheppard, K.; Stewart, K.; Sculthorp, T. ‘The Plastic Nile’: First Evidence of Microplastic Contamination in Fish from the Nile River (Cairo, Egypt). Toxics 2020, 8, 22. [Google Scholar] [CrossRef] [PubMed] [Green Version]
  5. Biginagwa, F.J.; Mayoma, B.S.; Shashoua, Y.; Syberg, K.; Khan, F.R. First evidence of microplastics in the African Great Lakes: Recovery from Lake Victoria Nile perch and Nile tilapia. J. Great Lakes Res. 2016, 42, 146–149. [Google Scholar] [CrossRef]
  6. Yuan, W.; Liu, X.; Wang, W.; Di, M.; Wang, J. Microplastic abundance, distribution and composition in water, sediments, and wild fish from Poyang Lake, China. Ecotoxicol. Environ. Saf. 2019, 170, 180–187. [Google Scholar] [CrossRef] [PubMed]
  7. Arias, A.H.; Ronda, A.C.; Oliva, A.L.; Marcovecchio, J.E. Evidence of Microplastic Ingestion by Fish from the Bahia Blanca Estuary in Argentina, South America. Bull. Environ. Contam. Toxicol. 2019, 102, 750–756. [Google Scholar] [CrossRef]
  8. Merga, L.B.; Redondo-Hasselerharm, P.E.; Van den Brink, P.J.; Koelmans, A.A. Distribution of microplastic and small macroplastic particles across four fish species and sediment in an African lake. Sci. Total Environ. 2020, 741, 140527. [Google Scholar] [CrossRef]
  9. Qiao, R.; Deng, Y.; Zhang, S.; Wolosker, M.B.; Zhu, Q.; Ren, H.; Zhang, Y. Accumulation of different shapes of microplastics initiates intestinal injury and gut microbiota dysbiosis in the gut of zebrafish. Chemosphere 2019, 236, 124334. [Google Scholar] [CrossRef]
  10. Qiao, R.; Sheng, C.; Lu, Y.; Zhang, Y.; Ren, H.; Lemos, B. Microplastics induce intestinal inflammation, oxidative stress, and disorders of metabolome and microbiome in zebrafish. Sci. Total Environ. 2019, 662, 246–253. [Google Scholar] [CrossRef]
  11. Solomando, A.; Capo, X.; Alomar, C.; Alvarez, E.; Compa, M.; Valencia, J.M.; Pinya, S.; Deudero, S.; Sureda, A. Long-term exposure to microplastics induces oxidative stress and a pro-inflammatory response in the gut of Sparus aurata Linnaeus, 1758. Environ. Pollut. 2020, 266 Pt 1, 115295. [Google Scholar] [CrossRef]
  12. Hamed, M.; Soliman, H.A.M.; Osman, A.G.M.; Sayed, A.E.H. Assessment the effect of exposure to microplastics in Nile Tilapia (Oreochromis niloticus) early juvenile: I. blood biomarkers. Chemosphere 2019, 228, 345–350. [Google Scholar] [CrossRef] [PubMed]
  13. Mbugani, J.J.; Machiwa, J.F.; Shilla, D.A.; Kimaro, W.; Joseph, D.; Khan, F.R. Histomorphological Damage in the Small Intestine of Wami Tilapia (Oreochromis urolepis) (Norman, 1922) Exposed to Microplastics Remain Long after Depuration. Microplastics 2022, 1, 240–253. [Google Scholar] [CrossRef]
  14. Kosore, C.; Ojwang, L.; Maghanga, J.; Kamau, J.; Kimeli, A.; Omukoto, J.; Ngisiag’e, N.; Mwaluma, J.; Ong’ada, H.; Magori, C.; et al. Occurrence and ingestion of microplastics by zooplankton in Kenya’s marine environment: First documented evidence. Afr. J. Mar. Sci. 2018, 40, 225–234. [Google Scholar] [CrossRef]
  15. Alessi, E.; Di Carlo, G.; Di Carlo, E.B.; Campogianni, S. Out of the Plastic Trap: Saving the Mediterranean from Plastic Pollution; WWF Mediterranean Marine Initiative: Rome, Italy, 2018. [Google Scholar]
  16. Zhao, J.; Ran, W.; Teng, J.; Liu, Y.; Liu, H.; Yin, X.; Cao, R.; Wang, Q. Microplastic pollution in sediments from the Bohai Sea and the Yellow Sea, China. Sci. Total Environ. 2018, 640, 637–645. [Google Scholar] [CrossRef] [PubMed]
  17. Au, S. Toxicity of Microplastics to Aquatic Organisms; TigerPrints: Clemson, SC, USA, 2017. [Google Scholar]
  18. Zhang, C.; Wang, J.; Zhou, A.; Ye, Q.; Feng, Y.; Wang, Z.; Wang, S.; Xu, G.; Zou, J. Species-specific effect of microplastics on fish embryos and observation of toxicity kinetics in larvae. J. Hazard. Mater. 2021, 403, 123948. [Google Scholar] [CrossRef]
  19. Popma, T.; Masser, M. Tilapia Life History and Biology. South. Reg. Aquac. Cent. 1999, 283. [Google Scholar] [CrossRef]
  20. Mizraji, R.; Ahrendt, C.; Perez-Venegas, D.; Vargas, J.; Pulgar, J.; Ojeda, F.P.; Duarte, C.; Galbán-Malagón, C. Is the feeding type related with the content of microplastics in intertidal fish gut? Mar. Pollut. Bull. 2017, 116, 498–500. [Google Scholar] [CrossRef]
  21. Foley, C.J.; Feiner, Z.S.; Malinich, T.D.; Hook, T.O. A meta-analysis of the effects of exposure to microplastics on fish and aquatic invertebrates. Sci. Total Environ. 2018, 631, 550–559. [Google Scholar] [CrossRef] [Green Version]
  22. Santillo, D.; Miller, K.; Johnston, P. Microplastics as contaminants in commercially important seafood species. Integr. Environ. Assess. Manag. 2017, 13, 516–521. [Google Scholar] [CrossRef]
  23. Tran-Duy, A.; Schrama, J.W.; van Dam, A.A.; Verreth, J.A.J. Effects of oxygen concentration and body weight on maximum feed intake, growth and hematological parameters of Nile tilapia, Oreochromis niloticus. Aquaculture 2008, 275, 152–162. [Google Scholar] [CrossRef]
  24. Anbumani, S.; Kakkar, P. Ecotoxicological effects of microplastics on biota: A review. Environ. Sci. Pollut. Res. 2018, 25, 14373–14396. [Google Scholar] [CrossRef] [PubMed]
  25. Maganira, J.D.; Nehemia, A.; Rumisha, C. LengthWeight relationship and condition factor of tilapia species grown in marine and freshwater ponds. Agric. Biol. J. N. Am. 2012, 3, 117–124. [Google Scholar] [CrossRef]
  26. Dadzie, S.; Wangila, B. Reproductive biology, length-weight relationship and relative condition of pond raised Tilapia zilli (Gervais). J. Fish Biol. 1980, 17, 243–253. [Google Scholar] [CrossRef]
  27. Pegado, T.; Schmid, K.; Winemiller, K.O.; Chelazzi, D.; Cincinelli, A.; Dei, L.; Giarrizzo, T. First evidence of microplastic ingestion by fishes from the Amazon River estuary. Mar. Pollut. Bull. 2018, 133, 814–821. [Google Scholar] [CrossRef]
  28. Hamed, M.; Soliman, H.A.M.; Badrey, A.E.A.; Osman, A.G.M. Microplastics induced histopathological lesions in some tissues of tilapia (Oreochromis niloticus) early juveniles. Tissue Cell 2021, 71, 101512. [Google Scholar] [CrossRef]
  29. Ahrendt, C.; Perez-Venegas, D.J.; Urbina, M.; Gonzalez, C.; Echeveste, P.; Aldana, M.; Pulgar, J.; Galban-Malagon, C. Microplastic ingestion cause intestinal lesions in the intertidal fish Girella laevifrons. Mar. Pollut. Bull. 2020, 151, 110795. [Google Scholar] [CrossRef] [PubMed]
  30. Xia, X.; Sun, M.; Zhou, M.; Chang, Z.; Li, L. Polyvinyl chloride microplastics induce growth inhibition and oxidative stress in Cyprinus carpio var. larvae. Sci. Total Environ. 2020, 716, 136479. [Google Scholar] [CrossRef]
  31. Eccles, D.H. A Field Guide to the Freshwater Fishes of Tanzania; FAO: Rome, Italy, 1992. [Google Scholar]
  32. Watts, A.J.; Lewis, C.; Goodhead, R.M.; Beckett, S.J.; Moger, J.; Tyler, C.R.; Galloway, T.S. Uptake and retention of microplastics by the shore crab Carcinus maenas. Environ. Sci. Technol. 2014, 48, 8823–8830. [Google Scholar] [CrossRef]
  33. Cole, M.; Lindeque, P.; Fileman, E.; Halsband, C.; Galloway, T.S. The Impact of Polystyrene Microplastics on Feeding, Function and Fecundity in the Marine Copepod Calanus helgolandicus. Environ. Sci. Technol. 2015, 49, 1130–1137. [Google Scholar] [CrossRef]
  34. Khan, F.R.; Syberg, K.; Shashoua, Y.; Bury, N.R. Influence of polyethylene microplastic beads on the uptake and localization of silver in zebrafish (Danio rerio). Environ. Pollut. 2015, 206, 73–79. [Google Scholar] [CrossRef]
  35. Crane, D.P.; Ogle, D.H.; Shoup, D.E. Use and misuse of a common growth metric: Guidance for appropriately calculating and reporting specific growth rate. Rev. Aquac. 2019, 12, 1542–1547. [Google Scholar] [CrossRef]
  36. Karami, A.; Golieskardi, A.; Choo, C.K.; Romano, N.; Ho, Y.B.; Salamatinia, B. A high-performance protocol for extraction of microplastics in fish. Sci. Total Environ. 2017, 578, 485–494. [Google Scholar] [CrossRef] [PubMed]
  37. Bernet, D.; Schmidt, H.; Meier, W.; Burkhardt-Hom, P.; Wahhli, T. Histopathology in fish: Proposal for a protocol to assess aquatic pollution. Fish Dis. 1999, 22, 25–34. [Google Scholar] [CrossRef] [Green Version]
  38. Lei, L.; Wu, S.; Lu, S.; Liu, M.; Song, Y.; Fu, Z.; Shi, H.; Raley-Susman, K.M.; He, D. Microplastic particles cause intestinal damage and other adverse effects in zebrafish Danio rerio and nematode Caenorhabditis elegans. Sci. Total Environ. 2018, 619, 1–8. [Google Scholar] [CrossRef] [PubMed]
  39. Pedà, C.; Caccamo, L.; Fossi, M.C.; Gai, F.; Andaloro, F.; Genovese, L.; Perdichizzi, A.; Romeo, T.; Maricchiolo, G. Intestinal alterations in European sea bass Dicentrarchus labrax (Linnaeus, 1758) exposed to microplastics: Preliminary results. Environ. Pollut. 2016, 212, 251–256. [Google Scholar] [CrossRef] [PubMed]
  40. Mapenzi, L.L.; Mmochi, A.J. Effect of stocking density on growth performance of hybrid of Oreochromis niloticus and Oreochromis urolepis urolepis in saline water. WIO J. Mar. Sci. 2016, 15, 67–74. [Google Scholar]
  41. Lugert, V.; Thaller, G.; Tetens, J.; Schulz, C.; Krieter, J. A review on fish growth calculation: Multiple functions in fish production and their specific application. Rev. Aquac. 2016, 8, 30–42. [Google Scholar] [CrossRef]
  42. Froese, R. Cube law, condition factor and weight–length relationships: History, meta-analysis and recommendations. J. Appl. Ichthyol. 2006, 22, 241–253. [Google Scholar] [CrossRef]
  43. Lamtane, H.; Mgaya, Y.; Bailey, R. Effects of water quality and flooding episode on the yield of Oreochromis urolepis (Norman, 1922) from self-stocked ponds. In Proceedings of the 8th International Symposium on Tilapia in Aquaculture, Cairo, Egypt, 12–14 October 2008. [Google Scholar]
  44. Critchell, K.; Hoogenboom, M.O. Effects of microplastic exposure on the body condition and behaviour of planktivorous reef fish (Acanthochromis polyacanthus). PLoS ONE 2018, 13, e0193308. [Google Scholar] [CrossRef] [Green Version]
  45. Naidoo, T.; Glassom, D. Decreased growth and survival in small juvenile fish, after chronic exposure to environmentally relevant concentrations of microplastic. Mar. Pollut. Bull. 2019, 145, 254–259. [Google Scholar] [CrossRef]
  46. Ighwela, K.A.; Ahmed, A.B.; Abol-Munafi, A.B. Condition Factor as an Indicator of Growth and Feeding Intensity of Nile Tilapia Fingerlings (Oreochromis niloticus) Feed on Different Levels of Maltose. Am.-Eurasian J. Agric. Environ. Sci. 2011, 11, 559–563. [Google Scholar]
  47. Olurin, K.B.; Aderibigbe, O.A. Length-Weight Relationship and Condition Factor of Pond Reared Juvenile Oreochromis Niloticus. World J. Zool. 2006, 1, 82–85. [Google Scholar]
  48. Ulotu, E.E.; Mmochi, A.J.; Lamtane, H.A. Effect of Salinity on the Survival and Growth of Rufiji Tilapia (Oreochromis urolepis urolepis) Fry. WIO J. Mar. Sci. 2016, 15, 31–37. [Google Scholar]
  49. Kasimoglu, C. The effect of fish size, age and condition factor on the contents of seven essential elements in Anguilla anguilla from Tersakan Stream Mugla (Turkey). J. Pollut. Eff. Control 2014, 2, 123. [Google Scholar] [CrossRef]
  50. Shoko, A.P.; Limbu, S.M.; Mrosso, H.D.J.; Mgaya, Y.D. A comparison of diurnal dynamics of water quality parameters in Nile tilapia (Oreochromis niloticus, Linnaeus, 1758) monoculture and polyculture with African sharp tooth catfish (Clarias gariepinus, Burchell, 1822) in earthen ponds. Int. Aquat. Res. 2014, 6, 56. [Google Scholar] [CrossRef] [Green Version]
  51. Talbot, C. Some aspects of the biology of feeding and growth in fish. Proc. Nutr. Soc. 1993, 52, 403–416. [Google Scholar] [CrossRef] [Green Version]
  52. Wang, N.; Xu, X.; Kestemont, P. Effect of temperature and feeding frequency on growth performances, feed efficiency and body composition of pikeperch juveniles (Sander lucioperca). Aquaculture 2009, 289, 70–73. [Google Scholar] [CrossRef]
  53. Mustać, B.; Zoja Cukar, G.; Vidović, A. Comparison of growth parametres between sardine Sardina Pilchardus (Walbaum, 1792) and anchovy Engraulis Encrasicolus (Linnaeus, 1758) from the eastern Adriatic Sea. Pomor. Zb. 2020, 3, 325–333. [Google Scholar] [CrossRef]
  54. United Nations Environment Programme. Neglected: Environmental Justice Impacts of Marine Litter and Plastic Pollution; UN Environment Programme: Nairobi, Kenya, 2021. [Google Scholar]
  55. Vanpoucke, M.Z. Impact of Microplastic Uptake: Contamination in Sprat and Microplastic-Mediated Uptake of PAHs by European Shore Crab. Master’s Thesis, Insitute for Agricultural and Fisheries Research (ILVO), Ghent, Belgium, 2015. [Google Scholar]
  56. Dahms, H.T.J.; van Rensburg, G.J.; Greenfield, R. The microplastic profile of an urban African stream. Sci. Total Environ. 2020, 731, 138893. [Google Scholar] [CrossRef]
  57. Triebskorn, R.; Braunbeck, T.; Grummt, T.; Hanslik, L.; Huppertsberg, S.; Jekel, M.; Knepper, T.P.; Krais, S.; Müller, Y.K.; Pittroff, M.; et al. Relevance of nano- and microplastics for freshwater ecosystems: A critical review. TrAC Trends Anal. Chem. 2019, 110, 375–392. [Google Scholar] [CrossRef]
  58. Ding, J.; Zhang, S.; Razanajatovo, R.M.; Zou, H.; Zhu, W. Accumulation, tissue distribution, and biochemical effects of polystyrene microplastics in the freshwater fish red tilapia (Oreochromis niloticus). Environ. Pollut. 2018, 238, 1–9. [Google Scholar] [CrossRef]
  59. Rochman, C.M.; Brookson, C.; Bikker, J.; Djuric, N.; Earn, A.; Bucci, K.; Athey, S.; Huntington, A.; McIlwraith, H.; Munno, K. Rethinking microplastics as a diverse contaminant suite. Environ. Toxicol. Chem. 2019, 38, 703–711. [Google Scholar] [CrossRef] [Green Version]
  60. Khan, F.R.; Patsiou, D.; Catarino, A.I. Pollutants bioavailability and toxicological risk from microplastics. In Handbook of Microplastics in the Environment; Springer: Cham, Switzerland, 2020; pp. 697–736. [Google Scholar]
Figure 1. PE MPs particles in the small intestines of O. urolepis juveniles. (A): Control (no PE MPs); (B): 1 PE MPs/mL; (C): 10 PE MPs/mL; (D): 100 PE MPs/mL. Scale bar = 100 µm at magnification of 40.
Microplastics 01 00025 g001
Figure 2. Histomorphological lesion indices of small intestine of O. urolepis juveniles at different PE MPs concentration. Note an increased dose dependent damage.
Microplastics 01 00025 g002
Figure 3. Length–weight relationship graphs of O. urolepis after exposing larvae to the outset of feeding for 65 d to juveniles. (A): Control (no PE MPs/mL); (B): 1 PE MPs/mL; (C): 10 PE MPs/mL; and (D): 100 PE MPs/mL.
Microplastics 01 00025 g003
Figure 4. Mean condition factors of O. urolepis juveniles (One-Way ANOVA, post hoc Tukey HSD, p < 0.05) exposed to various PE MPs/mL. The “*” represents significant difference of a group from the rest of treatment groups.
Microplastics 01 00025 g004
Table 1. One–Way ANOVA (p–value with superscript “a”) and Kruskal–Wallis test for water quality parameters between treatment groups.
Water ParametersTreatment Groups
Control1 PE MPs/mL10 PE MPs/mL100 PE MPs/mLp–Value
Temperature29.92 ± 1.4128.66 ± 1.5428.90 ± 1.2528.84 ± 1.250.75
Dissolved oxygen5.53 ± 2.666.64 ± 2.834.56 ± 2.815.12 ± 2.310.59 a
pH7.78 ± 0.237.70 ± 0.227.66 ± 0.207.67 ± 0.190.016 a
Table 2. Evaluation of histomorphological changes in small intestines of O. urolepis. The organ indices indicate sum of all reaction/alteration indices in a particular treatment.
Histomorphological
Alteration
Reaction/Alteration Pattern Index
Control1 PE MPS/mL10 PE MPs/mL100 PE MPs/mL
Villi (height and width)0146
Epithelial cells (height)0246
Cryptic and goblet cells0146
Leucocytic infiltration24812
Blood congestion04812
Organ indices2122842
Table 3. Growth performance of O. urolepis juveniles exposed to different MPs doses. SD = Standard deviation.
ParametersTreatment Group
Control1 PE MPs/mL10 PE MPs/mL100 PE MPs/mL
Total length (cm) ± SD6.24 ± 1.106.21 ± 0.806.15 ± 1.076.01 ± 1.21
Initial weight (g) ± SD0.015 ± 0.0040.017 ± 0.0030.016 ± 0.0040.015 ± 0.004
Final weight (g) ± SD4.626 ± 1.9874.530 ± 1.5184.411 ± 2.0554.246 ± 2.430
Weight gain (g) ± SD4.611 ± 1.9874.513 ± 1.5184.396 ± 2.0554.231 ± 2.430
SGR (% day−1)8.80 ± 0.788.42 ± 0.628.33 ± 0.858.42 ± 0.95
Condition factor3.276 ± 0.379 2.424 ± 0.2101.946 ± 0.1441.796 ± 0.170
Growth pattern (b)2.6712.8422.9432.989
Coefficient of determination (R2)0.9470.9540.9820.977
Publisher’s Note: MDPI stays neutral with regard to jurisdictional claims in published maps and institutional affiliations.

