Article

Microplastics Occurrence in Two Mountainous Rivers in the Lowland Area—A Case Study of the Central Pomeranian Region, Poland

by
Paulina Piskuła
and
Aleksander Maria Astel
*
Environmental Chemistry Research Unit, Institute of Biology and Earth Sciences, Pomeranian University in Słupsk, 22a Arciszewskiego Str., 76-200 Słupsk, Poland
*
Author to whom correspondence should be addressed.
Microplastics 2022, 1(1), 167-185; https://doi.org/10.3390/microplastics1010011
Submission received: 14 December 2021 / Revised: 24 January 2022 / Accepted: 30 January 2022 / Published: 2 February 2022

Abstract

:
Because of the increasing worldwide awareness concerning the occurrence of microplastics (MPs) in aquatic ecosystems, our goal was to analyze for the first time the quality and abundance of MPs and assess their seasonal variation in two unique rivers flowing through the low-land area in northern Poland. Their uniqueness is due to the fact they flow through landscape parks and urbanized zones, possess mountainous characteristics, and are aquatic habitats for sea trout (Salmo trutta m. trutta) and salmon (Salmo salar). In this pioneering study, the morphological types, geometric dimensions, and color of MP particles were analyzed by the use of an optical microscope. MPs particles were detected in 62.5% of the river water samples, while the average abundance was 3.6–4.2 items per sample. In terms of general seasonality, the sum of MPs items found in investigated river water samples decreased in the following order: spring (75 items) > summer (64 items) > autumn (52 items). Neither the total MPs abundance nor any morphological MPs types were statistically different between rivers according to single seasons. The quantity of MPs present in the river water was higher downstream of the wastewater treatment plant studied, which confirms that treated sewage effluent is a key source of MPs in an aquatic environment. Among the morphological types, fragments were prevalent among granules and fibers, while their average length not exceeding 1.0 mm enabled them to be classified as small. MPs were classified into nine colors, however, the bright colors were dominating only in the case of granule. In the case of the fragments and fibers, the dominating colors were transparent, white, blue, and black. Fourier transform infrared spectroscopy was performed on a small sample of microplastics (21.0%) due to their small size. Polymers containing polyethylene, polyvinyl chloride, polypropylene, polyester, and polystyrene were identified.

1. Introduction

Currently, plastics are indispensable materials used in every sector of our everyday lives. The popularity of plastic is due to versatility, relatively low cost, and durability (due to their high chemical stability and low degradability). The plastics industry is playing a key role in the fight against COVID-19. The products that help in fighting the pandemic include disposable face masks, gloves, helmets, and aprons [1]. In 1950, worldwide production of plastic had reached 2 million tons per year. Since then, annual production has increased nearly 200-fold, reaching 381 million tons in 2015 [2]. Low recycling results in excessive accumulation of plastic waste in the environment [3]. Only 2% of plastic waste goes to landfills [4].
Microplastics are small particles of plastic material, commonly considered smaller than 5 mm [5]. The synthetic polymer particles can be divided into macroplastics (>5 cm), mesoplastics (5 cm–5 mm), microplastics (5 mm–0.1 μm), and nanoplastics (<0.1 μm) [6]. Microplastics are classified as primary and secondary. Primaries are produced in small sizes for commercial purposes. Secondaries arise from the breakdown of larger plastic components [7]. Plastic items gradually degrade into smaller pieces through a combination of photo-degradation, thermal-degradation, mechanical erosion, and the possible action of fungi or bacteria [8]. The main sources of microplastics in the aquatic environment include textile fibers, cosmetics, and detergents containing microplastics [9], styrene-butadiene dust from car tires [10], activities of ports, shipyards, and the nautical industry [11], paints and coatings [12], direct emission of synthetic waste, factory spills [13].
The consumption of plastic pieces by aquatic organisms can cause adverse physiological effects. Plastics in an aquatic environment can also present an additional chemical hazard. Microplastics can contain two types of xenobiotics. The first is compounds intentionally added during the production process (flame retardants, plasticizers, antioxidants, flame retardants, UV stabilizers, and pigments) [14]. The second can be absorbed from the aquatic environment (metals [15], polycyclic aromatic hydrocarbons [16,17], perfluorinated compounds, polychlorinated biphenyls, and other organic pollutants [18] and pathogenic algae and bacteria [19]. During the degradation of plastic, toxic substances may be directly released to the aquatic environment or the guts of marine species [20].
In recent years, there have been many reports on the determination of microplastics in river waters [21,22,23,24,25,26,27]. The rivers transport between 1.15 and 2.41 million tones of plastic waste to the seas [28]. The main source of microplastics in river water is sewage treatment plants [7] and road transport [10]. More research is needed to identify the sources of microplastics contamination in river waters. The major aim of the research was to quantify microplastic particles in two unique rivers in northern Poland (Słupia and Łupawa rivers) and to characterize their morphological structure. The choice of Słupia and Łupawa rivers was justified based on their extraordinary characteristic: mountainous current, catchments which are partially located on the area of landscape parks, and salmon restoration program which involved Słupia River and started in the mid-1990s. As a result of the restoration program, Salmon redds were observed in a few rivers of Pomerania, however, wild offspring were caught only in the Słupia [29]. Therefore, the first aim of this study was to compare seasonal microplastic concentrations upstream and downstream of the outlets of four wastewater treatment plants. In addition, water was collected near the road, in the ports, and at water dams for the quantitative analysis of microplastics. It was assumed that microplastic concentrations would be significantly higher downstream of the sewage treatment plant outlets, in the port, in front of dams, and along the road.

2. Materials and Methods
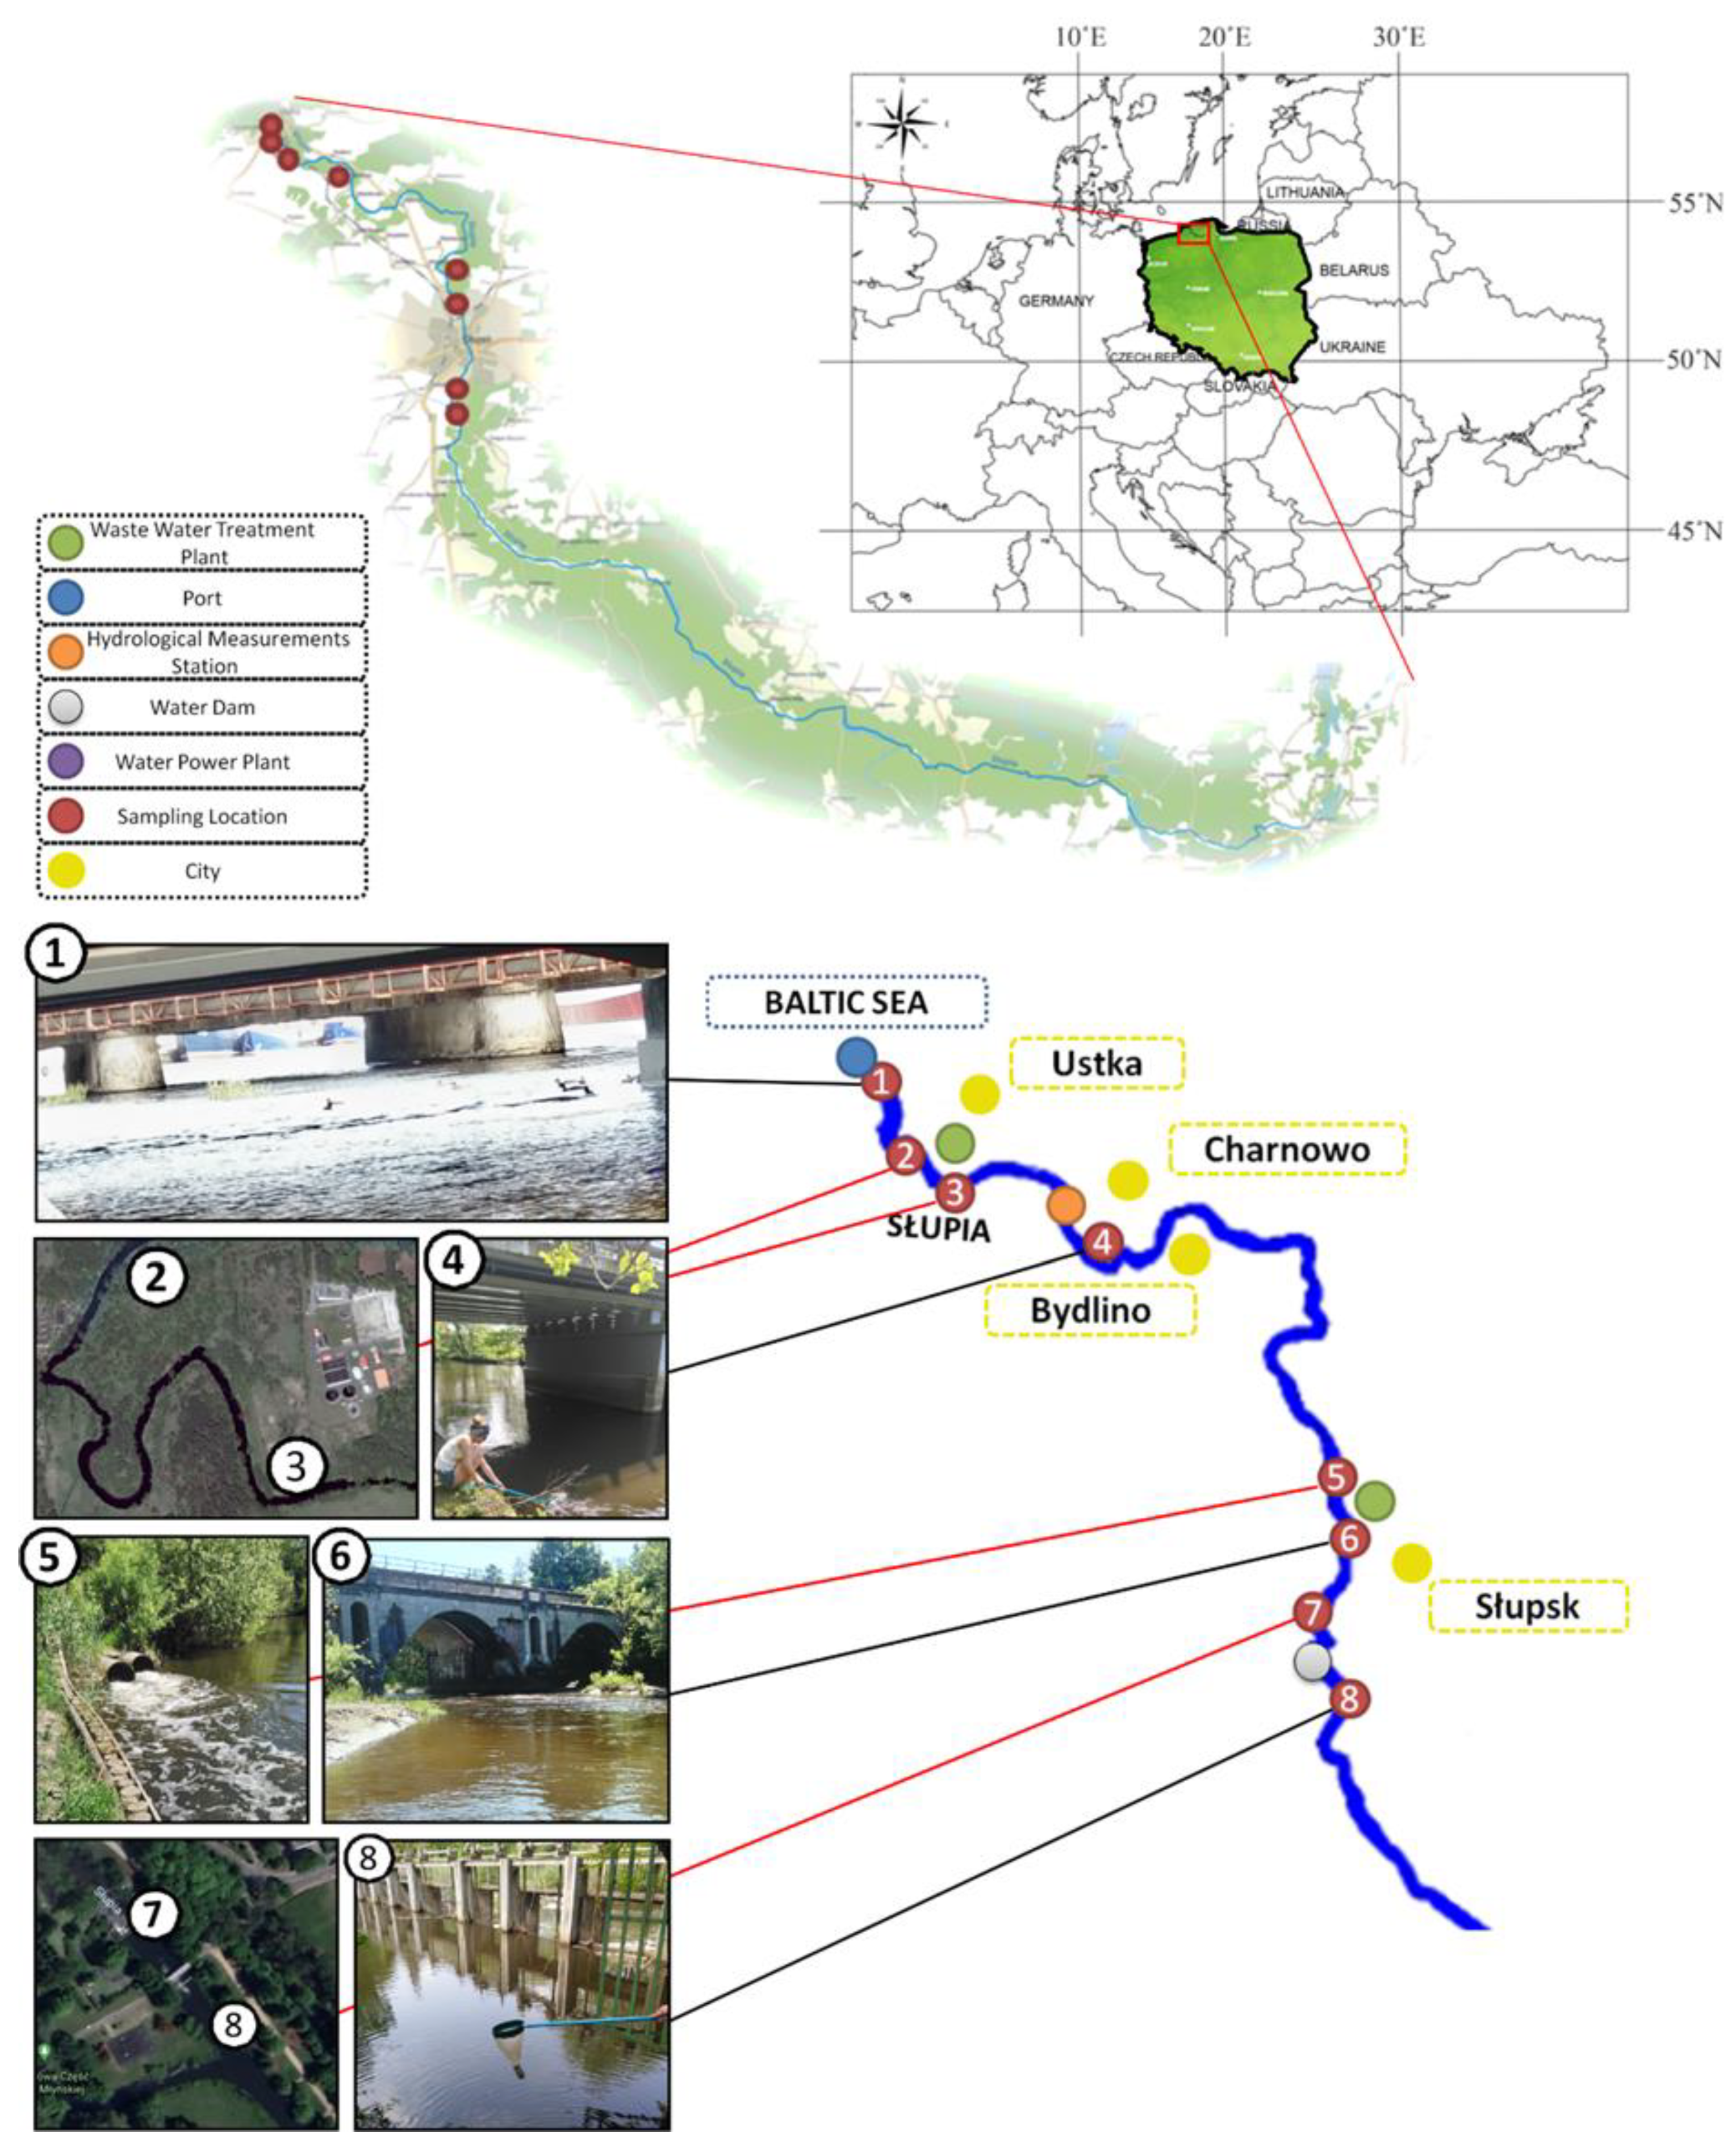
2.1. Sampling Sites

The study area (54°35′10″ N–54°21′00″ N, 16°50′53″ E–17°25′37″ E) is located in northern Poland. The Słupia River (SR) catchment is located in the central part of the Pomeranian region. The river itself is classified to a group of small rivers of length and catchment areas smaller than 200 km and 10,000 km2, respectively. Its watercourse is 139 km long and the catchment located in Pomorskie Voivodship occupies an area of about 1620 km2. The spring of the Słupia River is located in the Kashubian Lake District, near Sierakowska Huta, at an altitude of 178 m above sea level. The width of the riverbed ranges from 7 m in the upper part of the river to 40 m at the estuary, where the average flow is 15.5 m3∙s−1, while the average decline is around 1.3‰ [30]. Although it flows through lowland areas in several sections, it is considered a mountain river because of its rapid current. The Słupia River basin is diverse. It consists of pristine glacial landscapes, numerous hills, and clear lakes. In its upper and middle sections, numerous tributaries form a unique hydrographic network. Because of its natural and ecological uniqueness, the river valley has been protected since 1981 in the framework of “Słupia Valley Landscape Park”. In the mid-1990s, a salmon restoration program based on the Daugava salmon strain was started in Słupia River. The Słupia system was stocked mainly with smolts. The stocking resulted in catches of returning salmon by anglers in some Pomeranian rivers (i.e., Słupia and Parsęta) and for breeding purposes in Parsęta and Rega rivers. Salmon redds were observed in a few rivers but wild offspring were caught only in the Słupia [29]. Since 2004, the basin has also been protected under Natura 2000 as a special protection area for birds.
The SR basin is characterized by moderate anthropopression, especially in the upper and middle sections. On the contrary, the lower section is seriously impacted by the city of Słupsk, with a wastewater treatment plant in Słupsk as well as wastes from numerous food factories. The most serious pollution source in the upper and middle sections is agricultural runoff from farmlands. The significant anthropogenic impact could also be related to numerous hydroelectric infrastructures spread in the basin. Due to the mountain characteristic of the Słupia River in the middle of the XVIII century, various regulatory actions were carried out. Subsequent works included riverbed dredging, removing boulders and tree trunks, as well as the elimination of bends.
The Łupawa River (ŁR) is located in the north of Poland and is adjacent to the Słupia River. The spring stream of the Łupawa river outflows from the Gogolinko lake, while the Łupawa river itself outflows from the Jasień lake near Zawiaty village located in the area of the “Słupia Valley Landscape Park”. Its riverbed is located in the eastern direction next to the catchment of the SR. The watercourse of ŁR is 98.7 km long and its catchment area is about 964.4 km2. It is joined by larger tributaries, such as Bukowina, Rokitnica, Rębowa, Darżyńska Struga and Charstnica. The almost 100 km-long Łupawa River is the most “mountainous” of the Pomeranian rivers, characterized by fast current, stony and pebble bottom, as well as clean, oxygen-rich water. The average terrain gradient along the Łupawa River is 2‰. The ŁR can be divided into three sections. There are six water power plants in the middle and lower sections. Power plants are located in Smołdzino, Żelkowo, Drzeżewo, Łebień, Poganice and Łupawa [31]. The lower section of the river has been substantially altered by humans, with the construction of a variety of quays that serve as local harbor facilities. Łupawa is a receiver of treated sewage from six waste water treatment plants (Czarna Dąbrówka, Bobrowniki, Jasień, Łupawa, Smołdzino and Rowy). Fortunately, the human impact is limited because the dominant fragment of the Łupawa River is protected as a Natura 2000 area “Łupawa Valley” while its lower section as “Słowińska Refuge”. In its final section, the Łupawa River introduces about 90% of freshwater to the saline lake Gradno with an average flow of 8.2–9.3 m3∙s−1 [32,33]. The samples were collected from Słupia River (SR) (n = 8), Łupawa River (ŁR) (n = 6), and Charstnica river (CHR) (n = 2) which is the Łupawa’s tributary. As a result, an equal number of eight sampling locations was established for Słupia and Łupawa catchments. Maps of the sampling locations for Słupia and Łupawa rivers are displayed in Figure 1 and Figure 2, respectively, while the detailed information (latitude, longitude, and altitude) is summarized in Table S1.
Water samples were collected seasonally in May, August, and October 2018 before and after the waste water treatment plants (WWTPs) located in Bobrowniki and Damnica (ŁR) as well as in Słupsk and Ustka (SR) to make some comparison towards the presence of the microplastic in freshwater ecosystems. The samples were not collected during winter due to safety reasons. The applied approach made possible verification of the hypothesis that water samples upstream of the WWTPs contain fewer microplastics than samples collected downstream of them because the dominant source of microplastic fibers is created by the domestic washing machines and the technology of traditional WWTPs are not well prepared to capture those fibers. The significant contribution of washing processes of synthetic clothes to overall MPs pollution was indicated in the past by others [34,35,36,37]. Water was also sampled before the rivers enter the sea in the area of the seaport, in Ustka and Rowy, respectively. In this case, the assumption was that by the activity of the seaports as well as shipyard industry the increased abundance of the microplastics could be observed in final stretches of rivers. Another assumption concerning the possible increase in microplastics abundance was connected with the intensity of the car transport. To verify it water samples were also collected in Charnowo (SR) and Poganice (ŁR), in the direct vicinity of the routes frequently used by cars. River water samples were collected also upstream and downstream of the dams in Słupsk (SR) and Łebień (ŁR). In this case, it was assumed that the closure of the dam’s gates causing limited volumetric flow rate causes increased accumulation of the microplastics.

2.2. Sample Collection

Surface water sampling was performed using a 100 mL container connected to the plankton net of the porosity of 65 µm suspended on the galvanized rim of a diameter of 20 cm. The plankton net was used to collect MPs also in French [38] and Japanese rivers [39]. Due to the use of a 5 m telescopic rod, only the surface water (0–10 cm) was filtered through the plankton net. The surface area of the net was equal to 0.0314 m2. Three parallel samples were deployed and measured for quality control in every single location. To collect the desired sample, a plankton net was immersed to a depth of around 10 cm. Every sample was collected by 900 s, and consecutively water sample present in a 100 mL container was transferred to the glass bottle and transported to the laboratory for further analysis. For a given sampling day, the average volumetric flow, as well as operational water level, were recorded in-line in two cross-sections of the Słupia (Słupsk at the Kaszubski bridge (between sampling locations 7 and 6) and Charnowo (location 4)) and Łupawa (upstream Poganice (location 8) and Smołdzino (between location 2 and 1)) rivers. All real-time data were available on the Hydro IMGW-PIB web page [40]. The width of the river’s bed for a given cross-section was taken from the interactive GIS-based map available at the Geoportal web page [41]. The width of the SR bed at the Kaszubski bridge and Charnowo was around 24.5 m and 17.5 m, respectively while the width of the ŁR bed close to Poganice and Smołdzino was around 7.5 m and 23.5 m width, respectively. Using the width of the river bed, operational water level, and assuming that the under-water cross-section part is of an ellipsoid shape, the overall cross-section surface was estimated. Consecutively, using these values the average volume of river water filtered by the plankton net during single sampling was estimated for 7 m3 and 3.9 m3 for SR and ŁR, respectively. All samples were preserved at 4 °C within a portable cooler during the transport and in the fridge before laboratory analysis.

2.3. Microplastic Extraction

Before the microscopic investigation, organic matter was removed from the sample. To accomplish this task, water sample was transferred to the glass beaker, and treated with 20 mL 0.05 M Fenton reagent and 20 mL 30% H2O2. The Fenton reaction is classified as a radical one, since the intermediates or final products are free hydroxyl radicals. The hydroxyl radicals formed by the combination of Fe2+ and H2O2 are very reactive and easily react with organic matter. The necessary factor for the decomposition of H2O2 is pH in the range between 3 and 5. To increase the effects of oxidation of organic matter, both doses of the H2O2 and Fe2+ should be optimized individually and depend on the amount of organic matter present in the given sample. The mechanism of the Fenton reaction is rather complicated, as it can be affected by various factors such as the concentration of Fe(II) and H2O2, the pH condition, the nature of ligand and buffer, and so on [42]. A glass beaker was covered by the glass lid and stored in a room temperature for 5 min, and then consecutively heated to 50 °C, since moderate heating increases the Fenton reaction speed. However, the temperature should not be higher than 50 °C as temperature that is too high reduces the efficiency of the Fenton reaction and may also lead to degradation of synthetic polymers. After the appearance of intensive gas bubbles, the sample was removed from the heater until the gas emission was finished (usually 2–3 h). The time might be extended and some repetition of heating and oxidation might be needed until the solution in the glass beaker was clear in appearance. Then the sample was filtered through a cellulose 390 type filter using a vacuum pump. After the filtration, the cellulose filter was stored in a clean glass Petri dish before microscopic analysis.

2.4. Quality Control and Blind Samples

Several countermeasures were taken to prevent possible sample contamination with polymers. All sampling instruments used in the field as well as in the laboratory were washed with deionized water taken from a 25 L glass container. During the preparation of the Fenton reaction and filtration, the equipment and materials were all covered with aluminum foil as far as possible to avoid air-originated contamination. During the proceedings of the Fenton reaction itself, the aluminum foil was replaced by the glass lid to avoid it swelling with the warm air and gas flow. Furthermore, white cotton lab coats and nitrile gloves were worn by the personnel to avoid any contact with all plastic products. To double-check if the applied procedure was free from the air-originated contamination with plastics, triplicate blank samples that used deionized water were treated as procedural blanks through the whole analysis procedure, and no pieces of microplastics were observed on the blank filter.

2.5. Microplastics Identification

Sample filters were visually inspected under a stereomicroscope (Motic Zoom SMZ-161-BLED, Motic, Barcelona, Spain) with 0.75×–4.5× magnification equipped with 3W LED illumination and the Greenough optical system. Using a binocular connecting to a tablet MoticamBTW8 (China) running under the control of the Android 5.0 operating system images were analyzed and archived using MotiConnect 1.5.9.10-build-171215 software which is a dedicated image processing Android app for Motic cameras, which includes image preview, capture, recording, editing and measuring functions.
After the microscopic assessment was accomplished and sorted, synthetic particles larger than 500 μm were identified using ATR-FTIR (Thermo Scientific, Nicolet iS5 with ATR diamond crystal, Waltham, MA, USA). Similar equipment configuration was recommended for a qualitative investigation of MPs by others [43,44,45]. Particles were placed individually onto the ATR crystal. The FTIR was run at a mid-range of 4000–400 cm−1 using 32 scans/s at 4 cm−1 resolution for each analysis. All spectra were compared and identification was verified using an appropriate database (Hummel Polymer Sample Library) and software (Omnic Spectra software, ThermoFisher Scientific, Waltham, MA, USA). The spectra were interpreted based on spectral search, search by band positions, and visual match. According to the recommendation presented by others [46] only polymers matching reference spectra for more than 60% were accepted.

2.6. Data Analysis

The statistical analyses were done using TIBCO Statistica 13.3 software (TIBCO, Palo Alto, CA, USA). To compare the significant differences among MPs abundance in water samples collected in both analyzed rivers according to three seasons two schemes of pairwise comparisons were used. To verify significant differences only in a pairwise option (i.e., an abundance of MPs in the Słupia river vs. Łupawa river, an abundance of MPs during the Spring in the Słupia river vs. Łupawa River, etc.), a non-parametric Mann–Whitney U test was applied. However, to verify significant differences in the option of triplicate comparisons (i.e., an abundance of MPs in the Słupia river in spring, summer, and autumn), a non-parametric Kruskal–Wallis test was applied. All tests were analyzed and considered significant at a p-value < 0.05. The idea of the use of two-way analysis of variance was abandoned since data did not fulfill ANOVA constraints.

3. Results and Discussion

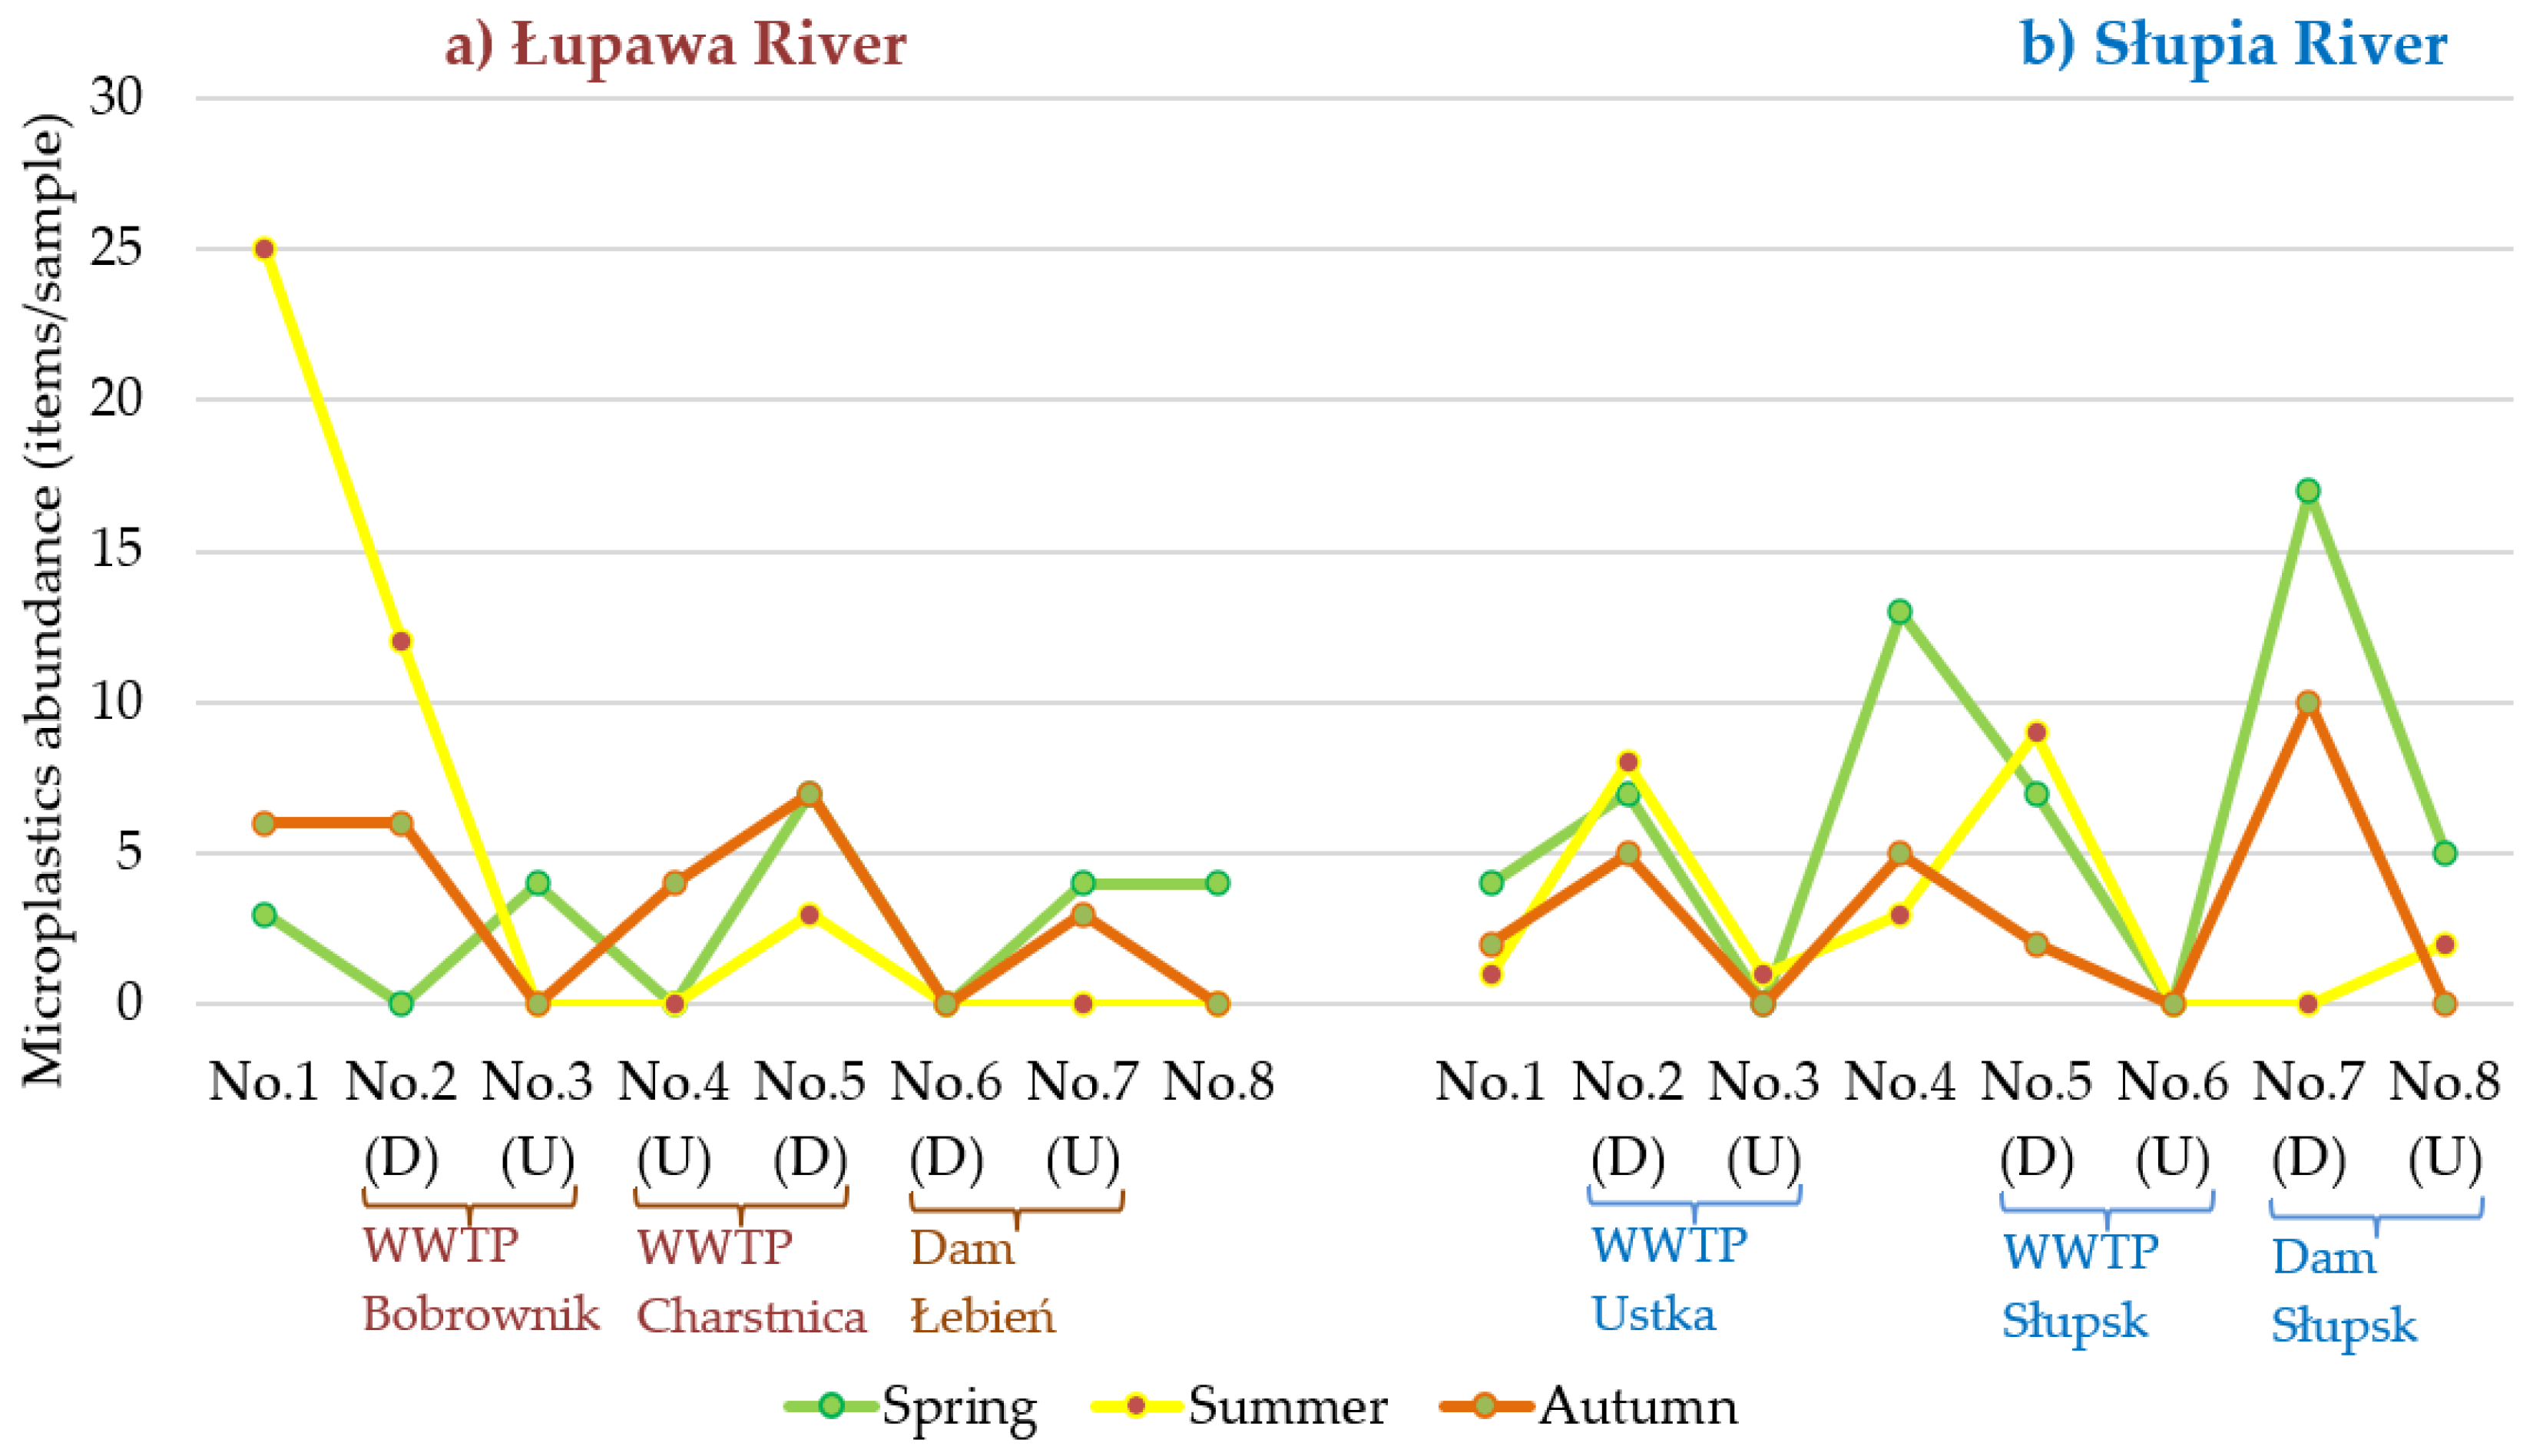
3.1. Abundance and Temporal Variation of MPs

Microplastics were detected in 30 out of 42 river water samples (62.5%) ranging from 25 to a single item per water sample. For Słupia River, the mean abundance was 4.2 items per sample, while in the case of Łupawa River it was 3.6 items per sample. In both cases, it is less than that found in the Vistula River, which is the largest Polish river [47], Antuã River (Portugal) [48], or in Greater Paris (France) [38]. In those rivers, the average abundance of MPs varied in the range between 30–4930 items∙m−3. Surprisingly, the average abundance of MPs found in Słupia and Łupawa rivers was very similar to the abundance of MPs found in the urban section of the Vistula River [49], in 36 sites on 29 rivers in Japan [50] (where the average concentration was 1.6 items∙m−3) or in southern California’s coastal waters [21]. It is worth emphasizing that a very similar abundance of MPs collected by the use plankton net was found in Qin River [50]. In general, in our studies, the abundance of microplastic items was two to three orders of magnitude lower than in other rivers such as Wei River (China) [51], Yellow River (China) [52], or in a high-altitude basin of the Tibetan Plateau (China) [53].
Detailed statistical analysis has proven that there were no significant differences in the content of MPs between Słupia and Łupawa Rivers, both for the entire sampling period as well as taking into account seasonality and morphological types of the MPs. The detailed statistical assessment according to location, seasons (spring, summer, autumn), and combination of both factors was summarized in Table 1. Moreover, based on the results of the Kruskal–Wallis test for multiple comparisons none of the statistical differences were found between consecutive seasons for SR and ŁR, respectively, for total MPs abundance as well as for their most dominant morphological types. The lack of differences in MPs abundance in both compared rivers is probably due to the relatively low number of MPs items found in water samples caused by limited anthropogenic impact and due to the fact that they flow through the ecologically protected areas.
Despite the fact that none of the statistical differences between locations and seasonality was found, some seasonal variation in the abundance of MPs in river water could be observed. As shown in Figure 3, seasonal variation indicates that the highest number of MPs was observed in spring (75 items), followed by summer (64 items) and autumn (52 items). Among the shape types, granule was prevalent in spring (55%) with the highest abundance in the Słupia river, followed by summer with the highest abundance in the Łupawa river and autumn, when the detected MPs in both rivers were comparable and accounted single items per water sample (Figure 3a). Fragments were found in similar percentages in all seasons (35%, 33%, and 32% for spring, summer, and autumn, respectively) with a similar scheme of the abundance of particular items in both rivers as was in the case of granule (Figure 3b). Fibers were dominantly found in spring (44%) and summer (39%) and the number of items found in water samples collected in the Słupia river was higher than in the case of Łupawa river, however, none of the fibers were detected in the Słupia river in autumn (Figure 3c).

3.2. Comparison of MPs Abundance along the River Course

The study area was downstream of the ŁR and SR, the mountainous rivers in a lowland area in northern Poland, and MPs abundance among different sections of both rivers revealed similar features corresponding to respective sources. First of all, the hypothesis assuming that the water samples upstream of WWTPs contain fewer microplastic particles than samples collected downstream of them was positively verified, and a remarkable difference was observed among neighboring sampling locations as shown in Figure 4. The total MPs were significantly more abundant in a location downstream of wastewater treatment plants (Mann–Whitney, U = 11.5, p < 0.001) for both rivers, however, test applied to the single river revealed an obvious significant difference for Słupia River (Mann–Whitney, U = 0.0, p = 0.0036) and slightly higher than the critical value of p for Łupawa River (Mann–Whitney, U = 6.00, p = 0.055). Pattern with an abundance of plastic particles increased downstream of each WWTPs is consistent with the surveys of other rivers, for example, Soar, Tees, Calder, Yorkshire Ouse, Hull, and Wharfe in the north of England [25]. The mean ratio up- and downstream was always greater than one, and typically between 2–10. There was little temporal variability at the majority of sites, and the only single reversed change (upstream more MPs than downstream of the WWTPs) was observed between locations 3–2 in ŁR (spring). The fact that the quantity of microplastics present in investigated rivers was generally higher downstream of the location of each of four WWTPs (Bobrowniki, Charstnica (ŁR), Słupsk, Ustka (SR)) confirms that treated sewage effluent is a significant source of MPs in rivers, agreeing with some other rarely available studies [54,55,56,57]. Secondly, another assumption concerning the possible increase in microplastics abundance as an effect of road runoff was positively verified. A clear increase in the total MPs abundance was observed in spring and autumn in the fourth sampling location along the SR course, agreeing with the study conducted in the River Thames (UK) [58]. However, in the case of ŁR water sample collected in the direct vicinity of the route frequently used by car was similarly abundant with MPs than in collected in downstream location. Such an unclear pattern suggests that investigation on the road runoff as a substantial source of MPs in the area of SR and ŁR catchments is still needed.
The assumption concerning the possible increase in MPs abundance as an effect of the dam was also positively verified, however, an impact was unequivocal only in SR. The total MPs were three to ten more abundant downstream the dam in Słupsk in autumn and spring, while the corresponding effect was not observed in ŁR. The reason for this could be explained by two independent phenomena. The course of the ŁR upstream the dam flows through the woodland area and the step of the dam itself is around 15 m high. The lack of upstream MPs sources and strong current decrease the possibility of MPs accumulation downstream. On the contrary, the course of the SR upstream of the dam flows through the municipal recreational park, and the step of the dam is only around 5 m high. Municipal river segments are often polluted with plastic debris by citizens, while slow current facilitates the accumulation of MPs downstream obstacles. Surprisingly, water samples from the port areas showed a substantial disagreement in the observed mass abundance of MPs between ŁR and SR (Figure 4). In the case of the first large increase was observed in summer, while only a slight or even lack of increase in spring and autumn, respectively. In every season, a decrease in MPs mass abundance was observed in the mouth of the Słupia River (port area). The predominance of MP particles in water samples collected from small-scale fishing ports suggests that plastic debris such as fishing nets, carry bags and plastic films for packaging could be released directly to water and shredded in the port-channel by the ship propellers. This unfavorable phenomenon could take place, especially in the summer, when the activity of local small-scale fishing ports is the highest due to the peak of the touristic season. It seems that the direct release of plastic debris in the port area controlled by Maritimes Office (in Ustka) is limited. In general, the plastic debris release depends on the activity of the ports, vicinity of the roads, dams of various height, and WWTPs resulting in substantial variation along the river course.

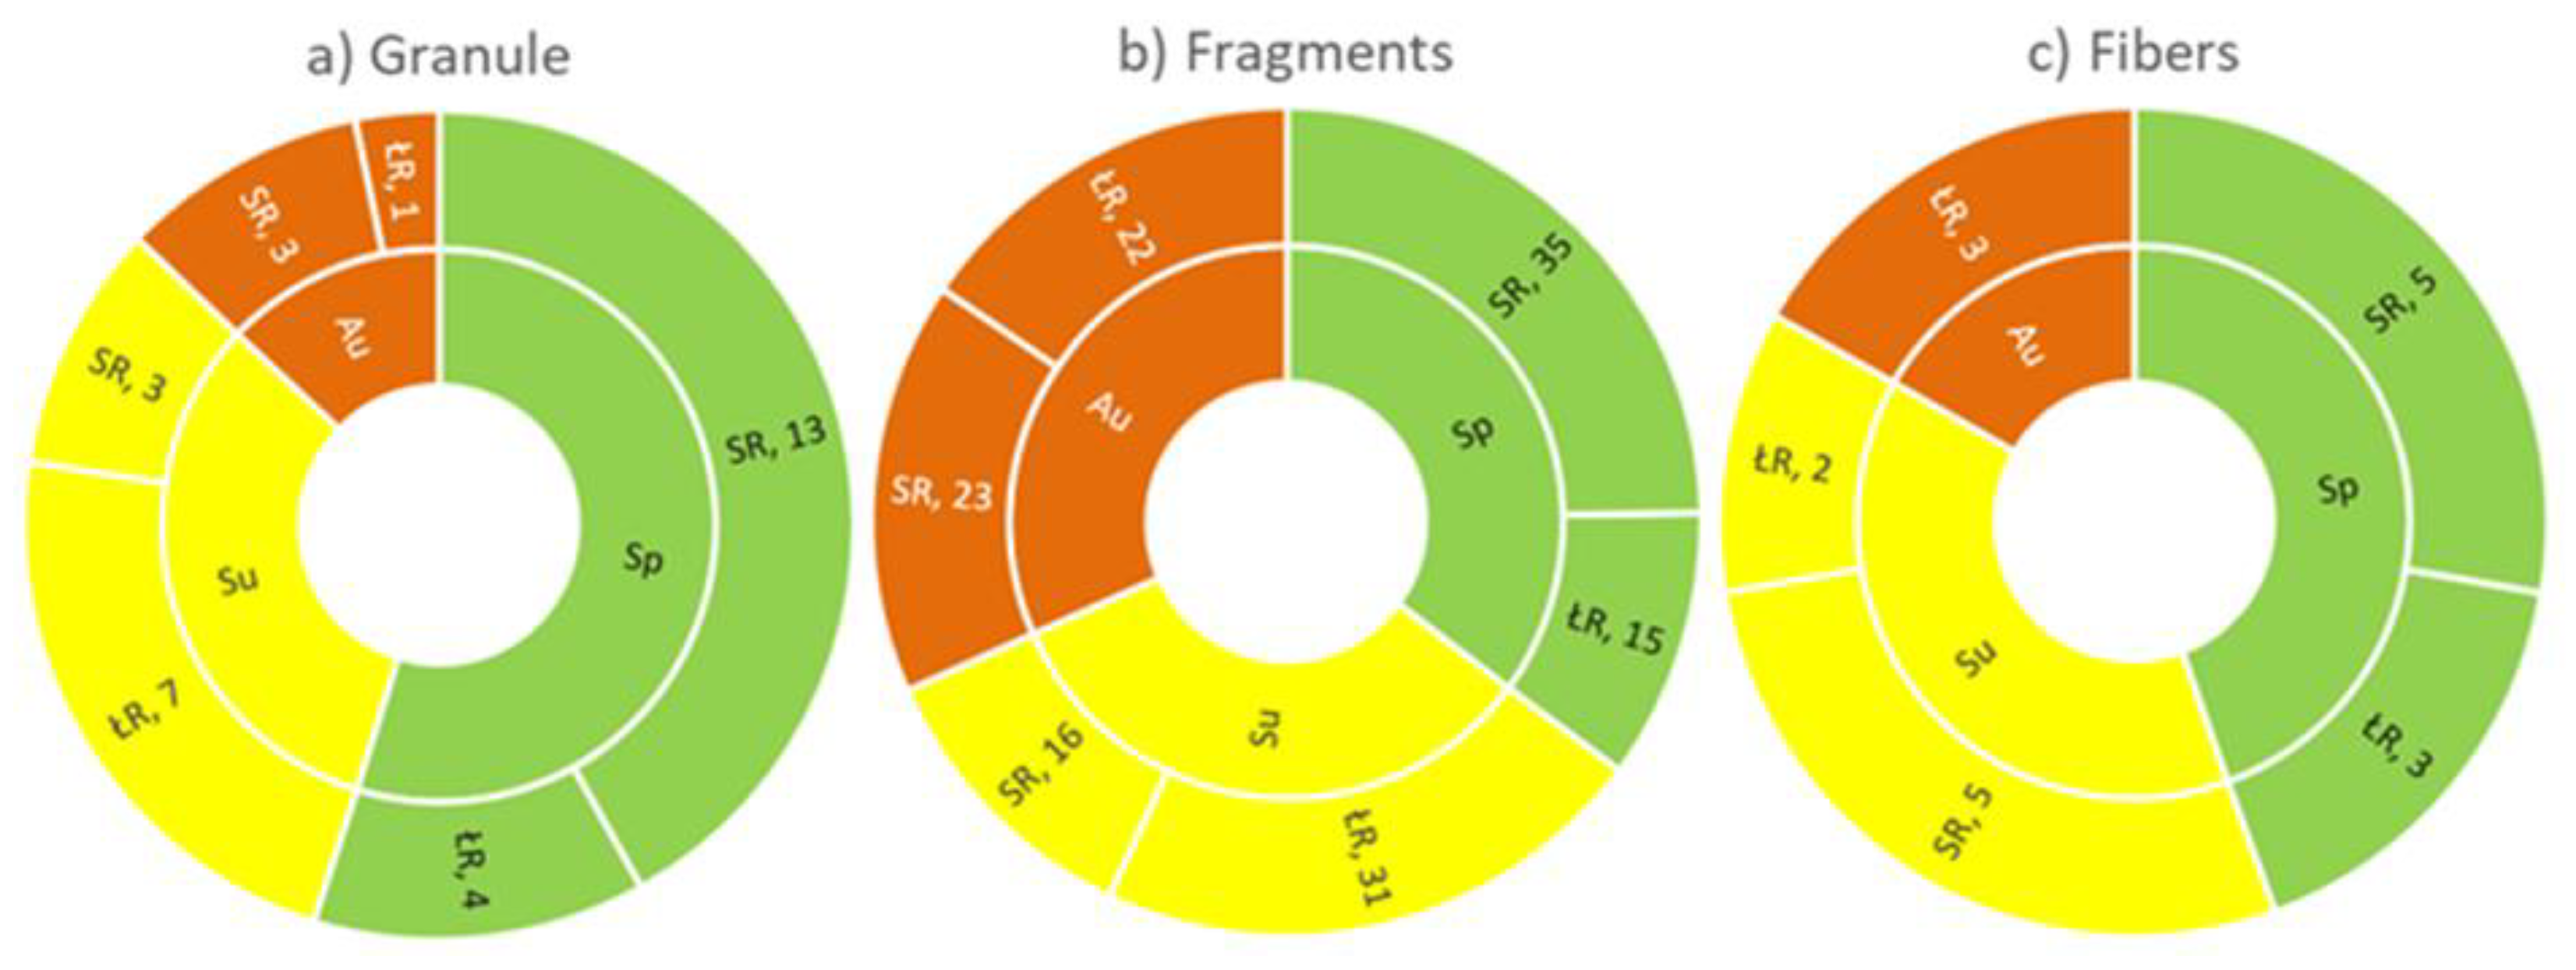
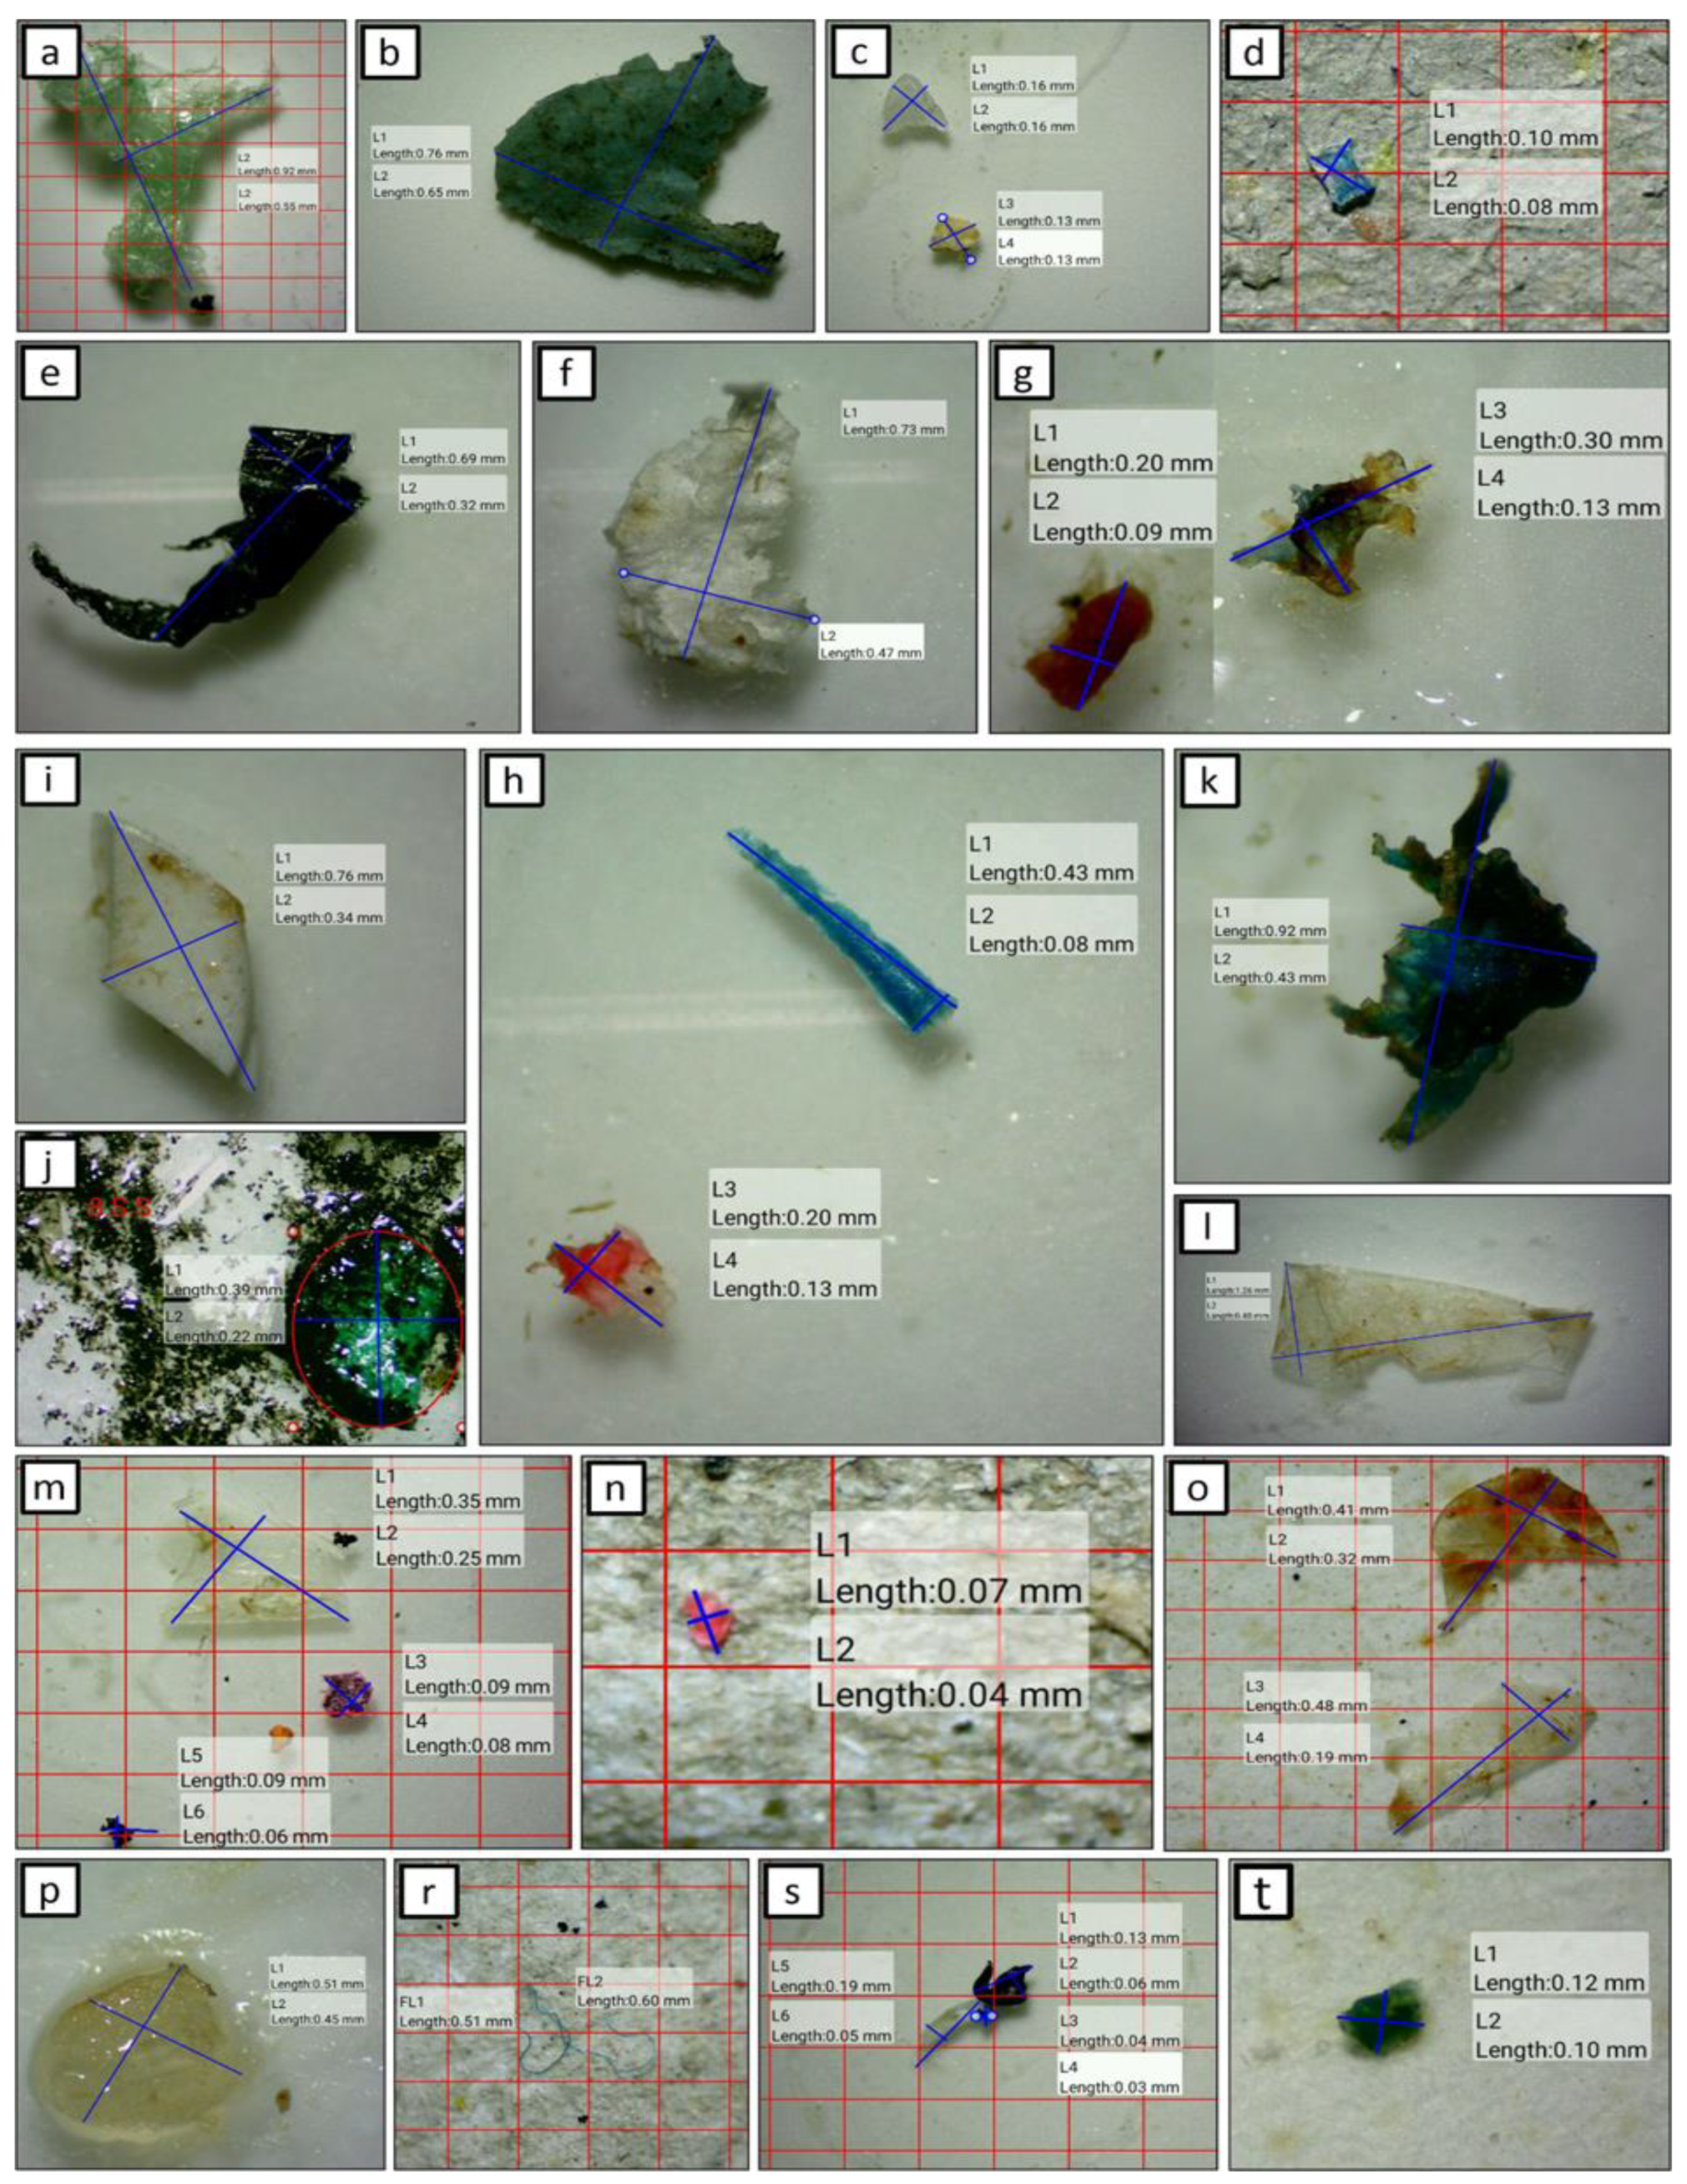
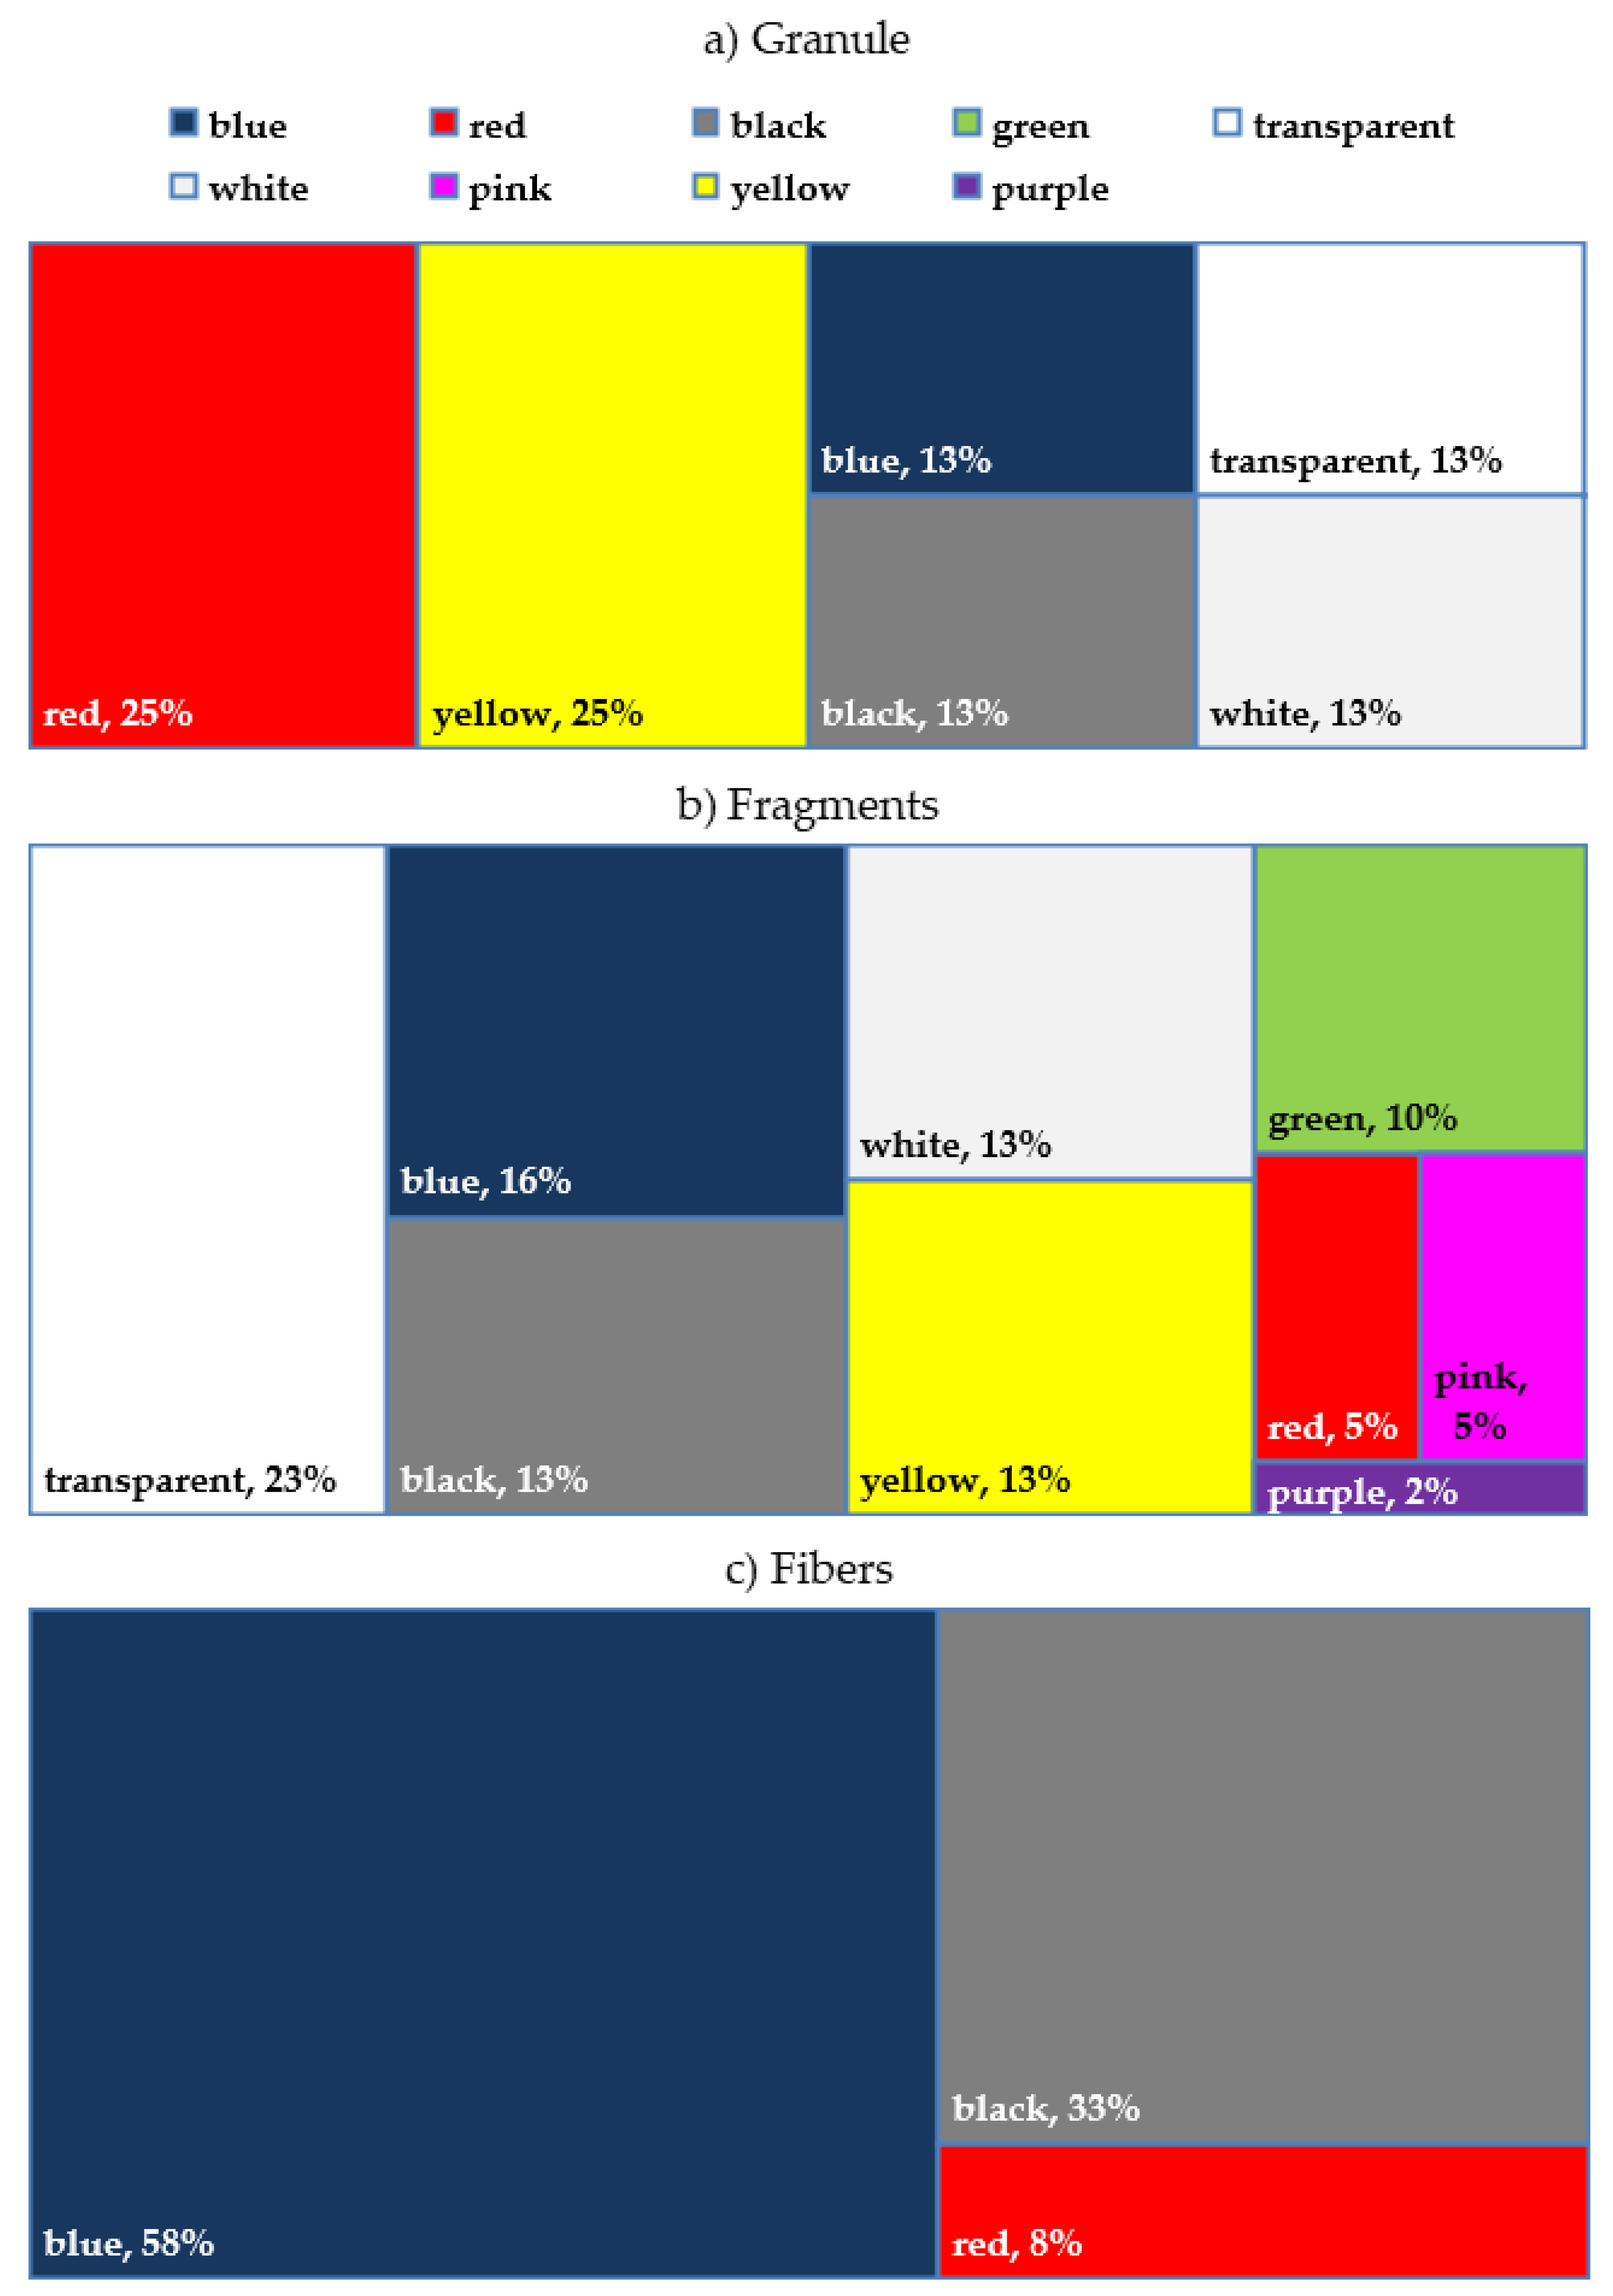
3.3. Morphology Characteristics

Under microscopy, typical microscopy images of MPs were shown in Figure 5 and their morphological shape was divided into three categories (fragments, granule, and fibers). Among the morphological types, fragments were prevalent among other forms (74%) and accounted for 72% and 77% for SR and ŁR, respectively. Plastic fragments were followed by granules (18% (SR) and 14% (ŁR)) and fibers (10% (SR) and 9% (ŁR). The contribution of fragments found in Słupia and Łupawa rivers was similar to Nakdong River (South Korea), where the fragment type MPs accounted for 69% of total plastics in water [27]. The percentage expressed contribution of fragments found in investigated Polish rivers was around 50% higher than found in West River (China) [59] or Łaba River (Czech Republic) [60].
The average and median length, width, and area of all MPs found were 0.39 mm/0.26 mm, 0.33 mm/0.13 mm, and 0.66 mm2/0.026 mm2, respectively, while the average length of fibers was 0.34 mm. According to classification applied by [47] majority of MPs found in Słupia and Łupawa rivers should be classified as small (length < 1.0 mm). As shown in Figure 6, 83% of lengths and 91% of widths of MPs items found in this study were of size smaller than 0.5 mm. Similar domination of MPs of length smaller than 0.5 mm was observed in Wei River (where microplastics of the size < 0.5 mm accounted for 40.8% to 68.8%) [51], West River (68.5–98.7%) [59], in an urbanized and industrial section of the Vistula River near Warsaw (Poland) [49], and a high-altitude basin of the Tibean Plateau (74.7%) [53].
Almost 95% of the total MPs found in Słupia and Łupawa rivers were of length < 1.0 mm, however, in one sample microplastic particles of the mesoplastics size was found. As could be seen from histograms for individual colors (Figure 6a–c), the most dominant fraction of transparent, blue, and black particles were of a length lower than 0.6 mm, 0.2 mm, and 0.3 mm, respectively. The average, median, and range of geometric dimensions of MPs of different colors are summarized in Table 2.
As shown in Figure 7, MPs were classified into nine colors and bright colors were dominating in the case of granule (50%) (Figure 7a). The highest color variety was found for fragments (Figure 6 and Figure 7), while domination of dark colors was found for fibers (Figure 7c). Generally, the color distribution was considerably similar along with all categories of morphological shapes with general domination of colors similar to the colors of objects present in water ecosystems including the color of the water, sediments, and food for animals. The floating microplastics of such color mistook as get ingested, resulting in massive hazards and negative impacts on the health of aquatic organisms [61]. The structure or color domination of morphological types of MPs found in Słupia and Łupawa rivers is quite similar to the MPs found in Antuã River Portugal) where fragments were mostly blue and white, while black, blue, and transparent fibers were prevalent in almost all samples [48]. Similarly, as in our study more than 60% of MPs in water samples collected in Łaba River (Czech Republic) were mostly transparent (26.0%), blue (19.7%) or white (15.0%) [60].
In fish and many other aquatic species, exposure to MPs may lead to mortality [62,63,64], induction of oxidative stress [65,66,67,68], induction of neurotoxicity [68], altered growth rate [64], altered gene expression in the liver or the brain [69,70], changes in blood biochemical parameters [71] or liver histopathology, induction of liver inflammation [66,72] or modulation of the impact of other pollutants [70,73,74]. Comprehensive ecotoxicological and physiological risks of MPs on fish were described by others [75,76]. A wide spectrum of possible negative impacts on fish including effects of chronic exposure to MPs on early life stages of sea trout (Salmo trutta m. trutta) [77] suggests that careful monitoring of MPs abundance in case of rivers possessing unique characteristics enabling aquatic species restoration programs is of great importance. Moreover, apart from pollution mapping future research programs should include MPs abundance analysis in organs and tissues of the aquatic species as well as evaluation of some environmental footprints analysis to be complete.

3.4. MPs Composition Assessment

Fourier-transformed infrared (FTIR) spectroscopy was performed on a small subsample of particles (17 of 81 total particles, 21.0%) due to the technique limitation [78], mainly the required minimum contact area between the sample and the crystal. A similar percentage of MPs characterized by geometric dimensions enabling qualitative assessment was reported by others [79]. Representative sample spectra are presented in Figure S1. Based on the FTIR analysis of microplastic items in general, polymers containing polyethylene, polyvinyl chloride, polypropylene, polyester, and polystyrene were dominated. Plastic fragments and films have been identified as polymers containing polyethylene, polypropylene, polyvinyl chloride, and polystyrene while granule particles have been identified as polypropylene and polyethylene polymers that contain hard plastic fractions from various sources. According to results presented by others [80], we assume that small plastic granules can represent virgin microplastics, such as those used in personal care products, while microplastic fragments and films are decomposition products of commonly used plastic wraps and bags. Some blue fragments found dominantly during the summer in the Łupawa river mount (port area) consisted of polyvinyl chloride which is mainly used in industrial applications as a binder for nonwovens while blue nylon fibers in clothes, ropes, lines, and fishing nets [81].

4. Conclusions

This study provided, for the first time, distribution of MPs in lowland rivers of mountainous characteristics in northern Poland, taking into consideration their variation along the watercourse, seasonal variation, morphological types, color and geometric dimensions as well as chemical characterization of microplastics. The general abundance of MPs in Słupia and Łupawa rivers is far smaller than in rivers being under strong anthropogenic impact. Statistical analysis has proven that there were no significant differences in the content of MPs between Słupia and Łupawa Rivers, both for the entire sampling period, as well as taking into account seasonality of morphological types of the MPs, most probably because both rivers flow through the ecologically protected areas. Even though none of the statistical differences between locations and seasonality was found some descending abundance of MPs in river water was observed. Among the shape types, granules were prevalent in spring with the highest abundance in the Słupia river, followed by summer with the highest abundance in the Łupawa river and autumn, when the detected MPs in both rivers were comparable. The study clearly shows that the total MPs were significantly more abundant in a location downstream of wastewater treatment plants confirming that treated sewage effluent is a significant source of MPs in rivers. Among all morphological types, fragments were prevalent among other forms and were followed by granules and fibers. The majority of MPs found in Słupia and Łupawa rivers should be classified as small and this is why only 21.0% of them fulfilled the criteria of FTIR analysis. The FTIR characterization revealed the presence of polymers containing dominantly polyethylene, polyvinyl chloride, polypropylene, polyester, and polystyrene. Some ambiguous statistical test proves that a long-term and more systematic monitoring of MPs in rivers in northern Poland is strongly recommended.

Supplementary Materials

The following are available online at www.mdpi.com/article/10.3390/microplastics1010011/s1, Figure S1: FT-IR spectra of Poly(vinyl chloride), Poly(ethylene), Polyester and Poly(propylene). Table S1: Geographical coordination and information for each sampling site of surface water.

Author Contributions

Conceptualization, P.P. and A.M.A.; methodology, P.P.; software, A.M.A.; validation, P.P. and A.M.A.; formal analysis, P.P.; investigation, P.P. and A.M.A.; resources, A.M.A.; writing—original draft preparation, A.M.A. and P.P.; visualization, P.P.; supervision, A.M.A.; project administration, A.M.A.; funding acquisition, A.M.A. All authors have read and agreed to the published version of the manuscript.

Funding

This research was funded by the POMERANIAN UNIVERSITY IN SŁUPSK (Grant no 7-4-3 entitled “Toxicological and Physiochemical Analysis of Selected Environmental Compartments”).

Institutional Review Board Statement

Not relevant.

Informed Consent Statement

Not relevant.

Data Availability Statement

Not relevant.

Conflicts of Interest

The authors declare no conflict of interest.

References

  1. Parashar, N.; Hait, S. Plastics in the time of COVID-19 pandemic: Protector or polluter? Sci. Total Environ. 2021, 759, 144274. [Google Scholar] [CrossRef] [PubMed]
  2. Geyer, R.; Jambeck, J.R.; Law, K.L. Production, use, and fate of all plastics ever made. Sci. Adv. 2017, 3, e1700782. [Google Scholar] [CrossRef] [PubMed] [Green Version]
  3. Rajmohan, K.V.S.; Ramya, C.; Viswanathan, R.V.; Varjani, S. Plastic pollutants: Effective waste management for pollution control and abatement. Curr. Opin. Environ. Sci. Health 2019, 12, 72–84. [Google Scholar] [CrossRef]
  4. Jambeck, J.R.; Geyer, R.; Wilcox, C.; Siegler, T.R.; Perryman, M.; Andrady, A. Plastic waste in puts from land into the ocean. Science 2015, 347, 769–771. [Google Scholar] [CrossRef] [PubMed]
  5. Law, K.L.; Thompson, R.C. Microplastics in the seas. Science 2014, 345, 144–145. [Google Scholar] [CrossRef] [PubMed]
  6. Gonçalves, A. The Impacts of Microplastics: From Tea Bags and Bottled Water to Salt and Fish. In Environmental Strategy, News, Planet, Pollution, Pollution Management; 2020; Available online: https://youmatter.world/en/microplastics-types-effects-humans-nature/ (accessed on 13 December 2021).
  7. Browne, M.A.; Crump, P.; Niven, S.J.; Teuten, E.L.; Tonkin, A.; Gallowa, T.; Thompson, R.C. Accumulations of microplastic on shorelines worldwide: Sources and sinks. Environ. Sci. Technol. 2011, 45, 9175–9179. [Google Scholar] [CrossRef]
  8. Andrady, A.L. The plastic in microplastics: A review. Mar. Pollut. Bull. 2017, 119, 12–22. [Google Scholar] [CrossRef]
  9. Boucher, J.; Friot, D. Primary Microplastics in the Oceans: A Global Evaluation of Sources; IUCN: Gland, Switzerland, 2017. [Google Scholar] [CrossRef]
  10. Kole, P.J.; Löhr, A.J.; Van Belleghem, F.G.A.J.; Ragas, A.M.J. Wear and Tear of Tyres: A Stealthy Source of Microplastics in the Environment. Environ. Res. Public Health 2017, 14, 1265. [Google Scholar] [CrossRef]
  11. Lebreton, L.; Slat, B.; Ferrari, F.; Sainte-Rose, B.; Aitken, J.; Marthouse, R.; Hajbane, S.; Cunsolo, S.; Schwarz, A.; Levivier, A.; et al. Evidence that the Great Pacific Garbage Patch is rapidly accumulating plastic. Sci. Rep. 2018, 8, 4666. [Google Scholar] [CrossRef] [Green Version]
  12. Takahashi, Y.; Hamanaka, I.; Shimizu, H. Effect of thermal shock on mechanical properties of infection-molded thermoplastic denture base resins. Acta Odontol. Scand. 2012, 70, 297–302. [Google Scholar] [CrossRef]
  13. Magnusson, K.; Eliasson, A.; Frane, K.; Haikonen, J.; Hulten, M.; Olshammar, J.; Stadmark, A. Swedish Sources and Pathways for Microplastics to the Marine Environment. Report C183; Swedish Environmental Research Institute: Stokholm, Sweden, 2016. [Google Scholar]
  14. Hahladakis, N.J.; Costas, A.V.; Weber, R.; Iacovidou, E.; Purnell, P. An overview of chemical additives present in plastics: Migration, release, fate and environmental impact during their use, disposal and recycling. J. Hazard. Mater. 2018, 344, 179–199. [Google Scholar] [CrossRef] [PubMed]
  15. Ashton, K.; Holmes, L.; Turner, A. Association of metals with plastic production pellets in the marine environment. Mar. Pollut. Bull. 2010, 60, 2050–2055. [Google Scholar] [CrossRef] [PubMed]
  16. Antunes, J.C.; Frias, J.G.L.; Micaelo, A.C.; Sobral, P. Resin pellets from beaches of the Portuguese coast and adsorbed persistent organic pollutants. Estuar. Coast Shelf. 2013, 130, 62–69. [Google Scholar] [CrossRef]
  17. Bakir, A.; Rowland, S.J.; Thompson, R.C. Enhanced desorption of persistent organic pollutants from microplastics under simulated physiological conditions. Environ. Pollut. 2013, 185, 16–23. [Google Scholar] [CrossRef] [PubMed]
  18. Joo, S.H.; Liang, Y.; Kim, M.; Byun, J.; Choi, H. Microplastics with adsorber contaminants: Mechanism and Treatment. Environ. Chall. 2021, 3, 100042. [Google Scholar] [CrossRef]
  19. Zettler, E.R.; Mincer, T.J.; Amaral-Zettler, L.A. Life in the “plastisphere”: Microbial communities on plastic marine debris. Environ. Sci. Technol. 2013, 47, 7137–7146. [Google Scholar] [CrossRef]
  20. Al-Salem, S.M.; Al-Hazza’a, A.; Karam, H.J.; Al-Wadi, M.H.; Al-Dhafeeri, A.T.; Al-Rowaih, A.A. Insights into the evaluation of the abiotic and biotic degradation rate of commercial pro-oxidant filled polyethylene (PE) thin films. J. Environ. Manag. 2019, 250, 109475. [Google Scholar] [CrossRef]
  21. Moore, C.J.; Moore, S.L.; Weisberg, S.B.; Lattin, G.L.; Zellers, A.F. A comparison of neustonic plastic and zooplankton abundance in southern California’s coastal waters. Mar. Pollut. Bull. 2002, 44, 1035–1038. [Google Scholar] [CrossRef]
  22. Lestari, P.; Trihadiningrum, Y.; Wijaya, B.I.; Yunus, K.A.; Firdaus, M. Distribution of microplastics in Surabaya River, Indonesia. Sci. Total Environ. 2020, 726, 138560. [Google Scholar] [CrossRef]
  23. Jiang, C.; Yin, L.; Li, Z.; Wen, X.; Luo, X.; Hu, Z.; Yang, H.; Long, Y.; Deng, B.; Huang, L.; et al. Microplastic pollution in the rivers of the Tibet Plateau. Environ. Pollut. 2019, 249, 91–98. [Google Scholar] [CrossRef]
  24. Wang, S.; Xue, N.; Li, W.; Zhang, D.; Pan, X.; Luo, Y. Selectively enrichment of antibiotics and ARGs by microplastics river, estuary and marine waters. Sci. Total Environ. 2020, 708, 134594. [Google Scholar] [CrossRef] [PubMed]
  25. Kay, P.; Hiscoe, R.; Moberley, I.; Bajic, L.; McKenna, N. Wastewater treatment plants as a source of microplastics in river catchments. Environ. Sci. Pollut. Res. 2018, 25, 20264–20267. [Google Scholar] [CrossRef] [PubMed] [Green Version]
  26. Napper, I.E.; Baroth, A.; Barrett, A.C.; Bhola, S.; Chowdhury, G.W.; Davies, B.F.R.; Duncan, E.M.; Kumar, S.; Nelms, S.E.; Niloy, M.N.H.; et al. The abudance and characteristics of microplastics in surface water in the transboundary Ganges River. Environ. Pollut. 2021, 274, 116348. [Google Scholar] [CrossRef] [PubMed]
  27. Eo, S.; Hong, S.H.; Song, Y.K.; Han, G.M.; Shim, W.J. Spatiotemporal distribution and annual load of microplastics in the Nakdown River, South Korea. Water Res. 2019, 160, 228–237. [Google Scholar] [CrossRef]
  28. Siegfried, M.; Koelmans, A.A.; Besseling, E.; Kroeze, C. Export of microplastics from land to sea. A modeling approach. Water Res. 2017, 127, 249–257. [Google Scholar] [CrossRef]
  29. Mannerla, M.; Andersson, M.; Birzaks, J.; Debowski, P.; Degerman, E.; Huhmarniemi, A.; Häggström, H.; Ikonen, E.; Jokikokko, E.; Jutila, E.; et al. Salmon and Sea Trout Populations and Rivers in the Baltic Sea—HELCOM assessment of salmon (Salmo salar) and sea trout (Salmo trutta) populations and habitats in rivers flowing to the Baltic Sea. Balt. Sea Environ. Proc. 2011, 126A, 1–79. [Google Scholar]
  30. Obolewski, K. Macrozoobenthos patterns along environmental gradients and hydrological connectivity of oxbow lakes. Ecolog. Eng. 2011, 37, 796–805. [Google Scholar] [CrossRef]
  31. Drwal, J.; Cieśliński, R.; Fac-Beneda, J. Geographic record of human impact conformance to different water relationships along a Coastal River (The Łupawa Catchment). Quaest. Geogr. 2011, 30, 19–29. [Google Scholar] [CrossRef] [Green Version]
  32. Cyberski, J.; Jędrasik, J. The exchange and the circulation of waters in the lake Gardno. In Zlewnia Przymorskiej Rzeki Łupawy i Jej Jeziora; Korzeniewski, K., Ed.; WSP: Słupsk, Poland, 1992; pp. 199–220. (In Polish) [Google Scholar]
  33. Jasińska, E. Motion of salt water and associated fronts in tideless estuaries. Estuaries 1993, 16, 53–67. [Google Scholar] [CrossRef]
  34. Cesa, F.S.; Turra, A.; Baruque-Ramos, J. Synthetic fibers as microplastics in the marine environment: A review from textile perspective with a focus on domestic washings. Sci. Total Environ. 2017, 598, 1116–1129. [Google Scholar] [CrossRef]
  35. Napper, I.E.; Thompson, R.C. Release of synthetic microplastic plastic fibres from domestic washing machines: Effects of fabric type and washing conditions. Mar. Pollut. Bull. 2016, 112, 39–45. [Google Scholar] [CrossRef] [PubMed] [Green Version]
  36. Sillanpää, M.; Sainio, P. Release of polyester and cotton fibers from textiles in machine washings. Environ. Sci. Pollut. Res. 2017, 24, 19313–19321. [Google Scholar] [CrossRef] [PubMed]
  37. De Falco, F.; Di Pace, E.; Cocca, M.; Avella, M. The contribution of washing processes of synthetic clothes to microplastic pollution. Sci Rep. 2019, 9, 6633. [Google Scholar] [CrossRef] [PubMed]
  38. Dris, R.; Gasperi, J.; Rocher, V.; Saad, M.; Renault, N.; Tassin, B. Microplastic contamination in an Urban area: A case study in Greater Paris. Environ. Chem. 2015, 12, 592–599. [Google Scholar] [CrossRef]
  39. Kataoka, T.; Nihei, Y.; Kudou, K.; Hinata, H. Assessment of the sources and inflow processes of microplastics in the river environments of Japan. Environ. Pollut. 2019, 244, 958–965. [Google Scholar] [CrossRef] [PubMed]
  40. Institute of Meteorology and Water Management National Research Institute. Available online: https://hydro.imgw.pl/#map/17.4283,54.4828,11,true,true,0 (accessed on 15 November 2021).
  41. GeoPortal—Interactive Map. Available online: https://mapy.geoportal.gov.pl/imap/Imgp_2.html?gpmap=gp0 (accessed on 15 November 2021).
  42. Chen, J.; Wang, X.; Liu, Y.; Liu, H.; Gao, F.; Lan, C.; Yang, B.; Zhang, S.; Gao, Y. pH-responsive catalytic mesocrystals for chemodynamic therapy via ultrasound-assisted Fenton re action. Chem. Eng. J. 2019, 369, 394–402. [Google Scholar] [CrossRef]
  43. Mai, L.; Bao, L.J.; Shi, L.; Wong, C.S.; Zeng, E.Y. A review of methods for measuring microplastics in aquatic environments. Environ. Sci. Pollut. Res. 2018, 25, 11319–11332. [Google Scholar] [CrossRef]
  44. Wang, W.; Wang, J. Investigation of microplastics in aquatic environments: An overview of the methods used, from field sampling to laboratory analysis. TrAC 2018, 108, 195–202. [Google Scholar] [CrossRef]
  45. Avio, C.G.; Gorbi, S.; Regoli, F. Experimental development of a new protocol for extraction and characterization of microplastics in fish tissues: First observations in commercial species from Adriatic Sea. Mar. Environ. Res. 2015, 111, 18–26. [Google Scholar] [CrossRef]
  46. Lusher, A.L.; McHugh, M.; Thompson, R.C. Occurrence of microplastics in the gastrointestinal tract of pelagic and demersal fish from the English Channel. Mar. Pollut Bull. 2013, 67, 94–99. [Google Scholar] [CrossRef]
  47. Kaliszewicz, A.; Winczek, M.; Karaban, K.; Kurzydłowski, D.; Górska, M.; Koselak, W.; Romanowski, J. The contamination of inland Walters by microplastic fibres under different anthropogenic pressure: Preliminary study in Central Europe (Poland). Waste. Manag. Res. 2020, 38, 1231–1238. [Google Scholar] [CrossRef] [PubMed]
  48. Rodrigues, M.O.; Abrantes, N.; Gonçalves, F.J.M.; Nogueira, H.; Marques, J.C.; Gonçalves, A.M.M. Spatial and temporal distribution of microplastics in water and sediments of a freshwater system (Antuã River, Portugal). Sci. Total Environ. 2018, 633, 1549–1559. [Google Scholar] [CrossRef] [PubMed]
  49. Sekudewicz, I.; Dąbrowska, A.M.; Syczewski, M.D. Microplastic pollution in surface water and sediments in the Urban section of the Vistula River (Poland). Sci. Total Environ. 2021, 762, 143111. [Google Scholar] [CrossRef] [PubMed]
  50. Zhang, L.; Liu, J.; Xie, Y.; Zhong, S.; Yang, B.; Lu, D.; Zhong, Q. Distribution of microplastics in surface water and sediments of Qin river In Beibu Gulf, China. Sci. Total Environ. 2019, 708, 135176. [Google Scholar] [CrossRef] [PubMed]
  51. Ding, L.; Mao, R.; Guo, X.; Yang, X.; Zhang, Q.; Yang, C. Microplastics in surface waters and sediments of the Wei River, in the northwest of China. Sci. Total Environ. 2019, 667, 427–434. [Google Scholar] [CrossRef] [PubMed]
  52. Han, M.; Niu, X.; Tang, M.; Zhang, B.T.; Wang, G.; Yue, W.; Kong, X.; Zhu, J. Distribution of microplastics in surface water of the lower Yellow River near estuary. Sci. Total Environ. 2020, 707, 135601. [Google Scholar] [CrossRef]
  53. Feng, S.; Lu, H.; Yao, T.; Liu, Y.; Tian, P.; Lu, J. Microplastic footprints in the Qinghai-Tibet Plateau and their implications to the Yangtze River Basin. J. Hazard. Mater. 2021, 407, 124776. [Google Scholar] [CrossRef]
  54. McCormick, A.; Hoellein, T.J.; Mason, S.S.; Schluep, J.; Kelly, J.J. Microplastic is an Abundant and Distinct Microbial Habitat in an Urban River. Environ. Sci. Technol. 2014, 48, 11863–11871. [Google Scholar] [CrossRef]
  55. Morritt, D.; Stefanoudis, P.V.; Pearce, D.; Crimmen, O.A.; Clark, P.F. Plastic in the Thames: A river runs through it. Mar. Pollut. Bull. 2014, 78, 196–200. [Google Scholar] [CrossRef]
  56. Estahbanati, S.; Fahrenfeld, N.L. Influence of wastewater treatment plant discharges on microplastic concentrations in surface water. Chemosphere 2016, 162, 277–284. [Google Scholar] [CrossRef]
  57. Kalčikova, G.; Alič, B.; Skalar, T.; Bundschuh, M.; Žgajnar Gotvajn, A. Wastewater treatment plant effluents as source of cosmetic polyethylene microbeads to freshwater. Chemosphere 2017, 188, 25–31. [Google Scholar] [CrossRef] [PubMed]
  58. Horton, A.A.; Svendsen, C.; Williams, R.J.; Spurgeon, D.J.; Lahive, E. Large microplastic particles in sediments of tributaries of the River Thames, UK e abundance, sources and methods for effective quantification. Mar. Pollut. Bull. 2017, 114, 218–226. [Google Scholar] [CrossRef] [PubMed] [Green Version]
  59. Huang, D.; Li, X.; Ouyang, Z.; Zhao, X.; Wu, R.; Zhang, C.; Lin, C.; Li, Y.; Guo, X. The occurrence and abundance of microplastics in surface water and sediment of theWest River downstream, in the south of China. Sci. Total Environ. 2021, 756, 143857. [Google Scholar] [CrossRef] [PubMed]
  60. Scherer, C.; Weber, A.; Stock, F.; Vurusic, S.; Egerci, H.; Kochleus, C.; Arendt, N.; Foeldi, C.; Dierkes, G.; Wagner, M.; et al. Comparative assessment of microplastics in water and sediment of a large European River. Sci. Total Environ. 2020, 738, 139866. [Google Scholar] [CrossRef]
  61. Issac, M.N.; Kandasubramanian, B. Effect of microplastics in water and aquatic systems. Environ. Sci. Pollut. Res. 2021, 28, 19544–19562. [Google Scholar] [CrossRef]
  62. Mazurais, D.; Ernande, B.; Quazuguel, P.; Severe, A.; Huelvan, C.; Madec, L.; Mouchel, O.; Soudant, P.; Robbens, J.; Huvet, A.; et al. Evaluation of the impast of polyethylene microbeads ingestion in European sea bass (Dicentrarchuslabrax) larvae. Mar. Environ. Res. 2015, 112, 78–85. [Google Scholar] [CrossRef] [Green Version]
  63. Lei, L.; Wu, S.; Lu, S.; Liu, M.; Song, Y.; Fu, Z.; Shi, H.; Reley-Susman, K.M.; He, D. Microplastic particles cause intestinal damage and other adverse effects in zebrafishDanio rerio and nematode Caenorhabditis elegans. Sci. Total Environ. 2018, 619, 1–8. [Google Scholar] [CrossRef]
  64. Naidoo, T.; Glassom, D. Decreased growth and survival in small juvenile fish, after chronic exposure to environmentally relevant concentrations of microplastic. Mar. Pollut. Bull. 2019, 145, 254–259. [Google Scholar] [CrossRef]
  65. Greven, A.C.; Merk, T.; Karagöz, F.; Mohr, K.; Klapper, M.; Jovanović, B.; Palić, D. Polycarbonate and polystyrene nanoplastic particles act as stressors to the innate immune system of fathead minnow (Pimephales promelas). Environ. Toxicol. Chem. 2016, 35, 3093–3100. [Google Scholar] [CrossRef]
  66. Lu, Y.; Zhang, Y.; Deng, Y.; Jiang, W.; Zhao, Y.; Geng, J.; Ding, L.; Ren, H. Uptake and accumulation of polystyrene microplastics in zebrafish (Danio rerio) and toxic effectsin liver. Environ. Sci. Technol. 2016, 50, 4054–4060. [Google Scholar] [CrossRef]
  67. Chen, Q.; Gundlach, M.; Yang, S.; Jiang, J.; Velki, M.; Yin, D.; Hollert, H. Quantitative investigation of the mechanisms of microplastics and nanoplastics toward zebrafishlarvae locomotor activity. Sci. Total Environ. 2017, 584, 1022–1031. [Google Scholar] [CrossRef] [PubMed]
  68. Ding, J.; Zhang, S.; Razanajatovo, R.M.; Zou, H.; Zhu, W. Accumulation, tissue distribution, and biochemical effects of polystyrenemicroplastics in the freshwater fish redtilapia (Oreochromis niloticus). Environ. Pollut. 2018, 238, 1–9. [Google Scholar] [CrossRef] [PubMed]
  69. Rochman, C.M.; Kurobe, T.; Flores, I.; Teh, S.J. Early warning signs of endocrine disruption in adult fish from the ingestion of polyethylene with and without sorbetchemical pollutants from the marine environment. Sci. Total Environ. 2014, 493, 656–661. [Google Scholar] [CrossRef] [PubMed]
  70. Karami, A.; Romano, N.; Galloway, T.; Hamzah, H. Virgin microplastics cause toxicity andmodulate the impacts of phenanthrene on biomarker responses in African catfish (Clarias gariepinus). Environ. Res. 2016, 151, 58–70. [Google Scholar] [CrossRef]
  71. Hamed, M.; Soliman, H.A.; Osman, A.G.; Sayed, A.E.D.H. Assessment the effect of exposure to microplastics in Nile Tilapia (Oreochromis niloticus) early juvenile: I. Bloodbiomarkers. Chemosphere 2019, 228, 345–350. [Google Scholar] [CrossRef]
  72. Rochman, C.M.; Hoh, E.; Kurobe, T.; Teh, S.J. Ingested plastic transfers hazardous chemicals to fish and induces hepatic stress. Sci. Rep. 2013, 3, 3263. [Google Scholar] [CrossRef]
  73. Oliveira, M.; Ribeiro, A.; Hylland, K.; Guilhermino, L. Single and combined effects of microplastics and pyrene on juveniles (0+ group) of the common gobyPomatoschistus microps (Teleostei, Gobiidae). Ecol. Indic. 2013, 34, 641–647. [Google Scholar] [CrossRef]
  74. Haghi, B.N.; Banaee, M. Effects of micro-plastic particles on paraquat toxicity to common carp (Cyprinus carpio): Biochemical changes. Int. J. Environ. Sci. Technol. 2017, 14, 521–530. [Google Scholar] [CrossRef]
  75. Mallik, A.; Xavier, M.; Naidu, B.; Nayak, B. Ecotoxicological and physiological risks of microplastics on fish and their possible mitigation measures. Sci. Total Environ. 2021, 779, 146433. [Google Scholar] [CrossRef]
  76. Jovanović, B. Ingestion of microplastics by fish and its potential consequences from a physical perspective. Soc. Environ. Tox. Chem. 2017, 13, 510–515. [Google Scholar] [CrossRef] [PubMed]
  77. Jakubowska, M.; Białowąs, M.; Stankevičiūtė, M.; Chomiczewska, A.; Pažusienė, J.; Jonko-Sobuś, K.; Hallmann, A.; Urban-Malinga, B. Effects of chronic exposure to microplastics of different polymer types on early life stages of sea trout Salmo trutta. Sci. Total Environ. 2020, 740, 139922. [Google Scholar] [CrossRef]
  78. Huppertsberg, S.; Knepper, T.P. Instrumental analysis of microplastics—benefits and challenges. Anal. Bioanal. Chem. 2018, 410, 6343–6352. [Google Scholar] [CrossRef] [PubMed]
  79. Covernton, G.A.; Pearce, C.M.; Gurney-Smith, H.J.; Chastain, S.G.; Ross, P.S.; Dower, F.F.; Dudas, S.E. Size and shape matter: A preliminary analysis of microplastic sampling technique in seawater studies with implications for ecological risk assessment. Sci. Total Environ. 2019, 667, 124–132. [Google Scholar] [CrossRef] [PubMed]
  80. Cole, M.; Lindeque, P.; Halsband, C.; Galloway, T.S. Microplastics as contaminants in the marine environment: A review. Mar.Pollut. Bull. 2011, 62, 2588–2597. [Google Scholar] [CrossRef] [PubMed]
  81. Nor, N.H.M.; Obbard, J.P. Microplastics in Singapore’s coastal mangrove ecosystems. Mar. Pollut. Bull. 2014, 79, 278–283. [Google Scholar] [CrossRef]
Figure 1. Locations of the sampling sites in the catchment of the Słupia river in the Central Pomeranian region (northern Poland).
Microplastics 01 00011 g001
Figure 2. Locations of the sampling sites in the catchment of the Łupawa river in the Central Pomeranian region (northern Poland).
Microplastics 01 00011 g002
Figure 3. Seasonal (Sp–Spring, Su–Summer and Au–autumn) abundance of three categories of morphological forms of MPs in Słupia river (SR) and Łupawa river (ŁR) [items/sample] (inner ring–season, outer ring–number of items identified in river water samples).
Microplastics 01 00011 g003
Figure 4. The abundance of MPs in different sampling locations upstream (U) and downstream (D) the WWTPs or dams along the course of the Łupawa River (a) and the Słupia River (b).
Microplastics 01 00011 g004
Figure 5. Typical microscopy images of MPs (fragments ((ad,mo,t)-ŁR; (el,s)-SR), granule ((p)-SR), fibers ((o)-ŁR, (r)-SR).
Microplastics 01 00011 g005
Figure 6. Histogram of the distribution of length and width dimensions for all morphological types of MPs found in Słupia and Łupawa rivers, as well as corresponding histograms for transparent (a), blue (b), and black (c) particles.
Microplastics 01 00011 g006
Figure 7. Distribution of dominating colors of MPs for granule (a), fragments (b) and (c) in Słupia and Łupawa catchments.
Microplastics 01 00011 g007
Table 1. The results of the Mann–Whitney U test of pairwise comparisons of MPs abundance in Łupawa River (ŁR), and (SR) according to the total mass (MPs total), morphological types, and seasons (p-value > 0.05 indicates no statistically significant differences).
Morphological TypeSeasonThe Sum
of Ranks ŁR
The Sum
of Ranks SR
Mann–Whitney U Statisticp-Value
MPs totalall period546.0630.0246.00.392
granule 542.0634.0242.00.348
fragments 562.0614.0262.00.599
fibers 585.0591.0285.00.959
MPs totalSpring53.582.517.50.141
granule 58.078.022.00.318
fragments 58.577.522.50.344
fibers 63.572.527.50.674
MPs totalSummer62.573.526.50.599
granule 67.069.031.00.958
fragments 65.570.529.50.833
fibers 60.575.524.50.462
MPs totalAutumn71.564.528.50.753
granule 63.572.527.50.674
fragments 70.066.030.00.874
fibers 80.056.020.00.227
Table 2. Basic statistics of geometric dimensions of MPs according to color.
DimensionColorNMean
[mm]
Median
[mm]
Range
[mm]
Length [mm]green60.380.250.04–0.92
Width [mm] 0.270.160.03–0.66
Area [mm2] 0.190.050.001–0.521
Length [mm]transparent150.430.340.13–1.26
Width [mm] 0.350.250.03–1.65
Area [mm2] 0.160.090.009–0.605
Length [mm]yellow100.720.090.04–6.00
Width [mm] 0.710.080.03–6.100
Area [mm2] 3.680.010.001–36.60
Length [mm]blue180.310.270.03–0.92
Width [mm] 110.120.090.04–0.43
Area [mm2] 0.060.020.001–0.396
Length [mm]red60.270.120.01–0.75
Width [mm] 50.120.030.01–0.44
Area [mm2] 0.070.0010.00–0.33
Length [mm]white90.630.290.12–3.00
Width [mm] 0.590.300.08–3.10
Area [mm2] 1.130.090.01–9.30
Length [mm]black130.230.220.03–0.69
Width [mm] 90.120.090.04–0.32
Area [mm2] 0.040.010.001–0.221
Length [mm]pink30.110.120.07–0.13
Width [mm] 0.100.0600.04–0.20
Area [mm2] 0.010.0070.002–0.026
Length [mm]purple10.090.090.09
Width [mm] 0.080.080.08
Area [mm2] 0.0070.0070.007
Publisher’s Note: MDPI stays neutral with regard to jurisdictional claims in published maps and institutional affiliations.

