Article

Peroxidase-like Activity of G-Quadruplex/Hemin Complexes for Colorimetric Nucleic Acid Analysis: Loop and Flanking Sequences Affect Signal Intensity

by
Ryan P. Connelly
,
Valentina Fonseca
and
Yulia V. Gerasimova
*
Chemistry Department, University of Central Florida, Orlando, FL 32816, USA
*
Author to whom correspondence should be addressed.
Current address: Meso Scale Diagnostics, 1601 Research Blvd, Rockville, MD 20850, USA.
Submission received: 21 December 2024 / Revised: 20 January 2025 / Accepted: 20 February 2025 / Published: 3 March 2025

Abstract

:
Background/Objectives: Some G-quadruplex (G4)-forming nucleic acid sequences bind a hemin cofactor to enhance its peroxidase-like activity. This has been implemented in a variety of bioanalytical assays benefiting from analyte-dependent peroxidation of a chromogenic organic substrate (e.g., ABTS) to produce a color change. Adenine and cytosine nucleotides in the vicinity of the G4 hemin-binding site promote the peroxidation reaction. In this work, the effect of G4 loop and flanking nucleotides on the colorimetric signal of split hybridization probes utilizing hemin-G4 signal reporters was tested. Methods: G4s varying by loop sequences and flanking nucleotides were tested with hemin for ABTS peroxidation (A420), and the signal was compared with that produced by the most catalytically efficient complexes reported in the literature using one-way ANOVA and post hoc pairwise comparison with Tukey’s HSD test. The best G4s were used as signal transducers in the split peroxidase deoxyribozyme (sPDz) probes for sensing two model nucleic acid analytes, as well as in a cascade system, where the analyte-dependent assembly of an RNA-cleaving deoxyribozyme 10–23 results in G4 release. Results: Intramolecular G4s (G3T)3G3TC or G3T3G3ATTG3T3G3 were found to be the most efficient hemin PDzs. When splitting intramolecular G4 for the purpose of sPDz probe design, the addition of a flanking d(TC) sequence at one of the G4 halves or d(ATT) in a loop connecting the second and third G-tracts helps boost analyte-dependent signal intensity. However, for the cascade system, the effect of d(TC) or d(ATT) in the released G4 was not fully consistent with the data reported for intramolecular G4-hemin complexes. Conclusions: Our findings offer guidance on the design of split hybridization probes utilizing the peroxidase-like activity of G4-hemin complexes as a signal transducer.

Graphical Abstract

1. Introduction

Guanine-rich nucleic acid fragments are able to fold into guanine quadruplex (G4) structures, where four guanine residues from different guanine tracts form a planar G-tetrad with two or more tetrads staked upon each other and stabilized by the presence of monovalent cations (Figure 1) [1,2]. Such structures are highly polymorphic and can fold into parallel, antiparallel, or hybrid topologies (Figure 1b) depending on the conditions and nucleotide composition of the loops connecting adjacent guanine tracts [1,3,4]. The formation of G4s has been suggested to have a regulatory role in vivo in telomere maintenance, DNA replication, gene expression, and translation [5,6]. In vitro, G4s have been shown to serve as structural motifs of aptamers—nucleic acid-based functional analogs of antibodies [7]. In addition, G4 complexes with Fe(III)-protoporphyrin IX (hemin) exhibit a catalytic activity mimicking that of peroxidases, peroxygenases and catalase [8,9,10,11,12]. The peroxidase-like activity of G4-hemin complexes (also referred to as peroxidase-like deoxyribozyme, PDz), when paired with an oxidizable chromogenic substrate, has been widely explored in biosensing applications as it allows one to detect an analyte of interest by a color change, thus eliminating the need for expensive instrumentation to read the signal [11,13,14,15,16,17,18,19].
The mechanism of the peroxidase-mimicking activity of G4-folded sequences was proposed to be similar to that of the heme protein enzymes [11,20,21,22,23,24]. Specifically, an H2O2 molecule serves as an axial ligand for Fe(III) of hemin, and a proton transfer step promotes the conversion of Compound 0 into a catalytically active porphyrin radical cation with iron in the oxyferryl state (Compound I) (Scheme S1). Compound I reacts with an oxidizable organic substrate via a one-electron transfer to form Compound II, which accepts another electron from another substrate molecule to regenerate the resting state of hemin. When a chromogenic substrate, such as 2,2′-azino-bis(3-ethylbenzothiazoline-6-sulfonic acid) (ABTS), is oxidized by the G4-hemin complexes, the product of peroxidation (e.g., ABTS●+) absorbs visual light to yield a colored solution. Hemin was shown to bind to G4 via external π-π stacking with the 3′-terminal G-tetrad [25,26,27]. G4-hemin association affects the acidity of a water molecule coordinated to the axial position of Fe(III) in hemin, which may promote substitution of H2O with H2O2, thus enhancing the peroxidase-like activity of hemin [21].
It has been established that all-parallel G4s (Figure 1b, top left) are the most optimal for hemin binding and catalytic activity [9,11,28,29,30,31]. Folding into all-parallel G4 is stimulated by the presence of potassium ions [32,33]. The G4 topology is also affected by the length and composition of the loop fragments connecting adjacent guanine tracts [4]. In general, shorter loops were reported to promote catalytic activity due to stabilization of the parallel G4 conformation [28,34]. Additionally, the nucleotide residues in the vicinity of the hemin-binding site were suggested to promote the peroxidase activity of hemin by providing another axial ligand for the hexacoordinated Fe(III) and participating in proton transfer and decomposition of H2O2 [20,21,24,35]. Indeed, the presence of adenine or cytosine located in proximity of the bound hemin (e.g., at the 3′-end of the G4-folded oligonucleotide or at specific positions of the loops) was reported to significantly enhance the rate of PDz catalysis [23,24,36,37,38,39,40]. For multi-stranded G4s, the catalytic activity of their complexes with hemin is more pronounced if there is a 5′-terminal thymine residue [41].
With the wealth of data accumulated on the sequence-related factors affecting the peroxidase-mimicking catalytic activity of hemin in the presence of intramolecular G4 structures, the effect of these factors has not been compared under the same conditions. Moreover, the applicability of the data to analytical assays utilizing such catalytic activity to produce colorimetric output remains to be addressed. In this work, we selected the most efficient intramolecular G4 PDzs and applied them for the design of the split hybridization probes for the label-free colorimetric/visual detection of nucleic acid analytes.

2. Materials and Methods

2.1. Materials

DNA oligonucleotides (Tables S1–S3) were purchased from Integrated DNA Technologies, Inc. (Coralville, IA, USA) and either used without purification (for intramolecular G4 sequences, strands of split probes and targets) or with purification via RNase-free gel-electrophoresis by the vendor (for IPDz substrate sequences). The oligonucleotides were dissolved in nuclease-free water, and their stock concentration was calculated from their absorbance at 260 nm and the vendor-provided extinction coefficients. ABTS, hemin, and Triton X-100 were purchased from Millipore Sigma (Burlington, MA, USA). H2O2 was purchased from VWR Analytical (Radnor, PA, USA). DMSO, HEPES, NaOH, KCl, MgCl2, and NaCl, were purchased from Fisher (Fair Lawn, NJ, USA). Nuclease-free water was purchased from Invitrogen (Waltham, MA, USA).

2.2. Circular Dichroism Spectra

Samples containing oligonucleotides (~10 µM) in a buffer containing 10 mM Tris-HCl, pH 7.4, 100 mM KCl in the absence of hemin were heated at 95 °C for three minutes and slowly cooled to room temperature overnight to ensure their folding into G4 structures. The samples were stored at 22 °C before analysis. Circular dichroism spectra were recorded with a J-1500 spectropolarimeter (Jasco, Japan) using a 4 mm-path cell. Data were obtained with a 1 nm bandwidth, D.I.T.= 4 s and a scan speed of 50 nm/min from 320 to 220 nm at 0.1 nm intervals. Spectra were collected as an average of four scans at 22 °C, having the spectrum of the buffer as a baseline. The collected spectra were processed by performing a 100-point Savitzky–Golay smoothing using Origin software. Conversion of the CD data from ellipticity (θ) into molar circular dichroism (Δε) was achieved by accounting for the oligonucleotide molarity (C) calculated based on the absorbance of the samples at 260 nm and the pathlength (l) using the equation below.
ε = θ 32980 × C × l

2.3. Colorimetric Assay with Unimolecular G-Quadruplex Sequences

Samples (60 µL) containing G4-forming oligonucleotides (1 µM) were prepared in a buffer containing 50 mM HEPES-NaOH, pH 7.4, 50 mM MgCl2, 20 mM KCl, 120 mM NaCl, 1% DMSO, and 0.03% Triton X-100) at ambient temperature (22 °C). Hemin and ABTS were separately dissolved in DMSO and then mixed for their concentrations to be 15 μM and 40 mM, respectively. Then, 1.5 μL of the hemin/ABTS mixture was added to the samples. H2O2 (0.6 μL of 100 mM aqueous stock solution) was then added to a final concentration of ~1 mM, and the samples were incubated for 15 min at ambient temperature before measuring their absorbance at 420 nm. Absorbance measurements were taken using the pedestal microvolume mode of a NanoDrop OneC spectrophotometer (ThermoFisher, Waltham, MA, USA).

2.4. Colorimetric Assay with Split Peroxidase Deoxyribozyme (sPDz) Probes

Samples (60 µL) were prepared by mixing two strands of the sPDz probe (1 µM each) in a buffer containing 50 mM HEPES-NaOH, pH 7.4, 50 mM MgCl2, 20 mM KCl, 120 mM NaCl, 1% DMSO, and 0.03% Triton X-100) at ambient temperature (22 °C) either in the absence (for “blank”) or presence of the oligonucleotide targets (1 μM) complementary to the target-binding fragments of the sPDz probe. Hemin and ABTS were separately dissolved in DMSO and then mixed for their concentrations to be 15 μM and 40 mM, respectively. Then, 1.5 μL of the hemin/ABTS mixture was added to the samples. H2O2 (0.6 μL of 100 mM aqueous stock solution) was then added to a final concentration of ~1 mM, and the samples were incubated for 5 min at ambient temperature before measuring their absorbance at 420 nm using the pedestal microvolume droplet mode of a NanoDrop OneC spectrophotometer (ThermoFisher, Waltham, MA, USA). Images of the sample tubes were taken with a smartphone camera.

2.5. Colorimetric Assay with a Cascade System Based on Split Deoxyribozyme (sDz) Probe Releasing G4 Sequences with the PDz Activity

Samples (60 μL) were prepared by mixing of IPDz substrate (1 µM) with corresponding DzS and DzU strands (0.1 μM each) in a buffer containing 50 mM HEPES-NaOH, pH 7.4, 50 mM MgCl2, 20 mM KCl, 120 mM NaCl, 1% DMSO, and 0.03% Triton X-100) either in the absence of targets (for the blank sample) or in the presence of a 80-nt synthetic DNA strand (0.1 μM) corresponding to a fragment (nts 921–981) of the katG gene of Mycobacterium tuberculosis, strain H37Rv (GenBank KP746902) (MT80, Table S3). As a control, a sample containing only IPDz in the buffer was prepared. The samples were incubated at 50 °C for 1 h, then cooled at room temperature for 5 min to allow for the G4 reporter to fold. Next, 2 μL of the mixture containing hemin (11.8 μM) and ABTS (31.5 mM) in DMSO were added to the samples, followed by addition of 1 μL of aqueous solution of H2O2 (63 mM). The samples were incubated for 10 min at room temperature (22 °C), then images of the sample tubes were taken with a smartphone camera, and the absorbance of the samples at 420 nm was measured using the pedestal microvolume mode of a NanoDrop OneC spectrophotometer.

2.6. Statistical Analysis

The data analysis was performed using the statistics package of Origin or on-line GraphPad tool. To determine if there were any statistically significant differences between the data sets, a one-way ANOVA was performed. If significant differences were observed, a pairwise post hoc comparison was performed using Tukey’s Honest Significant Difference (HSD) test. To calculate signal-to-background ratios (S/B) for the sPDz probes, the average values for the target-induced signal (S, n ≥ 3) were divided by the average blank signal obtained in the absence of the target (B, n ≥ 3). The standard deviation of the ratio ( σ S / B ) was calculated using the error propagation equation:
σ S / B = S B × σ S 2 S 2 + σ B 2 B 2

3. Results

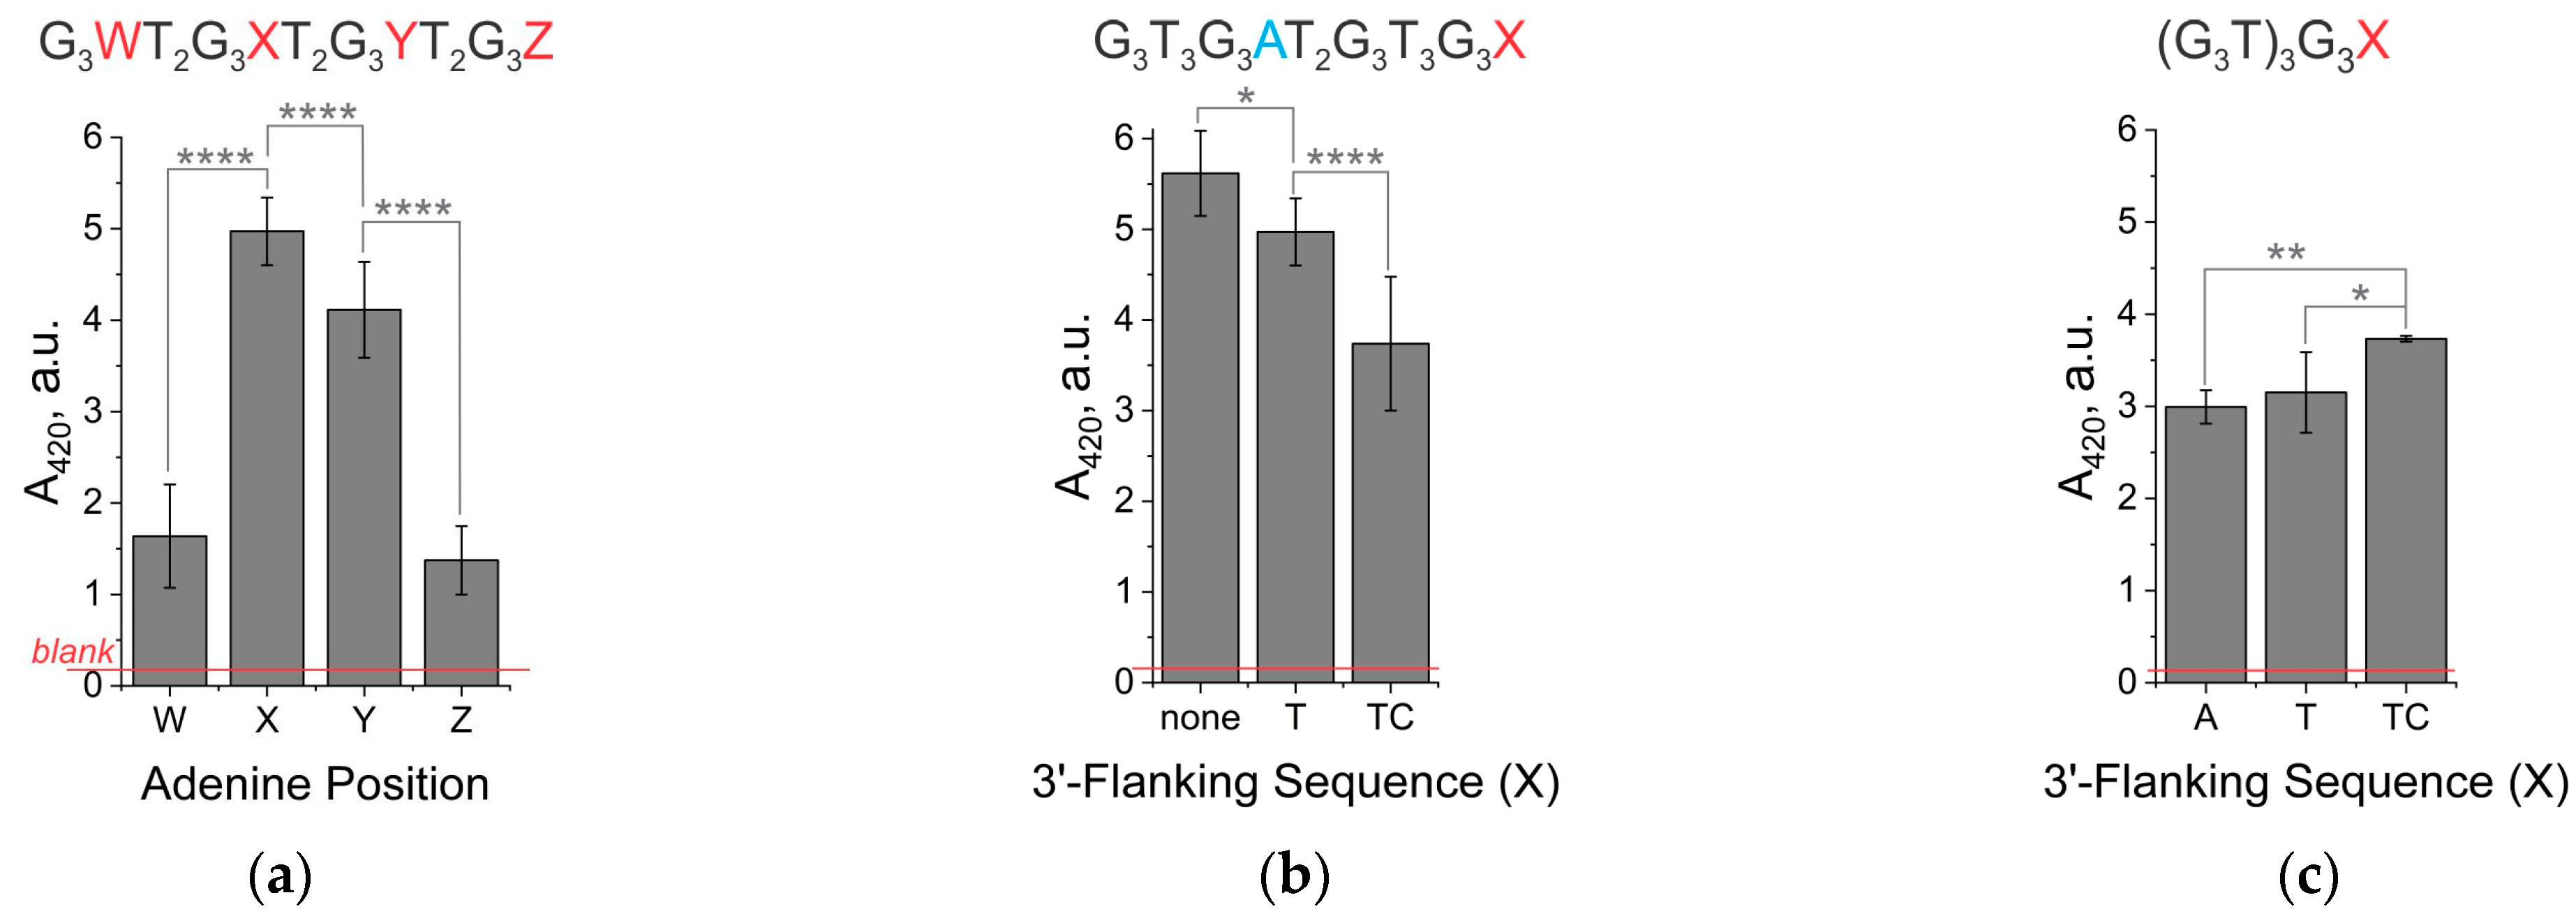
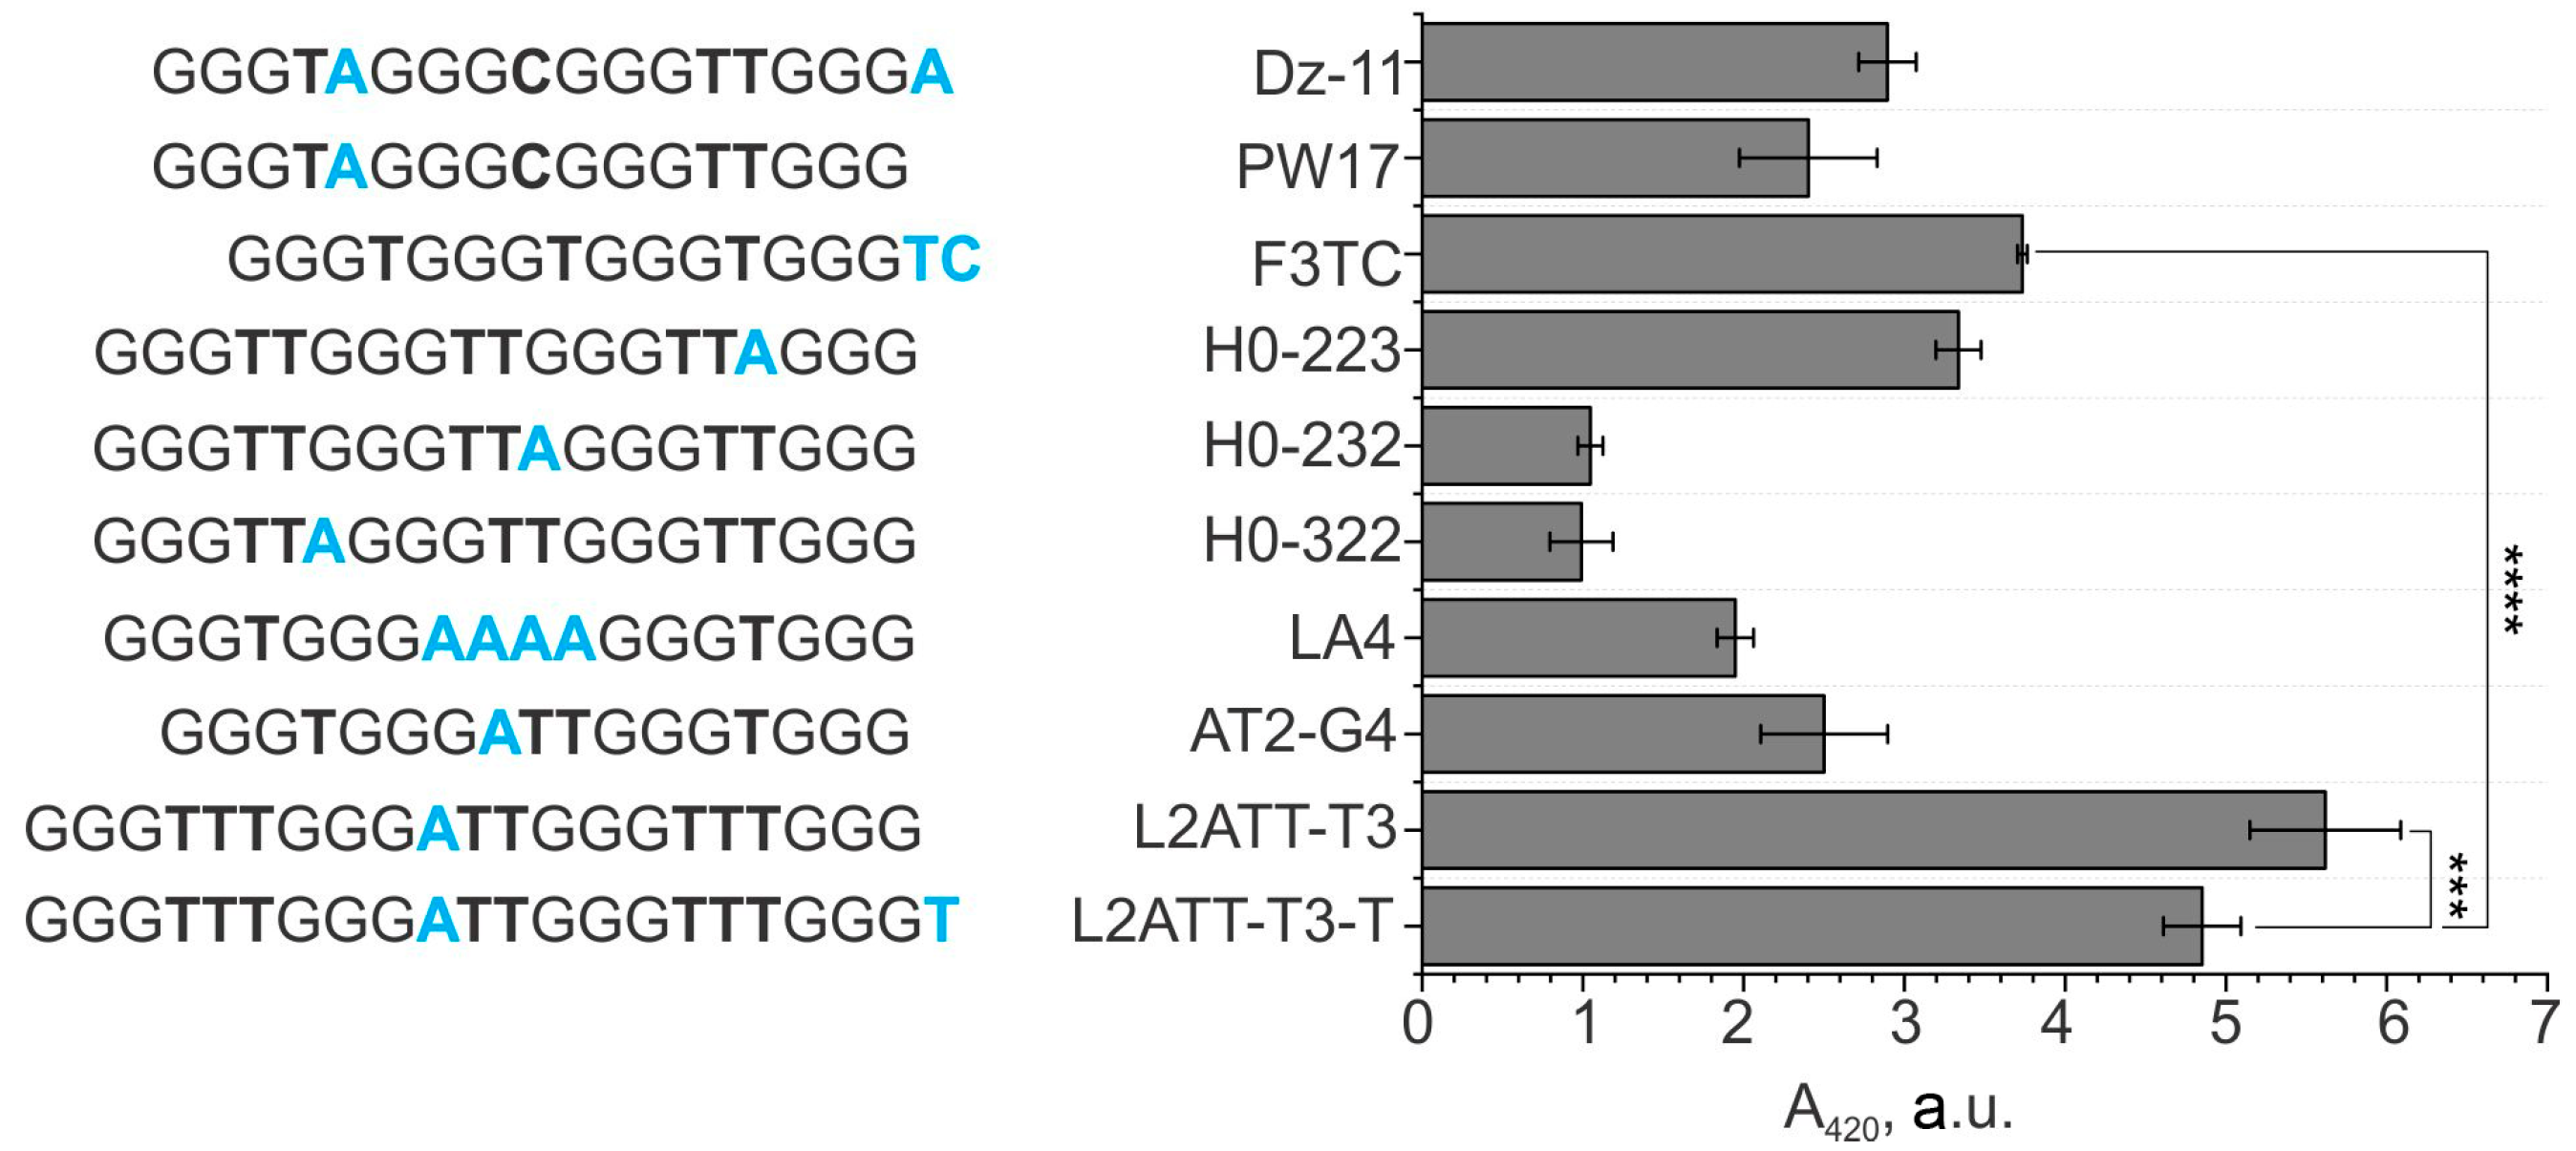
3.1. The Signal Intensity of the Peroxidase-like Activity of Hemin in Complex with Unimolecular G4 Depends on the Presence of Adenine in the Second Loop or 3′-Terminal Nucleotides

When utilizing a G4 as a signal transducer for sequence-specific nucleic acid interrogation, the nucleotide sequence of the transducer may engage in base-pairing with a fragment of the analyzed nucleic acid sequence due to a partial complementarity. This may compromise the performance of hybridization probes. In such a case, adjustment of the G4-forming nucleotide sequence, specifically the loops connecting adjacent G-tracts, can provide a solution via destabilization of the intermolecular interactions. At the same time, the nucleotide sequence of G4 loops is known to affect the catalytic properties of G4 PDzs and, as a result, compromise the color intensity generated in colorimetric molecular assays. Therefore, to find the extent of allowable changes, we compared absorbance of ABTS oxidized by H2O2 in the presence of hemin complexes with a series of G4s containing loops of different lengths and either no or 1–2 nucleotides on the 3′-end of the last G-tract. All experiments were performed under the same conditions to exclude the effect of buffer composition and reactant concentrations.
First, sequences with an increasing number of thymine residues per loop (Table S1, G4 series I and II) were tested. In accordance with the literature data, oligonucleotides with longer loops exhibited diminished ability to enhance the peroxidase-like activity of hemin, and the pattern in signal intensity was similar for the G4 sequences flanked with 3′-terminal thymine or adenine (Figure S1a,b). In both series I and II, absorbance of the samples containing G4s with one or two thymine residues in each loop was ~3 a.u., with a decrease in signal to 1.4–2.2 a.u. (depending on the 3′-terminal nucleotide) when the loops contained three thymine residues. The signal dropped to the background (hemin only) level of 0.15 ± 0.4 a.u. only in the case of 4 or 5 Ts per loop. This trend correlated well with the topology of G4s analyzed by CD spectroscopy (Figure S2a,b) revealing all-parallel conformation for (G3T)3G3T and (G3TT)3G3T, while non-parallel (either hybrid or mixed) conformations were observed for (G3Tn)3G3T, n = 3, 4 or 5. This is not surprising as folding into a parallel G4 is known to allow for more efficient hemin binding and/or catalysis of the peroxidation reaction [29].
It was previously reported that incorporation of adenine in the G4 loops to position it in proximity to the bound hemin (at the 3′-terminal side of each G-tract) promotes the peroxidase-like activity of G4-hemin complexes [24]. Therefore, we compared performance of series I and II oligonucleotides—(G3Tn)3G3X (X = A or T)—with the sequences that had T > A substitution at the 5′-terminal position of each loop—(G3ATn)3G3X (X = A or T) (Table S1, series III and IV). Similar to series I and II, elongation of the loops to 4 or 5 nucleotides inhibited the catalytic effect of G4 on ABTS peroxidation (Figure S1c,d). The sequences with ATT loops exhibited a remarkable ~2–3-fold increase in signal intensity over the adenine-less 3-nt loop sequence (Figure S1, compare panels (a) for n = 3 with (c) for n = 2, and (b) for n = 3 with and (d) for n = 2). Interestingly, the CD spectra indicated a non-parallel character for the folding of the highest performers in the series—(G3AT2)3G3T and (G3AT2)3G3A, while the sequences (G3AT)3G3T and (G3AT)3G3A, which triggered lower catalytic activity, exhibited a parallel G4 topology (Figure S2c,d). Next, we explored the position and number of adenines in the trinucleotide loops (Table S1, series V–VII). It was observed that the enhancing effect of adenine was strongly associated with the loop connecting the second and third G-tracts (Figure 2a), and that this adenine needs to be positioned as the 5′-nucleotide of the loop for the highest absorbance (Figure S3a, position X). Moreover, additional adenines in the same loop decrease the catalytic ability of the G4 (Figure S3b). Despite eliciting different responses in terms of the peroxidase-like activity, all tested G4s exhibited similar CD spectra (Figure S4), which correspond to a hybrid “3 + 1” topology [42]. This is the most polymorphic G4 topology as it encompasses 12 different architectures varying with the type of loops connecting the G-strands [43]. Considering hemin association with the 3′-terminal G-tetrad to form a complex with the peroxidase-like activity, our observations regarding the position of adenine in the loops necessary for the activity can be explained by the G4 folding with a lateral trinucleotide loop connecting the first and second guanine stretch followed by two propeller trinucleotide loops (Figure S5a).
Finally, we examined the effect of the flanking nucleotides at the 3′-end of G4s (Table S1, series VIII–X). In line with a proposed role of adenine or cytosine in coordinating H2O2 and/or a proton transfer step for the peroxidation mechanism [24,40], we tested several G4 sequences containing 3′-flanking dT, d(TC) or dA. Interestingly, while for the G4 containing either d(ATT) loops (Table S1, VIII) or trithymidylate loops with d(ATT) as a second loop (Table S1, IX), either dT or d(TC) at the 3′-end caused a significant decrease in the ABTS●+ absorbance (Figure 2b and Figure S3c), for the G4 with all monothymidylate loops, the presence of the 3′-flanking d(TC) rendered a higher absorbance than the signal observed with (G3T)G3T or (G3T)G3A sequences (Figure 2c; Table S1, X). The 3′-flanking nucleotides do not affect the G4 topology of the tested samples (Figure S6).
Overall, we found that the presence of adenine residues in one or more loops of G4 is not only tolerable but may be beneficial for the peroxidation reaction. A d(ATT) sequence in the second G4 loop without 3′-flanking nucleotides yields the highest absorbance upon hemin-catalyzed ABTS peroxidation even when compared with other G4s that were reported to exhibit high PDz activity when bound to hemin (Figure 3). If shorter signal transducers are desirable, (G3T)G3 can be flanked at its 3′-end with a d(TC) sequence to enhance the catalytic effect.

3.2. A Comparison of the Performance of the sPDz Probes Utilizing Different G4 Sequences as a Signal Transducer

It is well acknowledged that the peroxidase-mimicking catalytic activity of hemin can be promoted not only by intramolecular G4 structures but also when the G-tracts are contained in different DNA molecules [41]. This property has been used for bioanalysis, when the G4 formation is dependent on the presence of an analyte of interest, for example a specific nucleic acid sequence [43]. We and others have previously explored split peroxidase deoxyribozyme (sPDz) probes for colorimetric detection of human SNPs and genetic signatures of viruses and bacteria [15,43,44,45,46,47,48,49,50,51]. The improvement in ABTS peroxidation by intramolecular G4s upon altering their loop sequences may translate to similar improvements for the sPDz probes that are used for colorimetric analysis of nucleic acids. The sPDz probes are composed of two DNA strands, each of which has a portion of the G4-forming signal transducer. These signal-transducing fragments are connected to the analyte-binding fragments such that the G4 structure is formed only when a complementary nucleic acid analyte brings the two strands in proximity (Figure 4a).
We chose two nucleic acid sequences—EC60 corresponding to a 60-nt fragment of the rrs gene encoding 16S rRNA in Escherichia coli, and MT80, an 80-nt fragment of the katG gene from M. tuberculosis—as model DNA analytes (Table S3, Figure S7). The interrogated fragment of the analyte was split between the two strands of the sPDz probe in such a way that one analyte-binding fragment was designed longer than another. The function of this long target-binding fragment of strand U of the probe is to unwind the analyte’s intramolecular structure and promote binding of another strand of the probe—strand S, which is also responsible for maintaining the ability of the sPDz probe to differentiate between closely related nucleic acid analyte sequences. To split the nucleotides of the G4 signal transducer, we followed an algorithm previously developed by our team [49]. For example, the probe-interrogated fragment of EC60 is free from extensive clusters of G or C, which could cause either high background, low signal and/or low selectivity of the probe. Therefore, we chose to split the G-tracts of the transducer asymmetrically, so that strands U and S contain three G-tracts (9 guanine residues) and one G-tract (3 guanine residues) in their signal-transducing fragments, respectively (Figure 4b). For MT80, the fragment complementary to the probe contained several tracts of two cytosines, which is a factor that potentially could cause high background and/or low signal in case of asymmetrical splitting of the G4-sequence. Therefore, we selected the probe with symmetric G4 splitting (6U and 6S), in which the strands contained two tracts of guanines in each signal-transducing fragment. The loop nucleotides were varied to have either one thymine per loop or d(TTT)/d(ATT) loops, according to the data obtained for intramolecular G4 sequences. In addition, the effect of dT, dA or d(TC) at the 3′-end of the last guanine tract of strands S and/or U was tested, as well as the effect of d(ATT) flanking the 5′-terminal signal-transducing fragment for the MT80-specific sPDz made of 6U and 6S. The sequences for the designed probes are listed in Table S3. Possibilities of intermolecular G4 formation in the sDz probes are schematically illustrated in Figure S5b.
The formation of intermolecular G4s in the complex of the sPDz probe with its complementary analyte EC60 resulted in less efficient ABTS peroxidation than in the case of the correspondent intramolecular G4s; the highest absorbance was observed to be ~2.5 a.u. (instead of ~4–5 a.u. for the best intramolecular G4) (Figure 4c). This can be attributed, at least partially, to the dithymidylate linker between the signal transducing and analyte-binding fragments of the probe-constituting strands (as discussed below for the sPDz probe designed to recognize another model analyte MT80). Having a d(TC) 3′-flanking sequence at strand 3S (position FS in Figure 4b) instead of dA or dT improved the signal intensity without compromising the background intensity in the absence of the target (blank) (Table S4) for all tested probes except the one that also contained a 3′-flanking d(TC) at strand U (position FU in Figure 4b). A similar effect of the 3′-flanking d(TC) element was observed when the dinucleotide was positioned after the last G-triplet of strand 9U (position FU in Figure 4b), except for the EC60-specific strand 9U with d(TTT)/d(ATT) loops (Figure 4c, Table S4). Thus, having 3′-flanking d(TC) on both strands S and U inhibits the signal. Interestingly, the superior performance of G3T3G3ATTG3T3G3T over (G3T)G3TC (Figure 3, L2ATT-T3-T vs. F3TC) did not translate into a statistically significant difference for the target-dependent signals obtained in the case of the correspondent sPDz probes (Figure 4c, compare 13th and 3rd bar). It should be noted that even though the background for all probes tested was similar and did not exceed 0.25 a.u. (Table S4), the calculated signal-to-background ratios (S/B) showed a high degree of variation for the probes exhibiting similar target-induced signal due to the error propagation. The S/B of 10–25 was typically observed, with the highest S/B (but not the absorbance signal) noted for the probe containing both the 3′-flanking d(TC) sequence in strand 3S and a d(ATT) loop in strand 9U (Table S4). The position of d(ATT) in the loops was important. There are two possibilities to split an intramolecular G4 with the second d(ATT) loop into two asymmetric strands—at loop 1 or loop 3 (Figure S5). The fact that the sPDz probe with d(ATT) placed between the second and third guanine tracts exhibited a higher signal than the probe with d(ATT) between the first and second guanine tracts (Figure 4c, compare bars 7–12 to 13–18) supports that the G4 splitting geometrically occurs at the third but not the first loop of the intramolecular G4.
Testing of the sPDz probe variants targeting MT80 confirmed the beneficial effect of 3′-flanking d(TC) sequence (Figure 4d). However, the presence of d(ATT) as a 3′-flanking fragment of strand 6U (position F3, Figure 4d and Figure S5b), which would be analogous to the second d(ATT) loop of intramolecular G4s, did not improve the signal. It is not clear whether these nucleotides constitute a flexible domain or engage in additional interactions with other nucleotides of the probe to bring the adenine residue in vicinity of hemin bound at the 3′-terminal G-tetrad of the intramolecular G4.
As elongation of the G4-fragments with the analyte-binding fragments and their hybridization to the analyte can be affected by the flexibility of a spacer connecting the two domains, we also compared the performance of the probes with no spacer and either T or TT as a spacer. It was shown that only one T in the spacer position can be tolerated without decreasing the signal (Figure 4d, bottom, compare last 3 bars, Table S6). These nucleotides would need to span the groove between the 5′- and 3′-terminal G-tracts of strands U and S, respectively, in a propeller loop manner to enable formation of the sPDz-analyte complex (Figure S5b, rightmost structure). Despite a statistically significant drop in the target-induced signal for the dithymidylate spacer-containing probe in comparison to one thymine between the analyte-binding and G4-forming domains, the difference in the S/B values was not significant (Table S5).

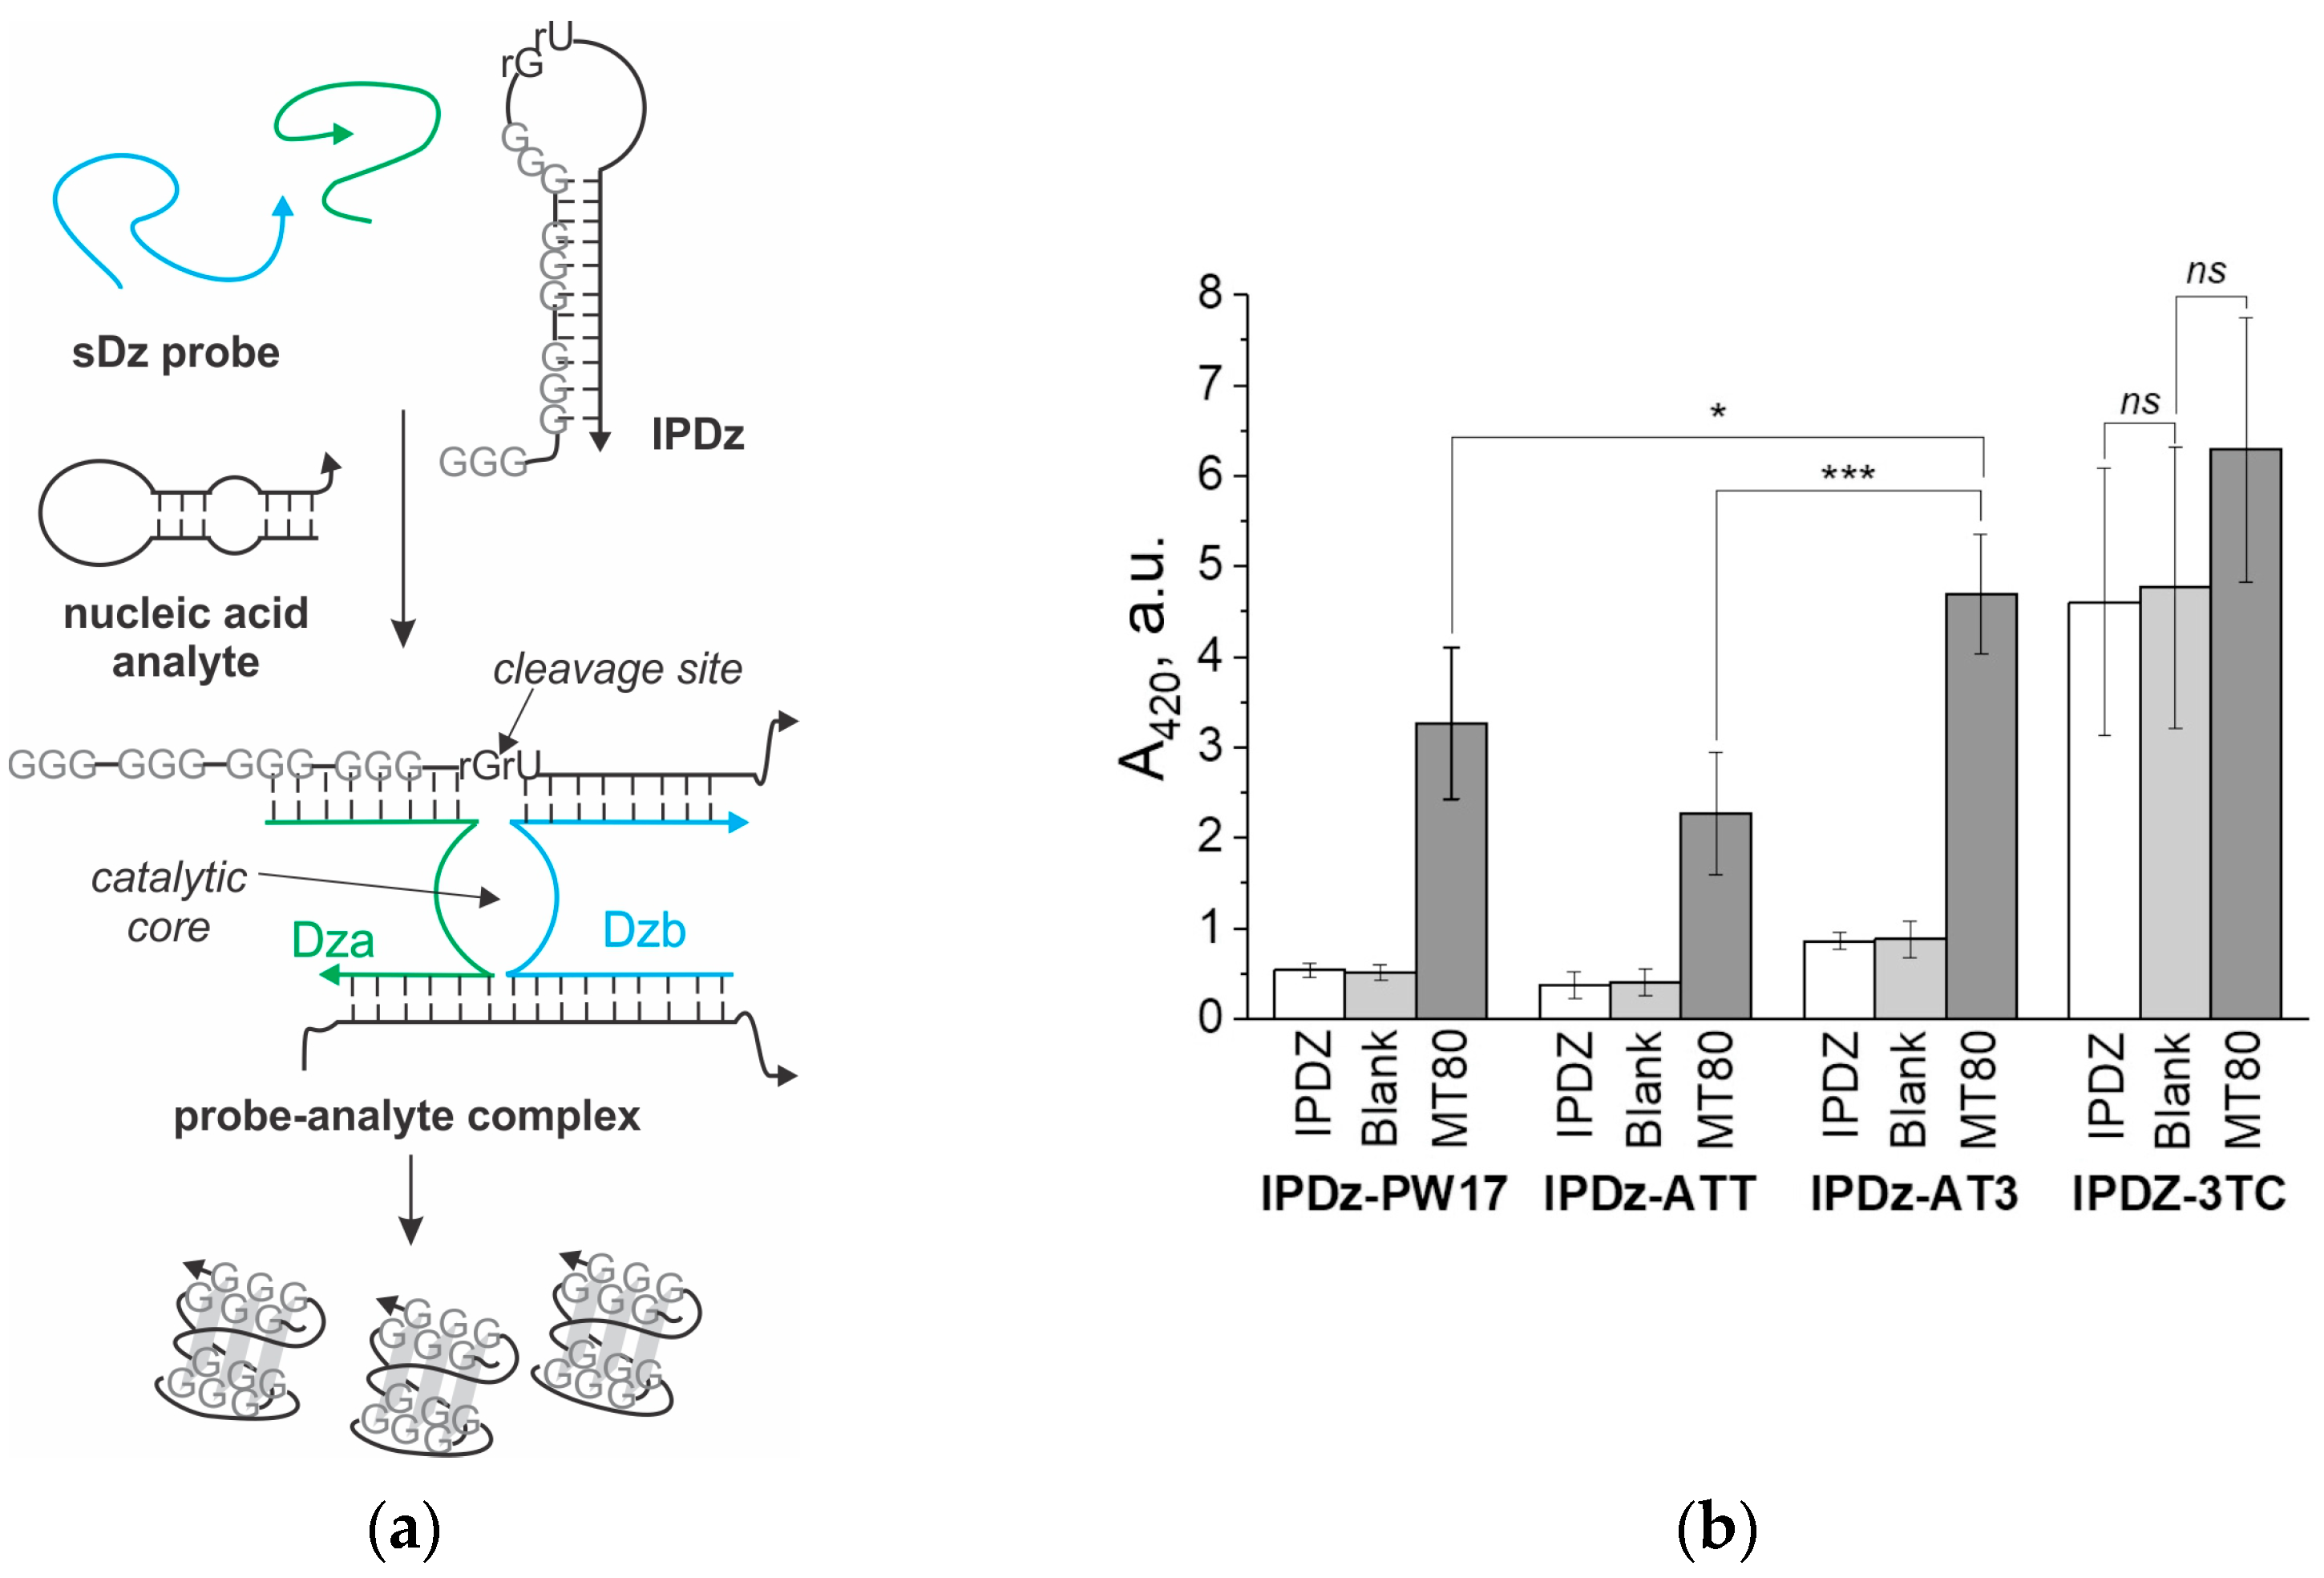
3.3. A Comparison of the Performance of the Cascade sDz/PDz Probes Utilizing Different G4 Sequences as a Signal Reporter

We have previously explored the colorimetric signal output provided by PDz in a cascade system containing a split RNA-cleaving deoxyribozyme (sDz) assembled into a catalytically active construct by hybridizing with a nucleic acid analyte [52,53,54,55]. The sDz complex with the analyte recognizes and cleaves an inhibited PDz (IPDz) substrate to thereby release the G4 fragment for hemin binding and subsequent PDz activity (Figure 5a). To test the effect of loop sequences and a 3′-flanking d(TC) sequence on the absorbance of the oxidized ABTS, we designed three IPDz variants—IPDz-ATT, IPDz-AT3 and IPDz-3TC (Table S3)—that contained the sequences of L2ATT-T3, AT3-G4 and F3TC (Tables S1 and S2), respectively. In designing the IPDz sequences, the stability of the stem was ensured to be close to the energy of intramolecular stem-loop structure predicted for IPDz-PW17 (Figure S6), which was previously optimized for the cascade sDz/PDz system [53]. The IPDz-binding fragments of strands Dza and Dzb constituting the sDz component of the system were designed to form complexes with IPDzs exhibiting a melting temperature of 42–49 °C under the assay conditions, which was previously shown to ensure efficient binding to intact IPDz and release of the cleaved IPDz fragments [53,54,55,56]. All designed sDz/PDz probes interrogated MT80 (Table S3).
Unexpectedly, MT80-dependent cleavage of IPDz-ATT resulted in the lowest signal (Figure 5b). The sequence released upon the cleavage of IPDz-ATT contains an additional d(TTC)rG fragment at the 3′-end, which can explain the lower signal as it is consistent with the effect of 3′-terminal dT or d(TC) on the activity of G3T3G3AT2G3T3G3X (Figure 2b). The signal was not statistically different than that triggered by the previously utilized IPDz-PW17. In the case of the probe utilizing IPDz-3TC, there was no statistically significant difference between the absorbance intensities for the samples containing just IPDz, the probe in the absence or in the presence of the analyte.

4. Discussion

Split peroxidase-like deoxyribozymes have gained interest for nucleic acid analysis at the point-of-care as they allow the signal to be read without the need for instrumentation. To design an efficient G4-based probe, several elements need to be considered—the analyte-binding module, the signal-transducing module and a linker that connects the two modules. Previously, we have developed an algorithm of designing the sPDz probes based on the primary structure of the nucleic acid target to be interrogated and, correspondingly, the analyte-binding module [49]. Specifically, we linked the presence of cytosines and guanines clusters in the analyte’s fragments complementary to the probe to the G4 splitting into the signal transducing fragments of the probe: clusters of Cs would necessitate symmetric G4 splitting into 6 guanines in each strand of the probe to avoid high background and/or low signal, while asymmetric splitting of the G4 sequence could lead to a low background if the analyte has a cluster of Gs. In addition, it was demonstrated that embedding flexible non-nucleotide linkers between the analyte-binding and signal-transducing fragment enhances the signal due to providing flexibility for the G4 to form in the presence of the nucleic acid analyte [49]. This would be, in most cases, at the expense of selectivity, especially if single-base variations in the analyte’s sequence need to be differentiated. In the current work, we observed that placement of one thymine as a linker helps to increase the signal of the sPDz probes with respect to direct connection of the signal-transducing and analyte-binding domains, while extending the linker to two thymines reverses the effect of the monothymidylate linker. This further emphasizes the importance of the linker for the performance of the probe.
The nucleotide composition of the loops and flanking fragments of G-quadruplexes was shown to affect the peroxidase-like activity of their complexes with hemin [23,24,36,37,38,39,40]. In particular, dA and dC proximal to hemin, which are thought to be functional analogs of a distal His residue in protein peroxidases, cause significant enhancement in PDz activity due to the nucleobases’ role in general acid-base catalysis [23,24]. Our data agrees with the positive role of 3′-flanking dA and dC residues. However, we demonstrated that the dA effect is the greatest (corresponds to the highest amount of ABTS●+ produced based on A420) when the nucleotide is in the first position of a trinucleotide second loop (Figure 3, L2ATT-T3). The 3′-flanking d(TC) serves as an enhancing factor only when there are no adenine-containing loops.
When the G4 sequence is split to constitute the signal transducer of the sPDz probes, splitting position may affect the ability of adenine and/or cytosine nucleobases to modulate the PDz activity. Here, we tested two types of the sPDz probes—one containing two G-clusters on each of the strands of the probe and another with the G4 split asymmetrically (one G-cluster in one strand and three G-clusters in another). The enhancing effects of 3′-flanking d(TC) was observed regardless of the splitting manner. For the asymmetrically split G4 in the sPDz probe, such a flanking sequence can be inserted either at the 3′-end of the strand containing one G-cluster or between the last G-cluster and a linker connecting the signal-transducing and analyte-binding fragments of the probe. Based on the geometric considerations of the G4 formed in the presence of the analyte (Figure S5b), in either case the d(TC) sequence will flank the 3′-terminal G-tetrad of the analyte-associated G4 structure, which is consistent with hemin-binding site being at the 3′-terminal G-tetrad, and the role of the proximal nucleobases in promoting Compound I formation in the catalytic cycle of the peroxidation reaction (Scheme S1) [24].
To see if the presence of d(ATT) in the second loop enhances the amount of the peroxidation product in the case of the sPDz probes, two probes with the d(G3TTTG3ATTG3TTTG3) split asymmetrically for the signal transducer were tested. When the splitting yielded into ~G3TTT and G3ATTG3T3~, the analyte-dependent signal was much lower than the one observed with the sPDz probe composed of ~G3TTT and G3 T3G3ATT~ (Figure 4c). Since for the intramolecular G4s the beneficial effect of the d(ATT) loop was observed only when the sequence was in loop 2, the observed behavior of the asymmetrically split and analyte-associated intermolecular G4 can be explained by the fact that the split site is indeed loop 3 and not loop 1 (Figure S5b). This observation can be helpful in designing the sPDz probes.
Finally, we applied our findings regarding the most efficient intramolecular G4 PDzs for a cascade biosensing system releasing an intramolecular G4 upon analyte-dependent cleavage of a structurally constrained and therefore inhibited sequence that we refer as IPDz (Figure 5a). Specifically, the released G4 sequences were designed to contain the most efficient G4 PDzs: G3T3G3ATTG3T3G3, G3TG3ATTTG3TG3, (G3T)4C or G3TAG3CG3T2G3 (Tables S1 and S3, sequences L2ATT-T3, AT3-G4, F3TC or PW17, respectively). However, statistically significant enhancement in the analyte-dependent signal compared to the previously explored IPDz-PW17 was only observed for the cascade systems based on IPD-3TC and IPDz-AT3 (Figure 5b). Such a lack of correlation between the sPDz activity of the released G4 sequences and the correspondent intramolecular G4s could be explained by the 3′-flanking d(TTC)rG fragment intrinsically present in all the released G4 due to the design constraints. In addition, for the system with IPDz-3TC, no statistically significant difference was observed between the signals of the samples containing IPDz only, all probe components in the absence of the analyte, and all probe components in the presence of the analyte. This could be explained by insufficient sequestering of the G4 fragments in the stem-loop structure of IPDz-3TC. Even though the predicted energy is in the range of those for other IPDz sequences (Figure S8), the DNA G4 folded from the sequences of d(G3T)4 is known to possess anomalous stability in comparison with other intramolecular DNA G4 [33]. This would shift the equilibrium away from the stem-loop IPDz structure. Despite the high signal intensity observed for the system based on IPDz-3TC, its practicability would depend on whether it is possible to re-design IPDz-3TC to inhibit preferential G4 folding before analyte-triggered IPDz cleavage.

5. Conclusions

In this work, we tested the effect of factors that enhance the performance of intramolecular G4 in ABTS peroxidation reactions on the performance of the intermolecular G4 formed when the guanine tracts in two different strands are brought into proximity by hybridization with a nucleic acid analyte (sPDz probes). It was found that similar trends regarding loop/flanking sequences improve the performance of both the sPDz probes and intramolecular G4. Specifically, the signal can be enhanced by placing d(TC) as a 3′-flanking fragment. Even though having an adenine as the first nucleotide of the second trinucleotide loop was found to be beneficial for the performance of intramolecular G4, the presence of a d(ATT) loop in the fragments of asymmetrically split G4 in sPDz did not improve the hemin’s peroxidase-like activity. For the sDz/PDz cascade system, the use of (G3T)3G as a scaffold for the G4-releasing signal transducer is not recommended due to the high stability of G4 disfavoring its sequestering in a stem-loop structure.

Supplementary Materials

The following supporting information can be downloaded at: https://www.mdpi.com/article/10.3390/dna5010012/s1, Scheme S1: Catalytic cycle of ABTS peroxidation by G4-hemin complex; Figure S1: Absorbance of ABTS●+ generated due to PDz activity of hemin in complex with the G4 sequences with varying nucleotide composition of the loops between adjacent guanine tracts and/or 3′-flanking regions; Figure S2: CD spectra for the intramolecular G4 (series I–IV); Figure S3: Absorbance of ABTS●+ due to the PDz activity of hemin in complex with the G4 sequences of varying nucleotide composition in the loops between adjacent guanine tracts and/or 3′-flanking regions; Figure S4: CD spectra for the G4 series V and VI; Figure S5: Proposed folding of the intramolecular G4 with trinucleotide loops and possible arrangements of the G-tracts upon its splitting to form strands S and U of the sPDz probe; Figure S6: CD spectra for the G4 series VIII–X; Figure S7: Prediction of intramolecular structures formed in the nucleic acid analytes; Figure S8: Prediction of intramolecular stem-loop structures formed in the IPDz substrates; Table S1: Sequences of intramolecular G-quadruplexes tested for the enhancement in the peroxidase-like activity of hemin in this study; Table S2: Sequences of intramolecular G4s reported to be efficient in enhancing peroxidase-like hemin activity; Table S3: Oligonucleotides for the split probes and targets used in the study; Table S4: Average absorbance values at 420 nm for ABTS●+ generated due to peroxidase-mimicking catalytic activity of hemin in the presence of sPDz-EC60 complex; Table S5: Average absorbance values at 420 nm for ABTS●+ generated due to peroxidase-mimicking catalytic activity of hemin in the presence of sPDz2-MT80 complex; Reference [57] is cited in the supplementary materials.

Author Contributions

Conceptualization, R.P.C. and Y.V.G.; methodology, R.P.C. and Y.V.G.; formal analysis, R.P.C., Y.V.G. and V.F.; investigation, R.P.C., Y.V.G. and V.F.; resources, Y.V.G.; writing—original draft preparation, Y.V.G.; writing—review and editing, R.P.C., Y.V.G. and V.F.; visualization, R.P.C., Y.V.G. and V.F.; supervision, Y.V.G.; project administration, Y.V.G.; funding acquisition, Y.V.G. All authors have read and agreed to the published version of the manuscript.

Funding

This research received no external funding.

Institutional Review Board Statement

Not applicable.

Informed Consent Statement

Not applicable.

Data Availability Statement

The original data presented in the study are openly available in [repository name, FigShare] at DOI 10.6084/m9.figshare.28054121.

Acknowledgments

This work was partially supported by the UCF College of Sciences providing research infrastructure and start-up funds for YG. The help from Jaehyun Ahn for acquiring absorbance data while reproducing experiments is greatly appreciated.

Conflicts of Interest

The authors declare no conflicts of interest.

References

  1. Burge, S.; Parkinson, G.N.; Hazel, P.; Todd, A.K.; Neidle, S. Quadruplex DNA: Sequence, topology and structure. Nucleic Acids Res. 2006, 34, 5402–5415. [Google Scholar] [CrossRef]
  2. Bhattacharyya, D.; Arachchilage, G.M.; Basu, S. Metal cations in G-quadruplex folding and stability. Front. Chem. 2016, 4, 2296–2646. [Google Scholar] [CrossRef] [PubMed]
  3. Keniry, M. Quadruplex structures in nucleic acids. Biopolymers 2001, 56, 123–146. [Google Scholar] [CrossRef]
  4. Tippana, R.; Xiao, W.; Myong, S. G-quadruplex conformation and dynamics are determined by loop length and sequence. Nucleic Acids Res. 2014, 42, 8106–8114. [Google Scholar] [CrossRef] [PubMed]
  5. Rhodes, D.; Lipps, H.J. G-quadruplexes and their regulatory roles in biology. Nucleic Acids Res. 2015, 43, 8627–8637. [Google Scholar] [CrossRef] [PubMed]
  6. Spiegel, J.; Adhikari, S.; Balasubramanian, S. The structure and function of DNA G-quadruplexes. Trends Chem. 2020, 2, 123–136. [Google Scholar] [CrossRef] [PubMed]
  7. Roxo, C.; Kotkowiak, W.; Pasternak, A. G-Quadruplex-forming aptamers—Characteristics, applications, and perspectives. Molecules 2019, 24, 3781. [Google Scholar] [CrossRef] [PubMed]
  8. Travascio, P.; Li, Y.; Sen, D. DNA-enhanced peroxidase activity of a DNA aptamer-hemin complex. Chem. Biol. 1998, 5, 505–517. [Google Scholar] [CrossRef]
  9. Cheng, X.; Liu, X.; Bing, T.; Cao, Z.; Shangguan, D. General peroxidase activity of G-quadruplex-hemin complexes and its application in ligand screening. Biochemistry 2009, 48, 7817–7823. [Google Scholar] [CrossRef] [PubMed]
  10. Poon, L.C.-H.; Methot, S.P.; Morabi-Pazooki, W.; Bennet, A.J.; Sen, D. Guanine-rich RNAs and DNAs that bind heme robustly catalyze oxygen transfer reactions. J. Am. Chem. Soc. 2011, 133, 1877–1884. [Google Scholar] [CrossRef] [PubMed]
  11. Sen, D.; Poon, L.C. RNA and DNA complexes with hemin [Fe (III) heme] are efficient peroxidases and peroxygenases: How do they do it and what does it mean? Crit. Rev. Biochem. Mol. Biol. 2011, 46, 478–492. [Google Scholar] [CrossRef]
  12. Iwaniuk, E.E.; Adebayo, T.; Coleman, S.; Villaros, C.G.; Nesterova, I.V. Activatable G-quadruplex based catalases for signal transduction in biosensing. Nucleic Acids Res. 2023, 51, 1600–1607. [Google Scholar] [CrossRef] [PubMed]
  13. Kosman, J.; Juskowiak, B. Peroxidase-mimicking DNAzymes for biosensing applications: A review. Anal. Chim. Acta 2011, 707, 7–17. [Google Scholar] [CrossRef] [PubMed]
  14. Lv, L.; Guo, Z.; Wang, J.; Wang, E. G-quadruplex as signal transducer for biorecognition events. Curr. Pharm. Des. 2012, 18, 2076–2095. [Google Scholar] [CrossRef]
  15. Neo, J.L.; Kamaladasan, K.; Uttamchandani, M. G-quadruplex based probes for visual detection and sensing. Curr. Pharm. Des. 2012, 18, 2048–2057. [Google Scholar] [CrossRef] [PubMed]
  16. Ruttkay-Nedecky, B.; Kudr, J.; Nejdl, L.; Maskova, D.; Kizek, R.; Adam, V. G-quadruplexes as sensing probes. Molecules 2013, 18, 14760–14779. [Google Scholar] [CrossRef]
  17. Ren, J.; Wang, T.; Wang, E.; Wang, J. Versatile G-quadruplex-mediated strategies in label-free biosensors and logic systems. Analyst 2015, 140, 2556–2572. [Google Scholar] [CrossRef]
  18. Lv, M.; Guo, Y.; Ren, J.; Wang, E. Exploration of intramolecular split G-quadruplex and its analytical applications. Nucleic Acids Res. 2019, 47, 9502–9510. [Google Scholar] [CrossRef] [PubMed]
  19. Yang, H.; Zhou, Y.; Liu, J. G-quadruplex DNA for construction of biosensors. Trends Anal. Chem. 2020, 132, 116060. [Google Scholar] [CrossRef]
  20. Stefan, L.; Denat, F.; Monchaud, D. Insights into how nucleotide supplements enhance the peroxidase-mimicking DNAzyme activity of the G-quadruplex/hemin system. Nucleic Acids Res. 2012, 40, 8759–8772. [Google Scholar] [CrossRef]
  21. Travascio, P.; Witting, P.K.; Mauk, A.G.; Sen, D.J. The peroxidase activity of a hemin−DNA oligonucleotide complex:  Free radical damage to specific guanine bases of the DNA. J. Am. Chem. Soc. 2001, 123, 1337–1348. [Google Scholar] [CrossRef] [PubMed]
  22. Yang, X.J.; Fang, C.L.; Mei, H.C.; Chang, T.J.; Cao, Z.H.; Shangguan, D.H. Characterization of G-quadruplex/hemin peroxidase: Substrate specificity and inactivation kinetics. Chem. Eur. J. 2011, 17, 14475–14484. [Google Scholar] [CrossRef]
  23. Li, W.; Li, Y.; Liu, Z.; Lin, B.; Yi, H.; Xu, F.; Nie, Z.; Yao, S. Insight into G-quadruplex-hemin DNAzyme/RNAzyme: Adjacent adenine as the intramolecular species for remarkable enhancement of enzymatic activity. Nucleic Acids Res. 2016, 44, 7373–7384. [Google Scholar] [CrossRef]
  24. Chen, J.; Zhang, Y.; Cheng, M.; Guo, Y.; Šponer, J.; Monchaud, D.; Mergny, J.-L.; Ju, H.; Zhou, J. How proximal nucleobases regulate the catalytic activity of G-quadruplex/hemin DNAzymes. ACS Catal. 2018, 8, 11352–11361. [Google Scholar] [CrossRef]
  25. Saito, K.; Tai, H.; Hemmi, H.; Kobayashi, N.; Yamamoto, Y. Interaction between the heme and a G-quartet in a heme-DNA complex. Inorg. Chem. 2012, 51, 8168–8176. [Google Scholar] [CrossRef] [PubMed]
  26. Yamamoto, Y.; Araki, H.; Shinomiya, R.; Haysaka, K.; Nakayama, Y.; Ochi, K.; Shibata, T.; Momotake, A.; Ohyama, T.; Hagihara, M.; et al. Structures and catalytic activities of complexes between heme and all parallel-stranded monomeric G-quadruplex DNAs. Biochemistry 2018, 57, 5938–5948. [Google Scholar] [CrossRef]
  27. Stadlbauer, P.; Islam, B.; Otyepka, M.; Chen, J.; Monchaud, D.; Zhou, J.; Mergny, J.-L.; Sponer, J. Insights into G-quadruplex–hemin dynamics using atomistic simulations: Implications for reactivity and folding. J. Chem. Theory Comput. 2021, 17, 1883–1899. [Google Scholar] [CrossRef]
  28. Kong, D.-M.; Yang, W.; Wu, J.; Li, C.-X.; Shen, H.-X. Structure–function study of peroxidase-like G-quadruplex-hemin complexes. Analyst 2010, 135, 321–326. [Google Scholar] [CrossRef] [PubMed]
  29. Nakayama, S.; Wang, J.; Sintim, H.O. DNA-based peroxidation catalyst—What is the exact role of topology on catalysis and is there a special binding site for catalysis? Chem. Eur. J. 2011, 17, 5691–5698. [Google Scholar] [CrossRef] [PubMed]
  30. Nakayama, S.; Sintim, H.O. Investigating the interactions between cations, peroxidation substrates and G-quadruplex topology in DNAzyme peroxidation reactions using statistical testing. Anal. Chim. Acta 2012, 747, 1–6. [Google Scholar] [CrossRef]
  31. Nasab, M.G.; Hasani, L.; Nejad, S.M.; Norouzi, D. Interaction of hemin with quadruplex DNA. J. Biol. Phys. 2017, 43, 5–14. [Google Scholar] [CrossRef] [PubMed]
  32. Kong, D.-M. Factors influencing the performance of G-quadruplex DNAzyme-based sensors. Methods 2013, 64, 199–204. [Google Scholar] [CrossRef] [PubMed]
  33. Rachwal, P.A.; Brown, T.; Fox, K.R. Effect of G-tract length on the topology and stability of intramolecular DNA quadruplexes. Biochemistry 2007, 46, 3036–3044. [Google Scholar] [CrossRef]
  34. Hatzakis, E.; Okamoto, K.; Yang, D. Thermodynamic stability and folding kinetics of the major G-quadruplex and its loop isomers formed in the nuclease hypersensitive element in the human c-Myc promoter: Effect of loops and flanking segments on the stability of parallel-stranded intramolecular G-quadruplexes. Biochemistry 2010, 49, 9152–9160. [Google Scholar] [PubMed]
  35. Travascio, P.; Sen, D.; Bennet, A.J. DNA and RNA enzymes with peroxidase activity—An investigation into the mechanism of action. Can. J. Chem. 2006, 84, 613. [Google Scholar] [CrossRef]
  36. Chang, T.; Gong, H.; Ding, P.; Liu, X.; Li, W.; Bing, T.; Cao, Z.; Shangguan, D. Activity enhancement of G-quadruplex/hemin DNAzyme by flanking d(CCC). Chemistry 2016, 12, 4015. [Google Scholar] [CrossRef] [PubMed]
  37. Cheng, M.; Zhou, J.; Jia, G.; Ai, X.; Mergny, J.L.; Li, C. Relations between the loop transposition of DNA G-quadruplex and the catalytic function of DNAzyme. Biochim. Biophys. Acta 2017, 1861, 1913–1920. [Google Scholar] [CrossRef]
  38. Chen, J.; Guo, Y.; Zhou, J.; Ju, H. The effect of adenine repeats on G-quadruplex/hemin peroxidase mimicking DNAzyme activity. Chem. Eur. J. 2017, 23, 4210–4215. [Google Scholar] [CrossRef] [PubMed]
  39. Cao, Y.; Ding, P.; Yang, L.; Li, W.; Luo, Y.; Wang, J. Investigation and improvement of catalytic activity of G-quadruplex/hemin DNAzymes using designed terminal G-tetrads with deoxyadenosine caps. Chem. Sci. 2020, 11, 6896–6906. [Google Scholar] [CrossRef] [PubMed]
  40. Qui, D.; Mo, J.; Liu, Y.; Zhang, J.; Cheng, Y.; Zhang, X. Effect of distance from catalytic synergy group to iron porphyrin center on activity of G-quadruplex/hemin DNAzyme. Molecules 2020, 25, 3425. [Google Scholar] [CrossRef]
  41. Kong, D.-M.; Wu, J.; Wang, N.; Yang, W.; Shen, H.-X. Peroxidase activity–structure relationship of the intermolecular four-stranded G-quadruplex–hemin complexes and their application in Hg2+ ion detection. Talanta 2009, 80, 459–465. [Google Scholar] [CrossRef]
  42. Del Villar-Guerra, R.; Trent, J.O.; Chaires, J.B. G-quadruplex secondary structure obtained from circular dichroism spectroscopy. Angew. Chem. Int. Ed. Engl. 2018, 57, 7171–7175. [Google Scholar] [CrossRef] [PubMed]
  43. da Silva, M.W. Geometric formalism for DNA quadruplex folding. Chem. Eur. J. 2007, 13, 9738–9745. [Google Scholar] [CrossRef]
  44. Nakayama, S.; Sintim, H.O. Biomolecule detection with peroxidase-mimicking DNAzymes; expanding detection modality with fluorogenic compounds. Mol. BioSyst. 2009, 6, 95–97. [Google Scholar] [CrossRef] [PubMed]
  45. Kolpashchikov, D.M. Split DNA enzyme for visual single nucleotide polymorphism typing. J. Am. Chem. Soc. 2008, 130, 2934–2935. [Google Scholar] [CrossRef]
  46. Deng, M.; Zhang, D.; Zhou, Y.; Zhou, X. Highly effective colorimetric and visual detection of nucleic acids using an asymmetrically split peroxidase DNAzyme. J. Am. Chem. Soc. 2008, 130, 13095–13102. [Google Scholar] [CrossRef] [PubMed]
  47. Deng, M.; Feng, S.; Luo, F.; Wang, S.; Sun, X.; Zhou, X.; Zhang, X.-L. Visual detection of rpoB mutations in rifampin-resistant Mycobacterium tuberculosis strains by use of an asymmetrically split peroxidase DNAzyme. J. Clin. Microbiol. 2012, 50, 3443–3450. [Google Scholar] [CrossRef] [PubMed]
  48. Darius, A.K.L.; Ling, N.J.; Mahesh, U. Visual detection of DNA from salmonella and mycobacterium using split DNAzymes. Mol. BioSyst. 2010, 6, 792–794. [Google Scholar] [CrossRef] [PubMed]
  49. Connelly, R.P.; Morozkin, E.S.; Gerasimova, Y.V. Alphanumerical visual display made of DNA logic gates for drug susceptibility testing of pathogens. ChemBioChem 2018, 19, 203–206. [Google Scholar] [CrossRef]
  50. Connelly, R.P.; Verduzco, S.; Farnell, S.; Yishay, T.; Gerasimova, Y.V. Toward a rational approach to design split G-quadruplex probes. ACS Chem. Biol. 2019, 14, 2701–2712. [Google Scholar] [CrossRef]
  51. Batule, B.S.; Kim, S.U.; Mun, H.; Choi, C.; Shim, W.-B.; Kim, M.-G. Colorimetric detection of norovirus in oyster samples through DNAzyme as a signaling probe. J. Agric. Food Chem. 2018, 66, 3003–3008. [Google Scholar] [CrossRef]
  52. Lu, X.; Shi, X.; Wu, G.; Wu, T.; Qin, R.; Wang, Y. Visual detection and differentiation of Classic Swine Fever Virus strains using nucleic acid sequence based amplification (NASBA) and G-quadruplex DNAzyme assay. Sci. Rep. 2017, 7, 44211. [Google Scholar] [CrossRef]
  53. Gerasimova, Y.V.; Cornett, E.M.; Edwards, E.; Su, X.; Rohde, K.H.; Kolpashchikov, D.M. Deoxyribozyme cascade for visual detection of bacterial RNA. Chembiochem 2013, 14, 2087–2090. [Google Scholar] [CrossRef]
  54. Reed, A.J.; Connelly, R.P.; Williams, A.; Tran, M.; Shim, B.S.; Choe, H.; Gerasimova, Y.V. Label-free pathogen detection by a deoxyribozyme cascade with visual signal readout. Sens. Actuators B Chem. 2019, 282, 945–951. [Google Scholar] [CrossRef] [PubMed]
  55. Wood, H.N.; Sidders, A.E.; Brumsey, L.E.; Morozkin, E.S.; Gerasimova, Y.V.; Rohde, K.H. Species typing of nontuberculous Mycobacteria by use of deoxyribozyme sensors. Clin. Chem. 2019, 65, 333–341. [Google Scholar] [CrossRef] [PubMed]
  56. Dhar, B.C.; Reed, A.J.; Mitra, S.; Rodrigues Sanchez, P.; Nedorezova, D.D.; Connelly, R.P.; Rohde, K.H.; Gerasimova, Y.V. Cascade of deoxyribozymes for the colorimetric analysis of drug resistance in Mycobacterium tuberculosis. Biosens. Bioelecton. 2020, 165, 112385. [Google Scholar] [CrossRef] [PubMed]
  57. Zadeh, J.N.; Steenberg, C.D.; Bois, J.S.; Wolfe, B.R.; Pierce, M.B.; Khan, A.R.; Dirks, R.M.; Pierce, N.A. NUPACK: Analysis and design of nucleic acid systems. J. Comput. Chem. 2011, 32, 170–173. [Google Scholar] [CrossRef]
Figure 1. Folding of guanine-rich oligonucleotides into a G-quadruplex (G4) structure. (a) Four guanine residues from consecutive G-clusters form a planar G-tetrad via Hoogsteen interactions. (b) Several G-tetrads engage in π-stacking to form G4 architectures of different topologies. The gray-filled blocks represent each guanine residue of the tetrad (as highlighted in panel a). The G-clusters and loops connecting them are shown by black and gray arrows, respectively. The direction of the arrows indicates 5′→3′ progression of the nucleotide sequence.
Dna 05 00012 g001
Figure 2. The absorbance of ABTS●+ generated due to the PDz catalytic activity of hemin in complex with the G4 sequences with varying nucleotide compositions in the loops between adjacent guanine tracts and/or 3′-flanking regions. (a) The effect of the position of T > A substitution in T3-containing loops (Table S1, V). Panels (b) and (c): the effect of the indicated nucleotides (X) positioned at the 3′-end of G3T3G3AT2G3T3G3X (Table S1, IX) (b) or (G3T)3X (Table S1, X) (c). Values represent the average of at least three trials, with standard deviations as error bars. The signal for the blank (hemin only) at A420 = 0.15 ± 0.04 a.u. is shown as a red threshold. Symbols *, **, and **** represent statistically significant difference with p ≤ 0.05, p ≤ 0.01, and p ≤ 0.0001, respectively.
Dna 05 00012 g002
Figure 3. The absorbance of ABTS●+ due to peroxidase-mimicking catalytic activity of hemin in complex with the G4 sequences previously reported in the literature, as compared to L2TT-T3 which is found to be the most efficient enhancer in this work. Values represent the average of at least three trials, with standard deviations as error bars. Papers where the literature G4 sequences were tested are cited in Table S2. Symbols *** and **** represent a statistically significant difference with p ≤ 0.001 and p ≤ 0.0001, respectively.
Dna 05 00012 g003
Figure 4. The performance of sPDz probes. (a) A general scheme for the G4 formation when the two strands of the sPDz probe are brought into proximity by hybridization with a complementary nucleic acid analyte. (b) Variations in the sPDz probe interrogating EC60 in complex with the analyte. (c) The absorbance of ABTS●+ due to the catalytic activity of the hemin-sPDz-EC60 complex. (d) Variations in the MT80-interrogating sPDz probe in complex with the analyte (top) and the performance of the corresponding probe variants in terms of ABTS●+ absorbance (bottom). Absorbance values represent the average of 3–4 independent trials, with standard deviations as error bars. Images of the tubes corresponding to the blank (no analyte added) and analyte-containing sample for each sPDz variant are inserted to the left of the bar graph. For pairwise data comparison, either unpaired t test (black asterisks) or one-way ANOVA with post hoc Tukey’s test (gray asterisks) was employed. Symbols *, **, *** and **** represent statistically significant difference with p ≤ 0.05, p ≤ 0.01, p ≤ 0.001, and p ≤ 0.0001, respectively. The non-significant difference is indicated as “ns”.
Dna 05 00012 g004
Figure 5. (a) The mechanism of interrogation of a DNA analyte by the vsDz/PDz probe to release the G4 signal reporter from an inhibited oligonucleotide substrate IPDz due to the RNA-cleaving activity of the vsDz catalytic core formed when the DNA analyte brings vDza and vDzb strands in proximity. (b) The performance of the vsDz/PDz probes utilizing IPDz-PW17, IPDz-ATT, IPDz-AT3 or IPDz-3TC either in the absence (Blank) or presence of MT80. “IPDz” refers to the samples containing just the IPDz substrate. The data are averaged from 3 to 7 independent trials, with error bars as standard deviations. Symbols * and *** represent statistically significant difference with p ≤ 0.05 and p ≤ 0.001, respectively. The non-significant difference is indicated as “ns”.
Dna 05 00012 g005
Disclaimer/Publisher’s Note: The statements, opinions and data contained in all publications are solely those of the individual author(s) and contributor(s) and not of MDPI and/or the editor(s). MDPI and/or the editor(s) disclaim responsibility for any injury to people or property resulting from any ideas, methods, instructions or products referred to in the content.

