Abstract
Anaerobic co-digestion of agro-industrial and municipal biowastes can enhance methane production, but the optimal mixture depends on nonlinear interactions among substrates. This study evaluated swine wastewater (SW), cheese whey (CW), and the organic fraction of municipal solid waste (OFMSW) under mesophilic batch conditions to quantify composition–response relationships and identify a robust operating window. A restricted simplex-centroid mixture design was tested; linear, quadratic, and special cubic models were fitted and evaluated using ANOVA, diagnostic plots, and optimization with desirability mapping. Cumulative methane yield (CMY) ranged between 251 and 295 NmL CH4 g VS−1 in the mixtures, outperforming SW as single component. All mixtures maintained neutral pH and moderate alkalinity ratios. The special cubic model provided the best performance (high R2 and R2pred) and revealed significant ternary interaction. The optimization indicated a composition near 63% SW, 10% CW, and 27% OFMSW with a predicted CMY of 300 NmL CH4 g VS−1; a high-performance band (desirability 0.90–1.00; corresponding to CMY ≥ 294.8) defined a robust window of ~60–66% SW, 6–20% CW, and 20–31% OFMSW. Overall, balanced ternary co-digestion showed synergistic effects beyond additive expectations, and the response surface model based on mixture design proved effective in capturing interactions and providing flexible guidance for practical implementation.
1. Introduction
The exponential growth in human population, urbanization, and agro-industrial activity has led to a sharp increase in the generation of organic waste worldwide. In 2022, approximately 19% of food was wasted at the consumer level and an additional 13% was lost along the supply chain [1]. This represents an inefficient use of land and resources, contributes 8–10% of global greenhouse gas (GHG) emissions, and exacerbates biodiversity loss.
Organic wastes from livestock, food processing, and urban sources are rich in volatile solids, nutrients, and biodegradable matter. Their uncontrolled degradation leads to methane (CH4) and ammonia (NH3) emissions, acidification, and the production of odorous and leachate-rich effluents [2,3]. Moreover, inadequate waste management practices also result in the loss of potentially recoverable resources, such as nutrients and energy, particularly in low- and middle-income countries, where landfilling and open dumping remain common practices [4,5,6].
Anaerobic digestion (AD) is widely recognized as a sustainable biological process for treating high-strength organic wastes while recovering renewable energy in the form of methane-rich biogas. However, mono-digestion of substrates with unbalanced carbon-to-nitrogen (C/N) ratios, low buffering capacity, or excessive organic loading often results in poor process stability, low methane yields, and, even system failure [7,8]. To overcomes these limitations, anaerobic co-digestion (AcoD), the simultaneous treatment of different substrates, has emerged as a promising strategy. AcoD improves process robustness and methane productivity through nutritional complementarity, micronutrient supply, and microbial diversity, often resulting in yields that exceed additive expectations relative to mono-digestion [9,10].
Despite its advantages, identifying optimal substrate ratios remains a key challenge. Poorly balanced mixtures can lead to acidification, ammonia inhibition, or process underperformance [11,12,13]. Although a wide range of mixtures have been widely explored [14,15,16,17], most studies still rely on empirical optimization and site-specific experimentation. To address this limitation, statistical tools such as mixture experimental designs coupled with response surface methodology (RSM) have proven been useful for identifying optimal substrate proportions, quantifying synergistic and antagonistic interactions, and predicting responses across the entire composition space [18,19].
Existing research on AcoD has largely focused on binary mixtures [20,21], while ternary configuration remains limited, especially for blends that integrate agro-industrial residues with municipal biowastes. Although each of these substrates has been individually studied, their combined digestion under realistic proportion constraints has received little attention, despite their abundance and practical relevance [22]. Moreover, most kinetic or empirical models developed for mono-digestion fail to capture the nonlinear interactions inherent to multi-substrate systems, limiting their predictive accuracy and generalizability [23,24].
Recent efforts have addressed these limitations by applying statistical and mixture-design approaches to predict synergistic effects among substrates and improve methane productivity. Ref. [25] applied a simplex-centroid mixture design to optimize methane yield from sewage sludge, horse manure, and OFMSW, demonstrating the predictive potential of composition–response modeling for complex feedstocks. Ref. [26] optimized the co-digestion of three lignocellulosic residues (yellow bran, violet bran, and maize cobs) within defined compositional limits. Ref. [27] employed RSM to optimize lignocellulosic–livestock waste co-digestion, achieving strong agreement between predicted and experimental methane yields. Overall, these studies illustrate the growing potential of mixture-design methodologies for understanding substrate interactions and optimizing methane yield. However, their application remains largely case-specific, and few efforts have coupled mixture modeling with kinetic validation or evaluated its performance across different substrate types, an aspect particularly relevant when integrating agro-industrial and municipal residues in AcoD systems.
Substrate selection remains central to AcoD outcomes. A common strategy combines nutrient-rich livestock manures or slurries, which provide alkalinity and nitrogen, with easily degradable residues from food or agro-industrial sources that supply carbohydrates and proteins but may cause rapid acidification [28,29]. In this context, swine wastewater (SW), cheese whey (CW), and the organic fraction of municipal solid waste (OFMSW) are widely available in many regions and represent complementary feedstocks.
SW is generated in large volumes worldwide; China dominates global pork production, driven by vast industrial farms and high domestic demand. Brazil leads South America, producing through advanced infrastructure and exports and Argentina is also expanding its pork sector [30]. Typically stored in open lagoons, SW contributes to uncontrolled methane and ammonia emissions. SW is characterized by moderate organic content (COD 10,000–25,000 mg/L), high ammonium nitrogen (N-NH4+ > 2000 mg/L), and strong alkalinity [31,32], but its mono-digestion potential is limited by low methane potential and ammonia toxicity. CW, a major by-product of the dairy industry, exhibits high biodegradability (COD > 40,000 mg/L) and is rich in lactose and peptides, but its low pH (<5), limited nitrogen, and poor buffering capacity make it prone to acidification [33,34]. The OFMSW often represents more than 50% of total municipal waste, with over 70% volatile solids on a dry matter basis and elevated C/N ratios (up to 54), which can inhibit microbial activity if not balanced [35]. These contrasting features suggest that combining SW, CW, and OFMSW may offer a balanced nutrient supply and enhance process stability, provided that mixture ratios are carefully optimized [36,37]. In this context, the joint digestion of SW, CW, and OFMSW has received little attention. While each of these substrates has been individually explored, there is scarce evidence on their combined digestion under realistic proportion constraints, even though they are abundant, complementary, and highly relevant to practical applications.
While significant progress has been made in applying mixture-design methodologies to optimize AcoD performance, their integration with kinetic validation and model robustness assessment remains limited. Building upon these advances, this study combines mixture modeling, desirability-based optimization, and kinetic evaluation to establish a reproducible framework for identifying robust operating windows in ternary co-digestion systems.
Therefore, this work evaluates the AcoD of SW, CW, and OFMSW under mesophilic batch conditions using a constrained simplex-centroid mixture design. Cumulative methane production was modeled as a function of substrate proportions through a special-cubic regression, while pH and alkalinity ratio were monitored to verify process stability. A desirability-based optimization was finally applied to identify optimal and robust substrate ratios for methane yield, providing practical insights for developing efficient AcoD strategies aligned with circular-economy and low-emission waste-management principles.
2. Materials and Methods
2.1. Substrates and Inoculum
Three different substrates were selected for the AcoD experiments: SW, CW, and the OFMSW. All materials were sourced from facilities located in Olavarría, Buenos Aires Province, Argentina.
SW was collected from the drainage system of a local pig breeding facility, before lagoon discharge, consisting of manure, urine, and wash water. CW was obtained from a local ricotta cheese producer. OFMSW was gathered from the weekly collection of household waste and included food scraps, fruit and vegetable residues, and other biodegradable materials. Upon arrival, OFMSW was manually sorted to remove non-organic materials and shredded with a small-scale food waste grinder to reduce particle size (≤5 mm) for homogenization. All substrates were stored at 4 °C and used within 7 days.
The inoculum used was digested sewage sludge from the anaerobic digesters at the municipal wastewater treatment plant (Olavarría, Buenos Aires Province, Argentina). It was incubated under mesophilic conditions in a thermostatic water bath at 35 ± 1 °C for 5 days prior to use to reduce residual biodegradable matter and to stabilize microbial activity [38].
2.2. Samples Characterization
The physicochemical characterization of the substrates and inoculum was performed according to Standard Methods for the Examination of Water and Wastewater [39]. Parameters measured included total solids (TS, g L−1), volatile solids (VS, g L−1), chemical oxygen demand (COD, mg L−1), total nitrogen (TN, mg L−1), ammonium nitrogen (N-NH4+, mg L−1) and pH. Alkalinity was evaluated following the procedure of Jenkins [40], which consists of titrating centrifuged samples at two fixed pH values (5.75 and 4.3). From this analysis, total alkalinity (TA, mg CaCO3 L−1) was determined at pH 4.3; partial alkalinity (PA) at pH 5.75; and intermediate alkalinity (IA), calculated as the difference between TA and PA. The alkalinity ratio (AR = IA/PA) was used as an indicator of process stability, with values above 0.4 suggesting increased risk of digester acidification [41].
All analytical determinations were performed in triplicate (n = 3), and results are reported as mean ± standard deviation. For each treatment, both initial and final VS, COD, pH, and alkalinity parameters were recorded to assess process performance and stability.
In addition, the COD/TN ratio was calculated as nutrient balance indicator, factor that related the oxidizable organic matter to the total nitrogen content. For mesophilic digestion, values between 20 and 60 are considered optimal, with 40 often cited as ideal [42]. COD/TN was determined for each substrate and mixture to guide the constrained mixture design.
2.3. Experimental Setup and Biogas Analysis
Anaerobic digestion tests were conducted in 1 L borosilicate glass batch reactors with a working volume of 700 mL. The reactors were placed in a thermostatically controlled water bath and maintained under mesophilic conditions (35 ± 1 °C). Mixing was performed manually once per day for approximately one minute.
Experimental treatments included both mono-digestion and the mixtures defined in Table 1, aimed at determining the cumulative methane yield (CMY) of each condition. All assays were conducted under identical organic loading, maintaining a substrate-to-inoculum ratio (SIR) of 3:1 on a VS basis. This ensured that each reactor received the same organic input relative to the inoculum and that compositional effects could be evaluated independently from loading variations. Distilled water was added as needed to adjust the TS content to approximately 5% (w/w) [20].

Table 1.
Volumetric proportions of substrates in each experimental treatment (R1–R7) and their corresponding pseudo-component values used in the randomized restricted simplex centroid design.
When required, sodium bicarbonate (NaHCO3) was added to adjust the initial pH to the neutral range (7.0 and 8.0) [43]. The reactors were then sealed with butyl rubber stoppers and flushed with N2 for two minutes to ensure anaerobic conditions. Blanks containing only inoculum were included to quantify baseline methane production. Each experimental condition was conducted in duplicate reactors (n = 2) operated in parallel under identical conditions.
Biogas volume was measured daily by the water displacement method using acidification water (pH 2) to minimize CO2 solubility. Methane content was periodically determined with a Landtec GA2000 portable gas analyzer (Landtec, Leamington Spa, UK), previously calibrated using a certified CH4/CO2 (60/40) standard gas mixture (AGA, Certification No. 165342), following the manufacturer’s specifications.
Net cumulative biogas and methane production was calculated by subtracting the gas volume produced in the blanks from that of each treatment. Values were normalized to standard temperature and pressure (0 °C, 101.325 kPa). The assays were terminated when the daily methane increment was below 1% of the cumulative volume for three consecutive days.
2.4. Kinetic Modeling to Modified Gompertz
CMY data were fitted to the modified Gompertz model, Equation (1), using nonlinear least squares (nls) function in R and choosing the default Gauss–Newton algorithm:
where CMY(t) is the CMY at time t (days), P is the methane potential (NmL CH4 g−1 VS), Rm the maximum production rate (NmL CH4 g VS−1 d−1), λ the lag phase (days), and e Euler’s number. Goodness-of-fit was evaluated through the coefficient of determination (R2) and the relative error between predicted and observed methane potential.
CMY(t) = P·exp {−exp [(Rm·e/P) (λ − t) + 1]}
The modified Gompertz model, reliably describes the sigmoidal kinetics of anaerobic digestion, including the lag, exponential, and stationary phases. It provides biologically meaningful parameters (P, Rm, λ) that describe process kinetics, and has been shown to outperform first-order or logistic formulations for heterogeneous substrates such as manures and food wastes [44,45].
2.5. Experimental Design and Statistical Analysis
Simplex mixture designs are commonly used to evaluate the effects of individual components on a response variable [22,46]. The main objective is to model the mixture surface using mathematical equations, enabling prediction of the response for any combination of components within the design space [47]. This approach quantifies the influence of individual components and their interactions. In ternary systems the design space is triangular, with vertices representing formulation containing the maximum proportion of one component and the minimum proportions of the others [48].
The experimental design selected was a restricted simplex-centroid design, where the experimental points are evenly distributed across the triangular mixture space. This configuration allows the addition of interior points, to detect curvature in the response surface. In the case of three components, the design generates 23 − 1 = 7 experimental treatments.
Given that aim of enhancing methane production from fresh SW, this substrate was included in all mixtures, following common co-digestion practice in which a major proportion of a primary substrate is combined with smaller amounts of one or more co-substrates to improve process performance [49]. Based on preliminary characterization and nutrient balance, volumetric ranges were constrained as follows: SW 60–80%, CW 0–20%, and OFMSW 20–40%, as illustrated in the ternary mixture design (Figure 1).
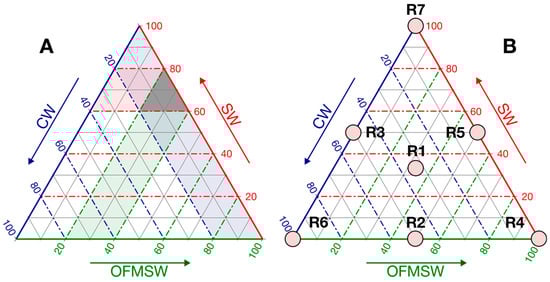
Figure 1.
Ternary mixture comprising the organic fraction of municipal solid waste (OFMSW), swine wastewater (SW), and cheese whey (CW). (A) Operative window defined by process constraints, represented by the shaded gray area. (B) Operative windows expressed in pseudo-coordinates. The red, blue, and green axes correspond to SW, CW, and OFMSW, respectively, and the dotted lines represent isoproporportion levels for each component. Points R1–R7 correspond to the experimental conditions defined by the restricted simplex centroid mixture design.
To reduce the high correlation often observed between regression coefficients in restricted mixture designs, proportions were transformed into pseudo-components (Table 1, Figure 1B), facilitating regression modeling [50].
The response variable (CMY, NmL CH4 g VS−1) was fitted to linear (2), quadratic (3), and special cubic (4) Scheffé polynomials. In these models, the regression coefficients (βi) represent the main effects of each substrate (x1 = SW, x2 = CW, x3 = OFMSW, expressed as pseudo-component proportions). The binary interaction terms (βij) indicate synergistic (positive) or antagonistic (negative) effects depending on their sign, while the ternary coefficient (βijk) captures the three-way interaction among substrates.
Linear model
CMY = β1·x1 + β2·x2 + β3·x3
Quadratic model
CMY = β1·x1 + β2·x2 + β3·x3 + β12·x1·x2 + β13·x1·x3 + β23·x2·x3
Special cubic model
CMY = β1·x1 + β2·x2 + β3·x3 + β12·x1·x2 + β13·x1·x3 + β23·x2·x3 + β123·x1·x2·x3
The best-fitting model was selected according to its goodness-of-fit indicators (R2, R2adj) and predictive accuracy (R2pred, PRESS). Residual diagnostics were performed to verify normality, homoscedasticity, and independence. Finally, numerical optimization was conducted to determine the substrate proportions that maximize CMY.
2.6. Optimization Procedure
Optimization of CMY within the constrained mixture space was performed using the desirability function approach [51]. In this method, each response is transformed into a dimensionless desirability index (d) ranging from 0 (completely undesirable) to 1 (fully desirable). In this study, single-response optimization was conducted to maximize CMY, with the optimization algorithm identifying the substrate proportions corresponding to the highest overall desirability (d = 1.0).
To evaluate model robustness, sensitivity analyses was performed by relaxing the target to 0.90 ≤ d ≤ 1.00, thus defining a high-performance region rather than a single optimum. Contour and 3-D plots were generated to visualize both the location of the maximum and the surrounding robust region within the SW–CW–OFMSW simplex. All optimization analyses were conducted using Minitab 15 (Minitab LLC, State College, PA, USA).
2.7. Statistical Analyses
Statistical analyses were carried out with Minitab 18 (v.18.1, Minitab LLC, State College, PA, USA) for regression and optimization, and with Statgraphics Centurion XVI (v.16.2.04, Statpoint Technologies, Warrenton, VA, USA) for ANOVA and multiple mean comparison (Fisher’s LSD test, α = 0.05).
3. Results
3.1. Sample Characterization
The initial physicochemical properties of the substrates, SW, CW, and OFMSW, as well as the inoculum (digested sewage sludge), are summarized in Table 2. Marked contrasts were observed in organic load, nutrient content, and buffering capacity, all of which are key factors influencing anaerobic digestion performance.
Table 2.
Physical–chemical characteristics of substrates and inoculum.
OFMSW exhibited the highest total solid (TS, 225 ± 14 g L−1) and organic matter contents, expressed as volatile solids (VS, 193 ± 6 g L−1) and chemical oxygen demand (COD, 181,033 ± 4830 mg/L). SW presented high COD (99,879 ± 1078 mg L−1), substantial total alkalinity (TA, 8020 ± 722 mg CaCO3 L−1), and a moderately acidic pH (6.79), whereas CW displayed the lowest TS and VS (11 ± 0.0 g L−1; 9 ± 0.1 g L−1) and a comparatively low COD (12,687 ± 552 mg L−1) with pH = 6.26.
Regarding nitrogen, SW showed the highest total nitrogen (TN) and N-NH4+ (4775 ± 247 and 2948 ± 40 mg L−1, respectively), while CW showed very low values (TN = 445 ± 78; N-NH4+ = 8 ± 2 mg L−1). OFMSW registered intermediate TN (3350 ± 636 mg L−1) and low ammonium concentration (135 ± 7 mg L−1). The COD/TN ratios reflected differences in nutrient balance, SW = 21.0, CW = 28.8, while OFMSW showed a higher value (54.9 ± 9.0). Values fall within ranges reported for similar feedstocks. Overall, CW and OFMSW provided readily degradable carbon sources, while SW supplied alkalinity and nitrogen, supporting the rationale for combining them in co-digestion.
3.2. Methane Production of Mono-Components
The CMY, removals of VS and COD, together with the physicochemical parameters that describe process stability at the end of fermentation (final pH, AR, and N-NH4+), for each individual substrate, are summarized in Table 3.
Table 3.
CMY and stability indicators of mono-component (SIR = 3:1, VS basis).
OFMSW achieved the CMY (330 ± 19 NmL CH4 g VS−1) with a VS removal of 62.5%, confirming its high biodegradability. SW showed intermediate performance (241 ± 12 NmL CH4 g VS−1; 61.5% VS removal), reflecting its moderately degradable organic fraction. In contrast, CW presented both the lowest yield (140 ± 8 NmL CH4 g VS−1) and degradation extent (37.4% VS removal), consistent with its acidogenic behavior. The rapid hydrolysis and fermentation of soluble carbohydrates and proteins lead to VFA accumulation, which limited completed methanogenic conversion despite the neutral final pH (8.0) and the relative high alkalinity ratio (AR, 0.56).
Ammonium nitrogen concentrations (N-NH4+) remained below inhibitory thresholds in all cases, indicating stable digestion conditions [52].
3.3. Mixture Characteristics
Each assay was carried out using a mixture of substrates, inoculum and water. The initial characterization of each fermentation, based on the randomized restricted simplex centroid design shown in Table 1, is summarized in Table 4 (VS, COD and initial COD/TN; initial/final values and removals efficiencies) and Table 5 (pH, TA, AR). Initial VS ranged from 3.54 to 3.61% (wet basis), with no significant differences among treatments (α = 0.05; p = 0.9988). The initial COD/TN ratio were within the recommended range (20 to 60) for stable anaerobic digestion [42,53] in all cases; the lowest value corresponded to R7 (29.5), which remained well within the acceptable range, consistent with its higher SW fraction.
Table 4.
Physicochemical characterization of mixtures (R1–R7) before and after digestion, including VS and COD removal efficiencies (means ± SD).
Table 5.
Acid–base parameters of mixtures (R1–R7) before and after digestion: pH, total alkalinity (TA) and alkalinity ratio (AR) (means ± SD).
Initial AR (AI/PA) values were relatively high (from 1.55 to 2.46; Table 5), reflecting the lower bicarbonate alkalinity and higher acidification tendency of CW and OFMSW at the start of fermentation. Their evolution toward AR values lower than 0.4 at the end of the process (see Section 3.5) confirms that these initial imbalances were corrected as the fermentation progressed.
Overall, the balanced starting conditions, COD/TN near the optimal mid-range, neutral pH, sufficient alkalinity with TA above 3000 mg L−1, indicate that the initial environment is suitable for the sequential development of anaerobic digestion stages (hydrolysis, acidogenesis, acetogenesis, and methanogenesis), ensuring process stability and preventing the risk of acidification [54]. Final values and removal efficiencies of VS and COD are also reported in Table 4; their implications for the anaerobic digestion process performance are discussed in Section 3.5.
3.4. Methane Production of Treatments
For the co-digestion mixtures, CMY varied significantly among treatments (Figure 2). The highest values were obtained in R1, R2 and R6 (293 to 295 NmL CH4 g VS−1), followed by an intermediate performance in R4 (272 NmL CH4 g VS−1), whereas R3, R5 and R7 showed lower yields (250–258 NmL CH4 g VS−1). All mixtures exceeded the SW mono-digestion baseline, (241 ± 12 NmL CH4 g−1 VS; Table 3), indicating a positive contribution of CW and OFMSW within the tested composition range. Differences among treatments were statistically significant (one-way ANOVA; Fisher’s LSD, α = 0.05). Detailed numerical data for biogas and methane yields are provided in Table S1 (Supplementary Material).
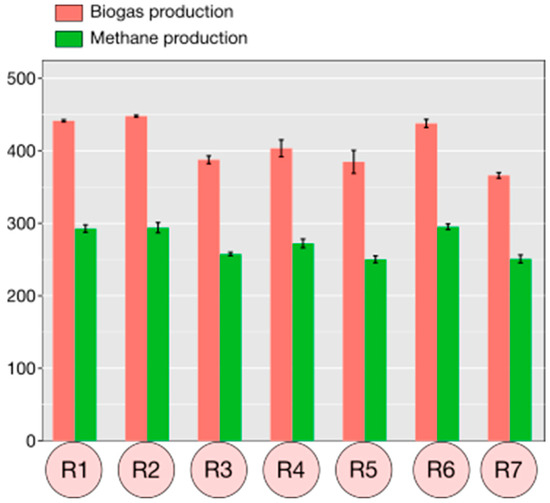
Figure 2.
Cumulative biogas and methane yield (CMY, NmL g VS−1) for mixtures R1–R7. Values are mean ± SD (n = 2).
3.5. Kinetic Modeling of Methane Production
All assays were terminated once the increase in cumulative methane production was below 1% over three consecutive days, a condition reached in all treatments between 60 and 70 days. Figure 3 shows the modified Gompertz model (Equation (1)) fitted to the experimental data (full data in Figure S1), while kinetic parameters are summarized in Table S2 (Supplementary Material).
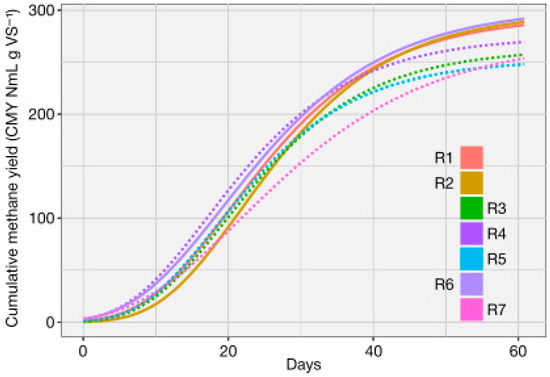
Figure 3.
Overlay of cumulative methane yield (CMY, NmL CH4 g−1 VS) fitted to the modified Gompertz model for mixtures R1–R7 (61 days). Solid lines: high-performing mixtures (R1, R2, R6). Dashed lines: other mixtures.
In all cases, the model exhibited excellent agreement with experimental values (R2 > 0.99), confirming its suitability for describing methane production dynamics. Estimated methane potentials (P) ranged from 252.6 ± 3.8 NmL CH4 g VS−1 (R5) to 302.7 ± 6.5 NmL CH4 g VS−1 (R6), maximum production rates (Rm) from 6.8 ± 0.3 (R7) to 9.6 ± 0.3 NmL CH4 g VS−1 d−1 (R2), and lag phases (λ) from 6.0 ± 0.5 d (R4) to 10.5 ± 0.4 d (R2).
3.6. Process Stability and Performance Indicators
Evaluated process stability is essential in AcoD process, as it reflects the balance between acidogenesis and methanogenesis stages. In this study, process stability was assessed through final pH and the alkalinity ratio (AR = IA/PA), while performance was evaluated based on VS and COD removals (Table 4 and Table 5). AR values between 0.3 and 0.4 and neutral pH are typically associated with stable operation, whereas higher AR values indicate organic overloading and potential acidification risk [55,56].
The initial mixtures showed neutral pH and high buffering capacity (TA ≥ 4400 mg CaCO3 L−1; Table 5), anticipating stable operation. The temporal evolution of pH and AR (Figures S2 and S3) showed that AR values decreased rapidly during the initial phase of digestion and stabilized below 0.5 from around day 20 onwards, indicating early adaptation of the microbial community and absence of acidification risks. In parallel, pH values remained stable and close to neutrality throughout the assays, with no reductions observed, further corroborating the absence of acidification. Final pH values were neutral (7.74–7.94) and final AR stayed below 0.4 across all treatments, with no statistical differences. Slightly higher AR values were observed in CW-richer blends and lower ones in SW-richer ones, consistent with the acidogenic tendency of whey and the buffering contribution of swine wastewater.
VS removal ranged from 51.7% (R7) to 62.8% (R4), while COD removal varied from 43.0% (R4) to 68.1% (R7), with intermediate values for the other treatments (Table 4). Statistical differences among treatments are indicated in Table 4.
Overall, neutral final pH, AR < 0.4, high initial alkalinity, and consistent removal of organic matter (51.7–62.8% VS; 43.0–68.1% COD) confirm that all reactors remained stable throughout digestion.
3.7. Model Fitting and Regression Analysis
CMY was modeled as a function of substrate proportions (SW, CW, and OFMSW) using mixture response surface methodology. Linear, quadratic, and special-cubic Scheffé polynomials were compared (Table 6). Goodness of fit was evaluated by the residual standard error (S), R2 and R2adj, whereas predictive ability was assessed thought R2pred and the predicted residual error sum of squares (PRESS). Better model shows low S and PRESS, with high R2adj and R2pred, indicating robust generalization and absence overfitting.
Table 6.
Model summary statistics for CMY (NmL CH4 g VS−1).
The special cubic model provided the best compromise, reducing S to 5.27 and PRESS to 777.0, with R2 = 96.3%, R2adj = 93.2%, and R2pred = 85.4% (Table 6), all parameters substantially better than the alternative models.
Overall regression was highly significant, and the special cubic model was retained for subsequent analyses. Binary interactions SW × CW and SW × OFMSW were significant (p ≤ 0.05), whereas CW × OFMSW was borderline but retained for hierarchy. Residual diagnostics confirmed normality, homoscedasticity, and independence. Full ANOVA results and diagnostic plots are provided in Table S3 and Figure S4.
3.8. Model Form and Fitted Equation
CMY (NmL CH4 g−1 VS) was modeled using a Scheffé special-cubic polynomial in pseudo-component space (x1 = SW; x2 = CW; x3 = OFMSW). The fitted equation was
CMY [NmL CH4 g−1 SV] = 250.94·x1 + 295.19·x2 + 272.27·x3 − 61.8·x1·x2 − 45.4·x1·x3 + 40.6·x2·x3 + 739·x1·x2·x3
Equation (5) represents the special-cubic mixture model used to predict CMY as a function of the pseudo-component volume fractions of SW, CW and OFMSW. Predicted CMY values for any mixture composition within the experimental domain can be directly obtained from Equation (5) by substituting the corresponding component fractions. This parametric formulation allows identification of local and global optima and enables the generation of desirability and contour plots to visualize synergistic effects among the substrates.
The estimated model coefficients indicated the relative contribution of each substrate and the strength of their interactions. Pure-component terms followed the order CW (295.19) > OFMSW (272.27) > SW (250.94). Binary interactions were mixed: SW × CW (β12 = −61.8, p = 0.012) and SW × OFMSW (β13 = −45.4, p = 0.042) were antagonistic, while CW × OFMSW showed a marginally positive effect (β23 = +40.6, p = 0.062). The strong positive three-component effect (β123 = +739, p = 0.001) suggests that interior blends of SW—CW—OFMSW outperform the corresponding binary mixtures.
Full regression coefficients with standard errors, t-values and p-values, are provided in Table S3.
The coefficient pattern, antagonistic SW-centered binaries (SW × CW; SW × OFMSW) combined with a large positive ternary term (SW × CW × OFMSW), is reflected in the response surface. Mixture contour and 3-D plots (Figure 4a,b) showed a broad high-performance band in the interior of the simplex, consistent with the strong special-cubic (three-way) effect. CMY increased toward blends containing approximately 60–70% SW, 10–20% CW, and 20–30% OFMSW.
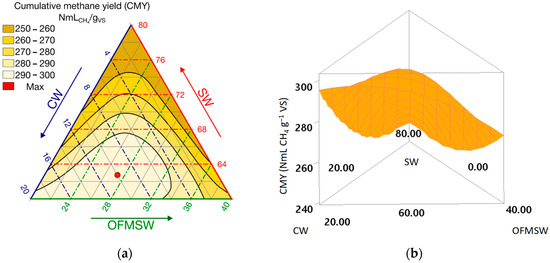
Figure 4.
(a) Mixture contour plots, (b) Mixture response-surface (3-D) plot for CMY. The contour plot represents predicted CMY values as a function of substrate proportions (SW, CW, and OFMSW). The dotted lines indicate isoproporportion levels for each component within the ternary diagram.
3.9. Single-Response Optimization and Desirability Map
As shown in Figure 5, the response optimizer identified an optimal blend of around 63% SW, 10% CW, and 27% OFMSW, with a predicted maximum CMY of 300.0 NmL CH4 g−1 VS. The quality of this solution was quantified by the desirability index d, which measures how well a given combination of inputs meets the specified goal for the response. For this point, the corresponding desirability index reached d = 1.00, indicating full compliance with the optimization target. Model validation was performed by comparing predicted CMY values with those experimentally obtained for mixtures located near the optimal region. The predicted maximum (300 NmL CH4 g−1 VS) corresponded closely to the observed values (294–296 NmL CH4 g−1 VS), confirming the accuracy of the special-cubic mixture model within the experimental domain.
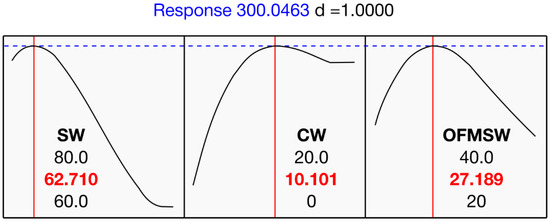
Figure 5.
Optimization plot for CMY. The vertical red lines indicate the optimal values of each factor, while the red numbers represent the optimal proportions of SW, CW, and OFMSW in the mixture that maximize the response (300.0 NmL CH4 gVS−1). The black curves show the variation of CMY with each factor, and the blue dotted line represents the maximum predicted response (d = 1.0).
A sensitivity analysis was then performed by varying the substrate fractions and jointly tracking CMY and desirability. Rather than requiring d = 1.00, a high-performance band was defined by 0.90 ≤ d ≤ 1.00, corresponding to CMY ≥ 294.8 NmL CH4 g−1 VS. Figure 6 presents the overlaid contour plot at CMY = 294.8 (d = 0.90), and the ridge near the maximum (300 NmL CH4 g−1 VS).
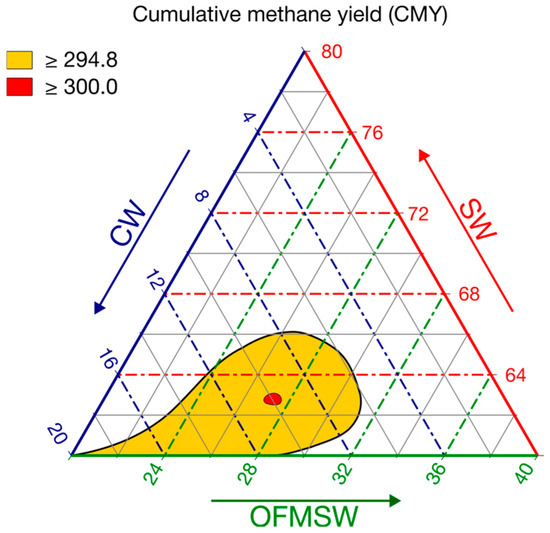
Figure 6.
Contour plot of predicted CMY (NmL CH4 g VS−1) obtained from the special cubic mixture model. The contour map shows the predicted CMY values as a function of substrate proportions (SW, CW, and OFMSW). The yellow area represents the region with CMY > 294.8, and the red dot marks the optimal mixture (SW 62.7%, CW 10.1%, OFMSW 27.2%) corresponding to the maximum predicted yield (≈300.0 NmL CH4 gVS−1). The dotted lines indicate isoproporportion levels for each component within the ternary diagram.
The yellow region in Figure 6 delineates a robust interior optimum, spanning ≈ SW 60–66%, CW 6–20%, and OFMSW 20–31%. The optimizer’s recommended point (63/10/27) lies near to the center of this high-performance region, corresponding to CMY around 300 NmL CH4 g VS−1 (d = 1.00).
4. Discussion
4.1. Substrate Characteristics and Mono-Digestion Performance
The physicochemical profiles of SW, CW, and OFMSW were consistent with ranges reported for similar feedstocks; SW showed high COD and TA but moderate biodegradability [32,57], CW was an organic-rich but poorly buffered effluent prone to acidification [58], and OFMSW exhibited high VS content and elevated C/N ratios [59,60]. These contrasting characteristics explain the rationale for co-digestion, in which SW supplies nitrogen and buffering capacity, while CW and OFMSW contribute easily degradable organics, enabling complementary effects.
Mono-digestion assays at an SIR of 3:1 highlighted clear contrasts in substrate behavior. OFMSW reached the highest methane yield (330 ± 19 NmL CH4 g VS−1), supported by high VS degradation (62.5%), confirming its high biodegradability. SW produced an intermediate yield (241 ± 12 NmL CH4 g VS−1), with stable pH (8.10), relatively high ammonium concentration (1457 mg/L N-NH4+), and moderate COD removal (55.8%), reflecting its adequate buffering capacity but limited fraction of readily degradable organics. In contrast, CW achieved the lowest yield (140 ± 8 NmL CH4 g VS−1), accompanied by the lowest VS removal (37.4%), a high final AR (0.56), and reduced ammonium levels (744 mg/L N-NH4+). These indicators confirm its tendency toward rapid acidification and poor buffering [58], which restricts methanogenic conversion despite a high organic load.
Overall, the observed yields fell within literature ranges for these feedstocks. For CW, reported methane yields vary widely, from 137 to 216 NmL CH4 g VS−1 in two stage batch assays [61] up to 400–600 NmL CH4 g VS−1 under optimized conditions [33]. For OFMSW, the literature values span from 143 to 516 NmL CH4 g VS−1 depending on substrate composition [62]. SW typically exhibits lower values, around 180–300 NmL CH4 g−1 VS, reflecting its moderate fraction of readily degradable organics [32]. These values confirm that results found in this work (CW ≈ 140, SW ≈ 241, OFMSW ≈ 330 NmL CH4 g−1 VS) are consistent with expected performance.
Importantly, while VS and COD removals indicate the extent of degradation, the stability indicators (pH, AR, ammonium) emphasize that the biochemical composition of the substrates governs methane productivity. High VS removal does not necessarily translate into higher methane yield if the degraded fraction generates inhibitory metabolites (e.g., volatile fatty acids from whey or ammonium from SW). Conversely, substrates with balanced C/N and buffering capacity (e.g., OFMSW blends) achieve more efficient conversion to methane.
Therefore, while mono-digestion results revealed the intrinsic strengths and weaknesses of each feedstock, they also underscored the limitations of using any single substrate alone. SW provided buffering capacity and nutrients but only moderate biodegradability; CW offered high organic loading yet poor stability due to acidification; and OFMSW displayed high degradability but risked imbalance in C/N ratio and volatile acid accumulation. These contrasting features justified their selection for co-digestion: by combining substrates with complementary properties, it is possible to enhance methane yield, improve nutrient balance, and stabilize process performance through synergistic interaction [63,64].
4.2. Process Performance, Stability and Co-Digestion Synergies
To explore feedstock complementarities, mixtures of SW, CW, and OFMSW were evaluated using a constrained simplex-centroid design, which enabled testing ternary combinations across a broad range of proportions. Results showed that co-digestion mixtures consistently outperformed mono-digestion, evidencing clear synergistic effects. The best-performing blends (R1, R2, R6) achieved CMY values between 293 and 295 NmL CH4 g VS−1, yielding up to 17.6% more methane than SW alone.
Process indicators help explain these improvements. Final pH remained neutral across treatments (7.74 to 7.85), confirming effective buffering even at higher CW fractions and ensuring stable methanogenesis. Mixtures showed AR values between 0.30 and 0.38, markedly lower than in CW alone (0.56), indicating that SW effectively neutralized acidification and supported VFA conversion. Meanwhile, OFMSW-rich mixtures achieved the highest VS removals (>60%), though COD removals were moderate. A comparison of mixtures without CW highlights these effects. R4 (40% OFMSW) showed high VS removal but relatively low COD removal and a higher AR, pointing to rapid solubilization of carbohydrate-rich OFMSW. In contrast, R7 (20% OFMSW) displayed more balanced VS and COD removals together with a lower AR, indicating a more coupled process. These results align with previous reports that manure-based co-digestion supplies both micronutrients and buffering capacity, mitigating VFA accumulation and enhancing process robustness [65,66,67].
These process indicators (near-neutral pH and a rapid decrease in the alkalinity ratio; see Figures S2 and S3) suggest that the system transitioned quickly from initial hydrolytic/acidogenic activity to a balanced methanogenic regime without sustained acid accumulation. This pattern is consistent with an efficient start-up under the specified operating conditions. The rapid drop in the AR further indicates tight coupling between acidogenic/acetogenic steps and methanogenesis from the outset. Such behavior typically arises when syntrophic VFA oxidation effectively channels butyrate/propionate toward H2/formate, enabling hydrogenotrophic methanogenesis to proceed without inhibition, while acetate is concurrently converted via the acetoclastic route [68]. Although no microbiome profiling was conducted, these process-level signatures are consistent with a functional inoculum capable of maintaining VFA turnover and preventing acidification.
4.3. Kinetic Analysis of AcoD Process Through Gompertz Model Parameters: P, Rm, λ
Beyond overall process indicators, a kinetic analysis based on the Gompertz model provides deeper insight into the dynamics of methane production, particularly the potential (P), maximum rate (Rm), and lag phase (λ).
The Gompertz parameter (P), represents the asymptotic methane potential at infinite time [69,70], and is therefore not strictly equivalent to the experimental CMY measured at the endpoint of 61 days. In many anaerobic digestion studies, P and CMY are directly compared under the assumption that digestion has essentially reached completion within the incubation period [70]. Following this convention, P may appear to slightly overestimate CMY. However, when the Gompertz model was evaluated at the actual experimental endpoint (61 days), predicted yields were in fact slightly underestimated compared to the experimental CMY (deviations within −2.5%), except for R7 (80:0:20), which showed a small overestimation (+1.1%). Overall, these small deviations confirm that the Gompertz model provided a reliable description of methane production dynamics, with only a minor discrepancy observed in R7.
From a kinetic perspective, the high-performing mixtures (R1, R2, R6) combined elevated methane potential (P values around 300 NmL CH4 g VS−1) with higher maximum production rates (Rm > 8.8 NmL g VS−1 d−1), confirming that the joint addition of CW and OFMSW enhanced both biodegradability and conversion efficiency. In contrast, R7 (80:0:20) exhibited the lowest Rm, consistent with its lower co-substrate content, while increasing OFMSW from 20% (R7) to 40% (R4) raised Rm by 30%, highlighting its positive contribution.
Lag phases in AcoD vary widely depending on mixture composition and inoculum adaptation; for example, mixtures with local organic residues have shown λ lower than 10 days [71]. In this work, λ ranged from 6 to 10.5 days without a consistent trend, indicating complex microbial adaptation. These values are typical for mesophilic inocula exposed to easily acidifiable co-substrates such as whey or food waste, which require short acclimation before stable methanogenesis is established [72]. These values should not be interpreted as poor inoculum performance. Instead, they are consistent with the use of a moderate SIR, lower SIR values can shorten λ by over-seeding and increasing buffer capacity, whereas a moderate SIR preserves comparability across mixtures and avoids excessive use of inoculum. In this case, the rapid decline in AR and early pH stabilization indicate that the inoculum level was sufficient to establish consumption of VFAs by methanogenic microorganisms (hydrogenotrophic and acetoclastic methanogenesis); the limited delay likely reflects normal acclimation to the specific substrate mixture rather than an inoculum deficiency [73,74].
The overall duration of the assays (around 61 d) was longer than in many AcoD studies but can be considered consistent with the SIR and the heterogeneous biodegradability of the tested substrates, both of which are known to influence methane production kinetics [75]. Similar experimental periods have been reported in the literature, particularly when slowly biodegradable fractions are present. For instance, reactors were operated for 60 days to ensure complete degradation of local organic residues [71], while up to 64 days were required for fruit and vegetable waste co-digestion to adequately assess synergy and process stability [76]. Likewise, a 50-day retention period was applied in assays with poultry slaughterhouse residues [77]. These comparisons indicate that operation for 60–70 days falls within the expected range for heterogeneous substrates. From an operational standpoint, Figure 3 shows that R1, R2, and R6 (solid lines) retained their advantage not only at 61 days but also at 40 days, which suggests that these blends remain robust options under shorter retention times, which is highly relevant for process design and scale-up.
4.4. Model Robustness, Optimization and Practical Implications
The statistical performance of the special-cubic mixture model developed in this study (R2 = 96.3%, R2pred = 85.4%) highlights its robustness and predictive accuracy. Several works have employed mixture designs (simplex centroid/augmented) to quantify synergies and identify optimal mixture regions, demonstrating that interaction terms, particularly ternary ones, account for a large share of performance improvements. Ref. [10] reported a quadratic model for co-digestion of cow manure, pig manure, and slaughterhouse waste. That model successfully identified an optimal ternary blend (27% cow manure, 31% pig manure, 42% slaughterhouse waste) that increased methane yield by 17% relative to additivity. Similarly, ref. [48] applied a simplex-centroid design to mixtures of sewage sludge, food waste, and horse manure, where the special cubic polynomial model predicted a 50% yield increase over mono-digestion. Ref. [78] combined mixture regression with Gompertz-based kinetics to optimize pig manure, cow manure, and starch wastewater blends, confirming the relevance of ternary interactions for maximizing both methane yield and production rate. In line with these studies, the inclusion of a special cubic term in the present work improved predictive accuracy and captured the complexity of SW, CW and OFMSW substrate interactions.
Examination of the regression coefficients revealed clear interaction patterns that further explained the experimental outcomes. The negative pairwise terms (SW × CW and SW × OFMSW) suggest that binary blends dominated by SW with only one acidogenic co-substrate were less favorable, likely due to nutrient imbalances or limited buffering relative to acidification potential. By contrast, the strong positive ternary interaction (β123 = +739, p = 0.001) evidenced genuine synergy when all three substrates were combined, integrating the buffering and nutrient supply of SW with the easily degradable carbon from CW and OFMSW. These non–additive patterns are consistent with broader reports where ternary co–digestion strategies outperform mono digestion systems, as they mitigate inhibition risks and enhance both stability and energy recovery [64,79].
Optimization outcomes reinforced these conclusions by revealing a broad, robust region rather than a single, narrow optimum. The desirability surface highlighted not only a theoretical optimum (63% SW, 10% CW, 27% OFMSW; CMY around 300 NmL CH4 g VS−1, d = 1.0) but also a wide operating region (60–66% SW, 6–20% CW, 20–31% OFMSW) where methane yields consistently exceeded 295 NmL CH4 g VS−1. This flexibility is highly relevant for practical applications, where the availability of agro-industrial residues and organic waste is variable and seasonal. The existence of a robust interior region, rather than a sharp optimum, represents one of the main advantages of mixture-design optimization [48].
The temporal consistency of the optimal mixture further supports the robustness of the model. At day 42, the response surface and desirability map were essentially unchanged compared to day 61, with the same high-performing band (SW ≈ 60–66%, CW ≈ 6–20%, OFMSW ≈ 20–31%) and a nominal optimum near 63/10/27. The coefficient pattern mirrored that of the 61-day model, with inhibitory binary terms and a strong positive ternary interaction. This indicates that CMY maximization is primarily driven by substrate composition rather than prolonged incubation within this timeframe, supporting operational flexibility under shorter retention times (Table S4 and Figure S5).
Beyond methane yield, a simplified mass balance indicates that around 0.30 Nm3 CH4 can be recovered per kg VS fed in the best-performing mixtures, together with stabilized digestate containing residual organic matter and nutrients. The digestates obtained in this study exhibited neutral final pH, high buffering capacity, confirming chemical stability and nutrient availability. Residual VS and COD values suggest the presence of organic matter that can improve soil structure and water retention. These properties support the agronomic valorization of digestate as a biofertilizer, reducing dependence on synthetic fertilizers. Previous studies have demonstrated that digestates from co–digestion provide significant amounts of nitrogen, phosphorus, and potassium, enhance soil microbial activity, and improve crop yields when properly managed [80]. Thus, in addition to methane recovery, the process contributes to nutrient recycling and the closing of material loops in line with circular economy principles. However, the agronomic use of digestate must be verified against N–P–K, C/N, salinity/EC, trace metals, and local regulatory limits prior to application to the soil.
In addition, co-digestion prevents the uncontrolled emissions associated with open storage of SW, the discharge of whey with COD > 40 g/L, and the landfill disposal of OFMSW, all of which represent significant environmental costs. By avoiding these impacts, the process achieves both energy recovery and mitigation of GHG emissions, positioning AcoD as a waste to energy technology with clear environmental co–benefits.
5. Conclusions
AcoD of SW, CW, and the OFMSW was demonstrated to be technically feasible, stable and composition-dependent. The special-cubic mixture model developed in this work revealed a strong ternary synergy that enhanced methane yield beyond binary and mono-digestion combinations. The identified high-performance region (SW 60–66%, CW 6–20%, OFMSW 20–31%) provides operational flexibility to adapt formulations to substrate availability.
The integration of mixture modeling, desirability-based optimization, and kinetic validation through the modified Gompertz model proved effective for capturing nonlinear interactions and predicting process performance. These findings indicate that the observed synergy arises from complementary substrate characteristics, nutrient balance, buffering capacity, and degradability, that promote stable methanogenesis.
Beyond the specific mixture evaluated, the combined statistical–kinetic framework developed here can be extended to other co-digestion systems, offering a reproducible and transferable approach for determining optimal substrate compositions and forecasting methane yields. This integrative methodology supports the design of circular bioenergy strategies by transforming diverse organic residues into renewable energy while reducing waste generation, providing a quantitative foundation for scaling up co-digestion processes toward real-world implementation.
Supplementary Materials
The following supporting information can be downloaded at: https://www.mdpi.com/article/10.3390/biomass5040072/s1, Figure S1. Experimental cumulative methane yields (points) and Gompertz model fits (lines) for treatments R1 to R7; Table S1. Cumulative biogas and methane yields of the co-digestion mixtures; Figure S2. Evolution of pH during anaerobic co-digestion for each treatment (R1–R7); Table S2. Gompertz Equation Parameters. P is the methane potential (NmL g VS−1), Rm the maximum production rate (NmL g VS−1 d−1), Lambda (λ) the lag phase (days). Figure S3. Temporal evolution of alkalinity ratio (AR) during anaerobic co-digestion for each treatment (R1–R7); Table S3: ANOVA results for CMY (NmL CH4 g−1 VS) for the special-cubic mixture model Figure S4. Residual diagnostics for the special-cubic mixture model of CMY (NmL CH4 g−1 VS): (a) normal probability plot, (b) residuals versus fitted values, (c) residual histogram, and (d) residuals versus observation order; Table S4: Regression coefficients for the special cubic models for CMY. Figure S5. Special-cubic mixture response surface for CMY at 42 days. Table S5. Special-cubic mixture model coefficients for cumulative methane yield at 42 days.
Author Contributions
Conceptualization, V.C. and G.O.; methodology, V.C.; software, G.O.; validation, V.C. and G.O.; formal analysis, V.C. and G.O.; investigation, V.C.; resources, V.C.; data curation, V.C. and G.O.; writing—original draft preparation, V.C.; writing—review and editing, V.C. and G.O.; visualization, G.O.; supervision, V.C.; project administration, V.C.; funding acquisition, V.C. All authors have read and agreed to the published version of the manuscript.
Funding
This research received no external funding.
Institutional Review Board Statement
Not applicable.
Informed Consent Statement
Not applicable.
Data Availability Statement
The datasets generated during and/or analyzed during the current study are available from the corresponding author upon reasonable request.
Acknowledgments
This research was made possible thank you to the support of the Argentine National Council of Scientific and Technical Research (CONICET) through a research fellowship granted to Verónica Córdoba, and the National University of the Centre of Buenos Aires Province (UNCPBA) which provided institutional facilities. Authors would also give thanks to the local Cooperative of Electricity of Olavarría (Coopelectric) for the supply of the sewage sludge used in this study. The authors are also grateful to Estela Santalla for her valuable guidance and support during the initial stages of this research.
Conflicts of Interest
The authors declare no conflicts of interest.
Abbreviations
The following abbreviations are used in this manuscript:
| ANOVA | Analysis of variance |
| AR (IA/PA) | Alkalinity ratio |
| CMY | Cumulative Methane Yield |
| COD | Chemical oxygen demand |
| CW | Cheese whey |
| IA | Intermediate alkalinity |
| N-NH4+ | Ammonium nitrogen |
| OFMSW | Organic fraction of municipal solid waste |
| P | Methane potential |
| PRESS | Predicted residual error sum of squares |
| Rm | Maximum methane production rate |
| RSM | Response surface methodology |
| SIR | Substrate-to-inoculum |
| SW | Swine wastewater |
| TA | Total alkalinity |
| TS | Total solids |
| TN | Total nitrogen |
| VFA | Volatile fatty acids |
| VS | Volatile Solids |
| λ | Lag phase |
References
- United Nations Environment Programme (UNEP). Food Waste Index Report 2024. Think Eat Save: Tracking Progress to Halve Global Food Waste; UNEP: Nairobi, Kenya, 2024; Available online: https://wedocs.unep.org/20.500.11822/45230 (accessed on 31 August 2025).
- Zhang, R.; El-Mashad, H.M.; Hartman, K.; Wang, F.; Liu, G.; Choate, C.; Gamble, P. Characterization of food waste as feedstock for anaerobic digestion. Bioresour. Technol. 2007, 98, 929–935. [Google Scholar] [CrossRef]
- He, K.; Liu, Y.; Tian, L.; He, W.; Cheng, Q. Review in anaerobic digestion of food waste. Heliyon 2024, 10, e28200. [Google Scholar] [CrossRef]
- Kaza, S.; Yao, L.; Bhada-Tata, P.; Van Woerden, F. What a Waste 2.0: A Global Snapshot of Solid Waste Management to 2050; World Bank: Washington, DC, USA, 2018; Available online: https://www.ccacoalition.org/resources/what-waste-20-global-snapshot-solid-waste-management-2050 (accessed on 31 August 2025).
- Aljarrah, M.; Ashraf, A.; Khandakar, A.; Rohouma, W.; Ayari, M.A.; Esmaeili, A.; Butt, R.; Kadampotupadeth, S.; Thomas, K.; Rahman, A.; et al. Environmental performance analysis of three organic waste disposal scenarios: Landfilling, composting, and EP-50. Discov. Sustain. 2024, 5, 445. [Google Scholar] [CrossRef]
- McGaughy, K.; Morelli, B.; Martell, A.; Santa Ana, J.; Ingwersen, W.W. Food waste end-of-life management for the United States: Parameterized life cycle inventory datasets. Data Brief 2024, 57, 111174. [Google Scholar] [CrossRef]
- Xiao, Y.; Zan, F.; Zhang, W.; Hao, T. Alleviating nutrient imbalance of low carbon-to-nitrogen ratio food waste in anaerobic digestion by controlling the inoculum-to-substrate ratio. Bioresour. Technol. 2022, 346, 126342. [Google Scholar] [CrossRef]
- Tanimu, M.I.; Ghazi, T.I.M.; Harun, R.M.; Idris, A. Effect of carbon to nitrogen ratio of food waste on biogas methane production in a batch mesophilic anaerobic digester. Int. J. Innov. Manag. Technol. 2014, 5, 116–119. [Google Scholar] [CrossRef]
- Wang, X.; Lu, X.; Li, F.; Yang, G. Effects of temperature and carbon–nitrogen (C/N) ratio on the performance of anaerobic co-digestion of dairy manure, chicken manure and rice straw: Focusing on ammonia inhibition. PLoS ONE 2014, 9, e97265. [Google Scholar] [CrossRef] [PubMed]
- Jo, S.; Kadam, R.; Jang, H.; Seo, D.; Park, J. Elucidating synergetic effects of anaerobic co-digestion of slaughterhouse waste with livestock manures. Energies 2024, 17, 3027. [Google Scholar] [CrossRef]
- Mutegoa, E.; Hilonga, A.; Njau, K.N. Approaches to the mitigation of ammonia inhibition during anaerobic digestion—A review. Water Pract. Technol. 2020, 15, 551–570. [Google Scholar] [CrossRef]
- Mata-Alvarez, J.; Dosta, J.; Romero-Güiza, M.S.; Fonoll, X.; Peces, M.; Astals, S. A critical review on anaerobic co-digestion achievements between 2010 and 2013. Renew. Sustain. Energy Rev. 2014, 36, 412–427. [Google Scholar] [CrossRef]
- Dima, A.D.; Pârvulescu, O.C.; Mateescu, C.; Dobre, T. Optimization of substrate composition in anaerobic co-digestion of agricultural waste using central composite design. Biomass Bioenergy 2020, 138, 105602. [Google Scholar] [CrossRef]
- Cardona, L.; Levrard, C.; Guenne, A.; Chapleur, O.; Mazéas, L. Co-digestion of wastewater sludge: Choosing the optimal blend. Waste Manag. 2019, 87, 772–781. [Google Scholar] [CrossRef]
- Carlini, M.; Castellucci, S.; Moneti, M. Biogas production from poultry manure and cheese whey wastewater under mesophilic conditions in batch reactor. Energy Procedia 2015, 82, 811–818. [Google Scholar] [CrossRef]
- Jin, W.; Xu, X.; Yang, F.; Li, C.; Zhou, M. Performance enhancement by rumen cultures in anaerobic co-digestion of corn straw with pig manure. Biomass Bioenergy 2018, 115, 120–129. [Google Scholar] [CrossRef]
- Yangin-Gomec, C.; Ozturk, I. Effect of maize silage addition on biomethane recovery from mesophilic co-digestion of chicken and cattle manure to suppress ammonia inhibition. Energy Convers. Manag. 2013, 71, 92–100. [Google Scholar] [CrossRef]
- Reza, A.; Chen, L.; Mao, X. Response surface methodology for process optimization in livestock wastewater treatment: A review. Heliyon 2024, 10, e30326. [Google Scholar] [CrossRef] [PubMed]
- Iweka, S.C.; Owuama, K.C.; Chukwuneke, J.L.; Falowo, O.A. Optimization of biogas yield from anaerobic co-digestion of corn-chaff and cow dung digestate: RSM and python approach. Heliyon 2021, 7, e08255. [Google Scholar] [CrossRef]
- Casallas-Ojeda, M.; Cabeza, I.; Sanchez, N.; Caicedo-Concha, D.M.; Astals, S. Cheese whey and dairy manure anaerobic co-digestion at psychrophilic conditions: Technical and environmental evaluation. Environ. Res. 2024, 251, 118525. [Google Scholar] [CrossRef]
- Zhou, J.; Qu, A.; Ming, S.; Zhang, Y.; Duan, N. Binary-component anaerobic co-digestion: Synergies and microbial profiles. Renew. Energy 2022, 201, 1–10. [Google Scholar] [CrossRef]
- Mlaik, N.; Sayadi, S.; Masmoudi, M.A.; Yaacoubi, D.; Loukil, S.; Khoufi, S. Optimization of anaerobic co-digestion of fruit and vegetable waste with animal manure feedstocks using mixture design. Biomass Convers. Biorefin. 2024, 14, 4007–4016. [Google Scholar] [CrossRef]
- Xie, S.; Hai, F.I.; Zhan, X.; Guo, W.; Ngo, H.H.; Price, W.E.; Nghiem, L.D. Anaerobic Co-Digestion: A Critical Review of Mathematical Modelling for Performance Optimization. Bioresour. Technol. 2016, 222, 498–512. [Google Scholar] [CrossRef]
- Galal, O.H.; Abdel-Daiem, M.; Alharbi, H.S.; Said, N. Mathematical Modeling and Machine Learning Approaches for Biogas Production from Anaerobic Digestion: A Review. BioResources 2025, 20, 11237–11266. [Google Scholar] [CrossRef]
- Naji, A.; Dujany, A.; Guerin Rechdaoui, S.; Rocher, V.; Pauss, A.; Ribeiro, T. Optimization of Liquid-State Anaerobic Digestion by Defining the Optimal Composition of a Complex Mixture of Substrates Using a Simplex Centroid Design. Water 2024, 16, 1953. [Google Scholar] [CrossRef]
- Olatunji, K.O.; Madyira, D.M. Optimization of Methane Yield from Co-Digestion of Alkali-Pretreated Groundnut Shells and Duck Waste Using Response Surface Methodology. IOP Conf. Ser. Earth Environ. Sci. 2024, 1322, 012002. [Google Scholar] [CrossRef]
- Koumayo, H.; Essi Kouadio, F.; Gbangbo Rémis, K. Optimization of Methane Production through Anaerobic Co-Digestion of Maize By-Products Using Mixture Design in Katiola, Côte d’Ivoire. Chem. Sci. Int. J. 2025, 34, 84–97. [Google Scholar] [CrossRef]
- Zhao, X.; Hong, J.K.; Park, S.Y.; Yun, J.; Jho, E.H. Stabilization of microbial network by co-digestion of swine manure and organic wastes. J. Environ. Manag. 2024, 355, 120475. [Google Scholar] [CrossRef] [PubMed]
- Azevedo, A.; Lapa, N.; Moldão, M.; Duarte, E. Opportunities and challenges in the anaerobic co-digestion of municipal sewage sludge and fruit and vegetable wastes: A review. Energy Nexus 2023, 10, 100202. [Google Scholar] [CrossRef]
- Agencia Argentina de Inversiones y Comercio Internacional (AAICI). Available online: https://argentina.ar/es/quienes-somos (accessed on 3 November 2025).
- Hu, F.; Zhang, S.; Liu, S.; Wan, L.; Gong, G.; Hu, T.; Hu, Y. Alleviating acid inhibition via bentonite supplementation during acidulated swine manure anaerobic digestion: Performance enhancement and microbial mechanism analysis. Chemosphere 2023, 313, 137577. [Google Scholar] [CrossRef]
- Rivera, F.; Villareal, L.; Prádanos, P.; Hernández, A.; Palacio, L.; Muñoz, R. Enhancement of swine manure anaerobic digestion using membrane-based NH3 extraction. Bioresour. Technol. 2022, 362, 127829. [Google Scholar] [CrossRef] [PubMed]
- Casallas-Ojeda, M.; Perez-Esteban, N.; Cabeza, I.; Cobo, M.; Olaya-Rincon, M.; Caicedo-Concha, D.M.; Astals, S. Understanding the acidification risk of cheese whey anaerobic digestion under psychrophilic and mesophilic conditions. Heliyon 2024, 10, e24910. [Google Scholar] [CrossRef]
- Lembo, G.; Signorini, A.; Marone, A.; Carbone, C.; Agostini, A. Hydrogen and methane production by single- and two-stage anaerobic digestion of second cheese whey: Economic performances and GHG emissions evaluation. Energies 2022, 15, 7869. [Google Scholar] [CrossRef]
- Salangsang, M.C.D.; Sekine, M.; Akizuki, S.; Sakai, H.D.; Kurosawa, N.; Toda, T. Effect of carbon to nitrogen ratio of food waste and short resting period on microbial accumulation during anaerobic digestion. Biomass Bioenergy 2022, 162, 106481. [Google Scholar] [CrossRef]
- Tian, H.; Duan, N.; Lin, C.; Li, X.; Zhong, M. Anaerobic co-digestion of kitchen waste and pig manure with different mixing ratios. J. Biosci. Bioeng. 2015, 120, 51–57. [Google Scholar] [CrossRef]
- Baek, G.; Kim, D.; Kim, J.; Kim, H.; Lee, C. Treatment of cattle manure by anaerobic co-digestion with food waste and pig manure: Methane yield and synergistic effect. Int. J. Environ. Res. Public Health 2020, 17, 4737. [Google Scholar] [CrossRef]
- Holliger, C.; Alves, M.; Andrade, D.; Angelidaki, I.; Astals, S.; Baier, U.; Bougrier, C.; Buffière, P.; Carballa, M.; De Wilde, V.; et al. Towards a standardization of biomethane potential tests. Water Sci. Technol. 2016, 74, 2515–2522. [Google Scholar] [CrossRef]
- APHA. Standard Methods for the Examination of Water and Wastewater, 20th ed.; American Public Health Association/American Water Works Association/Water Environment Federation: Washington, DC, USA, 1999. [Google Scholar]
- Jenkins, S.R.; Morgan, J.M.; Sawyer, C.L. Measuring Anaerobic Sludge Digestion and Growth by a Simple Alkalimetric Titration. J. Water Pollut. Control Fed. 1983, 55, 448–453. Available online: http://www.jstor.org/stable/25041903 (accessed on 27 August 2025).
- Rodrigues, L.S.; Silva, I.J.; Oliveira, P.R.; Pinto, A.C.A.; Lima, C.A. Influence of the Ratio IA/PA and Volatile Acids in the Monitoring of UASB Reactor in the Treating of Swine Waste Water. J. Water Resour. Prot. 2014, 6, 285–291. [Google Scholar] [CrossRef]
- Palma-Heredia, D.; Verdaguer, M.; Puig, V.; Poch, M.; Cugueró-Escofet, M.À. Comparison of optimisation algorithms for centralised anaerobic co-digestion in a real river basin case study in Catalonia. Sensors 2022, 22, 1857. [Google Scholar] [CrossRef]
- Valença, R.B.; dos Santos, L.A.; Firmo, A.L.B.; da Silva, L.C.S.; de Lucena, T.V.; Santos, A.F.D.M.S.; Jucá, J.F.T. Influence of sodium bicarbonate (NaHCO3) on the methane generation potential of organic food waste. J. Clean. Prod. 2021, 317, 128390. [Google Scholar] [CrossRef]
- Al-Samet, M.A.; Goto, M.; Mubarak, N.M.; Al-Muraisy, S.A. Evaluating the Biomethane Potential from the Anaerobic Co-Digestion of Palm Oil Mill Effluent, Food Waste, and Sewage Sludge in Malaysia. Environ. Sci. Pollut. Res. 2021, 28, 67632–67645. [Google Scholar] [CrossRef] [PubMed]
- Mohammadianroshanfekr, M.; Pazoki, M.; Pejman, M.B.; Ghasemzadeh, R.; Pazoki, A. Kinetic Modeling and Optimization of Biogas Production from Food Waste and Cow Manure Co-Digestion. Results Eng. 2024, 24, 103477. [Google Scholar] [CrossRef]
- Wang, X.; Yang, G.; Li, F.; Feng, Y.; Ren, G.; Han, X. Evaluation of two statistical methods for optimizing the feeding composition in anaerobic co-digestion: Mixture design and central composite design. Bioresour. Technol. 2013, 131, 172–178. [Google Scholar] [CrossRef]
- Djimtoingar, S.S.; Derkyi, N.S.A.; Kuranchie, F.A. Optimisation of the anaerobic co-digestion process of Calotropis procera leaves, stems, and cow dung using a mixture design. S. Afr. J. Chem. Eng. 2023, 45, 283–293. [Google Scholar] [CrossRef]
- Cornell, J.A. Experiments with Mixtures: Designs, Models, and the Analysis of Mixture Data; Wiley Series in Probability and Statistics; John Wiley & Sons: New York, NY, USA, 2002. [Google Scholar] [CrossRef]
- Chow, W.L.; Chong, S.; Lim, J.W.; Chan, Y.J.; Chong, M.F.; Tiong, T.J.; Chin, J.K.; Pan, G.-T. Anaerobic co-digestion of wastewater sludge: A review of potential co-substrates and operating factors for improved methane yield. Processes 2020, 8, 39. [Google Scholar] [CrossRef]
- Minitab. Minitab 15: Manual de Usuario; Minitab Inc.: State College, PA, USA, 2007; p. 144. [Google Scholar]
- Derringer, G.; Suich, R. Simultaneous Optimization of Several Response Variables. J. Qual. Technol. 1980, 12, 214–219. [Google Scholar] [CrossRef]
- Rajagopal, R.; Massé, D.I.; Singh, G. A critical review on inhibition of anaerobic digestion process by excess ammonia. Bioresour. Technol. 2013, 143, 632–641. [Google Scholar] [CrossRef]
- Szaja, A.; Dudek, M.; Głodek, E.; Kowalczyk, A. An effective energetic application of orange waste in multi-component co-digestion with municipal sewage sludge. Appl. Sci. 2025, 15, 1537. [Google Scholar] [CrossRef]
- Arnal-Sierra, J.; Sumaila, A.; Pérez, J. Anaerobic Co-Digestion of Food Waste in Ghana: Process Stability and Methane Yield Optimization. Sustainability 2025, 17, 7590. [Google Scholar] [CrossRef]
- Ripley, L.E.; Boyle, W.C.; Converse, J.C. Improved alkalimetric monitoring for anaerobic digestion of high-strength wastes. J. Water Pollut. Control Fed. 1986, 58, 406–411. Available online: https://www.jstor.org/stable/25042933 (accessed on 26 August 2025).
- Simeonov, I.; Chorukova, E.; Kabaivanova, L. Two-Stage Anaerobic Digestion for Green Energy Production: A Review. Processes 2025, 13, 294. [Google Scholar] [CrossRef]
- Dube, P.J.; Vanotti, M.B.; Szogi, A.A.; García-González, M.C. Enhancing recovery of ammonia from swine manure anaerobic digester effluent using gas-permeable membrane technology. Waste Manag. 2016, 49, 372–377. [Google Scholar] [CrossRef]
- Prazeres, A.R.; Carvalho, F.; Rivas, J. Cheese whey management: A review. J. Environ. Manag. 2012, 110, 48–68. [Google Scholar] [CrossRef] [PubMed]
- Anaya-Reza, O.; Altamirano-Corona, M.F.; Basurto-García, G.; Patricio-Fabián, H.; García-González, S.A.; Martínez-Hernández, E.; Durán-Moreno, A. Wet anaerobic digestion of organic fraction of municipal solid waste: Experience with long-term pilot plant operation and industrial scale-up. Bioprocess Biosyst. Eng. 2024, 47, 235–247. [Google Scholar] [CrossRef]
- Babaei, A.; Shayegan, J. Effects of temperature and mixing modes on the performance of municipal solid waste anaerobic slurry digester. J. Environ. Health Sci. Eng. 2019, 17, 1077–1084. [Google Scholar] [CrossRef] [PubMed]
- Jasko, J.; Skripsts, E.; Dubrovskis, V.; Zabarovskis, E.; Kotelenecs, V. Biogas production from cheese whey in two-phase anaerobic digestion. In Proceedings of the Engineering for Rural Development, Jelgava, Latvia, 25–27 May 2011; pp. 373–376. [Google Scholar]
- Nwokolo, N.; Mukumba, P.; Obileke, K.; Enebe, M. Waste to Energy: A Focus on the Impact of Substrate Type in Biogas Production. Processes 2020, 8, 1224. [Google Scholar] [CrossRef]
- Stres, B.; Hatzikioseyian, A.; Kousi, P.; Remoundaki, E.; Deutsch, L.; Mikuš, K.V.; Rak, G.; Repinc, S.K. Case specific: Addressing co-digestion of wastewater sludge, cheese whey and cow manure: Kinetic modeling. Heliyon 2024, 10, e38773. [Google Scholar] [CrossRef]
- Pan, S.; Zabed, H.M.; Li, Z.; Qi, X.; Wei, Y. Enrichment and balancing of nutrients for improved methane production using three compositionally different agro-livestock wastes: Process performance and microbial community analysis. Bioresour. Technol. 2022, 357, 127360. [Google Scholar] [CrossRef]
- Zhang, L.; Lee, Y.W.; Jahng, D. Anaerobic co-digestion of food waste and piggery wastewater: Focusing on the role of trace elements. Bioresour. Technol. 2011, 102, 5048–5059. [Google Scholar] [CrossRef] [PubMed]
- Franke-Whittle, I.H.; Walter, A.; Ebner, C.; Insam, H. Investigation into the effect of high concentrations of volatile fatty acids in anaerobic digestion on methanogenic communities. Waste Manag. 2014, 34, 2080–2089. [Google Scholar] [CrossRef]
- Wainaina, S.; Lukitawesa; Awasthi, M.K.; Taherzadeh, M.J. Bioengineering of anaerobic digestion for volatile fatty acids, hydrogen or methane production: A critical review. Bioengineered 2019, 10, 437–458. [Google Scholar] [CrossRef]
- Harirchi, S.; Wainaina, S.; Sar, T.; Nojoumi, S.A.; Parchami, M.; Parchami, M.; Varjani, S.K.; Khanal, S.K.; Wong, J.; Awasthi, M.K.; et al. Microbiological insights into anaerobic digestion for biogas, hydrogen or volatile fatty acids (VFAs): A review. Bioengineered 2022, 13, 6521–6557. [Google Scholar] [CrossRef]
- Li, P.; Li, W.; Sun, M.; Xu, X.; Zhang, B.; Sun, Y. Evaluation of Biochemical Methane Potential and Kinetics on the Anaerobic Digestion of Vegetable Crop Residues. Energies 2019, 12, 26. [Google Scholar] [CrossRef]
- Zhang, H.; An, D.; Cao, Y.; Tian, Y.; He, J. Modeling the Methane Production Kinetics of Anaerobic Co-Digestion of Agricultural Wastes Using Sigmoidal Functions. Energies 2021, 14, 258. [Google Scholar] [CrossRef]
- Fernández-Rodríguez, J.; Di Berardino, M.; Di Berardino, S. Promoting the circular economy on an island: Anaerobic co-digestion of local organic substrates as a possible renewable energy source. Microorganisms 2023, 11, 285. [Google Scholar] [CrossRef]
- Ali, S.S.; El-Mashad, H.M.; Zhang, R. Theoretical models for prediction of methane production from anaerobic digestion: A critical review. Int. J. Phys. Sci. 2018, 13, 206–216. [Google Scholar] [CrossRef]
- Koch, K.; Hafner, S.D.; Weinrich, S.; Astals, S.; Holliger, C. Identification of critical problems in biochemical methane potential (BMP) tests: A systematic review of influencing factors. Front. Environ. Sci. 2019, 7, 178. [Google Scholar] [CrossRef]
- Corsino, S.F.; Torregrossa, M.; Viviani, G. Biomethane production from anaerobic co-digestion of selected organic fraction of municipal solid waste with sewage sludge: Effect of inoculum-to-substrate ratio and mixture composition on process performance. Int. J. Environ. Res. Public Health 2021, 18, 13048. [Google Scholar] [CrossRef] [PubMed]
- Al-Iraqi, A.R.; Gandhi, B.P.; Folkard, A.M.; Barker, P.A.; Semple, K.T. Influence of inoculum to substrate ratio and substrates mixing ratio on biogas production from the anaerobic co-digestion of Phragmites australis and food waste. Bioenerg. Res. 2024, 17, 1277–1287. [Google Scholar] [CrossRef]
- Miramontes-Martínez, L.R.; Rivas-García, P.; Albalate-Ramírez, A.; Botello-Álvarez, J.E.; Escamilla-Alvarado, C.; Gomez-Gonzalez, R.; Alcalá-Rodríguez, M.M.; Valencia-Vázquez, R.; Santos-López, I.A. Anaerobic co-digestion of fruit and vegetable waste: Synergy and process stability analysis. J. Air Waste Manag. Assoc. 2021, 71, 620–632. [Google Scholar] [CrossRef] [PubMed]
- Poompavai, T.; Kowsalya, M. Anaerobic co-digestion of poultry slaughterhouse wastes. Renew. Sust. Energy Rev. 2019, 107, 50–59. [Google Scholar] [CrossRef]
- Regalado, R.E.H.; Rojas, N.J.P.; Tang, Y.; Ray, M.B. Optimization and Analysis of Liquid Anaerobic Co-Digestion of Agro-Industrial Wastes via Mixture Design. Processes 2021, 9, 877. [Google Scholar] [CrossRef]
- Kadam, R.; Jo, S.; Lee, J.; Khanthong, K.; Jang, H.; Park, J. A Review on the Anaerobic Co-Digestion of Livestock Manures in the Context of Sustainable Waste Management. Energies 2024, 17, 546. [Google Scholar] [CrossRef]
- Martín-Sanz-Garrido, J.; de Miguel-Gómez, M.D.; Cuevas-Martínez, J.M.; Fernández-González, J.M. A review on anaerobic digestate as a biofertilizer: Composition, benefits and environmental impacts. Appl. Sci. 2025, 15, 8635. [Google Scholar] [CrossRef]


Disclaimer/Publisher’s Note: The statements, opinions and data contained in all publications are solely those of the individual author(s) and contributor(s) and not of MDPI and/or the editor(s). MDPI and/or the editor(s) disclaim responsibility for any injury to people or property resulting from any ideas, methods, instructions or products referred to in the content. |
© 2025 by the authors. Licensee MDPI, Basel, Switzerland. This article is an open access article distributed under the terms and conditions of the Creative Commons Attribution (CC BY) license (https://creativecommons.org/licenses/by/4.0/).