Article

Comprehensive Environmental Impact Analysis of Dry Processing Methods for Specialty Coffee Beans in Bondowoso, Indonesia Using Life Cycle Assessment

by
Andik Irawan
1,2,
Harifara Rabemanolontsoa
3 and
Benjamin C. McLellan
1,*
1
Department of Socio-Environmental Energy Science, Graduate School of Energy Science, Kyoto University, Kyoto 606-8501, Japan
2
Department of Engineering, Politeknik Negeri Jember, Kabupaten Jember 68121, Indonesia
3
International Advanced Energy Science Research and Education Center, Graduate School of Energy Science, Kyoto University, Kyoto 606-8501, Japan
*
Author to whom correspondence should be addressed.
Biomass 2024, 4(3), 843-864; https://doi.org/10.3390/biomass4030047
Submission received: 19 June 2024 / Revised: 15 July 2024 / Accepted: 23 July 2024 / Published: 2 August 2024

Abstract

:
Smallholders play a key role in specialty coffee production. Implementing industrial ecology coffee (IEC) practices is crucial for sustainable coffee production (SCP), aiming to add value, achieve zero waste, and respect the environment. For that purpose, this study used life cycle assessment (LCA) to assess the environmental impact of coffee production, specifically focusing on the global warming potential (GWP) of dry methods (DMs). Data were collected from pilot plant operations in Bondowoso, Indonesia, covering the process from cherry beans (CBs) to coffee powder (CP). A unique aspect of this study is assessing the impact of the DMs: Natural, Anaerobic, Hydro honey, Lactic, and Carbonic Maceration, which were often overlooked in previous research. Observations and experimental results served as primary data for input calculations in LCA. As a result, it was found that for the studied DMs, inputting 150 kg per batch of CBs produced approximately 22.4–22.8 kg of CP. The LCA revealed that for one kg of CP produced by the DMs, GWP ranged from 0.676 kg to 1.168 kg of CO2-eq, with Natural being the least polluting and Lactic having the highest environmental impact. This study also suggests potential improvements in by-products for novel food and fuel applications.

1. Introduction

Coffee is a globally significant commodity, influencing economies, cultures, and livelihoods. Specialty coffee, which emphasizes quality and sustainability, emerged in the 1960s–1970s [1], driving the establishment of specialty coffee shops. Distinguished by its superior quality and limited production, specialty coffee plays a crucial economic role [2]. Producers benefit from higher incomes [3], while specialty coffee establishments stimulate economic activity [4]. Ethical sourcing practices also attract consumers, enhancing the industry’s economic value [5,6]. The fourth wave coffee culture further emphasizes sustainability and ethical practices. Environmental impact and sustainability are key concerns across these coffee movements. In this context, life cycle assessment (LCA) is useful for assessing and monitoring sustainable coffee production (SCP). LCA is a methodology that focuses on identifying and quantifying product impacts through the appropriate combination of input data for analysis. LCA results greatly depend on the location.
Indonesia is the fourth largest coffee producer in the world, producing 725.68 × 10³ ton/year [7], and plays a significant role in the specialty coffee industry due to its unique coffee varieties, ideal growing conditions, and commitment to quality and sustainability. Coffee plantations in Indonesia have become a significant source of income for farmers, owing to the widespread popularity of the beverage worldwide [8]. Despite variations in plantation quality affecting coffee production, the growing demand for coffee remains steadfast [9]. Consequently, emphasis on quality and flavor has become pivotal, especially in specialty coffee produced by smallholders, even though the quantity may be relatively low [10]. The supply of specialty quality coffee plays a crucial role in enabling smallholders to bypass lengthy sales chains, directly selling to customers and augmenting their income despite financial constraints [4]. In regions like Bondowoso, Indonesia, coffee smallholders have adopted approaches such as the product life cycle (PLC) method to bolster their income by shortening the sales chain [11]. Moreover, enhancing the quality of coffee processing provides smallholder farmers with additional opportunities to maximize their profits [12]. However, to align with the requirements of specialty coffee, mindful consideration of environmental impacts is essential. The concept encompasses environmentally friendly and socially responsible coffee cultivation practices that prioritize fair treatment of workers, biodiversity, and conservation towards sustainable coffee production (SCP) [13,14].
The primary coffee bean processing configurations include the wet and dry methods (DMs). While the wet methods (WMs) are generally used, DMs have become a focus for processors aiming to produce specialty coffee with high Cup of Excellence (COE) scores [10]. DMs yield coffee with complex flavors and aromas [12,15]. However, meeting the market demands of fourth wave coffee culture [16] poses a challenge for DM coffee production. Investing in technological infrastructure to enhance quality and enable the production of derivative coffee products is a key component of SCP. Additionally, there is the option of implementing industrial ecology coffee (IEC), an approach to coffee production that integrates principles of industrial ecology to optimize sustainability by minimizing waste and environmental impacts. To tailor these investments effectively, LCA is necessary. It analyzes environmental impacts, identifies improvement areas, aids decision-making, fosters continuous improvement, helps in market positioning, and guides policy development. Thus, this study delves into the environmental impact assessment of DMs: Natural, Hydro honey, Anaerobic, Lactic, and Carbonic Maceration, an aspect not previously explored in the literature.
The most relevant previous work in environmental impact analyses of coffee production discuss separate processing chains to evaluate GWP. For instance, a study conducted in Vietnam compared “Fine Robusta” or “Robusta Specialty” coffee production, from planting, plant care, and fertilizer to products through natural processes. It revealed a GWP impact of 0.64 kg CO2-eq per kg of green beans (GBs) for organic treatment, and 0.93 kg CO2-eq for non-organic [17]. Chemical fertilizers, especially as a source of N2O, were identified as major contributors to emissions [18]. In another study in Jember, Indonesia, the use of organic fertilizer in full-washed coffee processing resulted in 1.2 kg CO2-eq per kg of Arabica coffee powder (CP) [19]. However, the impact of wastewater contribution was not addressed. Similarly, Gayo Arabica coffee processing using the full-wash method produced a GWP impact of about 1.48 kg CO2-eq [20]. Other studies explored the GWP impact of cherry production per kg of 0.76 kg CO2-eq [21] and 0.26 kg CO2-eq [22]. While most studies focus on specific processing chains for GWP measurement, integrating organic practices into industrial ecology (IE) for SCP proves challenging. The authors previously conducted LCA on coffee roasting, comparing biogas and fossil use, resulting in GWP impacts of 0.68 kg CO2-eq and 0.82 kg CO2-eq per kg coffee roasted (CR), respectively [23].
The aim of this paper is to estimate the environmental impacts of coffee production using a variety of alternative DM processes, using LCA, based on primary measurements and supplemented with secondary data.

2. Materials and Methods

2.1. Study Area and System Boundary

To evaluate the LCA in this study, the authors used data from direct observations and measurements taken at a smallholder coffee farm at the Andungsari Kopi in Bondowoso Regency, East Java province, in 2022. This research was conducted within the Andungsari Bondowoso coffee farming collective, situated in the East Java province of Indonesia. The coffee plantations of 10 ha span across three locations in Pakis Village, ranging in elevation from 1048 to 1400 m above sea level (with coordinates latitude: −7.9231361, longitude: 113.708889). Coffee production in 2022 averaged 580 kg of GBs/ha per year, a decrease compared to 2021. Since 1992, this smallholder coffee farmers‘ group has implemented organic fertilizer use on a 10-ha plantation as a Pilot Plant towards IEC. This study aims to evaluate the changes in GWP and in other impact categories such as stratospheric ozone depletion potential (ODP), ionizing radiation potential (IRP), ozone formation potential, Human health (HOFP), etc., related to the DM to improve coffee quality [24]. First, it compares input, output, and yields, along with gas produced during fermentation across the different DMs. GWP can be obtained quantitatively to evaluate agri-food production systems [25]. In this system, the upstream (on-farm) and downstream (off-farm) processes are studied to clarify the baseline initial conditions in the DMs, and the options for potential GWP mitigation before integration of IEC. The various parameters are then evaluated. The initial system boundaries for the current study are illustrated in Figure 1. Future work will integrate all waste streams to develop a long-term pilot plan for IEC towards SCP (including utilizing by-products for novel food, feed, fertilizer, and fuel). This work adds to academic knowledge in the field by mitigating the environmental impacts of on/off farm for specialty coffee products.

2.2. Coffee Processing through Dry Methods

Smallholders have implemented both wet and dry processing methods to cater to the demands of the local coffee market. However, this paper specifically delves into the DMs, with wet processing discussed elsewhere [26]. This study used a mixture of varieties (Komasti, Andungsari, and Lini S) to compare the different DMs.
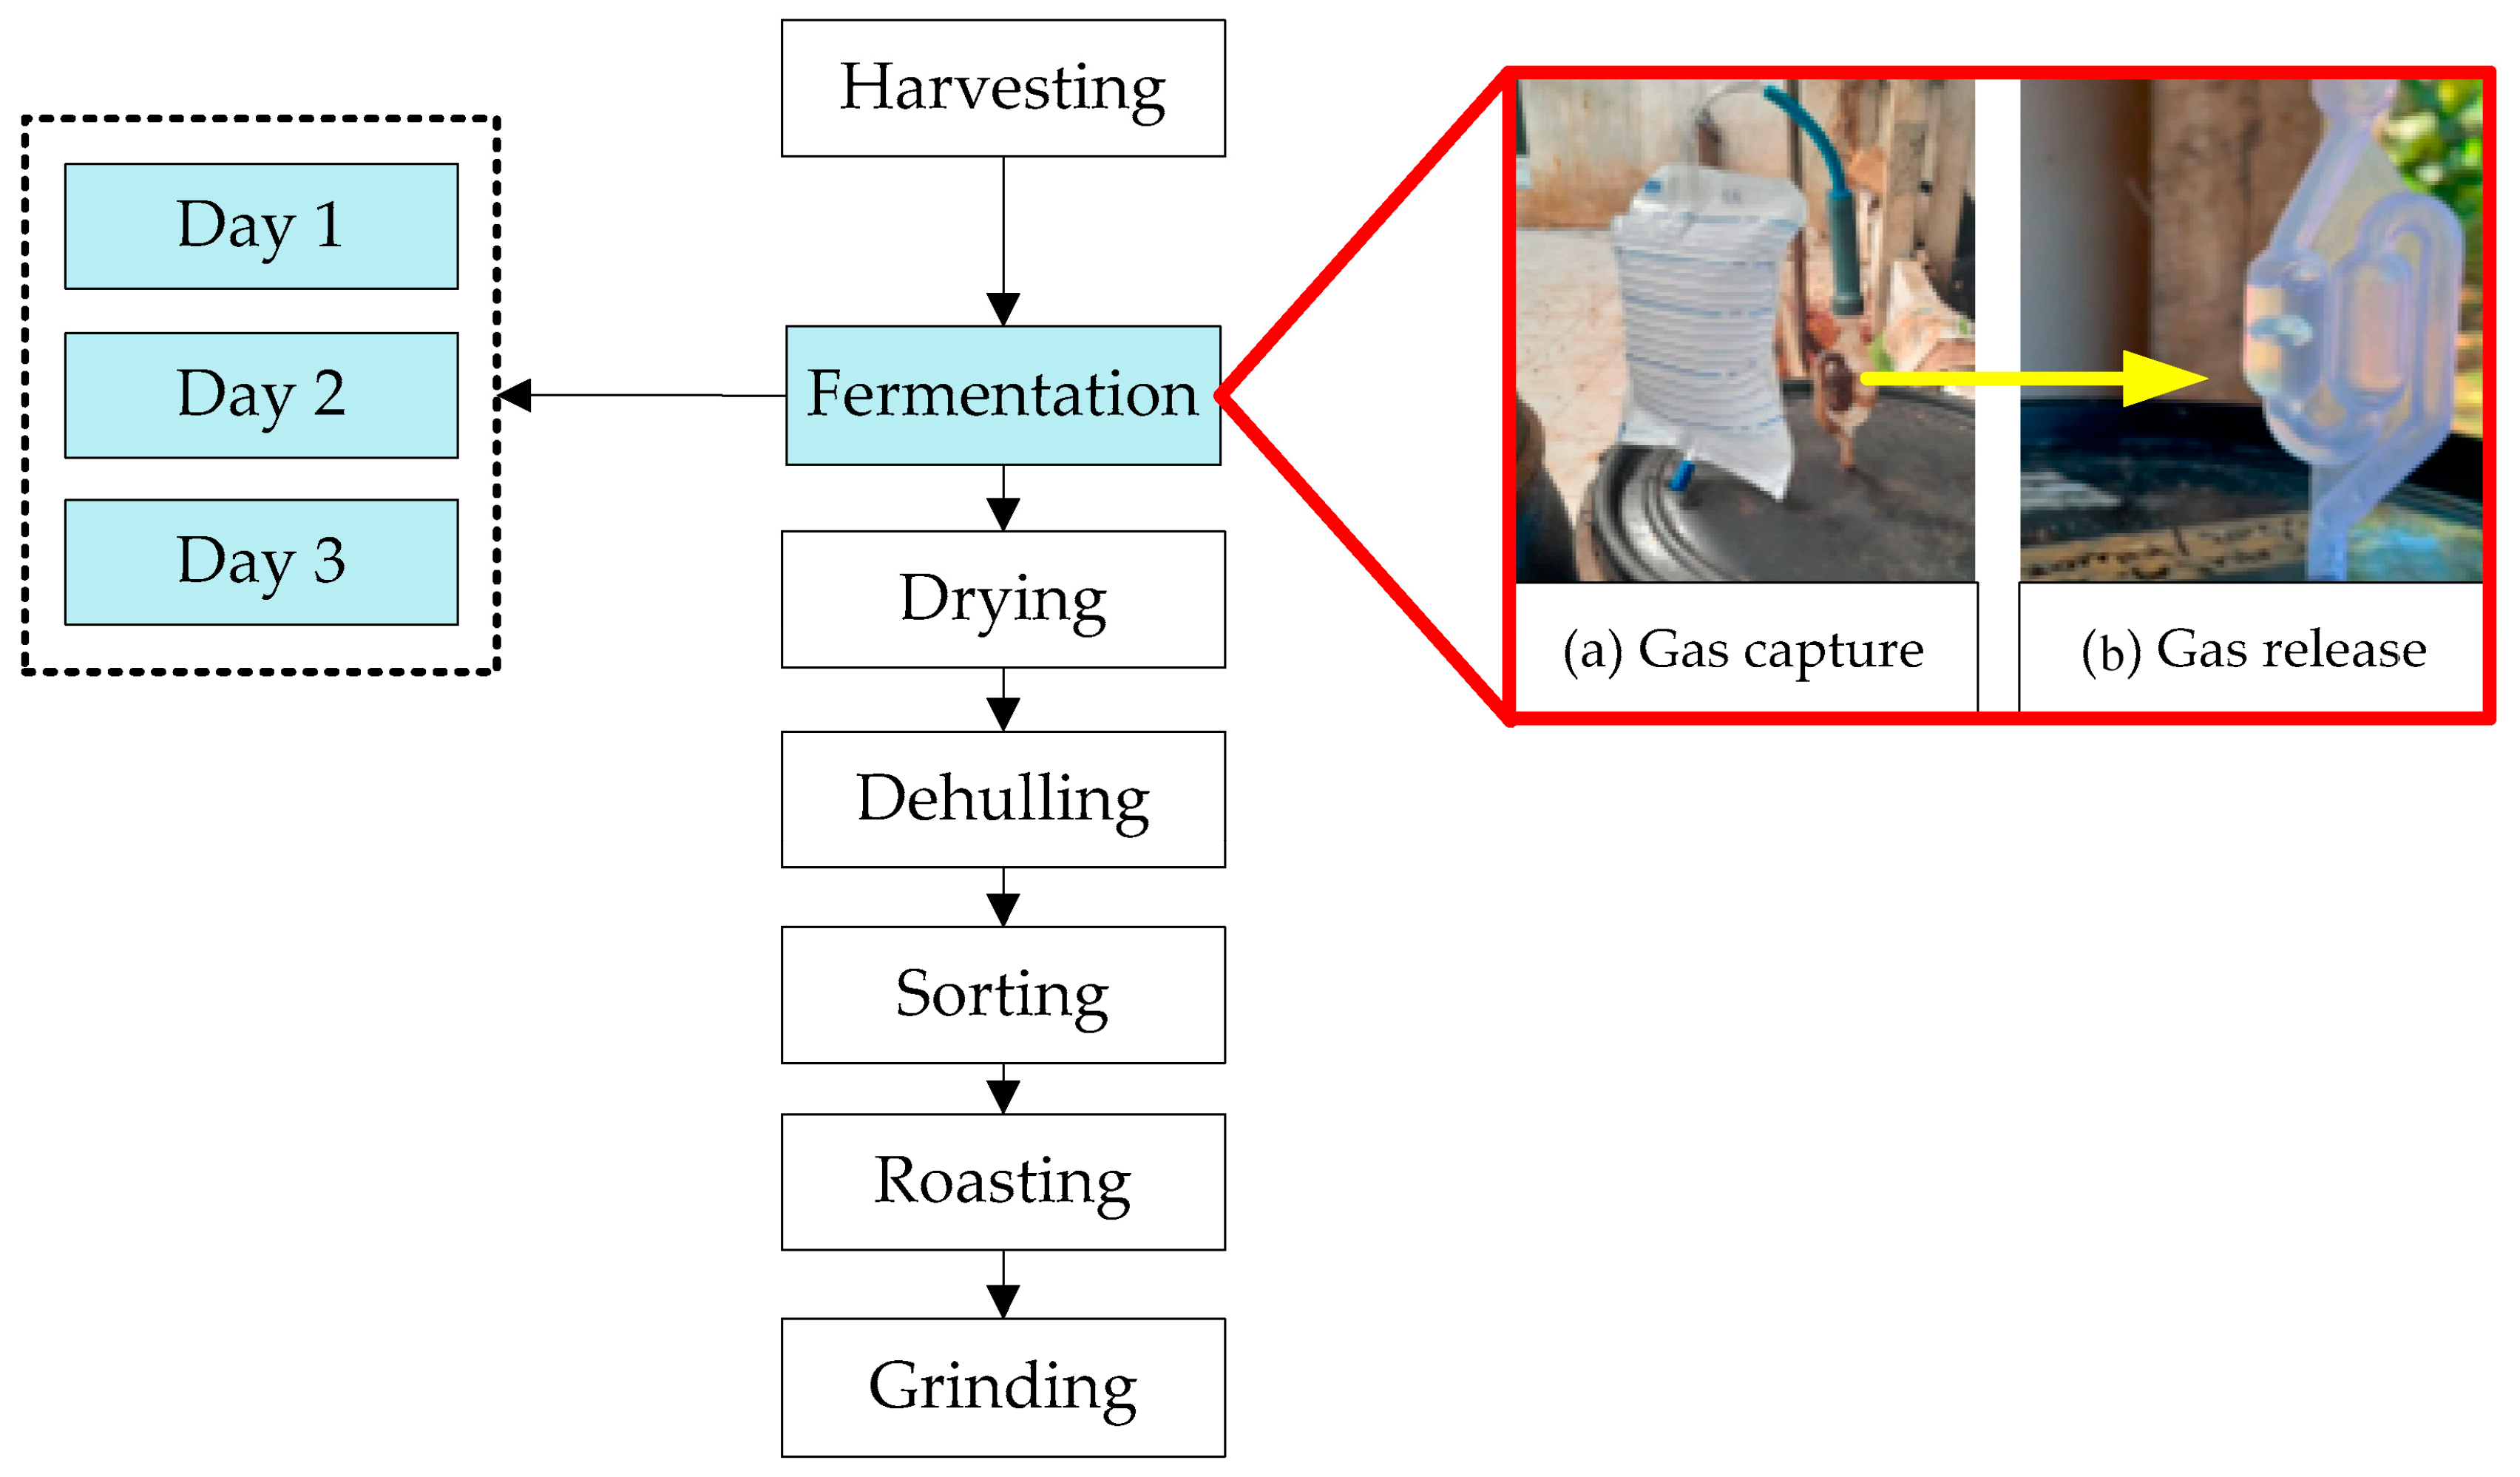
Dry processing methods are often used in countries with arid climates, such as Ethiopia, Brazil, and some parts of Indonesia, providing unique coffee flavors depending on the environmental conditions of the drying location and the coffee variety used [27]. DMs offer the advantage of requiring less water. This paper studies the following DMs: Natural, Hydro honey, Lactic, Anaerobic, and Carbonic Maceration (CM). Figure 2 shows the flowchart of coffee processing using the DMs. Red-picked CBs that were carefully selected during harvest were transported to the production site by a motorcycle over a distance of approximately 3.5 km.
After harvesting, the processing methods differed depending on of the selected processing route. The Natural method did not require fermentation, while the other methods did. The differences in fermentation procedures for each DM are detailed in their respective descriptions.
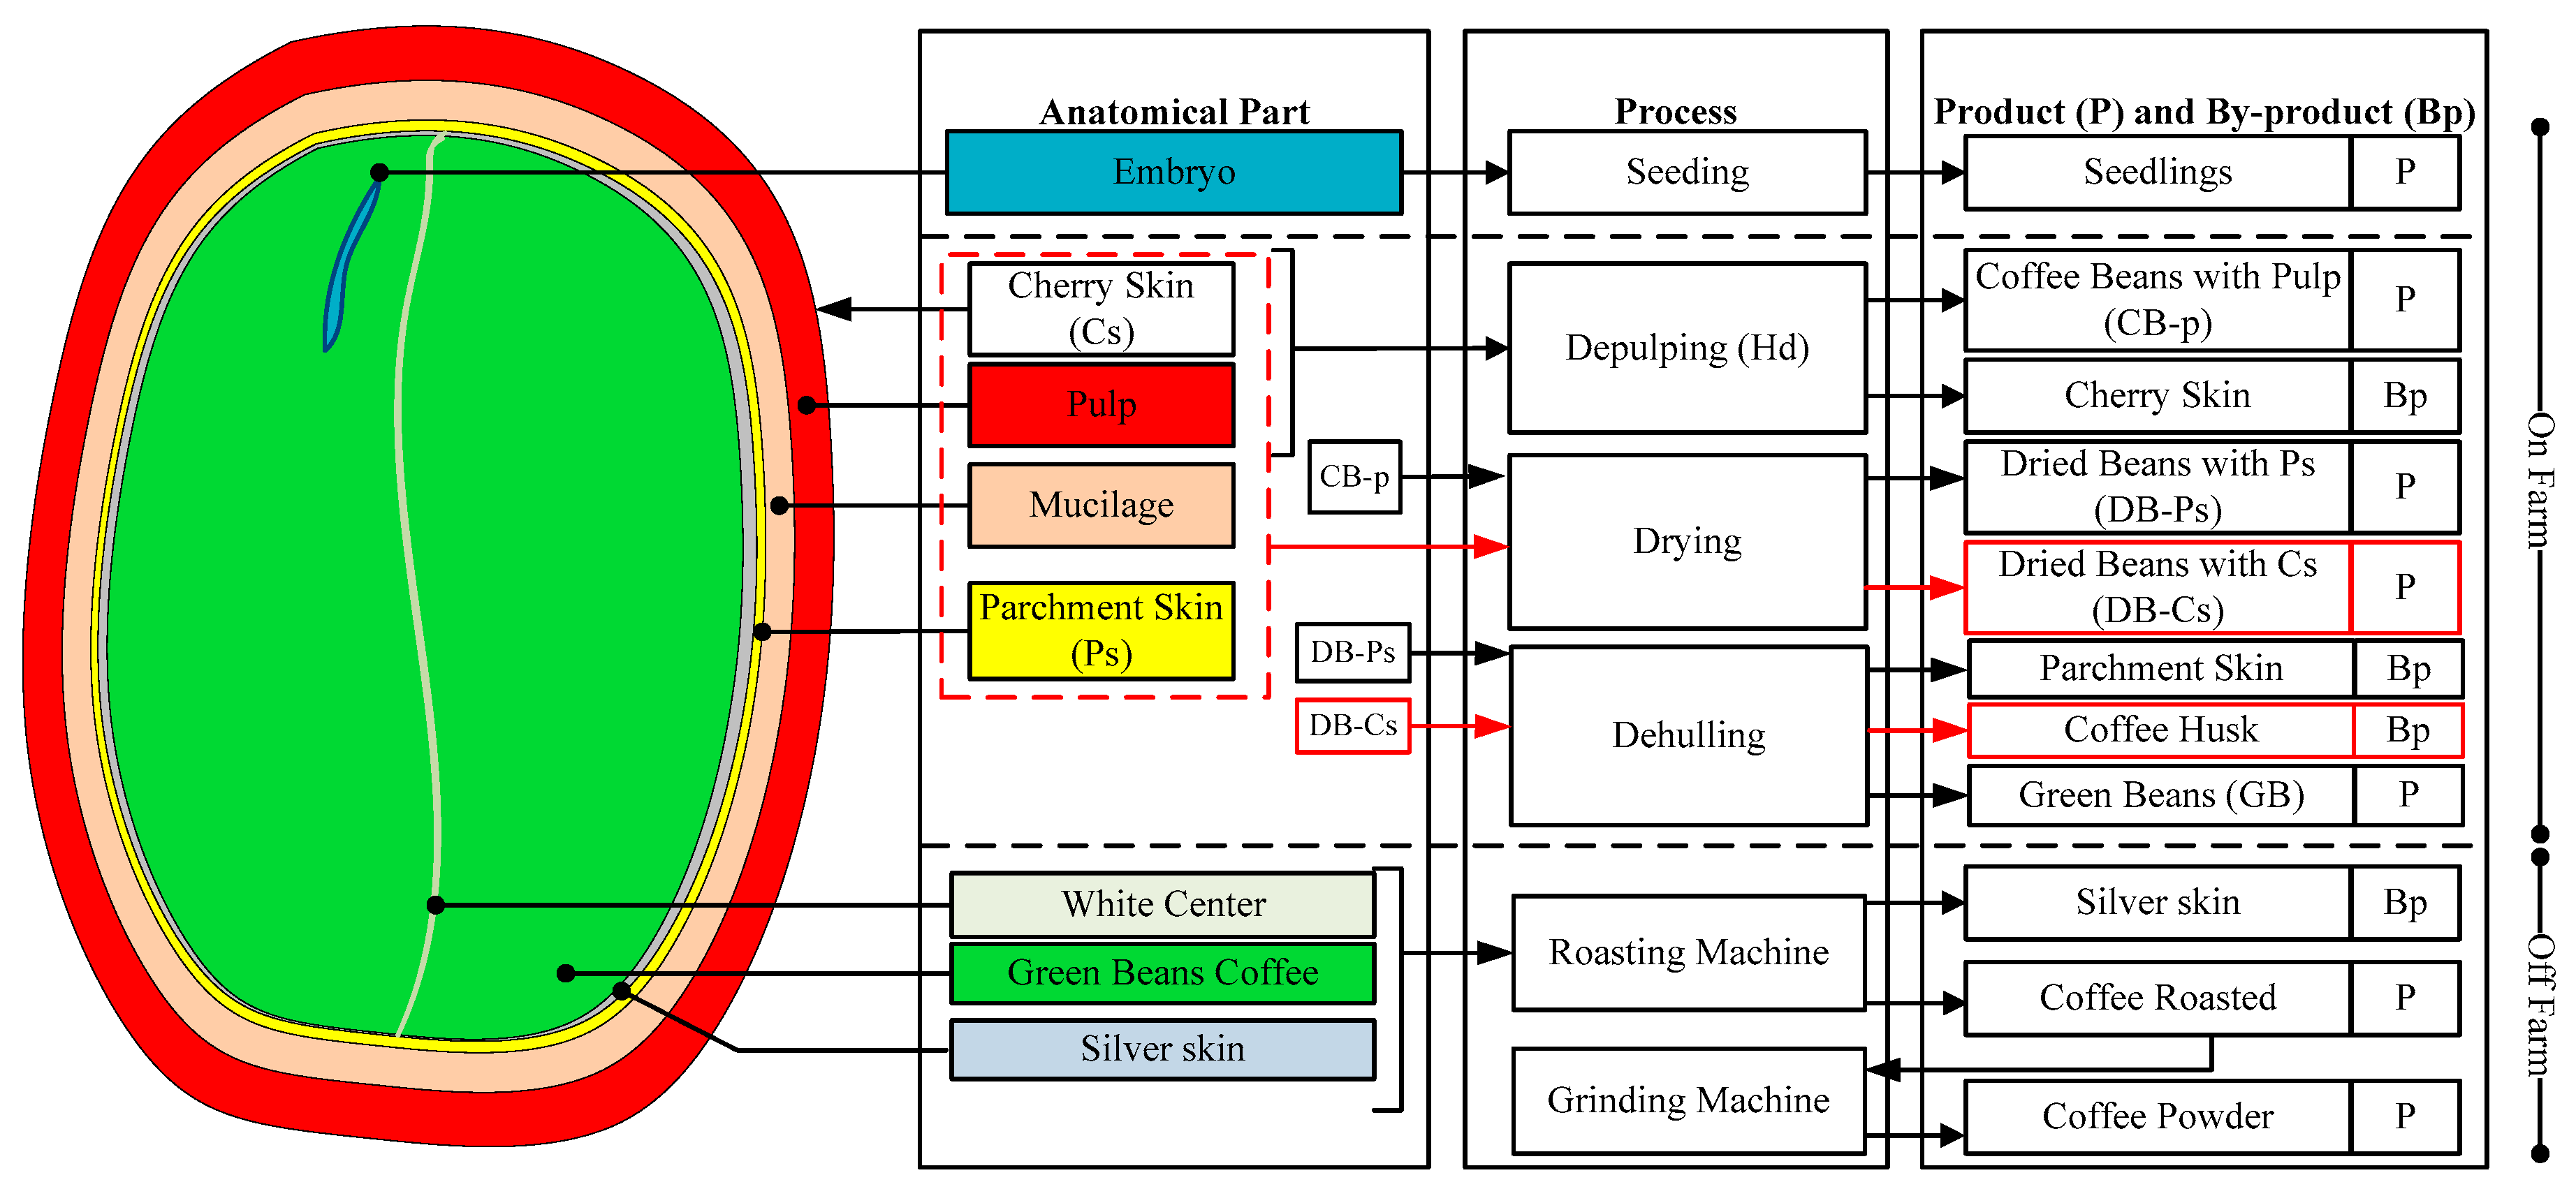
Figure 3 illustrates the anatomy of coffee with detailed processing steps and the corresponding product and by-products. When CBs are picked red, and left unprocessed, they will become coffee seedlings. When the CBs are treated, they first go through on-farm processing. The Hd process differed from the other DMs as it required de-pulping, which involved separation of the cherry skin and pulp (CB-p) from the coffee beans. Afterward, the coffee beans which still had mucilage and parchment skin were dried and dehulled to produce GBs and parchment skin. However, in the case of the other DMs, the CBs were directly dried, and dehulled to produce GBs and coffee husks as by-products. The GBs then went through an off-farm process where they were roasted. From that step, roasted coffee and silver skin were obtained.
In more detail about the processing steps, fermentation was performed in a one-batch process configuration inside full reactor tanks for three days [28] at room temperature, without stirring. A plastic reactor with a CB capacity of 150 kg/batch was used under oxygen-deprived conditions [29]. The reactor had dimensions of 60 cm in diameter and 115 cm in height, with a capacity to hold 150 kg of CBs.
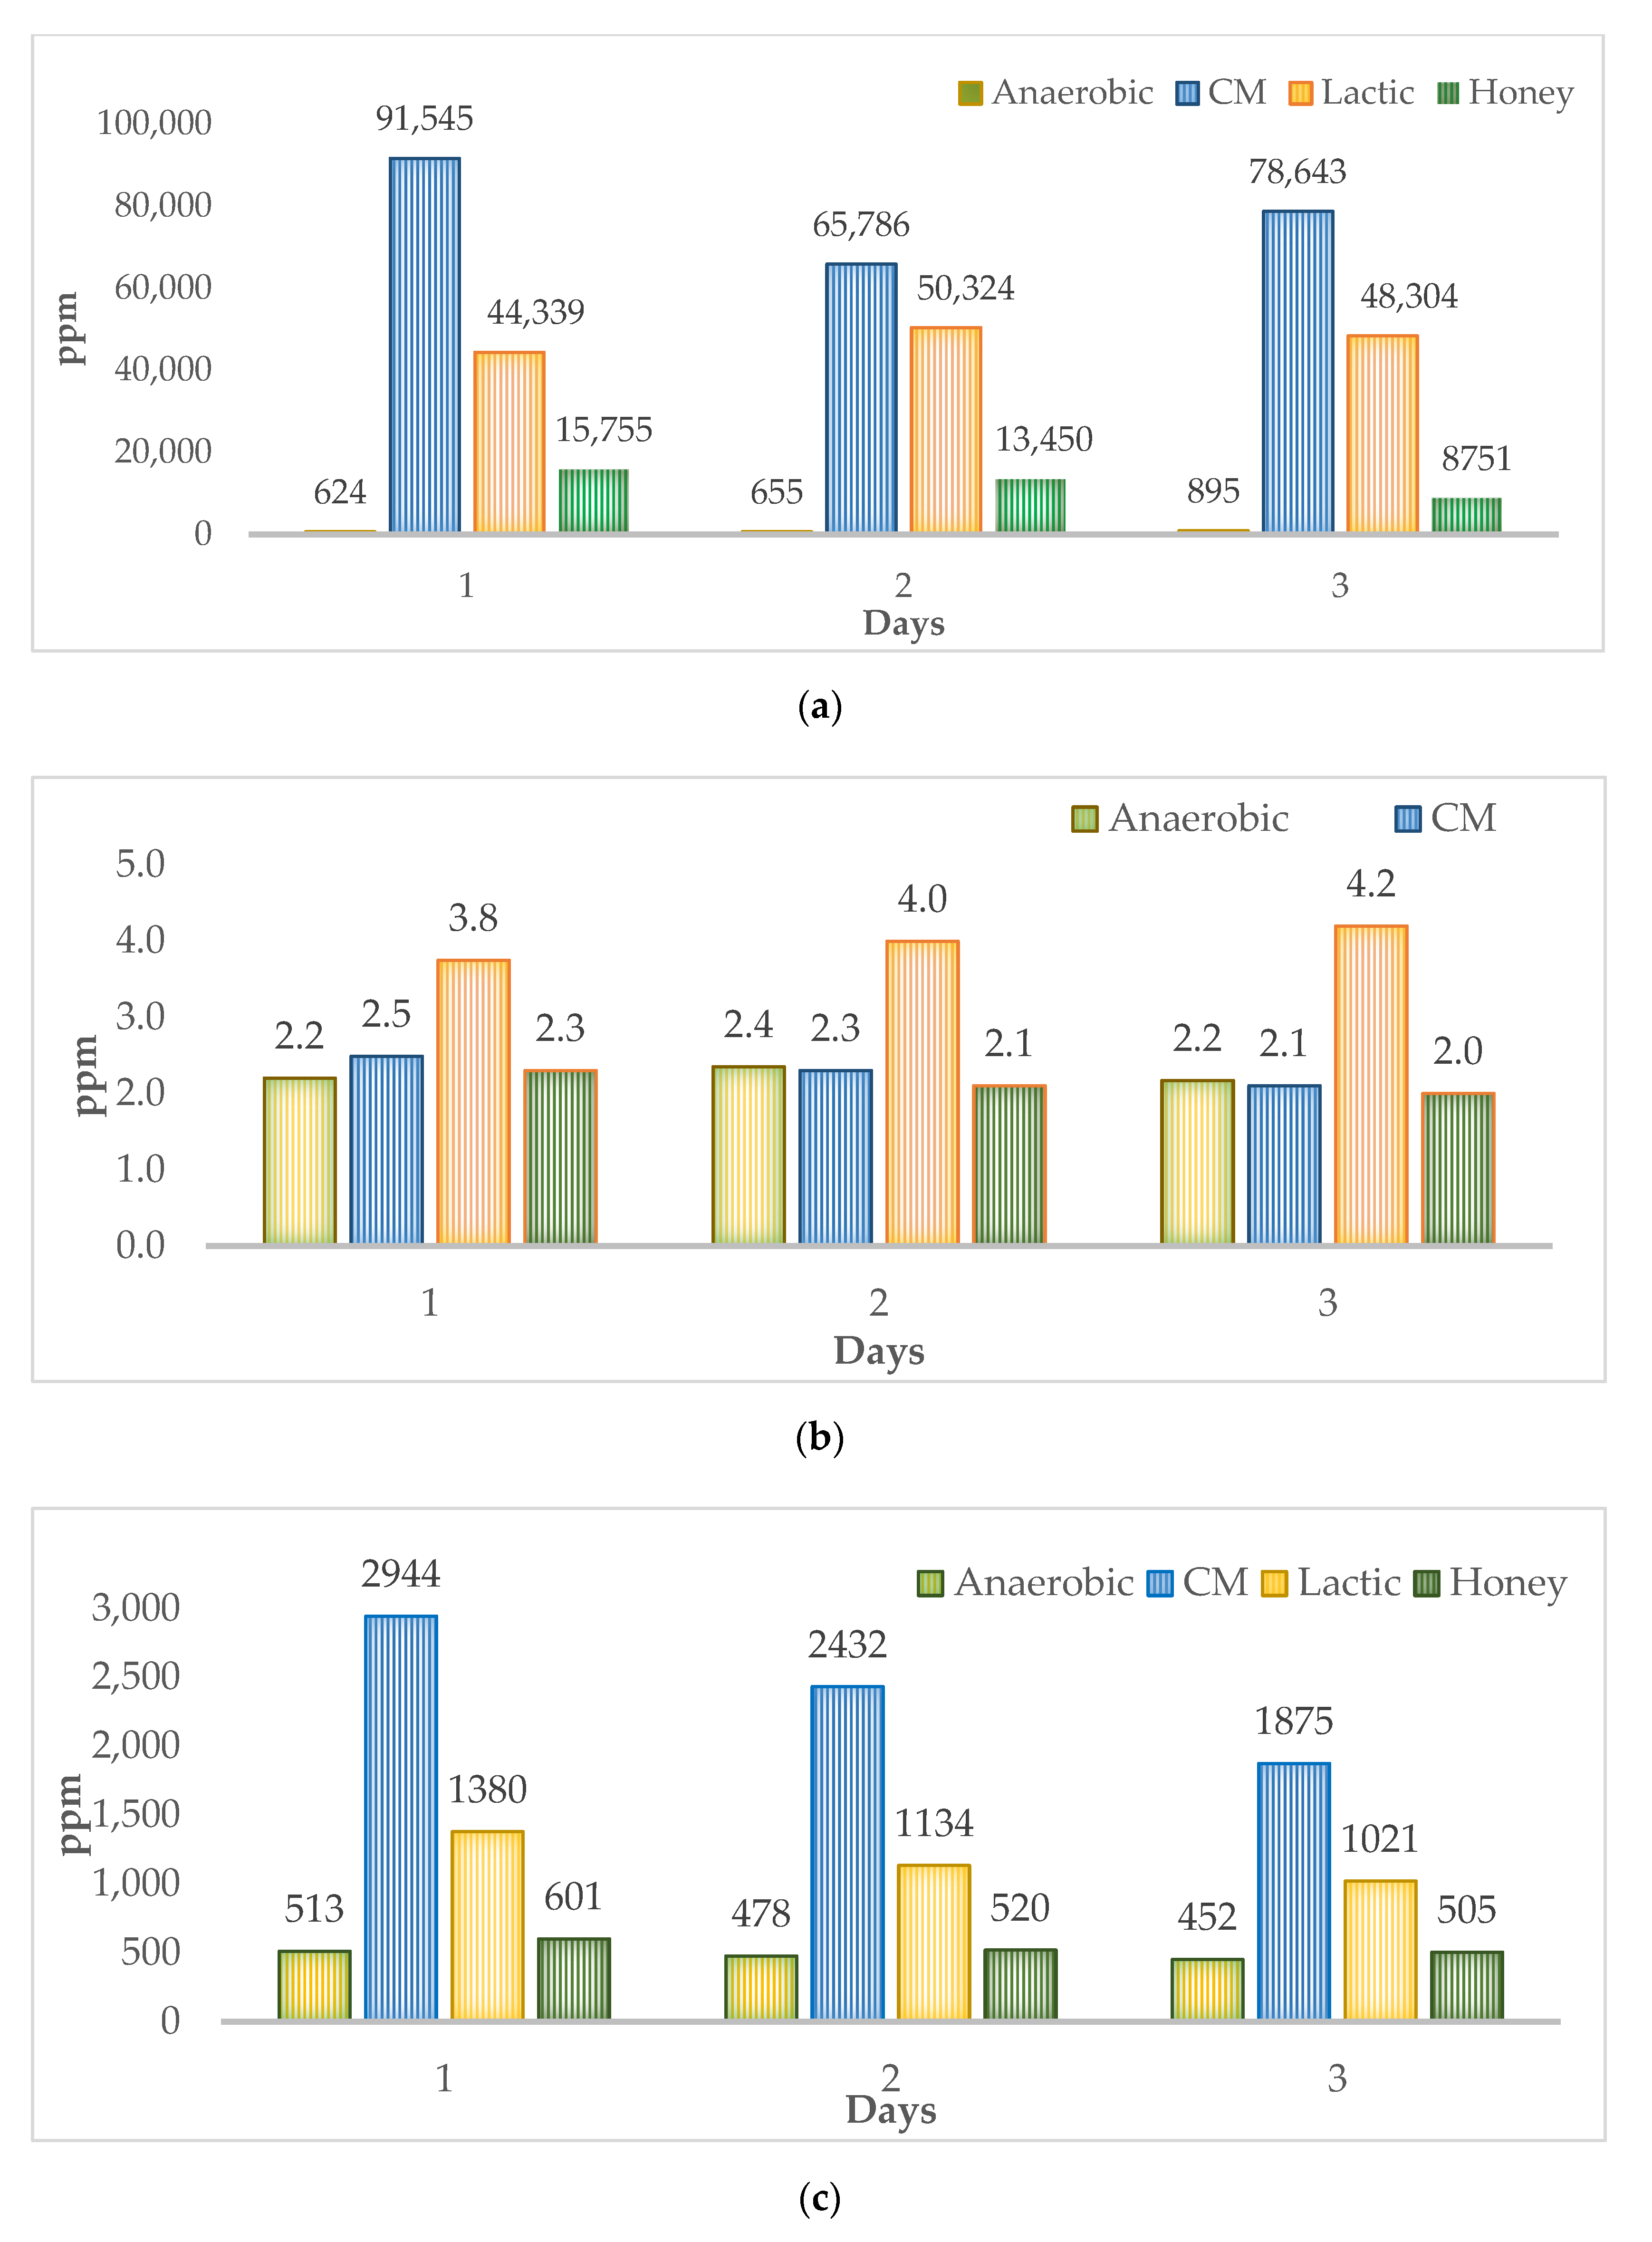
Figure 4 shows the production of gas coming out of the reactor. As additional parameters for the input data in the LCA, we collected the gas during fermentation and tested for the CO2, CH4, and N2O content (Figure 4a). To capture the gas, the plastic sample bag (capacity 2 liters) was replaced every 24 h and sample measurements were carried out daily. For this purpose, we installed an S-shaped airlock (Figure 4b). Results of gas analysis are detailed in Figure 5. Additionally, the total dissolved solid (TDS), total suspended solid (TSS), pH, and Brix were measured in the fermentation wastewater [30].
After fermentation, the CBs went through the drying process. Smallholders rely on sun drying, while larger operations may use mechanical drying [31]. In this case study, the GBs were sun-dried for 9 to 12 days. The drying bed had dimensions of 1 m × 6 m, and a capacity to hold 150 kg cherries in layers between 2 and 4 cm thick. The target moisture content was 12%, which is within the standard target range between 11 to 14% [28,32].
Then, on-farm DMs continued with the dehulling stage to separate the husk skin or parchment skin, followed by sorting to ensure good quality GBs. Defects in the coffee beans were manually sorted to remove cracked beans, black beans, beans with holes, and others [33]. Cracks can be caused by technology or raw materials [34], and optical detection technology is one option for sorting defective coffee [35], although not employed here.
Next, the beans were roasted using a rotary roaster with heating from an LPG burner for 10–12 min to reach a medium roasting temperature between 205 and 210 °C. This roasting machine had a vacuum blower to separate the silver skin and the CR [23]. Finally, the coffee was ground to a coffee powder state, ready to produce coffee drinks at the off-farm stage.
Two types of products are described based on on/off farm processing. On-farm processing transforms the CBs to the GBs, while the processing from the GBs to coffee powder (CP) is off-farm. Coffee with high grades is scored above 80, classified as specialty coffee quality.
The explanation of the main differences between the five processes are as follows.

2.2.1. Natural Processing

Natural processing is the most traditional processing method, and technology is applied to off-farm processes more than on-farm. After harvesting, the CB was directly sundried for 9–12 days as described earlier and went through the on-farm and off-farm processing.

2.2.2. Hydro Honey Processing

The Hydro honey method is intended to increase market demand for the honey aroma [36]. The honey color emerges as a result of the pulp being retained within a parchment layer until dried. Sharp aromas such as wine, fruity, and brown sugar can emerge from fermentation. However, this method may not be widely used because the market segment is limited and therefore it is applied only for specialty products. In this process, pulping was performed before fermentation to separate the cherry skin from the coffee beans. The beans were then dried, and the coffee pulp was fermented and dried. The dried coffee beans with parchment skin were further dehulled to obtain GBs, which then went through sorting, roasting, and grinding to obtain CP.

2.2.3. Lactic Processing

Lactic processing is used to create a robust sour aroma by adding bacteria [37]. During fermentation, the mucilage in CBs can increase in acidity [8], the expected flavors are fruit, berry, chocolate, and complex flavors [24]. Lactate processing is not the main objective of commercial processors because it requires additional ingredients [38], which may impact wastewater, a risk to the soil and water [39]. In this case study, 2 kg of lactic acid bacteria from a local company in Bondowoso was added to the reactor before fermentation. After fermentation, on- and off-farm steps were performed to obtain CP.

2.2.4. Anaerobic Processing

Coffee processors often utilize this processing model because it is straightforward and frequently preferred. The CBs only need to be fermented with reduced oxygen [40] with the full tank of CBs inside a reactor. In this study, water or other inoculants, such as microorganisms or enzymes (spontaneous fermentation), were not added to the process. After fermentation, the CBs were dried, sorted, roasted, and ground to CP.

2.2.5. Carbonic Maceration (CM)

During the CM process, 1.5 kg of CO2 purchased from a gas company in Bondowoso gas was injected into the reactor tank [41]. The CO2 injection aims to reduce the sour taste of coffee and decrease its caffeine content. This method requires pressure control during processing, as reactor leaks can result in the failed production of flavors [12]. A gas pressure indicator was used during fermentation to maintain a stable pressure of 50–100 millibars. While some processors inject CO2 daily until the end of fermentation, in this study, it was performed only once on the first day of fermentation.

2.3. Environmental Impact Analysis

For impact analysis, this work used SimaPro v9.3.0.3, and the ReCiPe 2016 midpoint level (ML) method was applied [23,42]. Through direct observation, coffee production and fuel consumption data were obtained and used for LCA. The study considered contributions of ≥1%, outlining the sources from each stage of the process, in accordance with typical cut-off requirements [43]. The following steps were then performed to complete the LCA.

2.3.1. Goal and Scope

In this study, we have meticulously collected and analyzed harvest data from 2022. The average yield per hectare reached 2950 kg/ha/year of cherry beans, resulting in an average of 580 kg/ha/year of GBs. For dry processing, this group uses a 150 kg/batch capacity reactor for fermentation. The DM was chosen as the harvest capacity increased and in response to market demand. The functional unit (FU) is based on a 10-hectare pilot plant. Results were reported on the impacts per kilogram of CP. The GWP from the DMs was calculated and compared as the primary indicator. Production and processing data were used to model and design alternatives for the pilot-scale implementation of sustainable specialty coffee bean production.

2.3.2. Inventory Analysis

The harvest data inventory for the year 2022 was conducted through observation and experimentation in the Andungsari Coffee Group, Bondowoso, East Java, Indonesia. Harvest data from March to September were utilized. The average number of coffee plantations and coffee shade is the same as in the previous year’s study [26]. However, this research focused on dry processing, considering CB transportation handling, fermentation, dehulling, roasting, and grinding. Fuel consumption during coffee processing was measured as part of the inventory process. Table 1 displays petrol, LPG, and electricity consumption at each stage.

2.3.3. Impact Assessment

Based on primary data on coffee production inputs and outputs, and with the application of emission factors [44], factor correction (Table 2), and secondary data for impact analysis, the data inventory was compiled and used for impact assessment in the SimaPro software. The ReCiPe (2016) ML method was applied. Fuel consumption was calculated with characteristic factors. Furthermore, fermentation was carried out for dry processing, during which fermentation gas products such as CO2, CH4, and N2O were captured. Gas captured during fermentation was stored in plastic gas storage and tested at the Agricultural Laboratory, Pati Agricultural Laboratory Centre, Central Java, Indonesia. Fermentation was carried out for three days, and every day, the gas was collected to assess gas production for impact analysis considerations. Wastewater from fermentation was also tested for chemical oxygen demand (COD) and biological oxygen demand (BOD), TSS, and pH at the Agricultural Technology Laboratory, Jember University. While many other studies do not consider wastewater in their impact assessments, this work found a significant impact of biogenic CO2 from wastewater with the following correction factors in Table 2.
Emissions from wastewater were calculated via the following equation [44]:
CO2 = 10−6 × Qww × COD × EffBOD × CFCO × [(1 − MCFww × BG) × (1 − λ)]
Therefore:
  • CO2 = Estimated CO2 emission rate (mg/batch)
  • Qww = Wastewater produced (mg/batch)
  • EffBOD = Oxygen demand removal efficiency
  • CFCO = Conversion factor for maximum CO2
  • MCFww = Correction factor wastewater treatment
  • BG = Fraction of carbon
  • λ = Biomass yield

2.3.4. Interpretation

In this phase, we compared five processes: Natural, Hd, Anaerobic, Lactic, and CM. The fermentation stage contributes to wastewater and gas. Although the fermentation stage is categorized as biogenic waste [45], the threshold for wastewater needs to be considered [46]. Therefore, as a part of coffee production, dry processing methods need to identify their environmental impact. Through this study, we also consider the valorization of waste skin that can be utilized to add value to waste as a by-product and potential step towards zero waste [26].

3. Results

3.1. Comparison of Input-Output and Yields from the Different Dry Processing Methods

Yields from various DM processing methods are important for input-output in the LCA data inventory. The mass balance is used for the GWP analysis of each of the treatment stages. Table 3 shows the mass balance of the dry method with the different coffee processing. In terms of input, Hd differs from the other DMs because 50 L of water were added during fermentation.
In terms of efficiency and by-products, the Natural method appears to be efficient with high yields of dried beans (67.5 kg) and fewer process steps involving less water and chemicals. It produces a significant amount of coffee husk (39.8 kg) during dehulling.
The Hd method involves significant water use during fermentation, producing considerable wastewater (47.0 kg). It has the lowest output of dried beans (34.4 kg) but results in a substantial amount of de-pulped coffee (70.2 kg) and cherry skin (79.8 kg).
The Anaerobic and Lactic methods are similar in outputs, producing high amounts of wet fermented coffee (137.5 kg and 136.5 kg, respectively) and significant amounts of coffee husk (40.1 kg and 40.4 kg). The Lactic method uses lactic acid bacteria, introducing an additional biological component, which may explain the fact that wastewater from the Lactic method (15.5 kg) is higher than that from the Anaerobic method (12.5 kg).
CM involves CO2 and has a slightly higher output of grade beans (28.0 kg) and roasted beans (22.9 kg) compared to others. It generates the least defective beans (0.8 kg) and the highest yield of dried beans (69.0 kg), making it efficient but slightly more complex due to the use of CO2. Overall, the outputs for the studied DMs differed up until the drying step due to variations in fermentation conditions and inputs across the different DM processes. However, after drying and sorting, the outputs of final CP were similar across all methods, ranging between 22.4 and 22.8 kg.

3.2. Coffee Fermentation, Gas Release, and Wastewater

Quantifying gas release during fermentation is essential to evaluate the environmental impact of the processes. The natural processing method, which does not involve fermentation, is not included in this section. Table 4 shows the total gas produced during three days of fermentation for the different coffee processing methods that required fermentation, focusing on CO2, CH4, and N2O emissions. The Anaerobic method produced the least CO2 at 8.6 mg, while the Hd, Lactic, and CM methods produced 150.3 mg, 566.2 mg, and 934.5 mg of CO2, respectively.
Methane emissions were fairly consistent among the methods, except for Lactic, which emitted 0.0155 mg. For the other DMs, Anaerobic released 0.0087 mg, Hd emitted 0.0083 mg, and CM emitted 0.0090 mg. In contrast, nitrous oxide emissions varied more significantly. Anaerobic emitted 5.7 mg, Hd emitted 6.4 mg, Lactic emitted 13.9 mg, and CM emitted 28.6 mg.
To undertake the LCA, the gas concentrations were converted to mass of emissions. To achieve this, the gas pressure was assumed to be atmospheric pressure (unfortunately the gas pressure was not measured in all processes for this specific experiment, but the pressure of CM was taken as indicative, with a range of 50–100 mbar (gauge), and it was therefore estimated to be a reasonable assumption). In terms of environmental impact, the CM method has the highest emissions of both CO2 and N2O, indicating a considerable environmental impact. The Lactic method also shows high emissions, particularly of CO2 and N2O. The Hd method produces moderate CO2 and N2O emissions with low CH4 emissions. The Anaerobic method is the most environmentally friendly, with the lowest levels of all gases.
In more detail, Figure 5 illustrates the release of (a) CO2, (b) CH4, and (c) N2O gases during fermentation across different coffee processing methods: Anaerobic, Hd, Lactic, and Carbonic Maceration (CM).
In the (a) CO2 graph, the CM method exhibits the highest emissions, followed by the Lactic method, the Hd, and the Anaerobic method. This indicates that CM and Lactic methods, which were more intensive in terms of fermentation, resulted in significantly higher CO2 emissions. The Anaerobic method, with the lowest CO2 emissions, suggests a more controlled and less oxidative fermentation process.
For (b) CH4 emissions, the differences among the methods were less pronounced compared to CO2. The Lactic method shows slightly higher CH4 emissions than the other methods, while the Hd and CM methods had similar lower levels, and the Anaerobic method was slightly higher than Hd and CM but lower than Lactic. This suggests that methane production is not as heavily influenced by the type of fermentation process as CO2.
In the N2O graph (c), the CM method again showed the highest emissions, followed by the Lactic, Hd, and Anaerobic methods. This pattern highlights the intensive nature of CM and Lactic fermentations, which produced significantly more nitrous oxide. The relatively low N2O emissions from the Anaerobic method further reinforce its environmental advantages.
Table 5 compares the properties of wastewater produced during the fermentation stage of different dry coffee processing methods: Anaerobic, CM, Lactic, and Hd. The Lactic method produces wastewater with the highest levels of COD, BOD, TSS, and TDS, indicating significant environmental impact due to the high organic load and particulate matter. It also produces high Brix, which may indicate the wastage of valuable components, such as liquid fertilizer, while its low pH further suggests a more acidic wastewater, which can be harmful to aquatic life. In all cases, it would be expected that the wastewater would need further appropriate treatment before any release or, as highlighted below, may offer potential for biogas production.
The CM method, while slightly better than Lactic in terms of COD and BOD, still produces high levels of organic pollutants and suspended solids, dissolve solid and also results in acidic wastewater. The Anaerobic method shows moderate levels of COD, BOD, and TSS, with a slightly acidic pH. This suggests a relatively lower environmental impact compared to the CM and Lactic methods, even though TDS was slightly higher than Hd.
The Hd method has the lowest levels of COD, BOD, TSS, and TDS, and the highest pH, making it the most environmentally friendly option among the methods studied. Its wastewater is less polluted with organic matter and particulates and is less acidic, posing a lower risk to the environment.
Overall, the Hd method has the lowest levels of COD, BOD, TSS, TDS, and Brix, and the highest pH, making it the most environmentally friendly option among the DMs involving fermentation. Its wastewater is less polluted with organic matter and particulates and is less acidic, posing a lower risk to the environment.

3.3. Life Cyle Impact Characterization

Overall, the Hd method has the lowest levels of COD, BOD, and TSS, and the highest pH, making it the most environmentally friendly option among the DMs involving fermentation. Its wastewater is less polluted with organic matter and particulates and is less acidic, posing a lower risk to the environment.
Table 6 provides a comparative analysis of the environmental impact categories for different dry coffee processing methods, from CBs to CP. The methods assessed are Natural, Anaerobic, Lactic, Hd, and CM. Each method’s impact is measured across several categories, including GWP, ODP, and other key environmental indicators. (Values are indicated per kilogram of CP).

3.3.1. Global Warming Potential (GWP)

The GWP measures the potential of greenhouse gases to trap heat in the atmosphere. The Lactic method has the highest GWP at 1.168 kg CO2-eq, indicating a significant contribution to climate change. The Natural method has the lowest GWP at 0.676 kg CO2-eq, making it the most climate-friendly option.

3.3.2. Stratospheric Ozone Depletion Potential (ODP)

ODP indicates the potential for substances to deplete the ozone layer. The Lactic method shows the highest ODP at 3.34 × 10⁻⁷ kg CFC11eq, while the Natural method has the lowest ODP at 2.1 × 10⁻⁷ kg CFC11eq. The differences among the methods are relatively small but still noteworthy.

3.3.3. Ionizing Radiation Potential (IRP)

IRP measures the potential impact of ionizing radiation on human health and the environment. The Lactic method has the highest IRP at 0.027 kBq Co−60eq, whereas the Natural, Anaerobic, and Hd methods all have an IRP of 0.008 kBq Co−60eq, showing less impact.

3.3.4. Ozone Formation, Human Health (HOFP) and Terrestrial Ecosystems (EOFP)

Both HOFP and EOFP assess the potential of precursor emissions to form ground-level ozone, which affects human health and ecosystems. The Lactic and Hd methods have higher values (0.002 kg NOxeq) for HOFP and EOFP compared to Natural and Anaerobic methods, indicating more significant impacts on human health and terrestrial ecosystems.

3.3.5. Fine Particulate Matter Formation (FPMF)

FPMF measures the impact of fine particulate matter on air quality and human health. The Lactic method shows the highest FPMF at 0.002 kg PM2.5eq, while other methods are at 0.001 kg PM2.5eq, indicating less pollution.

3.3.6. Terrestrial Acidification Potential (TAP)

TAP evaluates the potential of acidifying pollutants to affect soil and water bodies. The Lactic method has the highest TAP at 0.002 kg SO2eq, while other methods have a TAP of 0.001 kg SO2eq, indicating a lower impact.

3.3.7. Eutrophication Potentials (FEP and MEP)

Eutrophication potentials assess nutrient enrichment in freshwater (FEP) and marine environments (MEP). The Lactic method has the highest FEP (5.3 × 10⁻⁴ kg Peq) and MEP (1.9 × 10⁻⁵ kg Neq), suggesting significant contributions to water pollution.

3.3.8. Ecotoxicity Potentials (TETP, FETP, METP)

Ecotoxicity potentials measure the impact of toxic substances on terrestrial (TETP), freshwater (FETP), and marine environments (METP). The Lactic method exhibits the highest values in all three categories, indicating greater potential for environmental harm.

3.3.9. Human Toxicity Potentials (HTPc and HTPnc)

Human toxicity potentials evaluate the potential impact of toxic substances on human health, both carcinogenic (HTPc) and non-carcinogenic (HTPnc). The Lactic method again shows the highest impacts, particularly for HTPnc at 0.562 kg 1,4-DCB.

3.3.10. Land Use (LOP)

LOP measures the potential impact on land use. The Lactic method has the highest LOP at 0.014 m2 a crop eq, indicating a higher impact on land resources.

3.3.11. Mineral and Fossil Resource Scarcity (SOP and FFP)

SOP assesses the scarcity of mineral resources, and FFP measures fossil resource depletion. The Lactic method has the highest SOP (5.6 × 10⁻⁴ kg Cueq) and FFP (0.344 kg oileq), showing greater resource consumption.

3.3.12. Water Consumption Potential (WCP)

WCP evaluates the amount of water used in the process. The Lactic method has the highest water consumption at 0.0063 m3, indicating a significant use of water resources.
Altogether, the Lactic method consistently showed higher environmental impacts across almost all categories, indicating that it is the least sustainable option among the methods assessed. Its high values in GWP, ODP, and other categories highlight significant contributions to climate change, ozone depletion, and resource depletion. In contrast, the Natural method generally shows the lowest impacts, making it the most environmentally friendly option. The Anaerobic and CM methods fall in between, with moderate impacts across most categories.
Figure 6 shows the impact categories in percentage of the highest impact. It confirms that Lactic contributes with the highest impact in all categories. Aside from the Lactic method, the other dry coffee processing methods—Natural, Anaerobic, Hd, and CM—show varying degrees of environmental impact across different categories. Comparatively, the Natural method consistently presents the lowest values across many environmental impact categories. This suggests that the Natural method has the least environmental impact among the dry coffee processing methods assessed. For example, in categories like GWP, HOFP, and EOFP, the Natural method typically exhibits the lowest values, indicating lower emissions of greenhouse gases and reduced potential for ground-level ozone formation compared to other methods.
The Anaerobic and CM methods generally fall in between the Natural and Lactic methods, displaying moderate environmental impacts across most categories. While they may not have as low an environmental impact as the Natural method, they also do not exhibit the consistently high values seen with the Lactic method. The Hd method often shows values closer to the Natural method, indicating relatively lower environmental impacts compared to Lactic, Anaerobic, and CM methods, but not as low as the Natural method.
These findings suggest that while the Lactic method tends to have the highest environmental impact among the dry coffee processing methods assessed, the Natural method tends to be the lowest impact, while the other methods—Anaerobic, Hd, and CM—offer varying degrees of environmental friendliness. Producers can use this information to make informed decisions about which processing methods to adopt, considering factors such as environmental sustainability, flavor profile, and processing efficiency.
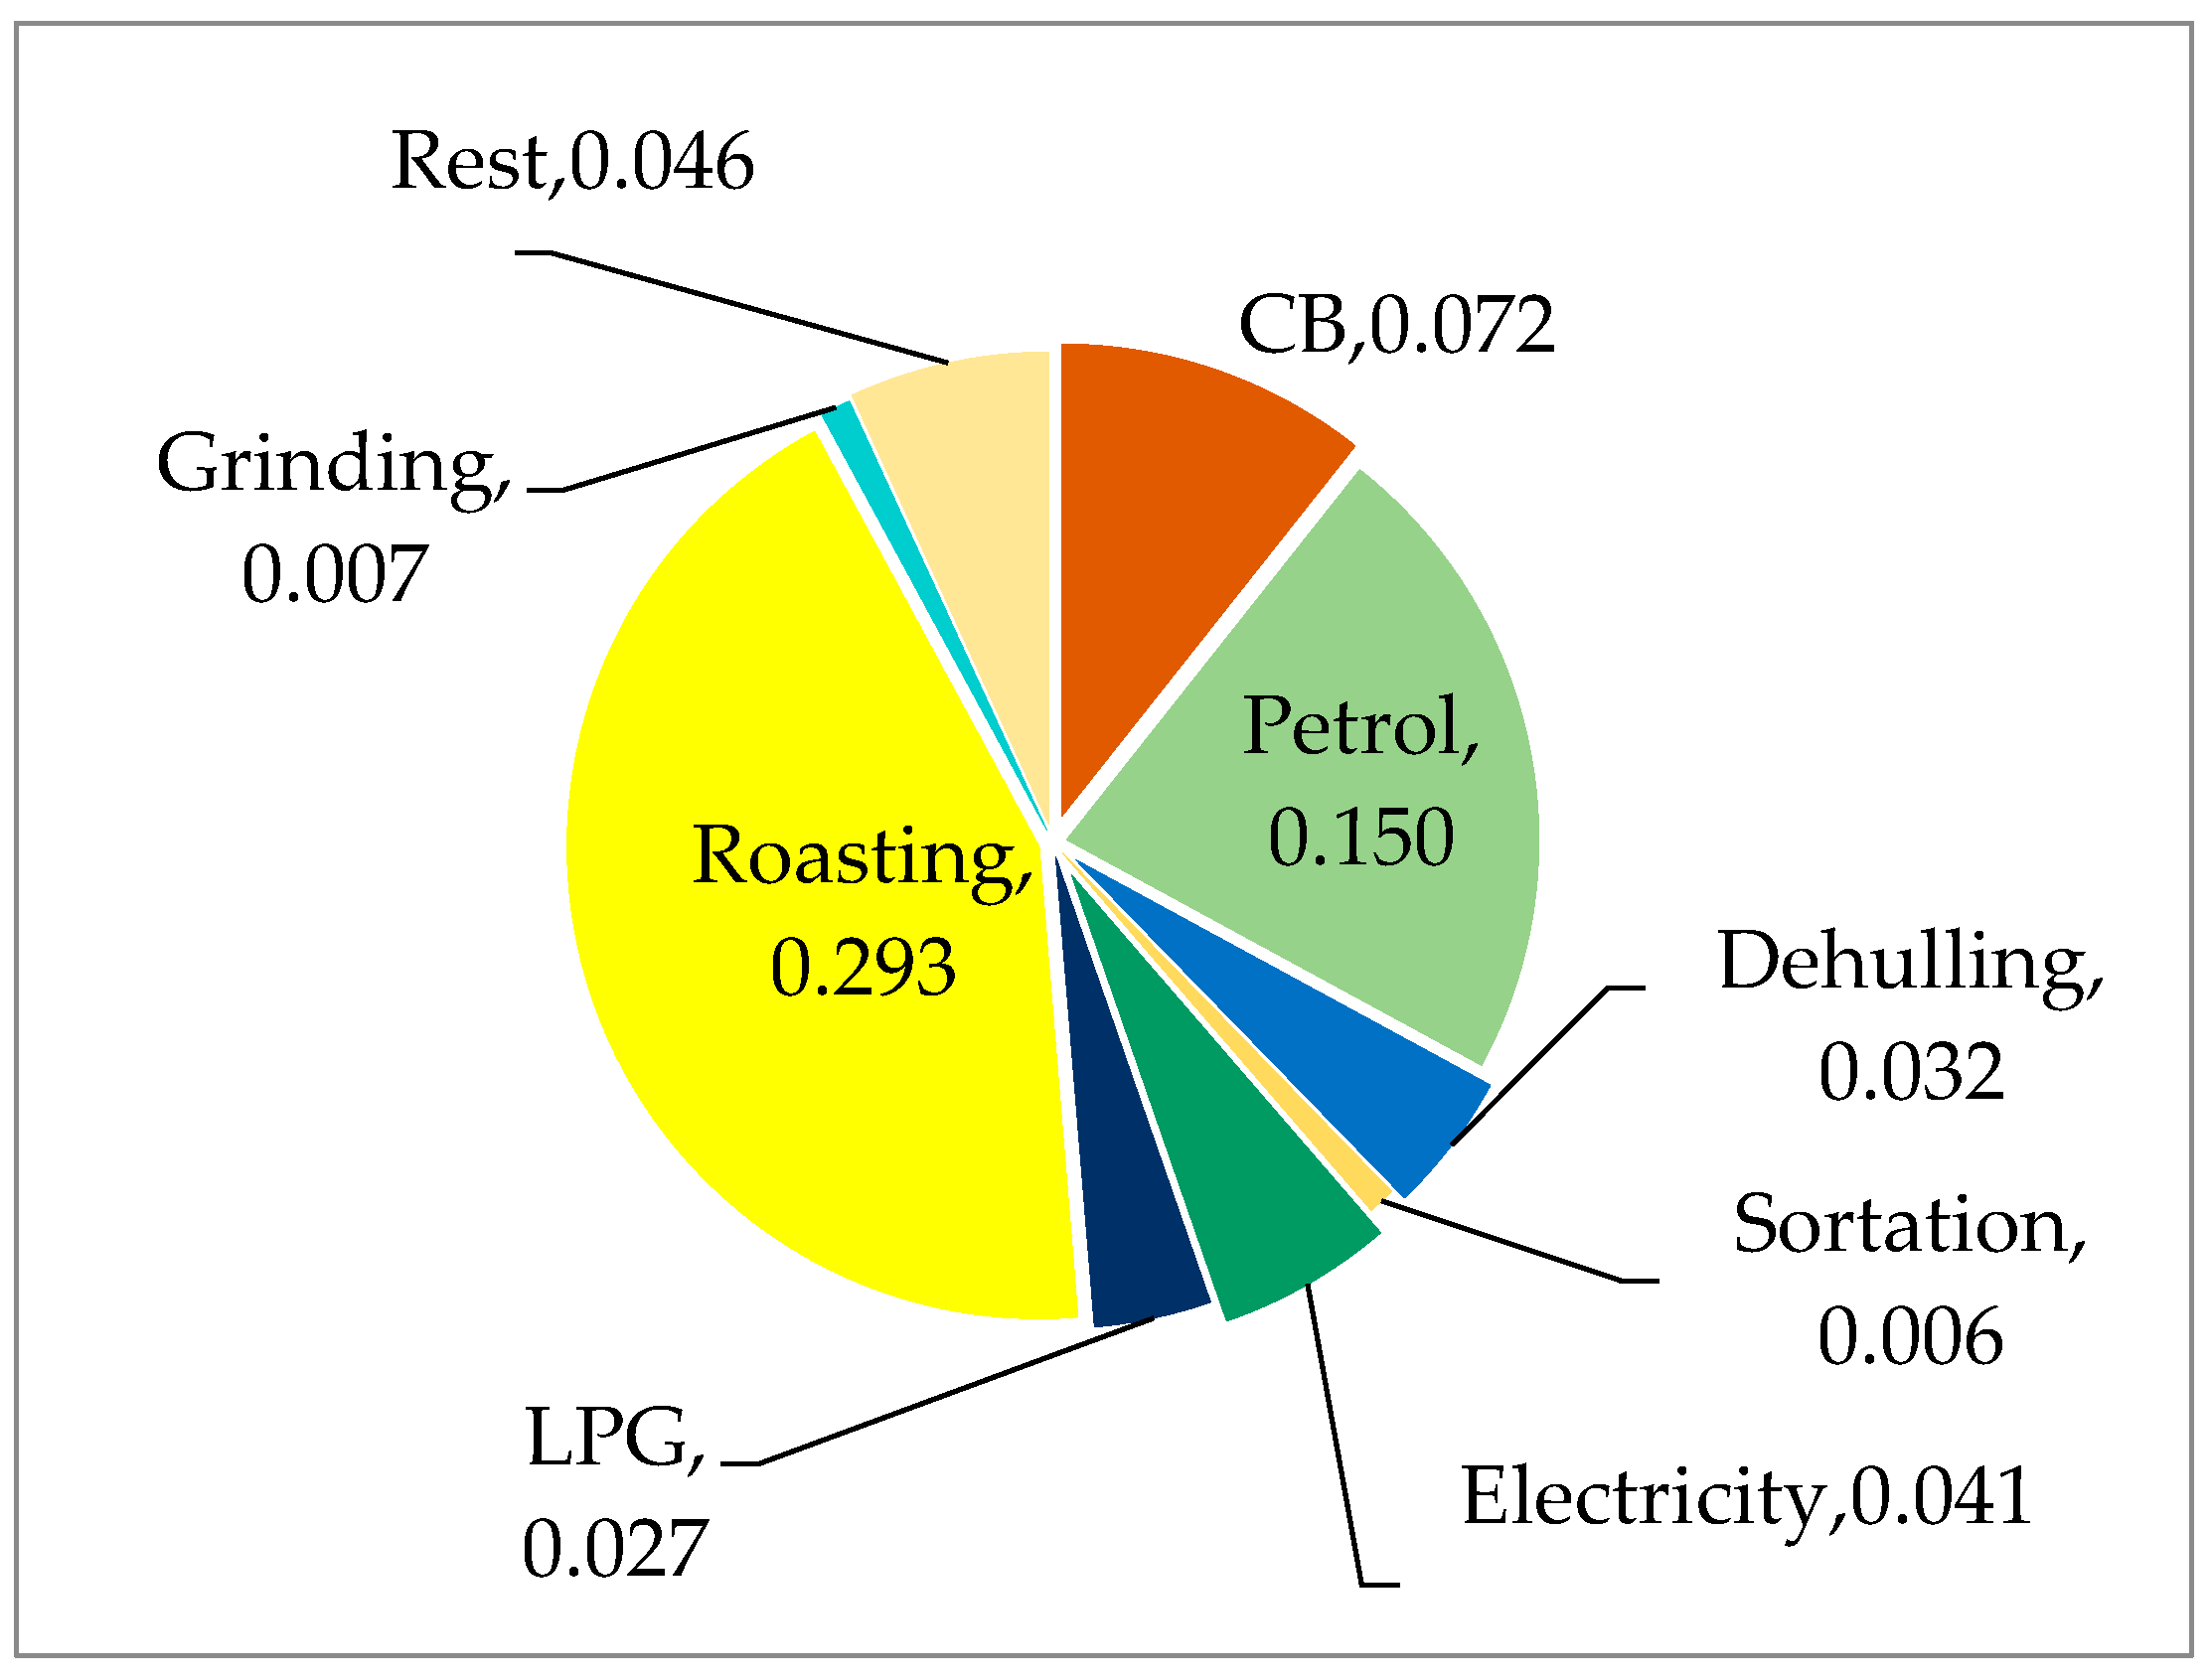
For further details on the impact source, the pie chart in Figure 7 illustrates the global warming potential (GWP) impact of various steps in the Natural process. Roasting has the highest impact at 0.293 kg CO2-eq/kg, followed by petrol usage at 0.015 kg CO2-eq/kg. CB, a specific material or chemical, contributes 0.072 kg CO2-eq/kg, while electricity usage accounts for 0.041 kg CO2-eq/kg. The “Rest” category, including minor steps, contributes 0.046 kg CO2-eq/kg. Dehulling and LPG use contribute 0.032 kg CO2-eq/kg and 0.027 kg CO2-eq/kg, respectively. Grinding and sortation have minimal impacts at 0.007 kg CO2-eq/kg and 0.006 kg CO2-eq/kg. The main contributors to GWP are roasting and petrol usage, indicating a focus area for reducing the environmental footprint of the Natural method.
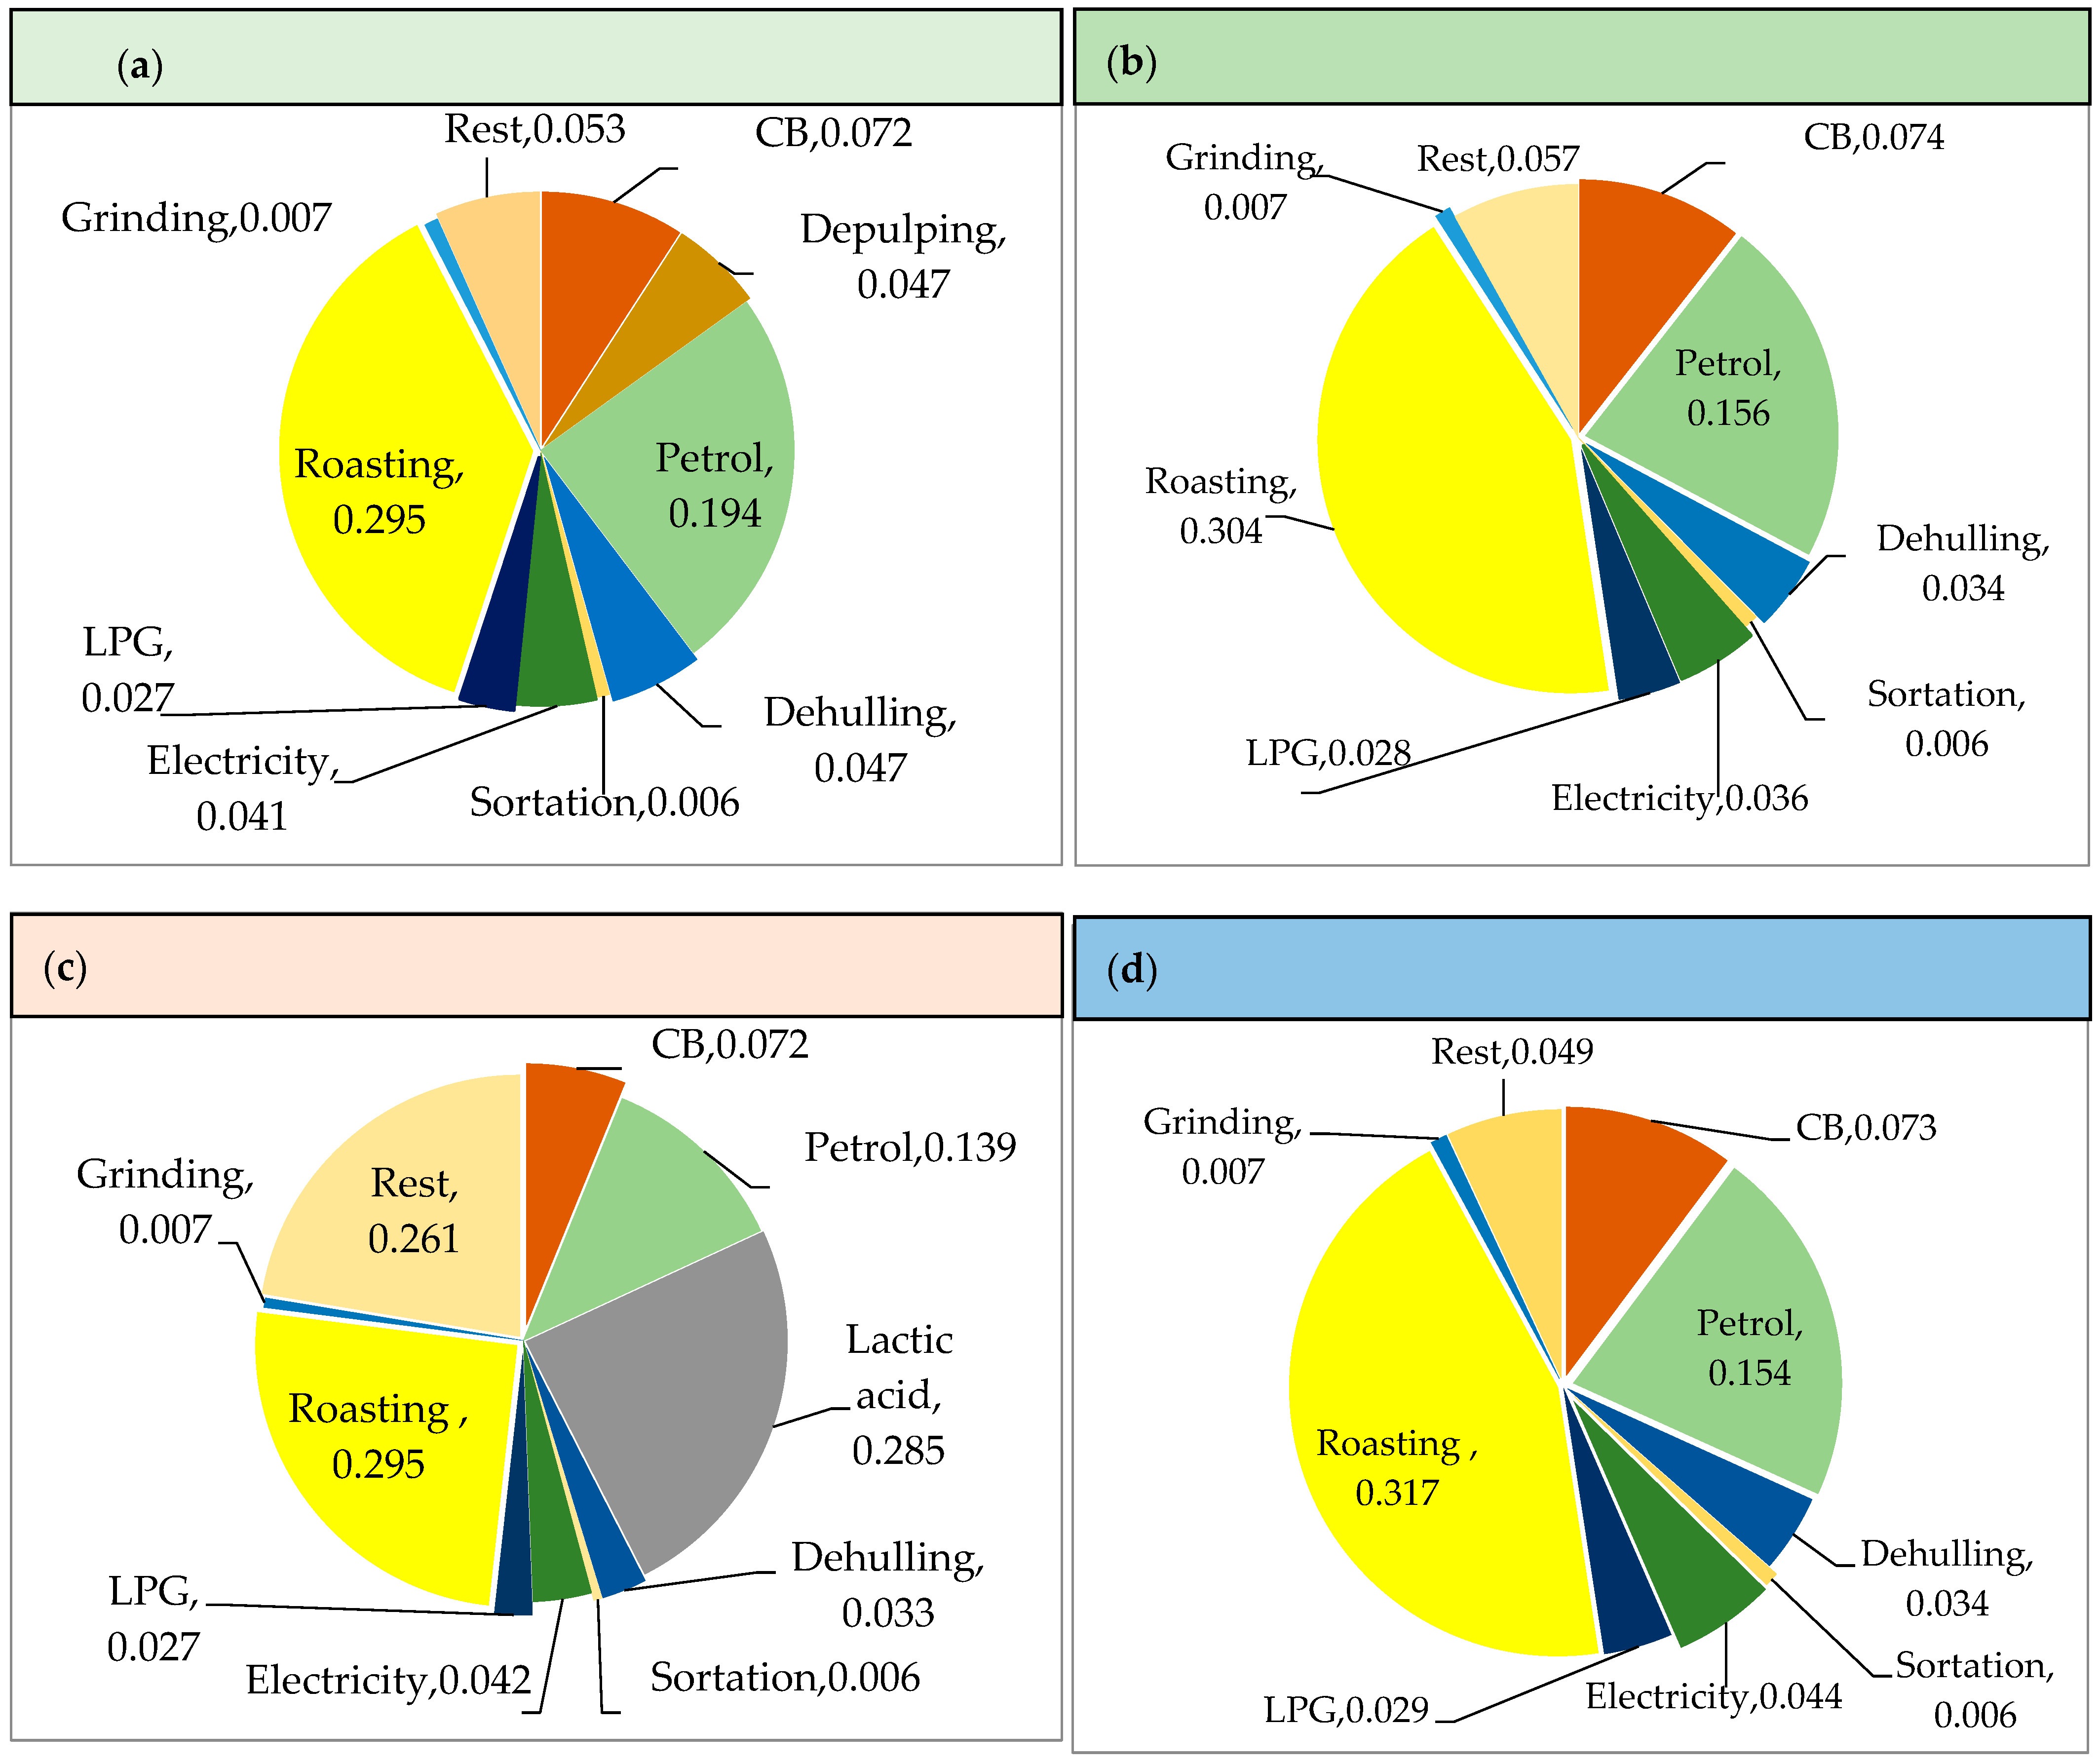
Figure 8 illustrates the GWP impact of various steps in four processes: Hydro honey (a), Anaerobic (b), Lactic (c), and CM processing (d). The Hd, Anerobic, and CM showed a similar tendency to Natural, with roasting contributing the most, and varying from 0.293–0.317 kg CO2-eq/kg CP. The second area of contributions for Hd, Anerobic, and CM was petrol varying from 0.139–0.195 kg CO2-eq/kg CP. The following areas of contribution for all methods were CB and electricity, and their value were comparable throughout the DMs. The pattern for Lactic is different from the other process as the lactic acid produced during fermentation contributes 0.285 kg CO2-eq/kg CP. This might be another reason why the overall environmental impact from Lactic was so high.

3.4. Comparison between GWP and Total Energy Consumption

The energy resources used by this group of smallholders were fuel (petrol and LPG), and local electricity. Table 7 compares various dry coffee processing methods in terms of their GWP on/off farm, as well as their total energy consumption from CBs to CP. The methods evaluated include Natural, Anaerobic, Hydro honey, Lactic, and CM processing.
For the Natural process, the on-farm GWP is 0.302 kg CO2-eq/kg GBs, the off-farm GWP is 0.676 kg CO2-eq/kg CP, and the total energy consumption is 147.79 MJ. This process has a relatively low on-farm GWP and moderate off-farm GWP, with the lowest total energy consumption among the methods.
For the Anaerobic process, the on-farm GWP is 0.306 kg CO2-eq/kg GBs, but it has a slightly higher off-farm GWP at 0.702 kg CO2-eq/kg CP and similar total energy consumption at 148.23 MJ. The Hydro honey process shows an increase in both on-farm and off-farm GWP, with values of 0.407 kg CO2-eq/kg GBs and 0.788 kg CO2-eq/kg CP, respectively. It also has the highest total energy consumption at 161.81 MJ, indicating more energy-intensive processing steps. The Lactic process has the highest GWP with 0.577 kg CO2-eq/kg GBs on-farm and 1.168 kg CO2-eq/kg CP off-farm, but its total energy consumption is 149.00 MJ. This suggests that the fermentation process produces significant greenhouse gases. The CM process has an on-farm GWP of 0.310 kg CO2-eq/kg GBs, and off-farm GWP is 0.713 kg CO2-eq/kg CP, and its total energy consumption is 155.58 MJ, indicating that later stages of processing or transportation are more emission-intensive.
Overall, the Natural, Anaerobic, and CM processes have the lowest on-farm GWP, indicating less energy-intensive initial processing. The Hd process has higher GWP and energy consumption, likely due to more intensive processing. The Lactic process, despite moderate energy usage, has the highest GWP due to significant emissions and by-products from fermentation. The CM process, while efficient on-farm, shows higher off-farm emissions. Optimizing these methods should focus on reducing emissions and energy use, especially in the more impactful stages.

4. Discussion

This study has identified several key elements that can be directly applied to enhance the sustainability performance of specialty coffee production. The LCA findings presented in Table 7 reveal that the Lactic method had the highest environmental impact among the assessed dry coffee processing methods. In contrast, the Natural, Anaerobic, Hd, and CM methods offer varying degrees of environmental friendliness. While the Lactic method may offer certain benefits in terms of flavor or processing efficiency, it comes with a trade-off of higher environmental costs. This highlights the importance of considering sustainability factors when selecting coffee processing methods and emphasizes the need for producers to strike a balance between quality, flavor enhancement, and environmental responsibility.
Figure 6 visually represents the environmental trade-offs inherent in different coffee processing methods. While certain methods may offer unique flavors, their environmental costs must be carefully considered. The Natural method emerged as a more sustainable choice for coffee production due to its lower environmental footprint.
In terms of gas produced during fermentation, Anaerobic method is the most sustainable, with significantly lower emissions compared to the other methods. In contrast, the CM and Lactic methods, while producing unique flavors, resulted in higher greenhouse gas emissions, confirming the need for balancing quality and environmental impact in coffee processing. While previous studies did not measure and account for in the LCA the gas produced during fermentation [40], this work considers these parameters to be part of the LCA analysis. This increases the novelty as well as the reliability of the results from this work.
The environmental impact of wastewater from fermentation varies significantly across coffee processing methods. The Lactic method has the most considerable impact, while the Hd method is the least harmful. These differences underscore the importance of selecting appropriate processing methods to minimize environmental damage, particularly in terms of wastewater management. This study mentions that the Lactic process contributes the most to environmental risk, but it does not mean that this processing method needs to be avoided. Certainly, it is necessary to mitigate wastewater, gas production, and even the use of energy sources. When compared to previous studies on coffee processing (Table 8), it is clear that there have been a wide range of calculated GWP emissions from coffee processing. It is also apparent that the functional unit and scope of previous studies has been variable, which makes the comparison challenging. Accurate and detailed studies estimating these emissions will be important for the development of sustainable coffee production, as well as the application of any form of carbon pricing or price premium. When wastewater is discharged into the environment, it can potentially reduce water availability and generate groundwater pollution [46], due to COD and BOD content in wastewater [47], TSS, and pH. The limitation standard in Indonesia for COD, BOD, TSS and pH of wastewater from coffee processing are 200 mg/L, 90 mg/L, 150 mg/L, and 6–9, respectively [48]. The values obtained for Anaerobic, CM, Lactic, and Hd did not fall into these standards, and thus, their wastewater must be diluted and corrected in pH before being discarded. Interestingly, wastewater from coffee by-products can be used as raw material for biogas [23], although gas can also be released in the fermentation stages. Therefore, instead of throwing away the wastewater, it can be reused for energy production. Another opportunity is to produce alcoholic beverages or bioethanol from the wastewater.
Each processing method varies in its environmental impact. The Natural and Anaerobic processes demonstrated the lowest on-farm GWP, indicating less energy-intensive initial processing. In contrast, the Hd process exhibits higher GWP and energy consumption, likely due to more intensive processing. Despite moderate energy usage, the Lactic process has the highest GWP, primarily due to significant emissions from fermentation, and by-production of lactic acid. The CM process, while efficient on-farm, shows higher off-farm emissions. Optimizing these methods should focus on reducing emissions and energy use, especially in the more impactful stages identified.
For all methods considered, the processing elements with the most significant impact on GWP are roasting and petrol usage, indicating that energy-intensive processes and fossil fuel consumption are major contributors to the environmental footprint. Efforts to reduce GWP could focus on improving energy efficiency, utilizing renewable energy sources, and optimizing processes to minimize fossil fuel dependence. The use of biogas produced from waste streams was identified as a potential option, according to previous research [49]. In 2020, several coffee processing technologies were applied in pilot plants to improve the quality of coffee beans [23]. These include skin peeling machines, sorting equipment, coffee roasting machines, and biogas digesters as simple IEC solutions. Solar panels are also considered as a substitute energy source for fossil gas and electricity. The waste product of coffee skin has been applied in coffee tea (cascara) from cherry skin and husk skin, the remaining waste (husk powder) potentially as briquettes [50]. In future studies, the utilization of wastewater from wet and dry methods for raw material of biogas, with slurry from reactors to be used for organic fertilizer, and solid waste as fertilizer or animal feed will be considered, and it is anticipated that most of the waste that exists today can be reduced through conversion into useful products. The integration of these solutions will be the focus of future work. Intercropping in plantations is another strategy that has helped farmers to increase the use of organic fertilizers sustainably, obtain animal feed sustainably, and in LCA this can lead to allocation requirements, which are not currently considered. Another solution to reduce the total annual emissions would be to rotate the DM procedures throughout the year.
Finally, Table 8 compares the results of this study with previous studies, where it appears that there are various GWP estimates in various functional units that are different from the ReCiPe (2016) database at the ML. In general, there are three stages considered, which end in roasted coffee or coffee powder: CB production; CBs to GBs; GBs to CR to CP. Sometimes all these stages have been examined and determined, sometimes only one or a few stages were considered. In this study, we reveal GWP at each stage, as well as overall (CBs to CP). Previous studies have also highlighted some useful alternatives to reducing emissions, revealing various GWP estimates across different functional units, diverging from the ReCiPe (2016) database at the ML.
Investigation into CB harvesting in an experimental agro-industry model in organic Arabica coffee plantations were found to emit 0.29 kg CO2-eq/kg CBs during CB harvest, approximately 0.336 kg CO2-eq/kg GBs during CB to GB conversion, and about 2.794 kg CO2-eq/kg CP during CB processing to CP [19]. Conversely, conventional plantations in Ijen were found to emit 1.8 kg CO2-eq/kg GBs during CB to GB conversion [51]. A comparison of two different energy sources in coffee processing from GBs to CP was reported as 0.318 kg CO2-eq/kg CP with solar panel energy source and 0.744 kg CO2-eq/kg CP using local hydro energy sources [52]. Similarly, coffee processing from CBs to GBs in Vietnam resulted in emissions ranging from 16.04 to 14.1 kg CO2-eq/kg GBs in conventional and integrated farming, respectively [53], higher than the findings in the current study (0.302–0.577 kg CO2-eq/kg GBs) using dry methods, and a previous study between 0.473 and 0.568 kg CO2-eq/kg GBs using wet methods [26].
Comparison with previous research highlights disparities in methodologies, geographical locations, and farming practices, impacting reported carbon emission values. The difference in GWP impact depends on the cherry maturity level, handling transportation, technology, fertilizer type, waste management, and energy use. It would be expected that the location itself would be only an indirect influence, in part associated with the local energy mix if local grid electricity was applied, while climate, agricultural practices, and soil conditions would affect the requirements for drying energy and fertilizer. Variability in data collection methods, boundary definitions, and the inclusion of different life cycle stages further contribute to discrepancies.
Table 8. Comparison of the results of this study with previous research.
Ref.FarmingOn-FarmOff-FarmLCA Method
Cultivation
(/kg CBs)
Harvesting
(/kg CBs)
Primary
(/kg GBs)
Secondary
(/kg CP)
[19]NA 0.29 kg CO2-eq/kg CBs0.336 kg CO2-eq/kg GBs2.794 kg CO2-eq/kg CPCalculated
Organic Farming to produce CBsProcess CBs to GBs
(/kg GBs)
Process CBs to CP
(/kg CP)
[21] 0.74 kg CO2-eqNANACalculated
Conventional Farming to Harvest of CBs
0.5 kg CO2-eqNANA
Integrated Farming to Harvest of CBs
0.16 kg CO2-eqNANA
Organic Farming to Harvest of CBs
[51]NANA1.8 kg CO2-eq/kg GBsNACalculated
Conventional Farming to Harvest of CBs Process CBs to GBs
[52]NANANA0.318 kg CO2-eq/kg CRLCA Sima Pro
Process GBs to CP (Solar Panel)
NANANA0.744 kg CO2-eq/kg CR
Process GBs to CP (Local Hydro Electricity)
[53] NANA16.04 kg CO2-eqNA Calculated
Conventional Farming in Vietnam from Harvest of CBs to Processed GBs
NANA14.61 kg CO2-eqNA
Integrated Farming in Brazil from Harvest of CBs to Processed GBs
2.82 kg CO2-eq2.82 kg CO2-eq2.90 kg CO2-eq/kg CP
[54]Conventional Farming to Harvest of CBsProcess CBs to GBsProcess GBs to CPCalculated
1.89 kg CO2-eq1.50 kg CO2-eq1.58 kg CO2-eq/kg CP
Organic Farming to Harvest of CBsProcess CBs to GBsProcess GBs to CP
[55]NANANA0.27 to 0.70 kg CO2-eq/l CD Calculated
Coffee Consumed in Finland
[56]NA0.27 kg CO2-eq/kg CBNA1.31 kg CO2-eq/kg CP Calculated
Conventional Farming to Harvest of CBs Process CBs to CP (Fossil Fuel and Local Electricity)
[26] SW0.039 kg CO2-eq0.275 kg CO2-eq0.568 kg CO2-eq0.765 kg CO2-eqLCA Sima Pro
[26] FW0.473 kg CO-2-eq0.741 kg CO2-eq
Cultivation
(/kg CBs)
Harvest CBs
(/kg CBs)
Process CBs to GBs
(/kg GBs)
Process CBs to CP
(/kg CP)
This studyCultivation
(/kg CB)
Harvest CBs
(/kg CB)
Process CBs to GBs
(/kg GBs)
Process CBs to CP
(/kg CP)
LCA Sima Pro
Nat0.072 kg CO2-eq0.276 kg CO2-eq0.302 kg CO2-eq0.676 kg CO2-eq
An0.306 kg CO2-eq0.702 kg CO2-eq
Hd0.407 kg CO2-eq0.788 kg CO2-eq
L0.577 kg CO2-eq1.168 kg CO2-eq
Cm0.310 kg CO2-eq0.713 kg CO2-eq
CBs: Cherry Beans; GBs: Green Beans; CR: Coffee Roasted; CP: Coffee Powder; CD: Coffee Drink.
The use of different LCA methodologies, including calculated values and software like SimaPro, introduces further variability in reported results. Understanding these variations is crucial for accurately assessing and addressing the environmental impact of coffee production. Geographical and farming practice variations significantly influence carbon emissions, with factors such as climate, soil conditions, agricultural inputs, and regional regulations shaping the environmental impact of coffee production across different regions and farming systems.
Various approaches have been proposed to reduce emissions and waste in coffee production, including using processing wastewater as biogas and repurposing by-products like coffee tea (cascara).The IEC approach is a system for optimization of industrial symbiosis in coffee production, including greater retention and reprocessing of waste in the production process [57]. This concept is required to encourage sustainable coffee production [58], and the results from this work contribute to that goal.
Future research should consider integration (Coffee plantation–industry–livestock) as an IEC solution for smallholders in coffee production. This integrated approach could utilize waste streams for food products, wastewater fermentation, and biogas production, offering long-term sustainability solutions. Additionally, future studies should evaluate the potential of IEC for wet and dry methods through solar panels and biogas energy, turning by-products into novel food and fuel.

5. Conclusions

The authors collected data through experimentation and direct observation during Arabica coffee processing in Bondowoso Regency as basis of the life cycle assessment. This study stands out for its comprehensive examination of the three critical stages in coffee production: CB production, CB to GB conversion, and GB to CP processing. While previous studies often focus on select stages, this research delves into each phase, disclosing the GWP at every step and providing an overall assessment from CBs to CP. Five DM procedures were investigated: Natural, Hd, Anaerobic, Lactic, and CM. The Lactic process had the highest environmental impact, with a GWP contribution of 1.170 kg CO2-eq/kg CP. In contrast, the Natural process had the lowest environmental impact, approximately 0.676 kg CO2-eq/kg CP. Furthermore, Anaerobic, Hd, and CM emitted approximately 0.702 kg CO2-eq, 0.788 CO2-eq, and 0.713 CO2-eq, respectively, per kg CP. Among the DMs that involved fermentation, the Anaerobic process released the least gas, while the Hd process showed itself to be the most environmentally friendly in terms of wastewater. The findings of this study highlight the importance of valorizing coffee by-products, not only for financial reasons, but also to lower environmental impacts. These points will be addressed in future studies where wastewater and by-products will be explored for fuel, potential feed, and fertilizer through IEC integration.

Author Contributions

Conceptualization, A.I.; methodology, A.I. and B.C.M.; software, A.I. and B.C.M.; validation, A.I., H.R. and B.C.M.; formal analysis, A.I.; investigation, A.I.; resources, A.I.; data curation, A.I., H.R. and B.C.M.; writing—original draft preparation, A.I.; writing—review and editing, A.I., H.R. and B.C.M.; visualization, A.I.; supervision, H.R. and B.C.M.; project administration, A.I. and B.C.M.; funding acquisition, A.I. All authors have read and agreed to the published version of the manuscript.

Funding

This research was funded by Japan Science and Technology Agency (JST), grant number JPMJFS2123, Supporting for Pioneering Research Initiated by the Next Generation, Division of Graduate Studies of Kyoto University.

Data Availability Statement

All primary data used in this study are provided within the document.

Conflicts of Interest

The authors declare no conflicts of interest.

References

  1. Quintão, T.; Brito, P.Z. Connoisseurship Consumption and Market Evolution: An Institutional Theory Perspective on the Growth of Specialty Coffee Consumption in the USA. Rev. Bras. De Mark. 2016, 15, 1–15. [Google Scholar] [CrossRef]
  2. Córdoba, N.; Moreno, F.L.; Osorio, C.; Velásquez, S.; Fernandez-Alduenda, M.; Ruiz-Pardo, Y. Specialty and regular coffee bean quality for cold and hot brewing: Evaluation of sensory profile and physicochemical characteristics. LWT 2021, 145, 111363. [Google Scholar] [CrossRef]
  3. Irawan, A. The smallholder coffee farmer’s livelihood adaptation strategies in Bengkulu, Indonesia. J. Strateg. Manag. 2023. ahead-of-print. [Google Scholar] [CrossRef]
  4. Campos, A.D.S.N.; Satolo, E.G.; Mac-Lean, P.A.B.; Júnior, S.S.B. Economic sustainability analysis of the specialty coffee farmers in Garça/SP. Coffee Sci. 2021, 16, e161993. [Google Scholar] [CrossRef]
  5. Krishnan, S. Sustainable Coffee Production. Oxf. Res. Encycl. Environ. Sci. 2017. Available online: https://oxfordre.com/environmentalscience/view/10.1093/acrefore/9780199389414.001.0001/acrefore-9780199389414-e-224 (accessed on 15 June 2024).
  6. Nugroho, A. The Impact of Food Safety Standard on Indonesia’ s Coffee Exports. Procedia Environ. Sci. 2014, 20, 425–433. [Google Scholar] [CrossRef]
  7. Widaningsih, R. Outlook Komoditas Perkebunan Kopi, Pusat Data dan Sistem Informasi PertanianSekretariat Jenderal; Kementerian Pertanian: Jakarta, Indonesia, 2022; ISSN 1907-1507. [Google Scholar]
  8. Mulyara, B.; Supriyadi, S.; Rahmadian, Y.; Ichsan, O.A.N. Sensory Properties and Volatile Compound Profile of Anaerobic Fermented Gayo Arabica Coffee in Non-Washed Processing. Pelita Perkeb. A Coffee Cocoa Res. J. 2021, 37, 239–254. [Google Scholar] [CrossRef]
  9. Yusuf, E.S.; Ariningsih, E.; Ashari; Gunawan, E.; Purba, H.J.; Suhartini, S.H.; Tarigan, H.; Syahyuti; Hestina, J.; Saputra, Y.H.; et al. Sustainability of Arabica coffee business in West Java, Indonesia: A multidimensional scaling approach. Open Agric. 2022, 7, 820–836. [Google Scholar] [CrossRef]
  10. Maspul, K.A. The Emergence of Local Coffee Brands: A Paradigm Shift in Jakarta Coffee Culture. EKOMA J. Ekon. Manaj. Akunt. 2023, 3, 135–149. [Google Scholar] [CrossRef]
  11. Pritantiwi, S.; Fatimah, F.; Hermawan, H. Determination of Product Life Cycle (PLC) for Formulation of Marketing Strategy UD. Matt Coffee Bondowoso. Int. J. Bus. Technol. Organ. Behav. 2023, 3, 1–10. [Google Scholar] [CrossRef]
  12. Antezana, R.N.V.; Luna-Mercado, G.I. Effect of processing methods (washed, honey, natural, anaerobic) of catimor coffee on physical and sensory quality in Alto Inambari, Peru. Coffee Sci. 2023, 18, e182111. [Google Scholar] [CrossRef]
  13. Wintgens, J.N.; Zamarripa, C.A. Coffee Propagation. In Coffee: Growing, Processing, Sustainable Production: A Guidebook for Growers, Processors, Traders, and Researchers; Wiley: Hoboken, NJ, USA, 2008. [Google Scholar] [CrossRef]
  14. Byrareddy, V.; Kouadio, L.; Mushtaq, S.; Stone, R. Sustainable production of robusta coffee under a changing climate: A 10-year monitoring of fertilizer management in coffee farms in Vietnam and Indonesia. Agronomy 2019, 9, 499. [Google Scholar] [CrossRef]
  15. Traore, T.M.; Wilson, N.L.W.; Fields, D. What explains specialty coffee quality scores and prices: A case study from the cup of excellence program. J. Agric. Appl. Econ. 2018, 50, 349–368. [Google Scholar] [CrossRef]
  16. Maspul, K.A. Improving the Creative Process Strategy of the Specialty Coffee in Eastern Province Saudi Arabia in Strengthening Sustainability in the Coffee Value Chain. EKOMA J. Ekon. Manaj. Akunt. 2022, 2, 244–254. [Google Scholar] [CrossRef]
  17. Trinh, L.T.K.; Hu, A.H.; Lan, Y.C.; Chen, Z.H. Comparative life cycle assessment for conventional and organic coffee cultivation in Vietnam. Int. J. Environ. Sci. Technol. 2020, 17, 1307–1324. [Google Scholar] [CrossRef]
  18. Diyarma, I.; Bantacut, T.; Suprihatin. Assessment of Environmental Impact of the Gayo Arabica Coffee Production by Wet Process using Life Cycle Assessment. Acta Univ. Cibiniensis. Ser. E Food Technol. 2019, 23, 27–34. [Google Scholar] [CrossRef]
  19. Novita, E.; Irfani, M.E. Life Cycle Assessment of Organic Arabica Coffee Products. J. Agric. Eng. 2023, 12, 186–200. [Google Scholar] [CrossRef]
  20. Pramulya, R.; Bantacut, T.; Noor, E.; Yani, M.; Romli, M. Life Cycle Assessment of Gayo Arabica Coffee Green Bean at Aceh Province. Habitat 2022, 33, 308–319. [Google Scholar] [CrossRef]
  21. Basavalingaiah, K.; Paramesh, V.; Parajuli, R.; Girisha, H.; Shivaprasad, M.; Vidyashree, G.; Thoma, G.; Hanumanthappa, M.; Yogesh, G.; Misra, S.D.; et al. Energy flow and life cycle impact assessment of coffee-pepper production systems: An evaluation of conventional, integrated and organic farms in India. Environ. Impact Assess. Rev. 2022, 92, 106687. [Google Scholar] [CrossRef]
  22. Noponen, M.R.A.; Edwards-Jones, G.; Haggar, J.P.; Soto, G.; Attarzadeh, N.; Healey, J.R. Greenhouse gas emissions in coffee grown with differing input levels under conventional and organic management. Agric. Ecosyst. Environ. 2012, 151, 6–15. [Google Scholar] [CrossRef]
  23. Irawan, A.; McLellan, B.C. Study on biogas production from coffee wastes and cow-dung fermentation and its use towards reducing emissions from coffee roasting. IOP Conf. Ser. Earth Environ. Sci. 2023, 1201, 012004. [Google Scholar] [CrossRef]
  24. Jimenez, E.J.M.; Martins, P.M.M.; Vilela, A.L.d.O.; Batista, N.N.; da Rosa, S.D.V.F.; Dias, D.R.; Schwan, R.F. Influence of anaerobic fermentation and yeast inoculation on the viability, chemical composition, and quality of coffee. Food Biosci. 2023, 51, 102218. [Google Scholar] [CrossRef]
  25. Arzoumanidis, I.; Salomone, R.; Petti, L.; Mondello, G.; Raggi, A. Is there a simpli fi ed LCA tool suitable for the agri-food industry? An assessment of selected tools. J. Clean. Prod. 2017, 149, 406–425. [Google Scholar] [CrossRef]
  26. Irawan, A.; McLellan, B.C. A comparison of life cycle assessment (LCA) of Andungsari Arabica coffee processing technologies towards lower environmental impact. J. Clean. Prod. 2024, 447, 141561. [Google Scholar] [CrossRef]
  27. Borém, F.M.; De Andrade, E.T. Processing and drying of coffee. Dry. Roasting Cocoa Coffee 2019, 3, 141–170. [Google Scholar] [CrossRef]
  28. Martins, P.M.M.; Batista, N.N.; Miguel, M.G.d.C.P.; Simão, J.B.P.; Soares, J.R.; Schwan, R.F. Coffee growing altitude influences the microbiota, chemical compounds and the quality of fermented coffees. Food Res. Int. 2020, 129, 108872. [Google Scholar] [CrossRef] [PubMed]
  29. Martinez, S.J.; Rabelo, M.H.S.; Bressani, A.P.P.; Da Mota, M.C.B.; Borém, F.M.; Schwan, R.F. Novel stainless steel tanks enhances coffee fermentation quality. Food Res. Int. 2021, 139, 109921. [Google Scholar] [CrossRef]
  30. Bertarini, P.L.L.; Gomes, M.S.; Santos, L.D. Evaluation of Arabica Coffee Fermentation Using Machine Learning. Foods 2024, 13, 454. [Google Scholar] [CrossRef]
  31. Mejía, F.T.; Fuentes, J.M.; Mejía, J.T.; Bonilla, F.H.; Alemán, R.S.; Varela, I.; Kazemzadeh, S.; Fernández, I.M. Energy Evaluation of the Mechanical Drying of the Grain of Coffea arabica from Honduras. Asian J. Biol. 2021, 11, 8–14. [Google Scholar] [CrossRef]
  32. Prono-Widayat, H.; Arpi, N.; Andini, R.; Muzaifa, M.; Gunawan, F. Chemical analysis of cascara tea from wine coffee processing with a different fermentation times. IOP Conf. Ser. Earth Environ. Sci. 2021, 667, 2–7. [Google Scholar] [CrossRef]
  33. Suseno, H.; Haryanto; Galih, N.R.P.; Hidayati, N.; Alonto, C.; Irfan, M. Panduan Penerapan dan Sertifikasi SNI Produk Kopi Bubuk; Badan Standardisasi Nasional: Jakarta, Indonesia, 2020; ISBN 978-602-9394-36-8.
  34. Rizkya, I.; Syahputri, K.; Sari, R.M.; Christin, S. Analysis of Defective Causes in Coffee Product Using Decision Tree Approach. IOP Conf. Ser. Mater. Sci. Eng. 2020, 851, 012029. [Google Scholar] [CrossRef]
  35. Garc, M.; Candelo-becerra, J.E. Quality and Defect Inspection of Green Coffee Beans Using a Computer Vision System. Appl. Sci. 2019, 9, 4195. [Google Scholar] [CrossRef]
  36. Kingston, N.F.L. How to Make Coffee: The Science Behind the Bean; Harry N. Abrams: New York, NY, USA, 2017; Volume 53. [Google Scholar]
  37. Nigam, P.S.; Singh, A. Cocoa and Coffee Fermentations. In Encyclopedia of Food Microbiology, 2nd ed.; Elsevier: Amsterdam, The Netherlands, 2014. [Google Scholar] [CrossRef]
  38. Wang, C.; Sun, J.; Lassabliere, B.; Yu, B.; Zhao, F.; Zhao, F.; Chen, Y.; Liu, S.Q. Potential of lactic acid bacteria to modulate coffee volatiles and effect of glucose supplementation: Fermentation of green coffee beans and impact of coffee roasting. J. Sci. Food Agric. 2019, 99, 409–420. [Google Scholar] [CrossRef]
  39. de Melo Pereira, G.V.; da Silva Vale, A.; de Carvalho Neto, D.P.; Muynarsk, E.S.; Soccol, V.T.; Soccol, C.R. Lactic acid bacteria: What coffee industry should know? Curr. Opin. Food Sci. 2020, 31, 1–8. [Google Scholar] [CrossRef]
  40. Rossi, E.; Pasciucco, F.; Iannelli, R.; Pecorini, I. Environmental impacts of dry anaerobic biorefineries in a Life Cycle Assessment (LCA) approach. J. Clean. Prod. 2022, 371, 133692. [Google Scholar] [CrossRef]
  41. Ariefandie, N.; Zhu, F. Coffee bean processing: Emerging methods and their effects on chemical, biological and sensory properties. Food Chem. 2023, 412, 135489. [Google Scholar] [CrossRef]
  42. Catalán, E.; Komilis, D.; Sánchez, A. Environmental impact of cellulase production from coffee husks by solid-state fermentation: A life-cycle assessment. J. Clean. Prod. 2019, 233, 954–962. [Google Scholar] [CrossRef]
  43. Zampori, L.; Saouter, E.; Schau, E.; Cristobal, J.; Castellani, V.; Sala, S. Guide for Interpreting Life Cycle Assessment Result; Publications Office of the European Union: Luxembourg, 2016; p. 60. [CrossRef]
  44. RTI. Greenhouse Gas Emissions Estimation Methodologies for Biogenic Emissions from Selected Source Categories: Solid Waste Disposal Wastewater Treatment Ethanol Fermentation; US Environmental Protection Agency: Washington, DC, USA, 2010; pp. 1–43.
  45. Doorn, M.R.J.; Towprayoon, S.; Vieira, S.M.M.; Palmer, C.; Pipatti, R.; Wang, C. Chapter 6: Wastewater Treatment and Discharge. In IPCC Guidelines for National Greenhouse Gas Inventories; Institute for Global Environmental Strategies: Hayama, Japan, 2006. [Google Scholar]
  46. Hobson, J. CH4 and N2O emissions from waste water handling. Good Practice Guidance and Uncertainty Management in National Greenhouse Gas Inventories. In IPCC Guidelines for National Greenhouse Gas Inventories; Institute for Global Environmental Strategies: Hayama, Japan, 2000; pp. 441–454. [Google Scholar]
  47. Ijanu, E.M.; Kamaruddin, M.A.; Norashiddin, F.A. Coffee processing wastewater treatment: A critical review on current treatment technologies with a proposed alternative. Appl. Water Sci. 2020, 10, 11. [Google Scholar] [CrossRef]
  48. Miller, R. Review Essay: The Third Way. Polit. Sci. 2000, 52, 174–180. [Google Scholar] [CrossRef]
  49. Hernández-Sarabia, M.; Sierra-Silva, J.; Delgadillo-Mirquez, L.; Ávila-Navarro, J.; Carranza, L. The potential of the biodigester as a useful tool in coffee farms. Appl. Sci. 2021, 11, 6884. [Google Scholar] [CrossRef]
  50. Irawan, A.; Mclellan, B.C.; Hastutik, S.D. Developing Coffee Cherry Skin and Coffee Husk by Products as Sustainable Novel Food and Fuel. Int. J. Technol. Food Agric. 2024, 1, 33–42. [Google Scholar] [CrossRef]
  51. Harsono, S.S.; Wibowo, R.K.K.; Supriyanto, E. Energy Balance and Green House Gas Emisson on Smallholder Java Coffee Production at Slopes Ijen Raung Plateau of Indonesia. J. Ecol. Eng. 2021, 22, 271–283. [Google Scholar] [CrossRef]
  52. de los Á, M.; Bartl, K. Carbon Footprint of the Coffee Roasting Process Based on Two Technologies with Different Sources of Energy in Peru. Eur. J. Sustain. Dev. 2018, 7, 90–98. [Google Scholar] [CrossRef]
  53. Nab, C.; Maslin, M. Life cycle assessment synthesis of the carbon footprint of Arabica coffee: Case study of Brazil and Vietnam conventional and sustainable coffee production and export to the United Kingdom. Geo Geogr. Environ. 2020, 7, e00096. [Google Scholar] [CrossRef]
  54. Giraldi-Díaz, M.R.; De Medina-Salas, L.; Castillo-González, E.; León-Lira, R. Environmental impact associated with the supply chain and production of grounding and roasting coffee through life cycle analysis. Sustainability 2018, 10, 4598. [Google Scholar] [CrossRef]
  55. Usva, K.; Sinkko, T.; Silvenius, F.; Riipi, I.; Heusala, H. Carbon and water footprint of coffee consumed in Finland—Life cycle assessment. Int. J. Life Cycle Assess. 2020, 25, 1976–1990. [Google Scholar] [CrossRef]
  56. Adiwinata, F.; Rahayuningsih, M. Analisis Daur Hidup (Life Cycle Assessment) Pengolahan Kopi Bubuk Robusta Secara Basah Di Industri Kecil Menengah (Ikm) Beloe Klasik Lampung. Agrointek 2021, 15, 1175–1182. [Google Scholar] [CrossRef]
  57. Mahushi, D.J.; Machunda, R.L.; Science, E.; Nelson, T.; African, M. Optimization of Biogas Production Process in Solid. Glob. J. Environ. Sci. Manag. 2018, 44, 205–213. [Google Scholar] [CrossRef]
  58. Ibnu, M. A Systemic Approach For a Sustainable Coffee Production in Indonesia. SOCA J. Sos. Ekon. Pertan. 2022, 16, 15. [Google Scholar] [CrossRef]
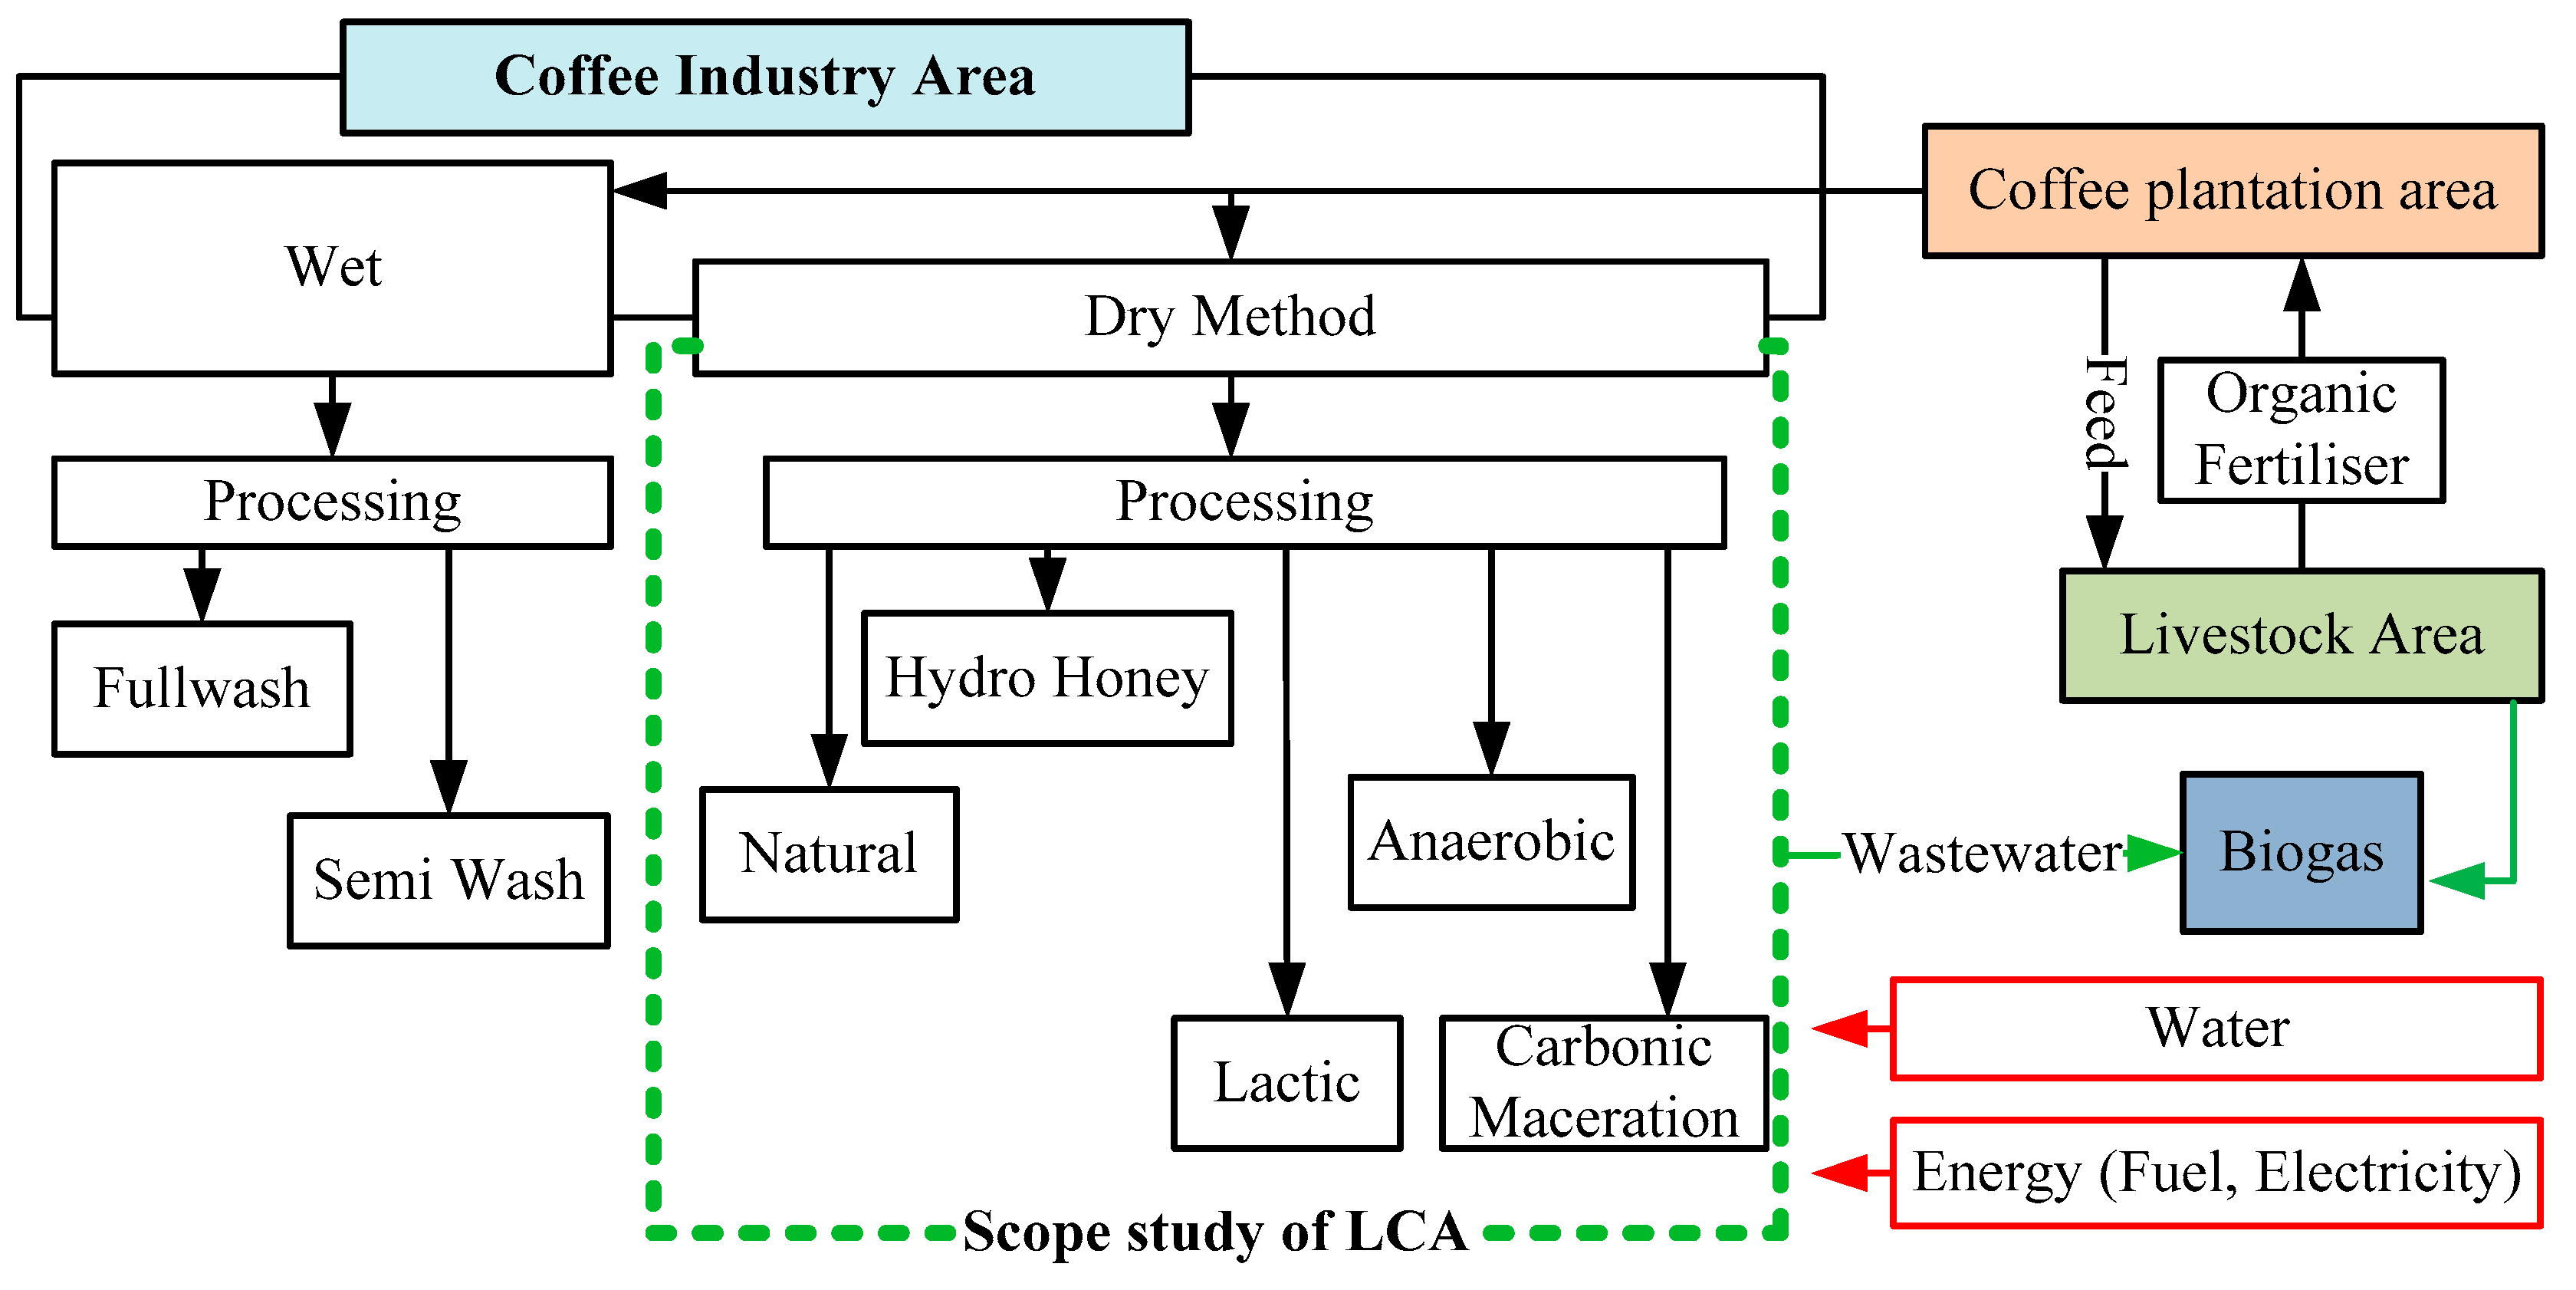
Figure 1. Limitations of the LCA study for the IEC pilot plant improvement.
Biomass 04 00047 g001
Figure 2. Coffee Flow Process and LCA Scope.
Biomass 04 00047 g002
Figure 3. Anatomy of CB, processing steps, and corresponding products and by-products.
Biomass 04 00047 g003
Figure 4. Process flow diagram considered for LCA with daily gas release.
Biomass 04 00047 g004
Figure 5. Concentration of (a) CO2, (b) CH4, and (c) N2O gas released during fermentation. (Over 3 days, 6 L total was produced and removed each day in a full 2 L gas bag for sample processing).
Biomass 04 00047 g005
Figure 6. Impact of the different dry methods for each category, with the highest value set as 100%.
Biomass 04 00047 g006
Figure 7. Impact of the processing steps, and energy sources for the Natural method in terms of GWP (kg of CO2-eq/kg of CP).
Biomass 04 00047 g007
Figure 8. Impact of the processing steps, and energy sources for Hydro honey (a), Anaerobic (b), Lactic (c), and (d) CM processing in terms of GWP (kg of CO2-eq/kg of CP).
Biomass 04 00047 g008
Table 1. Parameters to quantity fuel consumption at each stage *.
Process StagesEquipment SpecificationsUnitNHdALCM
HarvestingMotorcycle (100 kg/batch) MJ31.4031.4031.4031.4031.40
PulpingPetrol Engine 5 Hp, 200 kg/hMJ-20.41---
FermentationCO2 injectionkg----1.50
DehullingPetrol Engine 5 Hp, 200 kg/hMJ14.137.2014.2414.2614.44
Grading/SizingElectric 0.5 kW, 50 kg/hkWh0.280.280.280.280.29
Roasting CoffeeElectric 1 kW, 10 kg/hkWh1.171.181.181.191.26
LPG 0.75 kg/h 1.961.971.961.982.10
Coffee GrindingElectric 0.5 kW, 40 kg/hkWh0.330.330.330.330.35
N = Natural; Hd = Hydro honey; A = Anaerobic; L = Lactic; CM = Carbonic Maceration. * Data measured.
Table 2. Factor correction to calculate CO2 from wastewater [44].
ParameterFactorUnit
MCFWW0
λ0.65
CFCO1375mg
BG0.65
Table 3. Mass balance of coffee processing using various dry methods *.
StepsInput-OutputAmount (kg)
NHdALCM
Input
HandpickingCherry Coffee150.0150.0150.0150.0150.0
CO2----1.5
Lactic Acid Bacteria---2.0-
Water (Fermentation)-50.0---
Output
PulpingDe-pulping-70.2---
Cherry skin-79.8
FermentationWet Fermented-73.2137.5136.5134
Wastewater 47.012.515.516.0
DryingDried beans67.534.468.068.169.0
DehullingDehulled beans27.827.827.927.828.8
Coffee skin-31.0---
Coffee husk39.8-40.140.440.2
Parchment-6.6---
SortationGrade beans26.126.226.226.428.0
Defective GBs1.61.51.11.40.8
RoastingRoasted beans22.822.822.823.422.9
Silver skin1.01.11.11.11.2
GrindingCoffee powder22.722.722.722.822.4
N = Natural; Hd = Hydro honey; A = Anaerobic; L = Lactic; CM = Carbonic Maceration. * Data measured.
Table 4. Total gas produced during fermentation *.
ProcessGas Released (mg)
CO2CH4N2O
Anaerobic8.60.00875.7
Hd150.30.00836.4
Lactic566.20.015513.9
CM934.50.009028.6
* Data measured.
Table 5. Comparison of wastewater properties during fermentation in dry methods *.
PropertiesUnitsACMLHd
Chemical Oxygen Demand (COD) mg/L985010,40011,9506700
Biological Oxygen Demand (BOD) mg/L5642644472484844
Total Suspended Solid (TSS)mg/L145151257134
Total Dissolved Solid (TDS)mg/L296309397203
Brix°BX5.25.66.45
pH 4.13.93.84.2
Hd = Hydro honey; A = Anaerobic; L = Lactic; CM = Carbonic Maceration. * Data measured.
Table 6. Impact categories and values from transforming CBs to CP.
Impact CategoryUnitProcessing CBs to CP
NaturalAnaerobicLacticHdCM
GWPkg CO2-eq0.6760.7021.1680.7880.713
ODPkg CFC11eq2.1 × 10−72.19 × 10−73.34 × 10−72.4 × 10−72.2 × 10−7
IRPkBq Co−60eq0.0080.0080.0270.0080.009
HOFPkg NOxeq0.0010.0010.0020.0020.001
FPMFkg PM2.5eq0.0010.0010.0020.0010.001
EOFPkg NOxeq0.0010.0020.0020.0020.002
TAPkg SO2eq0.0010.0010.0020.0010.001
FEPkg Peq1.1 × 10−43.1 × 10−45.3 × 10−44.6 × 10−43.9 × 10−4
MEOkg Neq3.5 × 10−63.7 × 10−61.9 × 10−53.6 × 10−63.8 × 10−6
TETPkg 1,4-DCB0.9521.0042.5701.1610.988
FETPkg 1,4-DCB0.0030.0030.0150.0030.003
METPkg 1,4-DCB0.0050.0050.0210.0050.005
HTPckg 1,4-DCB0.0030.0030.0180.0030.003
HTPnckg 1,4-DCB0.2840.2960.5620.3480.294
LOPm2 a cropeq0.0080.0090.0140.0090.009
SOPkg Cueq2.3 × 10−42.5 × 10−45.6 × 10−42.6 × 10−42.4 × 10−4
FFPkg oileq0.1760.1820.3440.1920.187
WCPm30.00030.00030.00630.00250.0003
GWP = Global warming potential; ODP = Stratospheric ozone depletion potential; IRP = Ionizing radiation potential; HOFP = Ozone formation potential, human health; FPMF = Fine particulate matter formation; EOFP = Ozone formation potential, terrestrial ecosystems; TAP = Terrestrial acidification potential; FEP = Freshwater eutrophication potential; MEP = Marine eutrophication potential ; TETP = Terrestrial ecotoxicity potential; FETP = Freshwater ecotoxicity potential; METP = Marine ecotoxicity potential; HTPc = Human carcinogenic toxicity; HTPnc = Human non-carcinogenic toxicity; LOP = Land use; SOP = Mineral resource scarcity; FFP = Fossil resource scarcity; WCP = Water consumption potential.
Table 7. Comparison of the dry methods in their GWP on/off farm, as well as in their total energy consumption *.
NoCoffee ProcessOn-Farm
(kg CO2-eq/kg GBs)
Off-Farm
(kg CO2-eq/kg CP)
Total Energy CBs to CP
(MJ)
CBs to GBsCBs to CP
1Natural0.3020.676147.79
2Anerobic0.3060.702148.23
3Hydro honey0.4070.788161.81
4Lactic0.5771.168149.00
5CM0.3100.713155.58
CBs = Cherry Beans, GBs = Green Beans, CP = Coffee Powder, MJ = Mega Joule. * Data calculation.
Disclaimer/Publisher’s Note: The statements, opinions and data contained in all publications are solely those of the individual author(s) and contributor(s) and not of MDPI and/or the editor(s). MDPI and/or the editor(s) disclaim responsibility for any injury to people or property resulting from any ideas, methods, instructions or products referred to in the content.