Article

Enhancement of Biogas (Methane) Production from Cow Dung Using a Microbial Electrochemical Cell and Molecular Characterization of Isolated Methanogenic Bacteria

1
Central Department of Biotechnology, Tribhuvan University, Kirtipur 44618, Nepal
2
Biochemical Process Engineering, Lulea University of Technology, 97754 Lulea, Sweden
3
Central Department of Chemistry, Tribhuvan University, Kirtipur 44618, Nepal
4
Department of Chemistry and Biochemistry, St. Cloud State University, St. Cloud, MN 56301, USA
*
Authors to whom correspondence should be addressed.
Biomass 2024, 4(2), 455-471; https://doi.org/10.3390/biomass4020023
Submission received: 20 March 2024 / Revised: 1 May 2024 / Accepted: 20 May 2024 / Published: 23 May 2024
(This article belongs to the Topic Advances in Biomass Conversion)

Abstract

:
Biogas has long been used as a household cooking fuel in many tropical counties, and it has the potential to be a significant energy source beyond household cooking fuel. In this study, we describe the use of low electrical energy input in an anaerobic digestion process using a microbial electrochemical cell (MEC) to promote methane content in biogas at 18, 28, and 37 °C. Although the maximum amount of biogas production was at 37 °C (25 cm3), biogas could be effectively produced at lower temperatures, i.e., 18 (13 cm3) and 28 °C (19 cm3), with an external 2 V power input. The biogas production of 13 cm3 obtained at 18 °C was ~65-fold higher than the biogas produced without an external power supply (0.2 cm3). This was further enhanced by 23% using carbon-nanotubes-treated (CNT) graphite electrodes. This suggests that the MEC can be operated at as low as 18 °C and still produce significant amounts of biogas. The share of CH4 in biogas produced in the controls was 30%, whereas the biogas produced in an MEC had 80% CH4. The MEC effectively reduced COD to 42%, whereas it consumed 98% of reducing sugars. Accordingly, it is a suitable method for waste/manure treatment. Molecular characterization using 16s rRNA sequencing confirmed the presence of methanogenic bacteria, viz., Serratia liquefaciens and Zoballella taiwanensis, in the inoculum used for the fermentation. Consistent with recent studies, we believe that electromethanogenesis will play a significant role in the production of value-added products and improve the management of waste by converting it to energy.

1. Introduction

Biomass is a renewable organic material that originates from both plants and animals. Some of the examples include wood, food crops, grassy and wood plants, agriculture and forest residues, oil-rich algae, and organic components of municipal, industrial, and livestock wastes. Because it increases the constant pressure on the environment, handling livestock manure is one of the main problems in many regions of the world. Animal waste products, such as cow manure, should be properly disposed of to avoid health and environmental risks [1]. The amount of cow manure produced by feedlot farming has recently increased significantly, and the majority of it is either dumped in landfills or spread untreated on the ground. An alternate method of waste treatment and energy recovery can be achieved via anaerobic digestion. This method has long been used around the world, particularly in tropical countries, with relative success. Further, various countries around the world have developed laws and introduced policies at municipal/city, state, national, and international levels to adopt clean energy technologies to effectively treat the biomass and generate fuels and thus lessen our reliance on fossil fuels [2]. Production of biogas and improving biogas production efficiency from livestock wastes such as animal dung, particularly from cow dung/manure, fits very well with alternate methods of waste treatment and the production of value-added products. The biogas thus generated is used as cooking gas, particularly in rural communities. The solids left behind from the anaerobic digestion can be turned into organic fertilizer for plants [3].
Similarly, using waste-to-energy techniques, various organic wastes, e.g., the organic portion of municipal solid waste, sewage sludge, food waste, animal manure, etc., can also be subjected to anaerobic digestion [4]. This technique involves the breakdown of organic material in the absence of oxygen, leading to the formation of gases such as methane (CH4), carbon dioxide (CO2), ammonia (NH3), and low-molecular-weight organic acids [5]. The latter process leads to significant reduction in the likelihood of (i) nitrates seeping into groundwater; (ii) nitrates and pathogens being released into surface waterways; and (iii) the emission of odors from lagoons into the air. Further, the components of anaerobic digester systems have long been employed in municipal wastewater treatment facilities, and recently, they have also been used to process industrial and agricultural waste [6].
In anaerobic environments, the methanogenic bacteria thrive to their maximum potential. Accordingly, these systems typically create biogas with a big proportion of CH4 (up to 70%) and a little amount of CO2 and other gases when organic wastes are the main input [7]. The various physiochemical factors that affect biogas production include (i) the condition of the digester; (ii) nutrients; (iii) pH; (iv) temperature; (v) the ratio carbon/nitrogen; and (vi) the starter culture (anaerobic bacteria) used. It is important to note that methanogenic bacteria optimally function in the pH range of 6.6 to 7.6 [8]. Given the latter, the conditions in an anaerobic digester must be kept in equilibrium and dynamically managed for the digesters to work optimally [9]. The lack of such maintenance leads to inefficiency in biogas production as well as the failure of anaerobic digesters.
The microbial electrochemical cell (MEC) is one of the rapidly evolving microbial electrochemical technologies and is a component of a broad platform of upcoming sustainable energy and chemical production technologies [10]. Electromethanogenesis can be performed using electrons and the hydrogen produced at the cathode in an MEC via the application of a small voltage to convert CO2 properly to CH4 [11]. The MEC system utilizes exoelectrogenic bacterial biofilm on an anode to biodegrade organic material and produce biological hydrogen. The need for water molecules to sustain the hydrolysis reaction and the acetogenesis stage makes it possible to sustain the above phenomenon. When complex organic substances are in the hydrolysis stage, hydrolytic microorganisms in the system break them down into monomers, which are more soluble chemicals with lower molecular weights [8]. It can be difficult to keep microbial electrochemical systems operating steadily and consistently, especially in dynamic situations like waste treatment systems. The performance of the system as a whole, as well as microbial activity, can be affected by variations in temperature, pH, substrate availability, and other environmental parameters [12]. Despite the various limiting factors, the aim of the study is to overcome these obstacles and enhance the microbial electrochemical systems’ scalability, dependability, and efficiency in the production of methane and other uses. In this regard, we demonstrate the enhancement of methane production at a low temperature in an MEC, using cow dung as a substrate and a mixed culture of microbes as methanogens. Further, we also characterize the methanogenic bacteria present in these cultures.

2. Materials and Methods

2.1. Materials

All the chemicals used in this study were of reagent grade and were available locally unless specifically stated. All of the experimental work was conducted at the research laboratories in The Central Department of Biotechnology, Tribhuvan University, Kirtipur, Nepal.

2.2. Collection of Cow Dung/Cattle Manure

Fresh cow dung/cattle manure was obtained from a medium-sized cow farm/shed in Kirtipur, Nepal. The manure collected was relatively fresh (~1 h from the time it was dropped). The cows in this farm were fed with grass, hay, grains, and legumes.

2.3. Physiochemical Analysis of Substrate

Ten grams of cow dung (collected as above) was dissolved in 100 mL of distilled water and used for further analysis. The pH of the samples collected was first recorded using a pH meter (Hanna Edge pH Meter HI11310, Woonsocket, RI, USA). The samples were then subjected to soluble protein, reducing sugar, and total soluble solids (TSS), and volatile soluble solids (VSS) analysis according to the standard protocols published by the Association of Official Analytical Chemists (AOAC), 2000 [13,14]. In order to test the total suspended solids (TSS), cow dung samples were weighed, filtered, and dried in an oven at 105 ± 1 °C overnight. A VSS test was carried out to assess the concentration of volatile suspended solids in the sample after the total suspended solids’ value was established. The sample used for total suspended solids testing was transferred to a crucible, and it was digested at 550 °C for 1.5 h in a muffle furnace [15].

2.4. Chemical Analysis of Substrate

Protein concentrations were determined via the Lowry method using bovine serum albumin as a standard [16]. Chemical oxygen demand (COD) was determined using 1000 mg/L phthalate solution as standard [17]. The cow dung sample, digested in an oven at 150 °C for 2 h, was cooled, and the absorbance of the solutions were measured against a blank at 600 nm. Reducing sugar concentrations were determined spectrophotometrically via the dinitrosalicylic acid (DNSA) method, using glucose (1 mg/mL) as a standard [18]. For the determination of phosphorus, potassium, and arsenic, 3 g of substrate sample was digested on a hot plate at 100 °C with simultaneous addition of H2O2 till the solution turned transparent. The amount of phosphorus was determined spectrophotometrically (absorbance maximum 880 nm) via the addition of acidified ammonium molybdate solution [19]. A series of standard solutions ranging from 0.01 mg/L to 0.5mg/L of phosphorus were used to prepare a standard curve. Potassium and arsenic were determined via atomic absorption spectroscopy (AAS) [20].

2.5. Enrichment of the Collected Sample with Methanobacterium II Medium (MMII)

Exactly 25 g of cow dung was mixed with 5000 mL of the MMII media. MMII media are nothing but the commercially available DSMZ 825 media with sugar, which provides nutrients to methanogenic bacterial growth (for the composition of the media, see Appendix A Table A1). The methanogenic bacterial inoculum was prepared by incubating the above mixture at 37 °C for 5 days. Thus, prepared cultures were diluted (5 to 10%) and further cultured 2–3 times before being used as an inoculum for the electromethanogenesis in an MEC.

2.6. MEC Construction and Operation

MEC was constructed (Figure 1) essentially as described previously [21]. Briefly, a pair of graphite electrodes (Nippon Electrode Co., Ltd., Shizuoka, Japan) with dimensions of 10 cm × 3 cm × 1 cm were inserted into an aspirator bottle containing cow dung substrate and methanogenic bacterial inoculum, which served as an electromethanogenic anaerobic reactor. The reactor’s operational volume was 1 L. Exactly 100 g of cow dung was diluted with water in the ratio of 1:10 and mixed homogenously with the methanogenic bacterial inoculum (4% of total volume, i.e., 40 mL). To determine the efficiency and enhancement of biogas production in an electromethanogenic reactor, control tests were carried out in an identical anaerobic reactor without electrodes. Prior to sealing the reactors to start the digestion/fermentation of the substrate, nitrogen gas was bubbled through (10 min) the contents of the reactor to replace the dissolved oxygen (if any) in the media, as well as the headspace oxygen. The reactors were sealed by applying silicone adhesive to the cork reactor caps. The biogas produced during the fermentation process was collected in a syringe.
The anaerobic reactors/digesters with and without MEC were operated for up to 5 days. The biogas produced was monitored by measuring volume collected in the syringes. The reactors were operated at 18 °C, 28 °C, and 37 °C, respectively. Biogas is normally a mixture of CH4 and CO2. The amount of CH4 in the mixture was separated by treating it with KOH (KOH absorbs CO2 in the samples). Fermentation of samples in the reactors were aliquoted daily for COD and reducing sugar analysis. The pH of the samples was measured as described above. The graphite felt covered with PANI/MWCNT (polyaniline/multiwalled carbon nanotubules) was used to further enhance MEC performance [22].

2.7. Treatment of Graphite Electrodes

The graphite electrodes were first placed in 70% methanol and ultrasonicated for 15 min at the temperature of 25 °C. This was followed by washing with distilled water by ultrasonication for 15 min. Further, the graphite electrodes were placed in 70% acetone and ultrasonicated for 15 min. Finally, the electrodes were washed with distilled water via ultrasonication for 15 min. Electrodes were then dried in the oven at 60 °C for 24 h. Before the use, these electrodes were irradiated with UV light for about 15 min [17].

2.8. Cyclic Voltammetry

Cyclic voltammetry (CV) measurements were performed with the aid of a three-electrode arrangement potentiostat (Hokuto-Denko HA151, Meiden Hokuto Corporation, Tokyo 152-0003, Japan) coupled to a National Instrument Lab View work station. The counter electrode employed was made of platinum. The pretreatment consisted of washing with distilled water. The reference electrode that was used was a calomel (mercury chloride) electrode. The measurements were conducted between −0.8 V and +0.4 V. The characterization by means of CV was conducted at scan rate of 1 mV/s. The data were collected at an interval of 1 mV to obtain stable current values [23].

2.9. SEM Analysis of the Electrode

SEM analysis of the untreated graphite electrode (UGE), carbon-nanotubes-treated (CNT) graphite electrode (CGE), and CNT-treated graphite electrode with mixed culture (CGE+M) were performed at the Advanced Instrumentation Research Faculty, Jawaharlal Nehru University, New Delhi, India.

2.10. Isolation and Identification of Bacteria

Exactly 0.1 mL of the inoculum prepared in DSMZ 825 (methanogen enhancement) media was spread on the agar plate enriched with DSMZ 825 media. The plates were sealed with parafilm, labeled, and kept in an anaerobic jar and incubated at 37 °C for 24 h. The different colonies of bacteria on the plate were chosen, and pure cultures were isolated as follows. Using an aseptic technique, the chosen bacterial colonies were streaked on the agar plate and incubated in anaerobic jars at 37 °C for growing. Further, the bacterial isolates were subjected to gram staining. Samples were observed under microscope and characterized [24].

2.11. Molecular Characterization of Isolates

Extraction of genomic DNA (gDNA) from broth cultures of isolates was performed using the modified SDS-based method described by Natarajan and associates [25]. The gDNA was amplified using 16s rRNA universal primers (New England Biolabs, Boston, MA, USA). The sequences of the forward primer and reverse primers were 5′-AACGCGAAGAACCTTAC-3′ and 5′-CGGTGTGTACAAGGCCCGGGAACG-3′, respectively. The polymerase chain reaction (PCR) products were separated into 1% gel electrophoresis and visualized using an UV transilluminator. The amplicons were sequenced at Xcelris Labs Ltd., Ahmedabad, Gujarat, India. Using default settings, Cluster W, in BioEdit’s multiple sequence alignment tools, each candidate sequence was aligned. We used MEGA v.7.0.14 software and neighbor-joining methodology, to rebuild phylogenic trees.

2.12. Data Analysis

Microsoft Excel and GraphPad Prism software were used to perform the data analysis. Data presented are the mean ± standard deviation (SD) of triplicate measurements.

3. Results and Discussion

3.1. Determination of Environmental Parameters of the Collected Cow Dung

Various physiochemical characteristics of the cow dung substrate used in this study are summarized in Table 1. The results reported herein are similar to previously reported values, e.g., the total suspended solids (TSS) and volatile suspended solids (VSS) values are within the range of 15–20% and 10–15%, respectively [26]. The presence of P and K suggests the fertilizing capacity of the cow manure. The VSS/TSS ratio is high, indicating high organic content in the cow dung substrate. The protein and phosphorus content in the cow dung samples vary depending on the feed cows consume [27]. Numerous studies have demonstrated the importance of TSS data in predicting how a waste treatment system would operate. TSS readings in waste water can be an indicator of nutritional deficiencies in microorganisms, which can be connected to excessive solids formation as a result of an increase in BOD load [28].

3.2. Optimization of Apparatus for Biogas Production

Several attempts were made to identify the correct apparatus that would allow for the maintenance of the anaerobic state/environment and facilitate daily sampling of fermenter contents to monitor the chemical changes in the media (Table 2). In the initial attempts, a reagent bottle fitted with rubber tubes through bottle cover/cap was used. Trials using this set-up failed to achieve the expected outcomes, i.e., (i) to maintain the anaerobic state; and (ii) to easily perform daily sampling of the reactor contents and biogas produced. In the second trial, saline bottles were used as reactors. In the latter setup, anaerobic conditions could be effectively maintained, but regular sampling was cumbersome, and accumulated gases were significantly lost. After a number of trials, we found that the aspirator bottles are perfectly suited for this purpose as they can hold up to 1000mL of the media, they allow for daily sampling of the contents and the gases produced in the reactor, and the anaerobic state can be maintained with relative ease. The aspirator bottles add further flexibility by adding cork caps, which allows for the insertion of electrodes, along with the sampling tube, into the reactor.

3.3. Operation of MFC

The MECs were setup to generate biogas at 18 °C, 28 °C, and 37 °C, respectively, to determine their efficiency to produce biogas at different temperatures. The purpose of these experiments was to (i) optimize the reactors for biogas production; and (ii) optimize the reactor operating temperature for all other experiments. The summary of the overall biogas production in each of these setups, which will help the quantitative analysis, is shown in Table 3. Clearly, the highest amount of biogas is produced at 37 °C in an MEC. MECs can be operated at both 18 and 28 °C, with significant increase in biogas production, with an input of 2 V current. The use of a MWCNT-coated anode as an electrode further enhanced biogas production at 18 °C. The optimal electrical input in these experiments was assessed to be 2 V. Lower voltages appear to be inefficient in inducing optimal redox reactions. It is likely that higher voltages interfere with the growth of methanogenic bacteria [29].

3.3.1. Temperature Dependent Production of Biogas

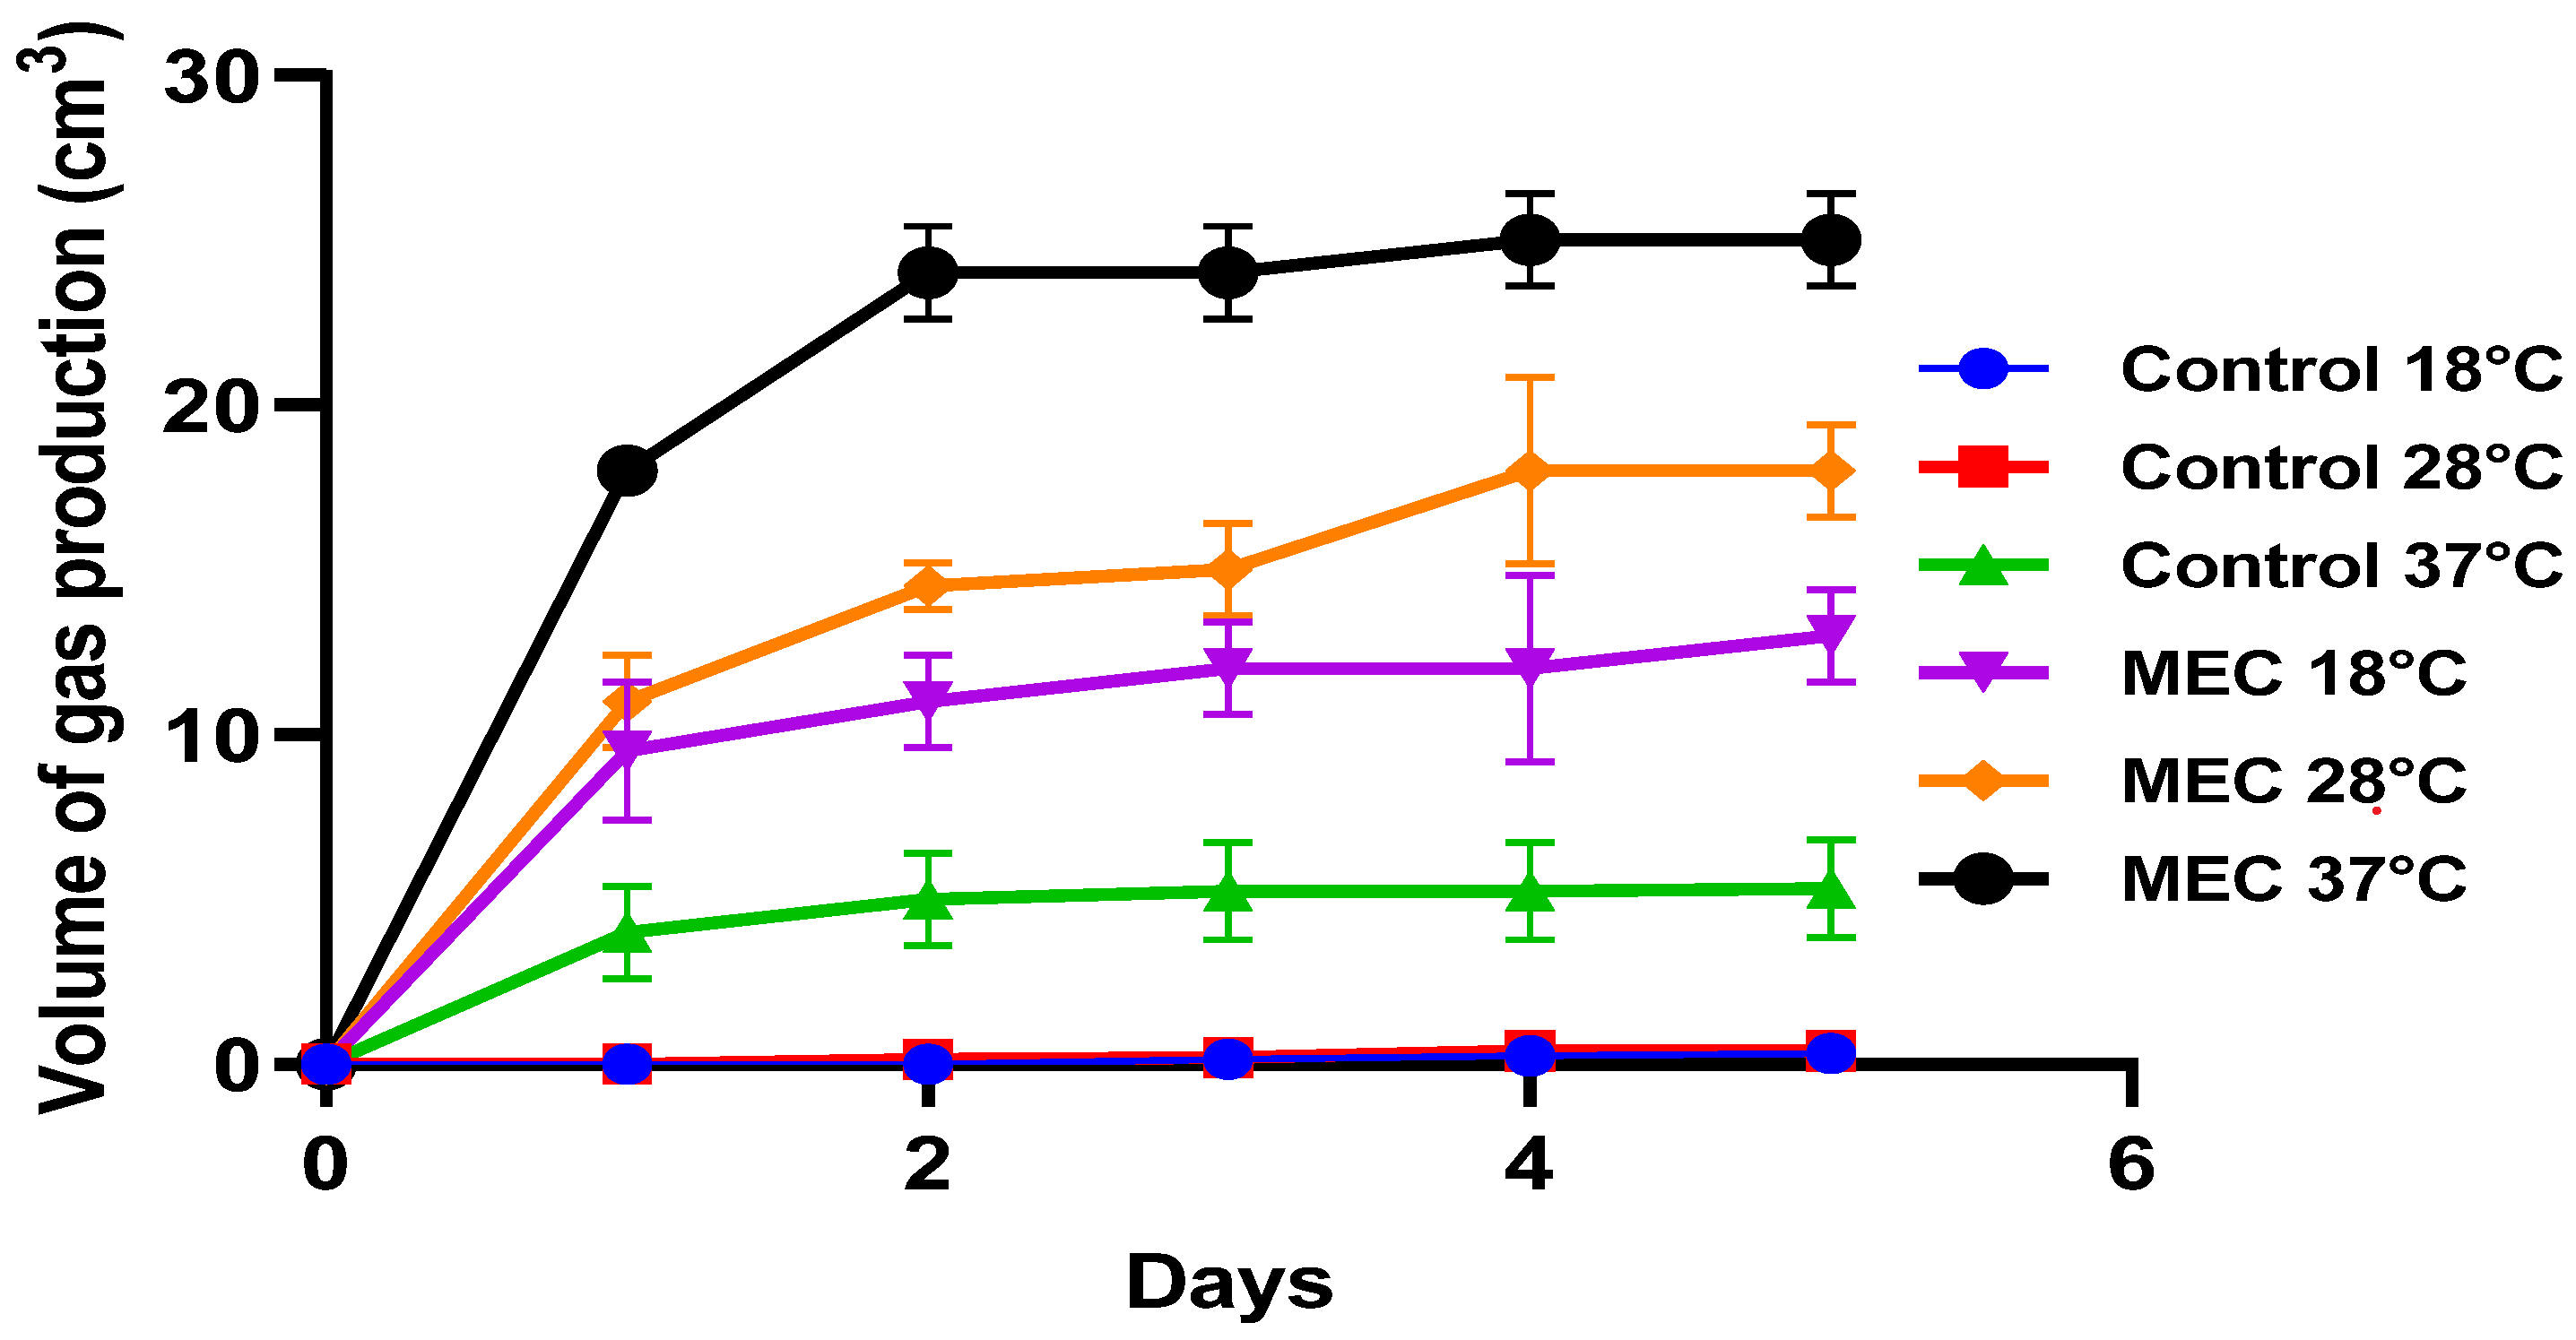
In an MEC, the amount of biogas produced at the end of 5 days at 18 °C, 28 °C, and 37 °C was 13 cm3, 19 cm3, and 25 cm3, respectively (Figure 2). The amount of biogas produced in the controls (without the 2 V applied current) at the end of 5 days at 18 °C, 28 °C, and 37 °C was 0.2 cm3, 0.45 cm3, and 5 cm3, respectively. Among the temperatures tested (18 °C, 28 °C, and 37 °C) in an MEC, the production of biogas was the highest at 37 °C. This is not unexpected because 37 °C is the optimum temperature for the growth of most microorganisms.
A further goal of these experiments was to determine the lowest temperature at which the production of biogas was possible with or without the use of an MEC. Accordingly, the production of gas was evaluated at 18 °C, 28 °C, and 37 °C. As can be seen from the results, significantly increased amounts of biogas can be produced in an MEC. The fold increase in biogas production in MECs at 18 °C, 28 °C, and 37 °C were 65-fold, 42-fold, and 5-fold, respectively. Clearly, as compared to MECs, the biogas production was significantly lower in the controls. Applied voltage can directly impact the electrochemical activity of methanogenic bacteria by acting as an electron source, affecting their metabolic pathways and general activity, which increase the production of methane [29]. It has been shown that when the temperature increases from 15 to 35 °C, the metabolic activity increases noticeably [30]. Further, using MEC systems, it has been demonstrated that biogas production increases by 25–62% [31]. The increase in the production of biogas seen even at 18 °C (65-fold) in an MEC is significant because under field conditions, temperatures vary, especially in winters. Although yet to be proven in the field conditions, incorporating electrodes into methanogenic fermenters and supplying a small voltage could significantly enhance the production of biogas.

3.3.2. Voltage Optimization for Biogas Production

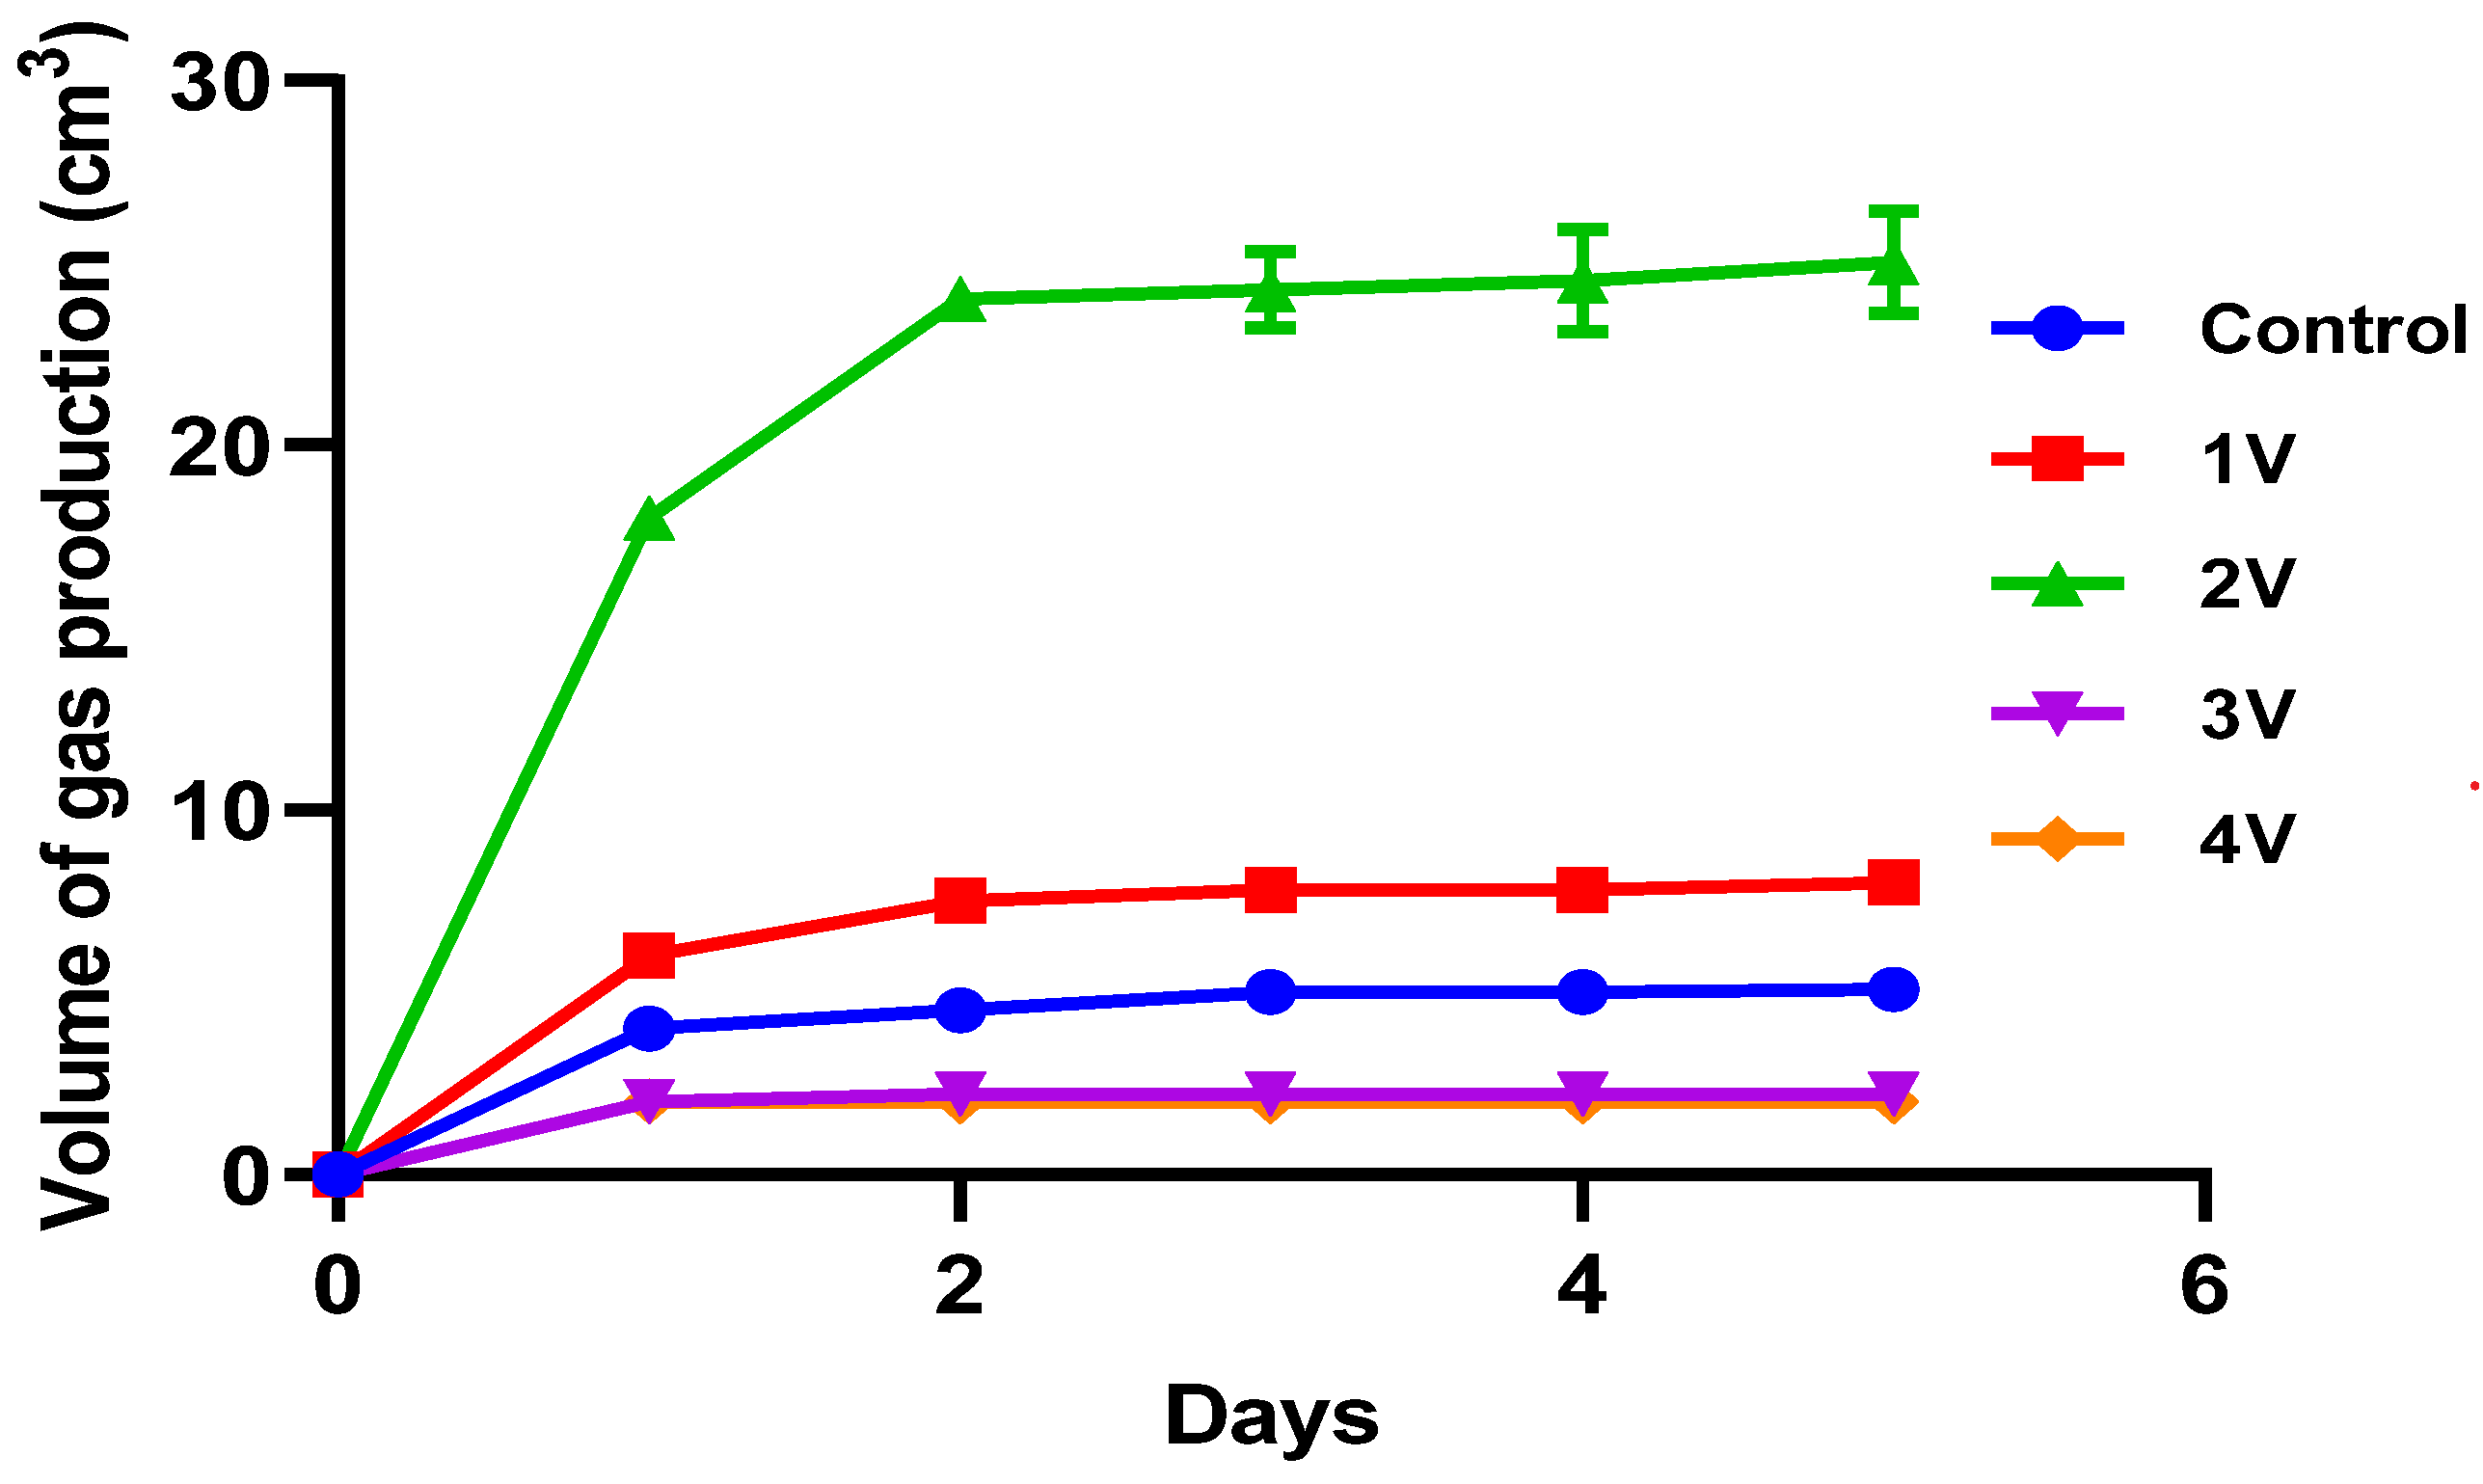
The effect of changes in biogas production by varying voltage between 1 and 4 V was measured at 37 °C (Figure 3). At an applied current of 2 V, the highest biogas yield was achieved in the MEC. The amount of gas produced at the end of the fifth day at 1 V, 2 V, 3 V, and 4 V was 8 cm3, 25 cm3, 2.2 cm3, and 2 cm3, respectively. Under similar conditions, 5.1 cm3 of biogas was produced in the control without the applied current. Similar but much lower levels of methane production have been observed by others, i.e., the production of CH4 was 11% and 13% higher in acetate-fed and cow-manure-fed reactors, respectively [31]. In this study, the externally applied current to the reactors was 1.7 V. Our study, at an applied current of 2 V, gives a much higher amount of biogas. On the other hand, the application of higher voltage has been shown to reduce the growth rate of bacteria, lower metabolic activity, and increase plasmatorrhexis. Further, these studies also showed a reduction in COD removal efficiency and methane yield, and this is attributed to damaged cell membranes, delayed cell growth, and metabolism [32].

3.3.3. Biogas Collected in the Presence and Absence of KOH

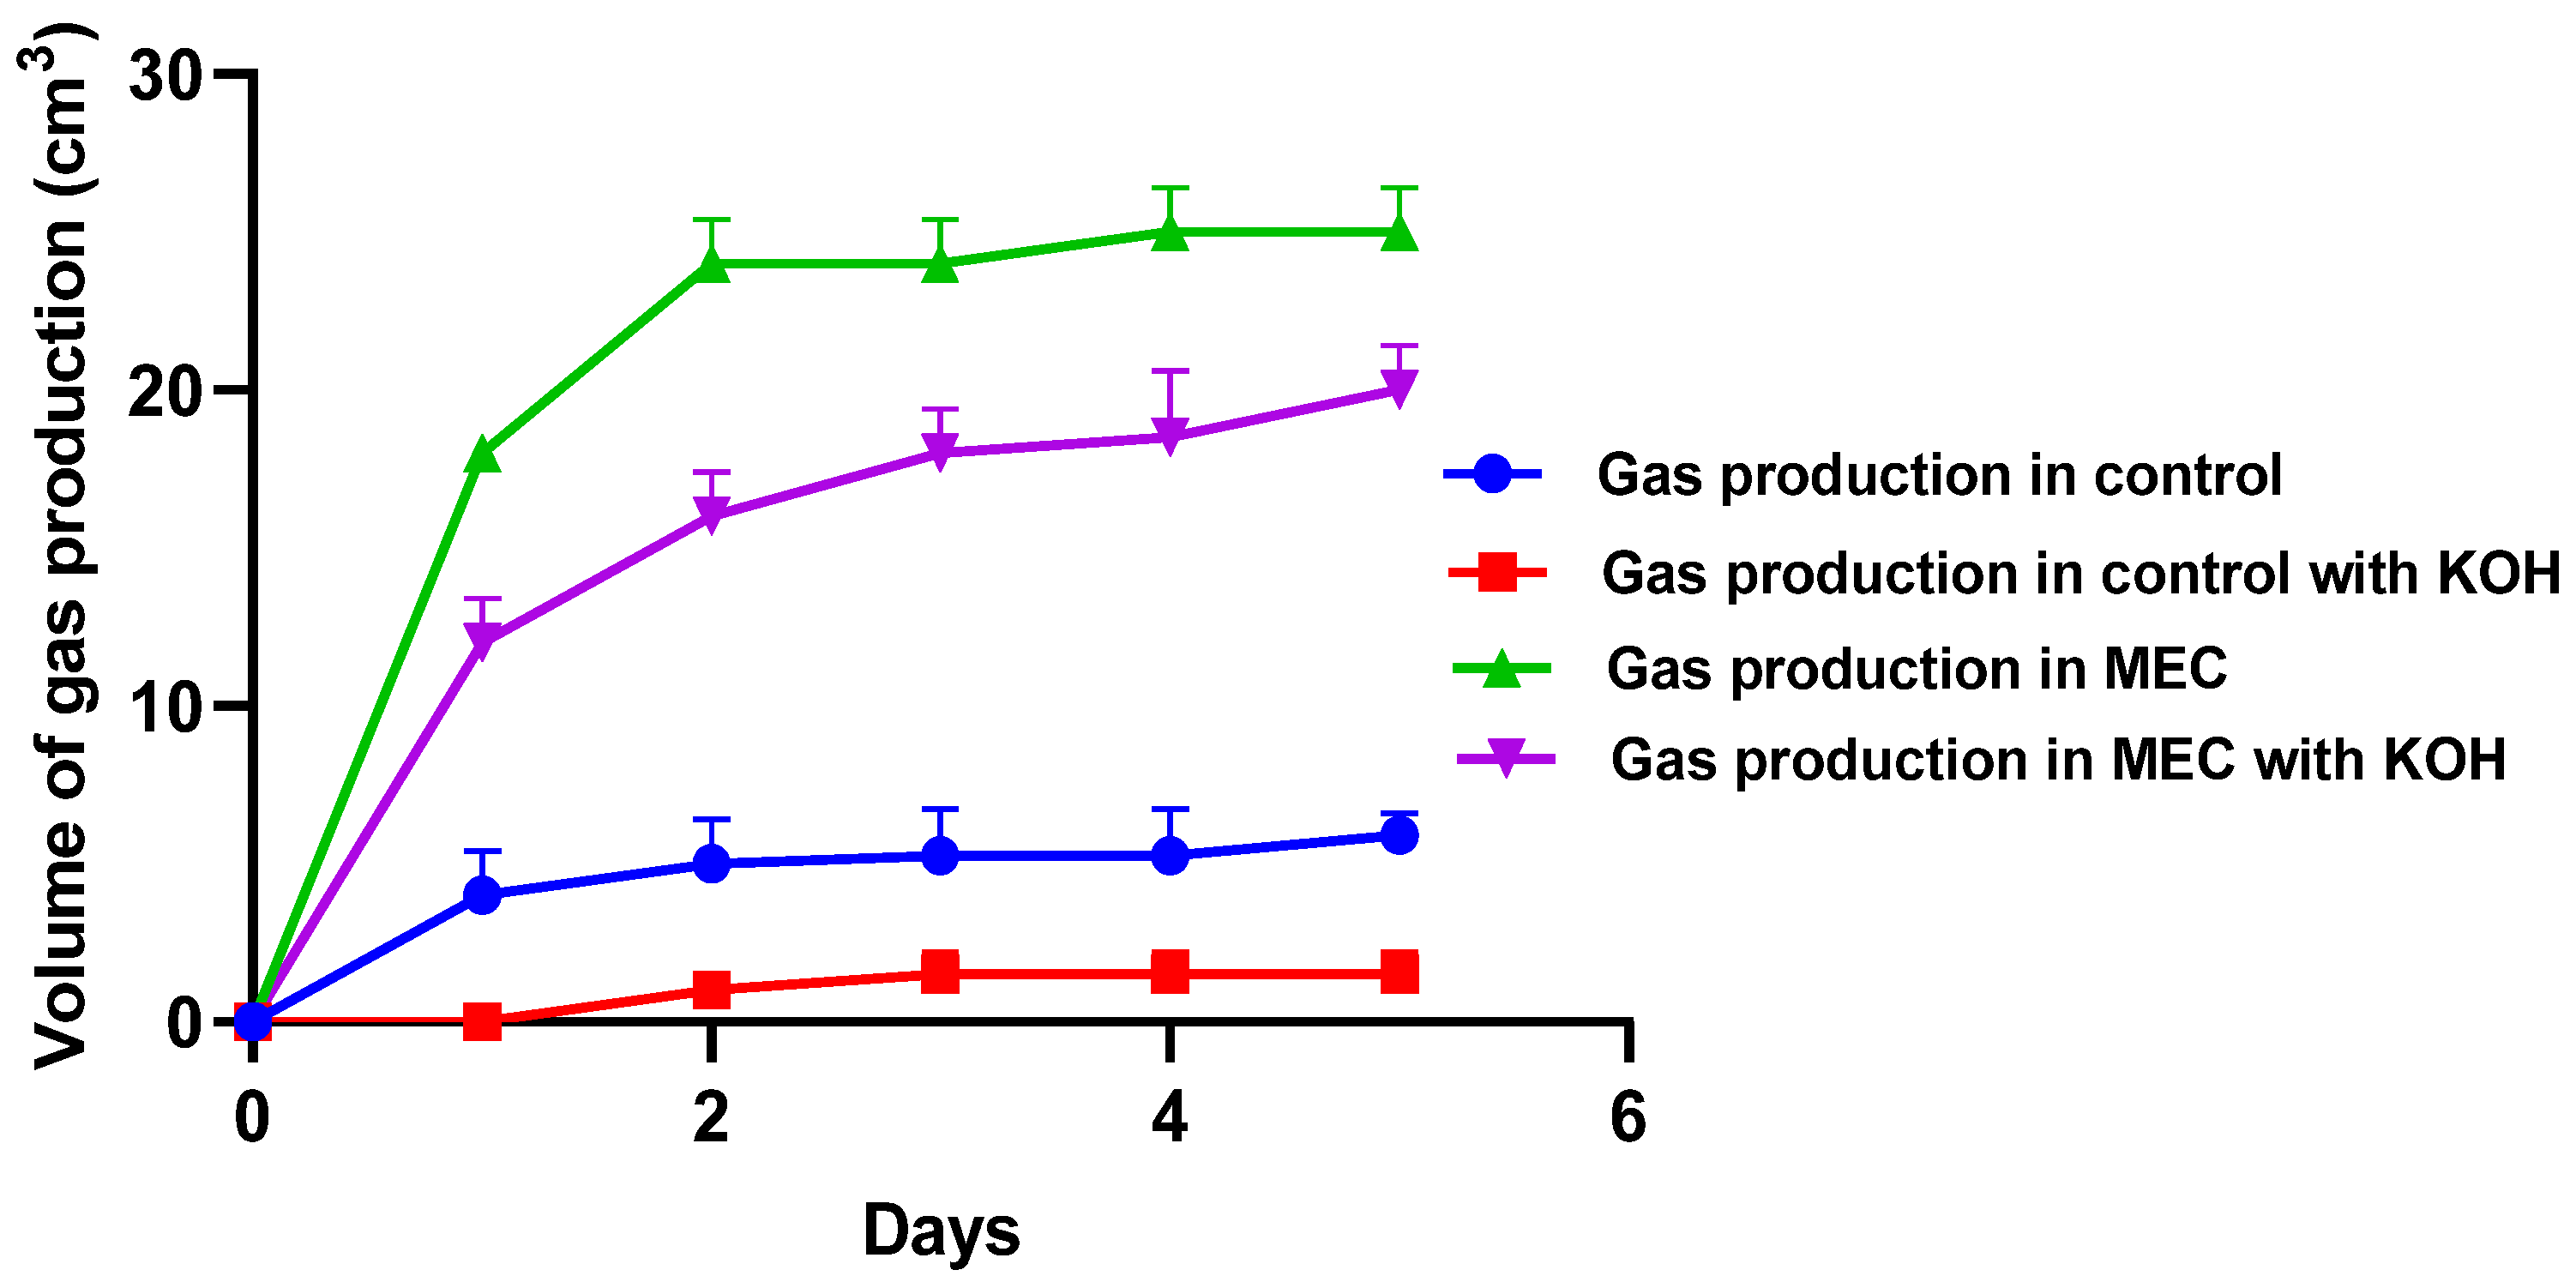
The biogas produced is normally a mixture of CH4 and CO2. Biogas collection in a reservoir containing KOH (solid) is known to effectively absorb CO2 from the mixture to form K2CO3 and water. K2CO3 is thermodynamically a stable compound. In the presence of water, K2CO3 will give rise to carbonate (CO32−) and bicarbonate ions (HCO3) in solution [33]. In our experiments (Figure 4), the amount of biogas produced in the presence of KOH was reduced to 20 cm3 from 25 cm3 in its absence, suggesting that the CO2 produced was absorbed, and further, the amount of CO2 produced was about 20% of the total biogas produced in an MEC. On the other hand, about 70% of the biogas produced in the control (no applied current) was CO2. This clearly indicates that methanogenesis in an MEC at 2 V produces more CH4 in comparison with controls without the applied current. Clearly, the applied current in an MEC was more effective in reducing CO2 to CH4. Consistent with our observation is the fact that others have also shown methane production in MEC to increase by ~40% as compared to conventional anaerobic digestion [34].

3.3.4. Variation in Biogas Production with the Use of MWCNT Coated Electrodes

Previously, we have demonstrated that use of MWCNT (multi-walled carbon nanotube)-coated electrodes in an MEC is more effective in fermentation and electricity generation [17]. In this study, we find that the use of MWCNT-coated graphite as electrodes, as compared to the use of normal graphite electrodes, results in a 23% increase in the amount of biogas produced (Figure 5). Graphite felt electrodes are inert, and coating them with MWCNT results in increased surface area [35]. The increase in biogas production could be attributed to the above changes on the surface of the electrode. Further, carbon nanotubes (CNTs) are known to offer extraordinarily high mechanical strength, great chemical stability, and high electrical conductivity [36]. Carbon nanotubes have potent electrical conductivity, and their wide surface area has been demonstrated to enhance electron transport between microbial cells and electrodes. Methane production could increase as a result of the methanogenic bacteria’s higher metabolic activity carried on by this improved electron transfer [37]. This has an impact on the development of biofilms, bacterial adhesion, and electron transfer efficiency, all of which are essential for bacterial growth and metabolic activity [38].
As per the results described here, the use of MEC enhanced biogas production by 65-fold at 18 °C, and it was further enhanced by 23% by coating the electrodes with CNTs. It is expected that similar and/or higher enhancement of biogas will occur at higher temperatures.

3.4. Removal of COD and Reducing Sugars

The COD and reducing sugar content in the MEC and control fermenter contents was monitored daily during the five days of their operation at 18 °C (Figure 6). The initial COD of the sample was found to be 438 mg/L. After fermentation for five days, the COD of the fermenter contents was found to be decreased by 41.55% (256 mg/L) in MEC and 8.6% in control (400 mg/L). This is consistent with the fact that as the soluble organic matter was gradually converted to CH4 and CO2, the COD decreases [28]. The initial concentration of reducing sugars in the fermenter sample was 0.515 mg/L. This was decreased to 0.013 mg/mL (98% reduction) in the MEC contents and 0.369 mg/L (28.3% reduction) in the control fermenter contents on the fifth day. Clearly, most of the reducing sugars were fermented/consumed in the MEC, but not so effectively in the control. Given that methanogenic archaea populations play a significant part in anaerobic waste treatments, the finding indicates that the conversion of soluble sugars to CH4 and CO2 is higher and faster in MEC than in basic anaerobic digestion [39].

3.5. Change in the pH If the Anaerobic Reactor Contents

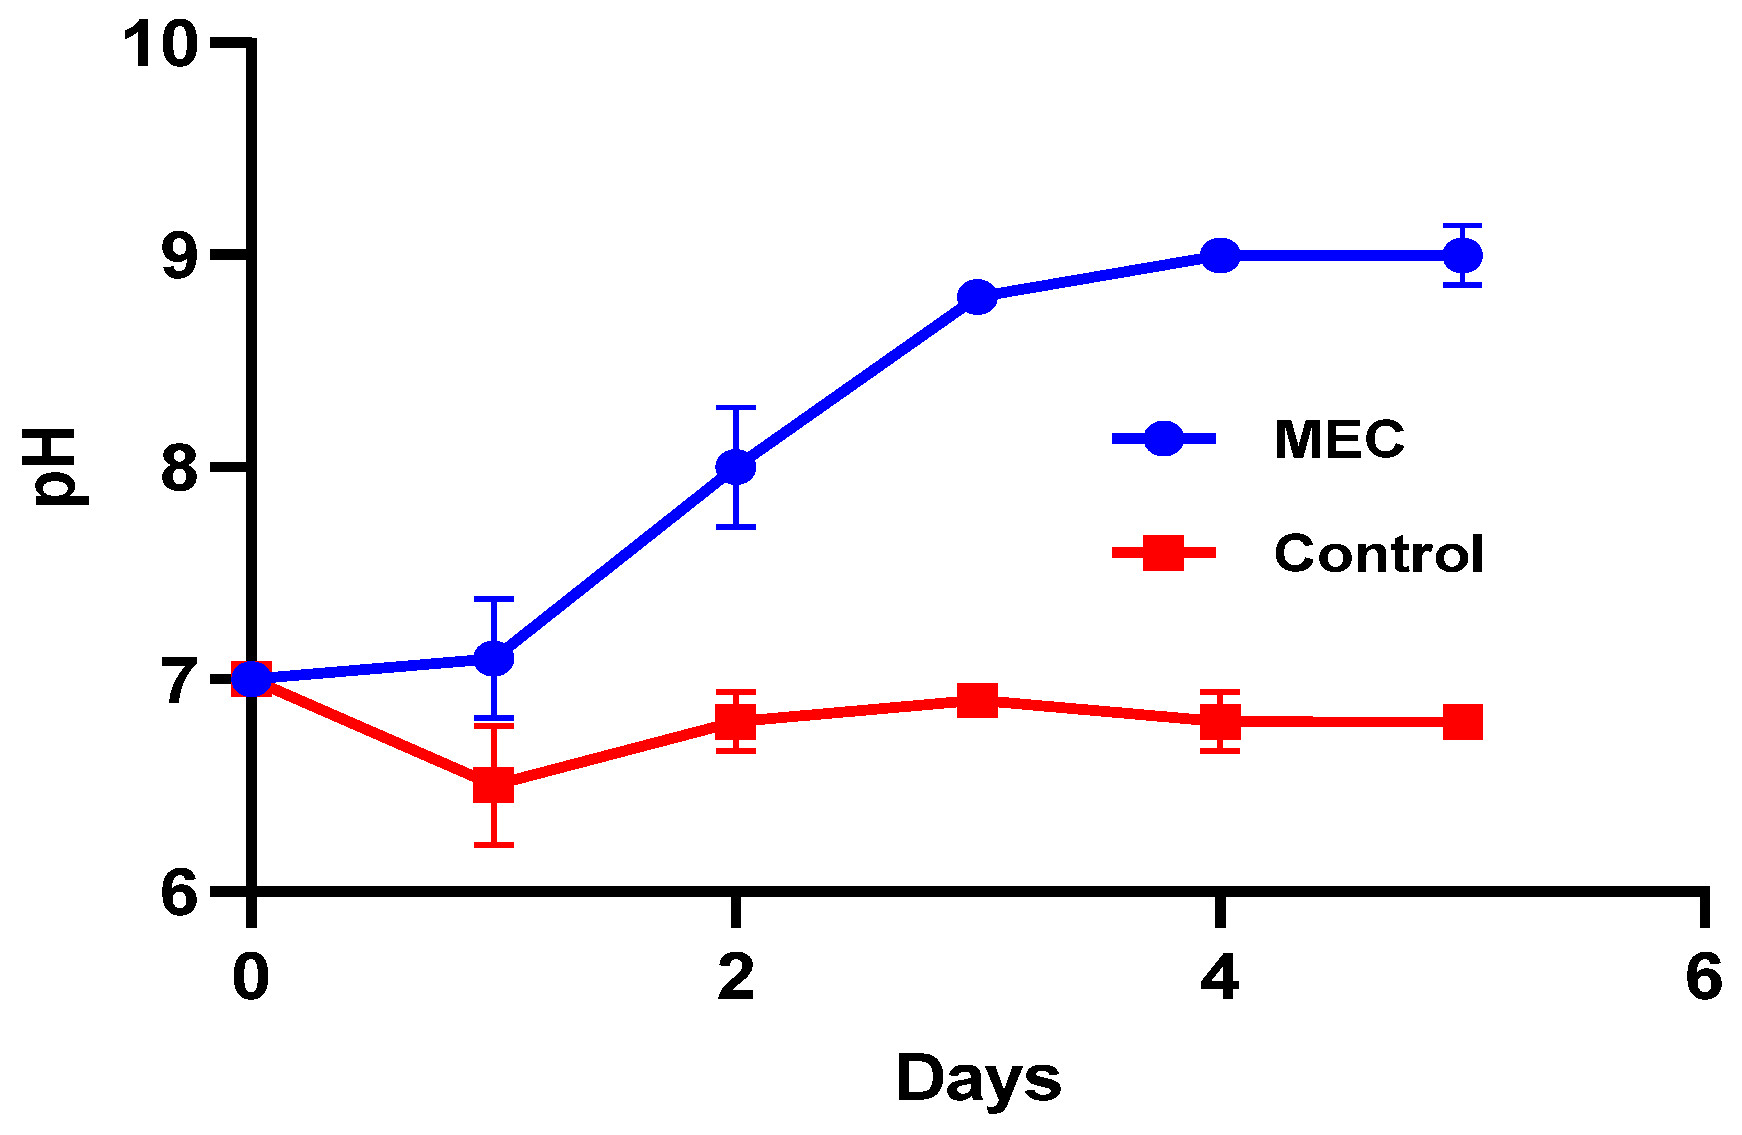
The pH of the MEC contents increased from pH 7.0 to about 9.0 at the end of the 5th day of anerobic digestion (Figure 7). On the other hand, there was no significant change in the pH of the contents of the control fermenter for up to 5 days (Figure 7). It is known that the cathodic methanogenesis consumes H+ ions for the reduction of CO2, which, in-turn, results in an increase in pH [40]. Our observation that the pH of the MEC-anaerobic reactor contents increased from pH 7 to pH 9 was constant with the latter expectation. Methanogens proliferate very well in the pH range of 6–8, and are inactivated by an alkaline pH of 9 to reduce methane generation at 2 V. Given the above, biogas production was restricted for 5 days [40].

3.6. Scanning Electron Microscopy (SEM) Analysis of the Electrodes after Fermentation

The structural changes in the graphite felt electrodes after MWCNT coating and bacterial adhesion on the membrane was analyzed using an SEM (Figure 8). Before the inoculation of microorganisms, the UGE and CGE’s surfaces were flaky but smooth (Panels A and B). Post 5 days of MEC fermentation, noticeable modifications took place on the surface of the electrodes, e.g., microspheres developed and were deposited on the electrode surface for the CGE (Panel C). The microorganism groups and electrode substrate were, significantly, observed to be attached to the CGE. It is well known that the intriguing subsets of microbes are essential for the transport of electrons from bacteria to the electrode [41]. This indicates that there were more microbes attached to the electrode, and more electrons were created by them. The outcomes show that the electrochemical activity of MECs is enhanced by CGE with higher microbial concentrations.

3.7. Cyclic Voltammetry Measurements

Cyclic voltammetry illustrated a typical sigmoidal shape in which −1 to −0.5 V represented reduction, while the range above 0 V represented oxidation (Figure 9). The range of −0.4 V to 0 V depicted double-layer charging. An anodic peak was observed between 0.02 and 0.03 A by applying 0.01–0.2 V electric potential. The bioelectrochemical behavior of microorganisms in the anaerobic reactor with the MEC was examined using cyclic voltammetry. Two anodic peaks could be seen on the cyclic voltammogram. High current levels indicated that bacteria adhering to the anode were actively involved in anodic electron transfer. Consistent with our observation is a previous report that observed a similar peak at 0.15 V, representing the electrochemical activity of methanogens [42]. These peaks most likely show that the consortium’s microorganisms have the electrochemical capacity to take electrons from the anode or extracellular electron transfer components. In order to execute CV, a working electrode’s potential was cycled, and the resulting current was measured [43]. Clearly, CV provides information about the electron transfer kinetics, mechanism, and reversibility of redox reactions happening at an electrode surface [44].

3.8. Characterization of Microbes Present in Methanogenic Inoculum

Microbes were isolated from the acclimatized cow dung using DMSZ 825 media so that anaerobic organisms would grow. The isolation of methanogens required a strictly anoxic environment, which was difficult to maintain. The growth of anaerobic bacteria was facilitated by DMSZ 825 media. The isolates were Gram-negative and facultative anaerobes. Serratia liquefaciens is a species of Gram-negative bacteria in the family Enterbacteriaceae and genus Serratia. It is found in plants and the digestive tract of rodents. It is a straight-rod-shaped bacterium. During the anaerobic digestion process, Enterobacteriaceae can form syntrophic partnerships with other microorganisms. The amount and type of biogas generated are influenced by Enterobacteriaceae activity [45]. In our cultures, we were able to isolate five major isolates, and we have successfully characterized and identified two isolates, viz., P1D and P2D, as described below.
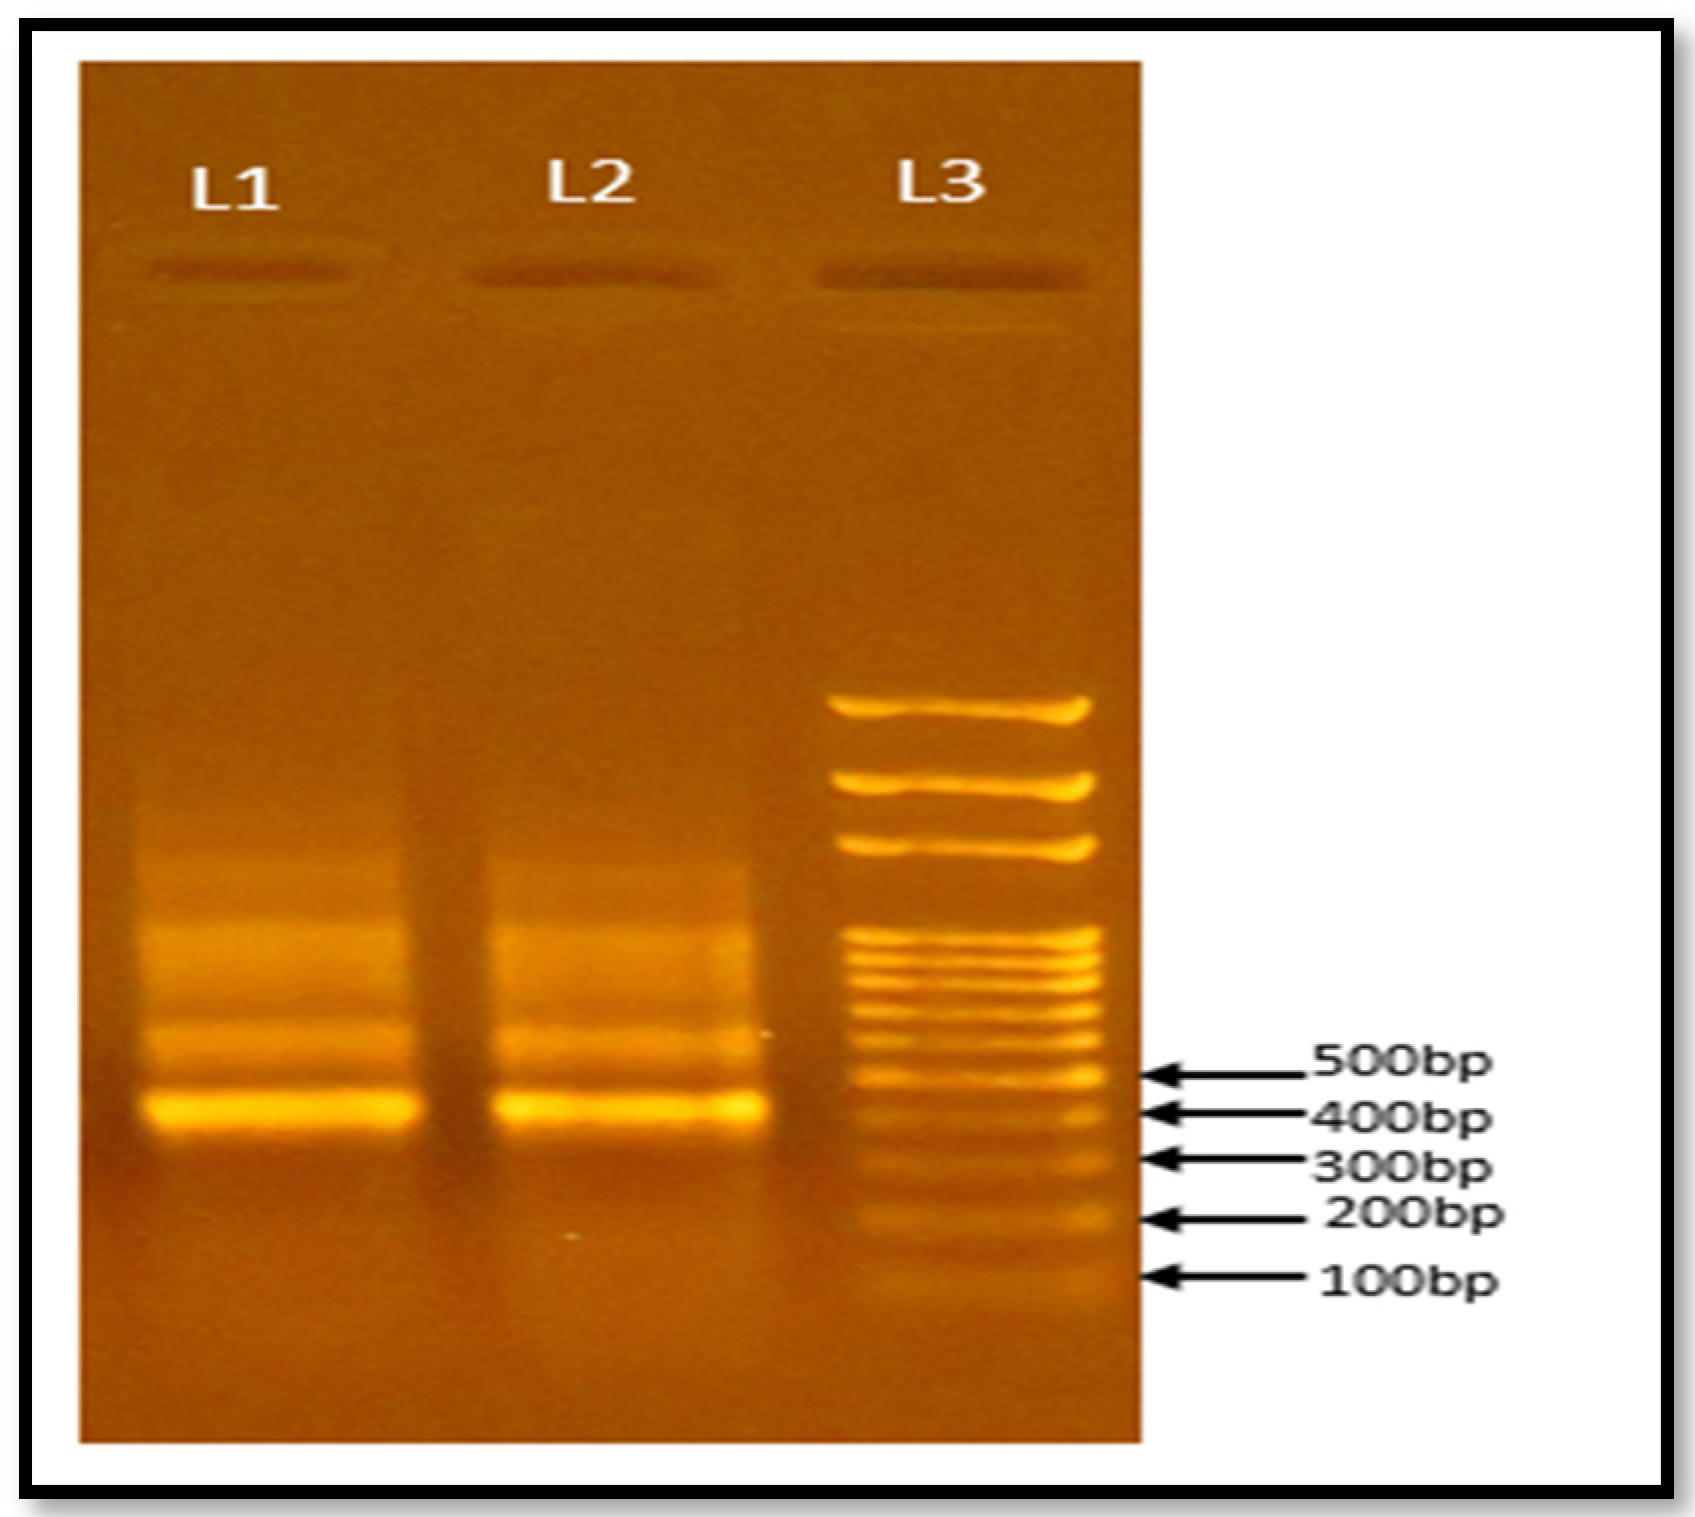
The genomic DNA of two bacterial isolates were extracted, and PCR was performed successfully using rRNA primers (Figure 10). The size of the PCR product was found to be about 350 bp. Based on the sequences of the PCR products, a phylogenetic tree was created to reveal the evolutionary and functional connections between sequences, as well as to identify the individual species that make up gene families (Figure 11). The construction of the phylogenetic tree also provided the extent of the biological diversity of the sequence of the P1D isolate with Serratia liquefaciens and the sequence of P2D with Zoballella taiwanensis, respectively. Serratia liquefaciens is facultative anaerobic bacteria and indicates high adaptation potential [45,46]. It has been shown that S. liquefaciens generated short-chain fatty acids by fermenting organic materials in anaerobic conditions. These fatty acids act as building blocks with which methanogenic bacteria can generate methane [46,47]. Zoballella taiwanensis species have been shown to break down complex polymers into simpler molecules that can be used by methanogenic bacteria to produce methane during the hydrolysis and fermentation stages of the breakdown of organic waste [48].

4. Conclusions

A laboratory-scale MEC with enhanced biogas production that can be operated even at a relatively low temperature (18 °C) has been successfully developed and implemented. At 18 °C, by supplying 2 V, the MEC system described herein resulted in 65-fold more biogas production as compared to the control. At 37 °C, the MEC produces the highest amount of biogas (25 cm3). A nearly 23% increment in the biogas production was observed with the use of MWCNT-coated graphite felt as electrodes. The MEC showed significant reduction in COD (41.55%) and almost complete consumption of reducing sugar sugars (98%), suggesting that it is a suitable system for feed-lot cow dung/manure treatment. Further, we have isolated five major anerobic bacteria from the inoculum used in the fermenters, and two of isolates were characterized successfully and are found to be identical to Serratia liquefaciens and Zoballela taiwanensis. Recent studies show that the electromethanogenesis plays a significant role in the production of value-added products, including biogas. Clearly, via this pilot study, we have successfully demonstrated the use of an MEC to improve or manage waste treatment by converting waste to energy. The feasibility of this technology in Nepal is yet to be implemented at a large scale, and we hope to be part of that implementation in the near future. Such an implementation, we strongly believe, will result in the incorporation of MECs by families that own cows and other bovine species, especially in rural areas, to increase biogas production (enough for everyday cooking). Further research and development, as well as the adoption MECs at ranches to treat animal dung and at sewer treatment plants in cities and municipalities, would lead to the production of value added products from waste.

Author Contributions

Conceptualization, J.J., L.S. and T.B.; methodology, P.B., P.P., P.D., B.P., S.B. and A.P.Y.; software, P.B., P.P., P.D. and B.P.; validation, P.B., P.P., P.D., B.P., S.B. and A.P.Y.; formal analysis, P.B., J.J., B.P., A.P.Y. and T.B.; investigation, P.B., P.P., P.D., B.P., S.B. and A.P.Y.; resources, J.J., A.P.Y., L.S. and T.B.; data curation, P.B., P.P., P.D., B.P., S.B., A.P.Y., J.J. and L.S.; writing—original draft preparation, P.B. and P.P.; writing—review and editing, J.J., A.P.Y., L.S. and T.B.; visualization, P.P. and P.B.; supervision, J.J., A.P.Y., L.S. and T.B.; project administration, J.J.; funding acquisition, J.J. All authors have read and agreed to the published version of the manuscript.

Funding

This research was funded by Tribhuvan University, Research Directorate, Rector’s Office, Tribhuvan University under National Priority Area Research Project grant TU-NPAR-077/78-ERG-07 (JJ and APY).

Institutional Review Board Statement

Not applicable.

Informed Consent Statement

Not applicable.

Data Availability Statement

Data are contained within the article. The data presented in this study are available on request from the corresponding author.

Acknowledgments

The authors would like to thank Tribhuvan University, Research Directorate, Rector’s Office: National Priority Area Research Project grant TU-NPAR-077/78-ERG-07. The grant was awarded to the principal investigator (PI) of this project, Amar Prasad Yadav, Central Department of Chemistry. The laboratory and instrumental facilities provided by Central Department of Biotechnology and Central Department of Chemistry, Tribhuvan University, Kirtipur, Nepal, is gratefully acknowledged.

Conflicts of Interest

The authors declare no conflicts of interest.

Appendix A

Table A1. Detailed description of DMSZ 825 media.
S.N Components Amount
1 CaCl2 × 2 H2O 0.10 g
2 K2HPO4 0.30 g
3 KH2PO4 0.30 g
4 MgCl2 × 6 H2O 0.20 g
5 KCl 0.10 g NaCl 0.60 g
6 NH4 Cl 1.00 g
7 Trace element solution (i)10.00 mL
8 Na-acetate 0.50 g
9 Na-resazurin solution (0.1% w/v) 0.50 mL
10 Vitamin solution (ii)10.00 mL
11 Yeast extract 1 g
12 Na2S × 9 H2O0.50 g
13 L-Cysteine-HCl × H2O0.50 g
14 NaHCO34.00 g
15 Distilled water 1000.00 mL
(i)Trace element solution
S.N Component Amount
1. Nitrilotriacetic acid 1.50 g
2. MgSO4 × 7 H2O3.00 g
3. MnSO4 × H2O0.50 g
4. NaCl 1.00 g
5. FeSO4 × 7 H2O 0.10 g
6. CoSO4 × 7 H2O 0.18 g
7. CaCl2 × 2 H2O 0.10 g
8. CuSO4 × 5 H2O0.01 g
9. KAl(SO4)2 × 12 H2O0.02 g
10. H3BO3 0.01 g
11. Na2MoO4 × 2 H2O 0.01 g
12. NiCl2 × 6 H2O 0.03 g
13. Na2SeO3 × 5 H2O0.30 mg
14. Na2WO4 × 2 H2O0.40 mg
(ii) Vitamin solution:
S.N Components Amount
1. Biotin 2.00 mg
2. Folic acid 2.00 mg
3. Pyridoxine-HCl 10.00 mg
4. Thiamine-HCl × 2 H2O5.00 mg
5. Riboflavin 5.00 mg
6. Nicotinic acid 5.00 mg
7. D-Ca-pantothenate 5.00 mg
8. Vitamin B12 0.10 mg
9. p-Aminobenzoic acid 5.00 mg
10. Lipoic acid 5.00 mg
11. Distilled water l L

References

  1. Sampat, A.M.; Ruiz-Mercado, G.J.; Zavala, V.M. Economic and Environmental Analysis for Advancing Sustainable Management of Livestock Waste: A Wisconsin Case Study. ACS Sustain. Chem. Eng. 2018, 6, 6018–6031. [Google Scholar] [CrossRef] [PubMed]
  2. Dhungana, P.; Prajapati, B.; Maharjan, S.; Joshi, J. Current Trends in Lignocellulosic Bioethanol Production. Int. J. Appl. Sci. Biotechnol. 2022, 10, 1–11. [Google Scholar] [CrossRef]
  3. Demirbas, A.; Taylan, O.; Kaya, D. Biogas production from municipal sewage sludge (MSS). Energy Sources Part A Recovery Util. Environ. Eff. 2016, 38, 3027–3033. [Google Scholar] [CrossRef]
  4. Qazi, W.A.; Abushammala, M.F.; Mohammed-Hasham, A.; Younes, M.K. Waste-to-Energy Technologies: A Literature Review. J. Solid Waste Technol. Manag. 2018, 44, 387–409. [Google Scholar] [CrossRef]
  5. Bharathiraja, B.; Sudharsana, T.; Jayamuthunagai, J.; Praveenkumar, R.; Chozhavendhan, S.; Iyyappan, J. RETRACTED: Biogas production–A review on composition, fuel properties, feed stock and principles of anaerobic digestion. Renew. Sustain. Energy Rev. 2018, 90, 570–582. [Google Scholar] [CrossRef]
  6. Faoagali, J. Meet the chief examiner microbiology 2010. Pathology 2010, 42, S51. [Google Scholar] [CrossRef]
  7. Li, Y.; Park, S.Y.; Zhu, J. Solid-state anaerobic digestion for methane production from organic waste. Renew. Sustain. Energy Rev. 2011, 15, 821–826. [Google Scholar] [CrossRef]
  8. Putri, D.A.; Saputro, R.R.; Budiyono, B. Biogas Production from Cow Manure. Int. J. Renew. Energy Dev. 2012, 1, 61–64. [Google Scholar] [CrossRef]
  9. Taherzadeh, M.; Bolton, K.; Wong, J.; Pandey, A. Sustainable Resource Recovery and Zero Waste Approaches; Elsevier: Amsterdam, The Netherlands, 2019; Available online: http://books.google.ie/books?id=mH2jDwAAQBAJ&pg=PA181&dq=978-1-910154-03-8&hl=&cd=1&source=gbs (accessed on 20 March 2024).
  10. Logan, B.E.; Rabaey, K. Conversion of Wastes into Bioelectricity and Chemicals by Using Microbial Electrochemical Technologies. Science 2012, 337, 686–690. [Google Scholar] [CrossRef]
  11. Cheng, S.; Xing, D.; Call, D.F.; Logan, B.E. Direct Biological Conversion of Electrical Current into Methane by Electromethanogenesis. Environ. Sci. Technol. 2009, 43, 3953–3958. [Google Scholar] [CrossRef]
  12. Li, S.; Chen, G. Factors Affecting the Effectiveness of Bioelectrochemical System Applications: Data Synthesis and Meta-Analysis. Batteries 2018, 4, 34. [Google Scholar] [CrossRef]
  13. AOAC, H.W. International A: Official Methods of Analysis of the AOAC International; The Association: Arlington County, VA, USA, 2000. [Google Scholar]
  14. Feldsine, P.T.; Abeyta, C.; Andrews, W.H. AOAC INTERNATIONAL Methods Committee Guidelines for Validation of Qualitative and Quantitative Food Microbiological Official Methods of Analysis. J. AOAC Int. 2002, 85, 1187–1200. [Google Scholar] [CrossRef] [PubMed]
  15. Valo, A.; Carrère, H.; Delgenès, J.P. Thermal, chemical and thermo-chemical pre-treatment of waste activated sludge for anaerobic digestion. J. Chem. Technol. Biotechnol. 2004, 79, 1197–1203. [Google Scholar] [CrossRef]
  16. Olson, B.J.; Markwell, J. Assays for determination of protein concentration. Curr. Protoc. Pharmacol. 2007, 3, 3A. [Google Scholar] [CrossRef] [PubMed]
  17. Maharjan, R.; Dhungana, P.; Sreerama, L.; Bhatt, P.; Prajapati, B.; Poudel, P.; Kandel, P.; Khadka, M.; Parajuli, A.; Joshi, J. The use of microbial fuel cell for efficient treatment of cauliflower waste and generation of electricity. Int. J. Sustain. Energy 2023, 42, 304–317. [Google Scholar] [CrossRef]
  18. Joshi, J.; Bhattarai, T.; Sreerama, L. Efficient Methods of Pretreatment for the Release of Reducing Sugars from Lignocellulosic Biomass Native to Nepal and Characterization of Pretreated Lignocellulosic Biomass Efficient Methods of Pretreatment for the Release of Reducing Sugars from Lignocel. Int. J. Adv. Biotechnol. Res. 2018, 9, 9–23. [Google Scholar]
  19. Houba, V.J.G.; Temminghoff, E.J.M. Behavior of phosphate in soil extracts using weak unbuffered extracting solutions. Commun. Soil Sci. Plant Anal. 1999, 30, 1367–1370. [Google Scholar] [CrossRef]
  20. Minilu Woldemariam, D.; Singh Chandravanshi, B. Concentration levels of essential and non-essential elements in selected Ethiopian wines. Bull. Chem. Soc. Ethiop. 2011, 25, 65852. [Google Scholar] [CrossRef]
  21. Joshi, J.; Dhungana, P.; Prajapati, B.; Maharjan, R.; Poudyal, P.; Yadav, M.; Mainali, M.; Yadav, A.P.; Bhattarai, T.; Sreerama, L. Enhancement of Ethanol Production in Electrochemical Cell by Saccharomyces cerevisiae (CDBT2) and Wickerhamomyces anomalus (CDBT7). Front. Energy Res. 2019, 7, 70. [Google Scholar] [CrossRef]
  22. Wang, Q.; Kuninobu, M.; Ogawa, H.I.; Kato, Y. Degradation of volatile fatty acids in highly efficient anaerobic digestion. Biomass Bioenergy 1999, 16, 407–416. [Google Scholar] [CrossRef]
  23. Molina, A.; González, J.; Laborda, E.; Wang, Y.; Compton, R.G. Catalytic mechanism in cyclic voltammetry at disc electrodes: An analytical solution. Phys. Chem. Chem. Phys. 2011, 13, 14694. [Google Scholar] [CrossRef] [PubMed]
  24. Stieglmeier, M.; Wirth, R.; Kminek, G.; Moissl-Eichinger, C. Cultivation of Anaerobic and Facultatively Anaerobic Bacteria from Spacecraft-Associated Clean Rooms. Appl. Environ. Microbiol. 2009, 75, 3484–3491. [Google Scholar] [CrossRef]
  25. Natarajan, V.P.; Zhang, X.; Morono, Y.; Inagaki, F.; Wang, F. A Modified SDS-Based DNA Extraction Method for High Quality Environmental DNA from Seafloor Environments. Front. Microbiol. 2016, 7, 986. [Google Scholar] [CrossRef]
  26. Tomlinson, M.S.; De Carlo, E.H. The need for high resolution time series data to characterize hawaiian streams1. Jawra J. Am. Water Resour. Assoc. 2003, 39, 113–123. [Google Scholar] [CrossRef]
  27. Hoekstra, N.; Bosker, T.; Lantinga, E. Effects of cattle dung from farms with different feeding strategies on germination and initial root growth of cress (Lepidium sativum L.). Agric. Ecosyst. Environ. 2002, 93, 189–196. [Google Scholar] [CrossRef]
  28. Feng, Y.; Zhang, Y.; Chen, S.; Quan, X. Enhanced production of methane from waste activated sludge by the combination of high-solid anaerobic digestion and microbial electrolysis cell with iron–graphite electrode. Chem. Eng. J. 2015, 259, 787–794. [Google Scholar] [CrossRef]
  29. Cai, W.; Liu, W.; Zhang, Z.; Feng, K.; Ren, G.; Pu, C.; Li, J.; Deng, Y.; Wang, A. Electro-driven methanogenic microbial community diversity and variability in the electron abundant niche. Sci. Total Environ. 2019, 661, 178–186. [Google Scholar] [CrossRef]
  30. Tian, G.; Yang, B.; Dong, M.; Zhu, R.; Yin, F.; Zhao, X.; Wang, Y.; Xiao, W.; Wang, Q.; Zhang, W.; et al. The effect of temperature on the microbial communities of peak biogas production in batch biogas reactors. Renew. Energy 2018, 123, 15–25. [Google Scholar] [CrossRef]
  31. Li, Y.; Wang, S.; Dong, R.; Li, X. A large cathode surface area promotes electromethanogenesis at a proper external voltage in a single coaxial microbial electrolysis cell. Sci. Total Environ. 2023, 868, 161721. [Google Scholar] [CrossRef] [PubMed]
  32. Ding, A.; Yang, Y.; Sun, G.; Wu, D. Impact of applied voltage on methane generation and microbial activities in an anaerobic microbial electrolysis cell (MEC). Chem. Eng. J. 2016, 283, 260–265. [Google Scholar] [CrossRef]
  33. Rastegar, Z.; Ghaemi, A. CO2 absorption into potassium hydroxide aqueous solution: Experimental and modeling. Heat Mass Transf. 2021, 58, 365–381. [Google Scholar] [CrossRef]
  34. Zhao, W.; Su, X.; Zhang, Y.; Xia, D.; Hou, S.; Zhou, Y.; Fu, H.; Wang, L.; Yin, X. Microbial electrolysis enhanced bioconversion of coal to methane compared with anaerobic digestion: Insights into differences in metabolic pathways. Energy Convers. Manag. 2022, 259, 115553. [Google Scholar] [CrossRef]
  35. Bajracharya, S.; ter Heijne, A.; Dominguez Benetton, X.; Vanbroekhoven, K.; Buisman, C.J.; Strik, D.P.; Pant, D. Carbon dioxide reduction by mixed and pure cultures in microbial electrosynthesis using an assembly of graphite felt and stainless steel as a cathode. Bioresour. Technol. 2015, 195, 14–24. [Google Scholar] [CrossRef]
  36. Merkoçi, A.; Pumera, M.; Llopis, X.; Pérez, B.; del Valle, M.; Alegret, S. New materials for electrochemical sensing VI: Carbon nanotubes. TrAC Trends Anal. Chem. 2005, 24, 826–838. [Google Scholar] [CrossRef]
  37. Salvador, A.F.; Martins, G.; Melle-Franco, M.; Serpa, R.; Stams, A.J.; Cavaleiro, A.J.; Pereira, M.A.; Alves, M.M. Carbon nanotubes accelerate methane production in pure cultures of methanogens and in a syntrophic coculture. Environ. Microbiol. 2017, 19, 2727–2739. [Google Scholar] [CrossRef]
  38. Liu, J.; Liu, F.; Yu, J.; Wang, Q.; Li, Z.; Liu, K.; Xu, C.; Yu, H.; Xiao, L. Proteomics reveal biomethane production process induced by carbon nanotube. Environ. Res. 2021, 200, 111417. [Google Scholar] [CrossRef]
  39. Tabatabaei, M.; Rahim, R.A.; Abdullah, N.; Wright, A.D.G.; Shirai, Y.; Sakai, K.; Sulaiman, A.; Hassan, M.A. Importance of the methanogenic archaea populations in anaerobic wastewater treatments. Process Biochem. 2010, 45, 1214–1225. [Google Scholar] [CrossRef]
  40. Wagner, R.C.; Regan, J.M.; Oh, S.E.; Zuo, Y.; Logan, B.E. Hydrogen and methane production from swine wastewater using microbial electrolysis cells. Water Res. 2009, 43, 1480–1488. [Google Scholar] [CrossRef]
  41. Zhang, F.; Pant, D.; Logan, B.E. Long-term performance of activated carbon air cathodes with different diffusion layer porosities in microbial fuel cells. Biosens. Bioelectron. 2011, 30, 49–55. [Google Scholar] [CrossRef]
  42. Bo, T.; Zhu, X.; Zhang, L.; Tao, Y.; He, X.; Li, D.; Yan, Z. A new upgraded biogas production process: Coupling microbial electrolysis cell and anaerobic digestion in single-chamber, barrel-shape stainless steel reactor. Electrochem. Commun. 2014, 45, 67–70. [Google Scholar] [CrossRef]
  43. Bao-Kang, J.; Jian-Rong, Z.; Zu-Xun, Z. Theory and application of cyclic voltammetry for measurement of fast electrode kinetics at microdisk electrode. Chin. J. Chem. 2010, 14, 338–347. [Google Scholar] [CrossRef]
  44. Harnisch, F.; Freguia, S. A Basic Tutorial on Cyclic Voltammetry for the Investigation of Electroactive Microbial Biofilms. Chem. Asian J. 2012, 7, 466–475. [Google Scholar] [CrossRef]
  45. Begrem, S.; Jérôme, M.; Leroi, F.; Delbarre-Ladrat, C.; Grovel, O.; Passerini, D. Genomic diversity of Serratia proteamaculans and Serratia liquefaciens predominant in seafood products and spoilage potential analyses. Int. J. Food Microbiol. 2021, 354, 109326. [Google Scholar] [CrossRef]
  46. Harirchi, S.; Wainaina, S.; Sar, T.; Nojoumi, S.A.; Parchami, M.; Parchami, M.; Varjani, S.; Khanal, S.K.; Wong, J.; Awasthi, M.K.; et al. Microbiological insights into anaerobic digestion for biogas, hydrogen or volatile fatty acids (VFAs): A review. Bioengineered 2022, 13, 6521–6557. [Google Scholar] [CrossRef]
  47. An, X.; Zong, Z.; Zhang, Q.; Li, Z.; Zhong, M.; Long, H.; Cai, C.; Tan, X. Novel thermo-alkali-stable cellulase-producing Serratia sp. AXJ-M cooperates with Arthrobacter sp. AXJ-M1 to improve degradation of cellulose in papermaking black liquor. J. Hazard. Mater. 2022, 421, 126811. [Google Scholar] [CrossRef]
  48. Sikora, A.; Detman, A.; Chojnacka, A.; Blaszczyk, M.K. Anaerobic Digestion: I. A Common Process Ensuring Energy Flow and the Circulation of Matter in Ecosystems. II. A Tool for the Production of Gaseous Biofuels. In Fermentation Processes; InTech: Rijeka, Croatia, 2017; Chapter 14; pp. 271–392. [Google Scholar] [CrossRef]
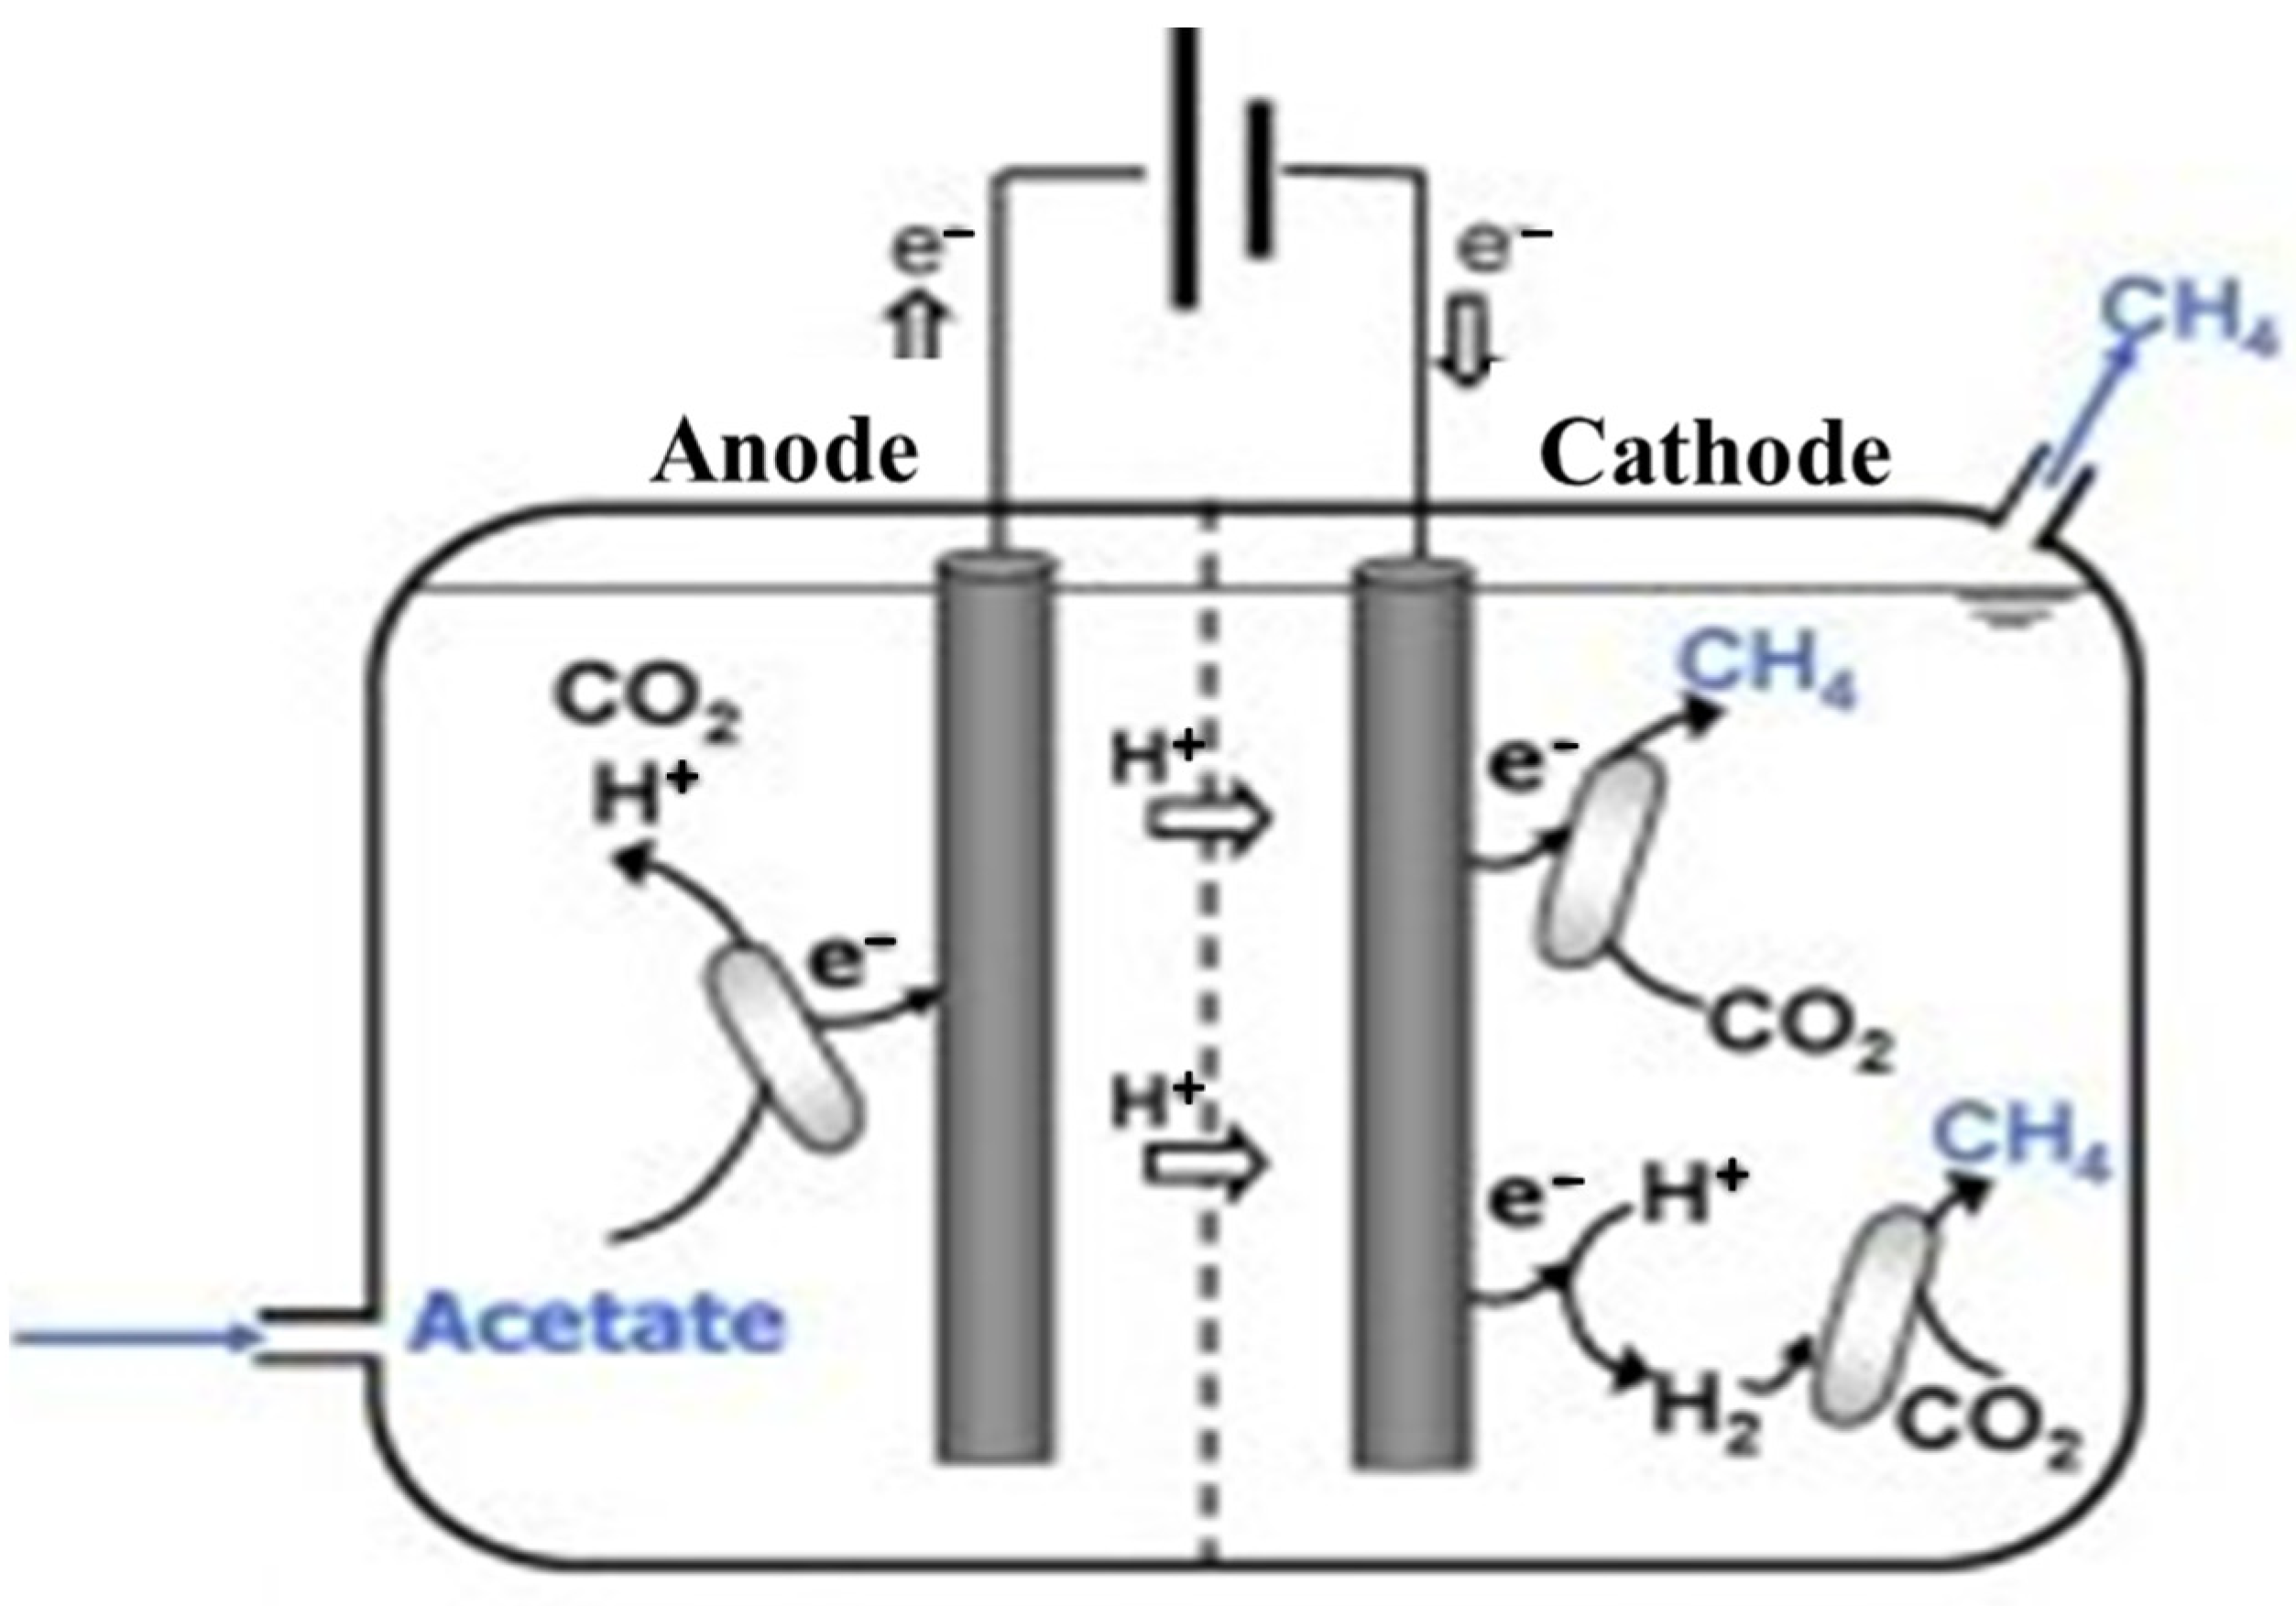
Figure 1. Microbial electrochemical cell (MEC). Microbial electrolysis cells employing biological anodes and cathodes are a novel and sustainable approach in the production of methane.
Biomass 04 00023 g001
Figure 2. Biogas production at different temperatures in control and MEC setups. Both setups (control and MEC) were incubated in their respective temperatures, and biogas production was monitored for up to 5 days. The applied electrical current used in the MEC setup is 2 V.
Biomass 04 00023 g002
Figure 3. Biogas production uses an MEC at different voltages as compared to control. Both MEC and control setups were incubated at 37 °C, and biogas production was monitored daily for up to 5 days.
Biomass 04 00023 g003
Figure 4. Biogas collection in the presence and absence of KOH pellet in the biogas collection syringe. Both control and MEC with 2 V setups were incubated at 37 °C, and gas was observed daily for up to 5 days.
Biomass 04 00023 g004
Figure 5. Biogas production uses MEC with an MWCNT-coated electrode and normal graphite electrode. The setups were incubated at 18 °C for up to 5 days.
Biomass 04 00023 g005
Figure 6. Determination of COD removal (Panel A) and reducing sugar removal (Panel B) in control and MEC. Control and MEC with 2 V were incubated at 18 °C using an MWCNT-coated electrode.
Biomass 04 00023 g006
Figure 7. Changes in the pH of the MEC with a supply of 2 V potential and in the control measured daily for up to 5 days.
Biomass 04 00023 g007
Figure 8. Scanning electron microscopy (SEM) of graphite electrodes. Panel (A) untreated graphite electrode (UGE); Panel (B) CNT-treated graphite electrode (CGE); Panel (C) CNT-treated graphite electrode with mixed culture (CGE+M) under 7000× magnification.
Biomass 04 00023 g008
Figure 9. A typical voltammogram of graphite felt used as a working electrode in the MEC and a calomel cell used as a reference electrode at the second day of setup in 2 V. The measurements were conducted between −0.8 V and +0.4 V, with the scan rate of 1 mV/s.
Biomass 04 00023 g009
Figure 10. Agarose gel electrophoresis (1.5% agarose) of unpurified PCR product. L1 and L2 are PCR products of P1D and P2D, and L3 is 100 bp, Biodyne DNA ladder (a ready-to-load molecular weight marker suitable for DNA fragment size determination on gel electrophoresis).
Biomass 04 00023 g010
Figure 11. Phylogenetic tree of (a) P1D isolate and (b) P2D isolate rebuilt using MEGA v.7.0.14 software and the neighbor-joining method. Sequence alignment was conducted using Cluster W in BioEdit’s multiple sequence alignment tools.
Biomass 04 00023 g011
Table 1. Determination of various physical and chemical components of cow dung substrate using different methods.
Analytical Parameters of Concentration
Total Soluble Protein116.25 ± 4.34 mg/L
COD438.75 ± 15.11 mg/L
Total phosphorus0.015 ± 0.007 mg/L
Reducing sugar 0.515 ± 0.033 mg/L
Potassium0.015 ± 0.002 mg/L
Arsenic1.3 × 10−7 mg/L
pH7.35 ± 0.15
TSS19.70 ± 1.5%
VSS10.50 ± 0.5%
Moisture content66.78 ± 2.5%
TSS: total suspended solid; VSS: volatile suspended solid; COD: chemical oxygen demand.
Table 2. Selection of the most suitable apparatus to setup anaerobic reactor through the hit and trial method and the best one selected for further operation.
Sl. #Type of ApparatusAnaerobic State Sampling PossibilityVolume Extension (Up to 1000 mL)Application of Electrodes
1Reagent Bottle+___
2Saline Bottle+___
3H-shaped two-chamber reactors++_+
4Aspirator Bottle++++
Table 3. Overall amount of biogas production in each of the anaerobic digester setups while optimizing different parameters.
S. N.Temperature and Exptl SetupVoltage InputElectrode UsedBiogas Production, cm3
137 °C; Control0 VN/A5
237 °C; MEC1 VGraphite electrodes8
32 VGraphite electrodes25
43 VGraphite electrodes2.2
54 VGraphite electrodes2
628 °C; Control0 VN/A0.45
728 °C; MEC2 VGraphite electrodes19
818 °C; Control0 VN/A0.2
918 °C; MEC2 VGraphite electrodes13
1018 °C; MEC2 VMWCNT coated anode16
MEC: microbial electrochemical cell; MWCNT: multi-walled carbon nanotubules.
Disclaimer/Publisher’s Note: The statements, opinions and data contained in all publications are solely those of the individual author(s) and contributor(s) and not of MDPI and/or the editor(s). MDPI and/or the editor(s) disclaim responsibility for any injury to people or property resulting from any ideas, methods, instructions or products referred to in the content.