Review

From Counters to Telemetry: A Survey of Programmable Network-Wide Monitoring

Independent Researcher, Bellevue, WA 98008, USA
Network 2025, 5(3), 38; https://doi.org/10.3390/network5030038
Submission received: 10 July 2025 / Revised: 20 August 2025 / Accepted: 8 September 2025 / Published: 16 September 2025

Abstract

Network monitoring is becoming increasingly challenging as networks grow in scale, speed, and complexity. The evolution of monitoring approaches reflects a shift from device-centric, localized techniques toward network-wide observability enabled by modern networking paradigms. Early methods like SNMP polling and NetFlow provided basic insights but struggled with real-time visibility in large, dynamic environments. The emergence of Software-Defined Networking (SDN) introduced centralized control and a global view of network state, opening the door to more coordinated and programmable measurement strategies. More recently, programmable data planes (e.g., P4-based switches) and in-band telemetry frameworks have allowed fine grained, line rate data collection directly from traffic, reducing overhead and latency compared to traditional polling. These developments mark a move away from single point or per flow analysis toward holistic monitoring woven throughout the network fabric. In this survey, we systematically review the state of the art in network-wide monitoring. We define key concepts (topologies, flows, telemetry, observability) and trace the progression of monitoring architectures from traditional networks to SDN to fully programmable networks. We introduce a taxonomy spanning local device measures, path level techniques, global network-wide methods, and hybrid approaches. Finally, we summarize open research challenges and future directions, highlighting that modern networks demand monitoring frameworks that are not only scalable and real-time but also tightly integrated with network control and automation.

1. Introduction

Modern networks are evolving at an unprecedented pace, driven by the rapid expansion of high capacity data centers, widespread cloud computing adoption, the rollout of low latency 5G infrastructures, and the explosive growth of IoT devices. This growth has led to enormous increases in traffic volume, diversity, and dynamism. Today’s networks span heterogeneous environments: enterprise backbones, multi-cloud platforms, edge computing nodes, and ISP infrastructures, requiring comprehensive, real-time monitoring to maintain performance, reliability, and security. The shift toward software-defined networking (SDN), network function virtualization (NFV), and programmable data planes has also introduced dynamic, reconfigurable components, raising new challenges for traditional monitoring approaches.
Network monitoring is critical for many applications (performance optimization, fault detection, traffic engineering, security threat identification), all of which rely on the ability to gather timely and accurate network information. Without effective monitoring, SLAs can be violated, attacks can go undetected, and system reliability can degrade. As networks continue to grow in scale and complexity, the difficulty of ensuring visibility across all components becomes a major bottleneck that directly impacts the ability to deliver fast, secure, and resilient services. For instance, in cloud environments where resources are dynamically allocated, traditional single point or coarse grained monitoring tools may miss transient faults or bottlenecks that impact user experience.
Limitations of Traditional Monitoring: Approaches based on centralized polling (e.g., SNMP), flow records (e.g., NetFlow/IPFIX), and simple device counters are increasingly insufficient in modern networks. These methods either generate excessive overhead or fail to provide the granularity and speed needed for real-time insights across distributed, dynamic infrastructure. For example, SNMP polling operates on a pull-based model with periodic queries, introducing latency and potential data loss especially under congestion. This can lead to visibility gaps and makes SNMP unsuitable for high speed or highly dynamic environments [1]. Likewise, flow level exports such as NetFlow [2], while useful for summarizing traffic patterns, often lack the per packet timing precision required to detect microbursts or short lived anomalies (e.g., in high frequency trading networks) [3]. Such limitations underscore the need for more advanced, real-time monitoring solutions that can handle the scale and complexity of today’s networks.
Impact of SDN on Monitoring: A major architectural shift in networking came with the adoption of Software-Defined Networking (SDN). SDN decouples the control plane from the data plane, consolidating control logic in a central controller. This centralization provides a global view of the network’s state and topology. Instead of each device making independent decisions and measurements, an SDN controller can orchestrate monitoring tasks across the network. For example, it can install rules on switches to collect fine-grained statistics, query all switches in unison for a snapshot of traffic counters, or reroute probing traffic as needed for diagnostics. By virtue of decoupling and centralization, SDN enables more coherent and flexible monitoring than was possible in traditional networks. Researchers have highlighted that SDN’s global visibility allow enhanced observability. Network managers can measure flows end-to-end, correlate events across multiple hops, and dynamically adjust what is measured based on network conditions. SDN-based monitoring frameworks demonstrate how a controller can gather network-wide statistics in real time or implement fast reactive monitoring (e.g., installing new rules when an anomaly is detected). At the same time, SDN introduces new challenges: the controller can become a bottleneck if overwhelmed with telemetry data, and the need to continuously communicate with distributed switches can add overhead. Nonetheless, SDN laid the foundation for a more intentional and programmable approach to network monitoring, treating measurement as a first class capability of the network control system.
Rise of Programmable Data Planes: Building on the SDN paradigm, the networking field has advanced further with programmable data plane technologies. Traditional switches and routers have fixed function pipelines for packet processing, limiting measurement to whatever counters or mirror ports the vendor provided. In contrast, programmable data planes (enabled by languages like P4 and programmable ASICs) allow operators to customize the packet processing pipeline itself. This means network devices can be programmed to support bespoke telemetry functions directly within the forwarding process. For example, operators can define new packet header formats to carry telemetry information, maintain state for certain flows, or implement custom triggers when specific traffic conditions occur. One prominent innovation in this space is in-band network telemetry (INT), where switches add telemetry data (like timestamps, queue lengths, or route identifiers) into packets as they traverse the network. This yields a detailed view of the path and performance experienced by every packet, at line rate, without requiring external probes. This level of flexibility frees monitoring from the constraints of vendor defined features and permits rapid experimentation with new observability techniques. It is important to note, however, that fully programmable networks also introduce complexity. Writing and maintaining correct measurement programs can be challenging, and ensuring that telemetry data are collected efficiently (without excessive overhead or data explosion) requires careful design. Overall, the move to programmable switches has significantly enriched what data can be collected, ushering in an era of network-wide observability where visibility is pervasive and can be tailored to the needs of applications and operators.
Recent developments in network monitoring have thus been driven by the convergence of these trends: centralized SDN control and data-plane programmability. Modern telemetry frameworks leverage both, allowing fine-grained, low overhead visibility into live traffic. Technologies such as INT and P4 enabled switches are gradually replacing traditional pull-based monitoring by enabling real-time, scalable insights directly from the network devices. This marks a shift away from siloed device level analysis toward truly network-wide monitoring, where measurement is integrated across the fabric of distributed systems. The research community’s interest reflects this shift: studies in network-wide monitoring have significantly increased after 2010, in parallel with the introduction of SDNs and programmable switches. As networks continue to evolve toward greater speed, scale, and dynamism, network-wide monitoring is becoming not just beneficial but essential for ensuring performance, availability, and security.
This survey responds to these changes by providing a focused and systematic review of the landscape of network-wide monitoring. The key contributions of this work are as follows:
  • Conceptual Framework: We define and distinguish network-wide monitoring from traditional monitoring approaches, positioning it as a necessary evolution in response to modern network demands.
  • Taxonomy of Monitoring Architectures: We present an updated taxonomy of monitoring approaches, ranging from single point (device local) techniques and path level measurements to whole network frameworks and hybrid strategies.
  • Comprehensive Survey: We review and synthesize over a decade of research on network monitoring systems, covering both foundational technologies (e.g., SNMP, NetFlow/IPFIX) and emerging paradigms (e.g., SDN, INT, programmable switches).
  • Future Directions: We outline open research challenges and future directions for enabling robust, scalable, and intelligent network-wide monitoring.

2. Methodology

2.1. Related Surveys

Lee et al. [4] and Svoboda et al. [5] are two early surveys that provide foundational perspectives on network monitoring. Both were published over a decade ago and primarily reflect the state of monitoring in traditional, non-programmable networks. They discuss basic techniques such as SNMP, flow level analysis, and passive monitoring, offering useful historical context but lacking coverage of modern advances such as SDN, programmable data planes, or in-band telemetry. Our survey updates and expands upon these earlier works by capturing the evolution of network monitoring into programmable, orchestrated, and network-wide frameworks, providing a modern taxonomy that incorporates recent architectural shifts and emerging telemetry paradigms.
Collectively, the surveys by SoIn [6], Kore et al. [7], and Moceri [8] catalog the landscape of operational network traffic monitoring tools, classifying them by NetFlow/IPFIX data acquisition style collectors, SNMP-based pollers, packet sniffers, and by their availability as open source solutions. All three reviews emphasize practical aspects such as feature sets, real-time statistics, reporting depth, operating system support, and deployability, underscoring how legacy SNMP polling and first-generation platforms like Nagios struggle to meet the scale, speed, and usability demands of modern networks. However, because their primary goal is tool comparison, each survey remains at the component level: they highlight limitations (e.g., SNMP latency, coarse flow granularity) but stop short of examining end-to-end architectural patterns, data-plane programmability, or streaming-telemetry frameworks that are now central to network-wide observability. This gap motivates our work, which shifts the focus from individual tools to system-level design principles for comprehensive, next-generation network-wide monitoring.
Tsia et al. [9] and Zheng et al. [10] both focus on the monitoring capabilities enabled by Software-Defined Networking (SDN). The former provides a broad overview of SDN-based monitoring approaches, including flow level statistics collection, control-plane visibility, and reactive monitoring mechanisms. The latter dives deeper into fine-grained measurement enabled by SDN, particularly emphasizing programmability and measurement granularity. While both surveys highlight the advantages of SDN in decoupling control and data planes for enhanced observability, they are limited to SDN-specific contexts and do not generalize to legacy or hybrid environments.
D’Alconzo et al. [11] explore the intersection of big data technologies and network traffic monitoring, emphasizing the challenges and solutions associated with processing vast amounts of network data. It categorizes existing approaches based on the four Vs of big data: Volume, Velocity, Variety, and Veracity. Although it provides a comprehensive overview of big data applications in network monitoring, its primary focus is on data analytics and processing techniques rather than the architectural and systemic aspects of network monitoring.
Nobre et al. [12] presents a focused examination of how measurement tasks can be coordinated and controlled across an entire network. The survey emphasizes policy driven measurement, programmability, and abstraction of measurement intent, making it a valuable contribution to understanding centralized approaches to measurement control. However, its scope is largely centered on the control and configuration aspects of measurement, with limited discussion of the underlying telemetry techniques, data collection mechanisms, or deployment architectures that make network-wide observability possible in practice. Our survey complements and extends this work by situating control mechanisms within a broader end-to-end monitoring taxonomy that includes telemetry data sources (e.g., counters, sketches, probes), deployment models (e.g., SDN, INT, hybrid), and orchestration frameworks.
Tan et al. [13] provides an in-depth and focused overview of in-band network telemetry (INT), covering its architectural design, packet formats, use cases, and deployment challenges. This survey serves as a comprehensive reference for understanding INT in isolation and highlights its potential for real-time, path level visibility with minimal reliance on external probes. However, its narrow scope limits the discussion to INT specific mechanisms, without positioning them within the broader landscape of network monitoring. Our survey generalizes INT as one of several telemetry approaches within a comprehensive taxonomy that spans from traditional polling and counter-based methods to programmable and hybrid models.
Along with the comparison within the section, we also provide a Table 1 to show comparison with existing works.

2.2. Article Search and Selection

To conduct the review, an extensive search was performed using reliable sources indexed by digital object identifier (DOI). This was accomplished using the following digital library platforms:
  • IEEE Xplore Digital Library
  • Google Scholar
  • ACM Digital Library
We built the query set as a Cartesian product of technology qualifiers and monitoring scopes. Qualifiers were {“P4”, “programmable switch”, “SDN”, (none)} and scopes were {“network monitoring”, “network wide monitoring”, “path level monitoring”, “switch monitoring”}. For each pair, we searched “qualifier” AND “scope” with quoted phrases, for example: “P4” AND “network wide monitoring”, “programmable switch” AND “path-level monitoring”, “SDN” AND “switch monitoring”, plus only “network monitoring” when the qualifier was empty. We used OR to include variant spellings (e.g., “network-wide” OR “network wide”, “path-level” OR “path level”).

2.3. Inclusion and Exclusion Criteria

To ensure a focused and high quality review, we applied clear inclusion and exclusion criteria when selecting the literature for this survey. The primary objective was to include papers that contribute substantively to the understanding, design, or deployment of network-wide monitoring systems, whether in traditional, SDN-based, or programmable data plane contexts.
The initial search yielded 160 research articles, which were further reduced to a final set of 70 articles that met the aforementioned criteria. Eligible papers were then scored on the following:
  • Normalized citation impact (0–10)
  • Recency (0–5), binned by publication year (<2000 → 0; 2000–2004 → 1; 2005–2009 → 2; 2010–2014 → 3; 2015–2019 → 4; 2020+ → 5)
  • Relevance (0–10), an expert assessment of direct fit to network-wide monitoring, technical depth, generality, and evidence of practice.
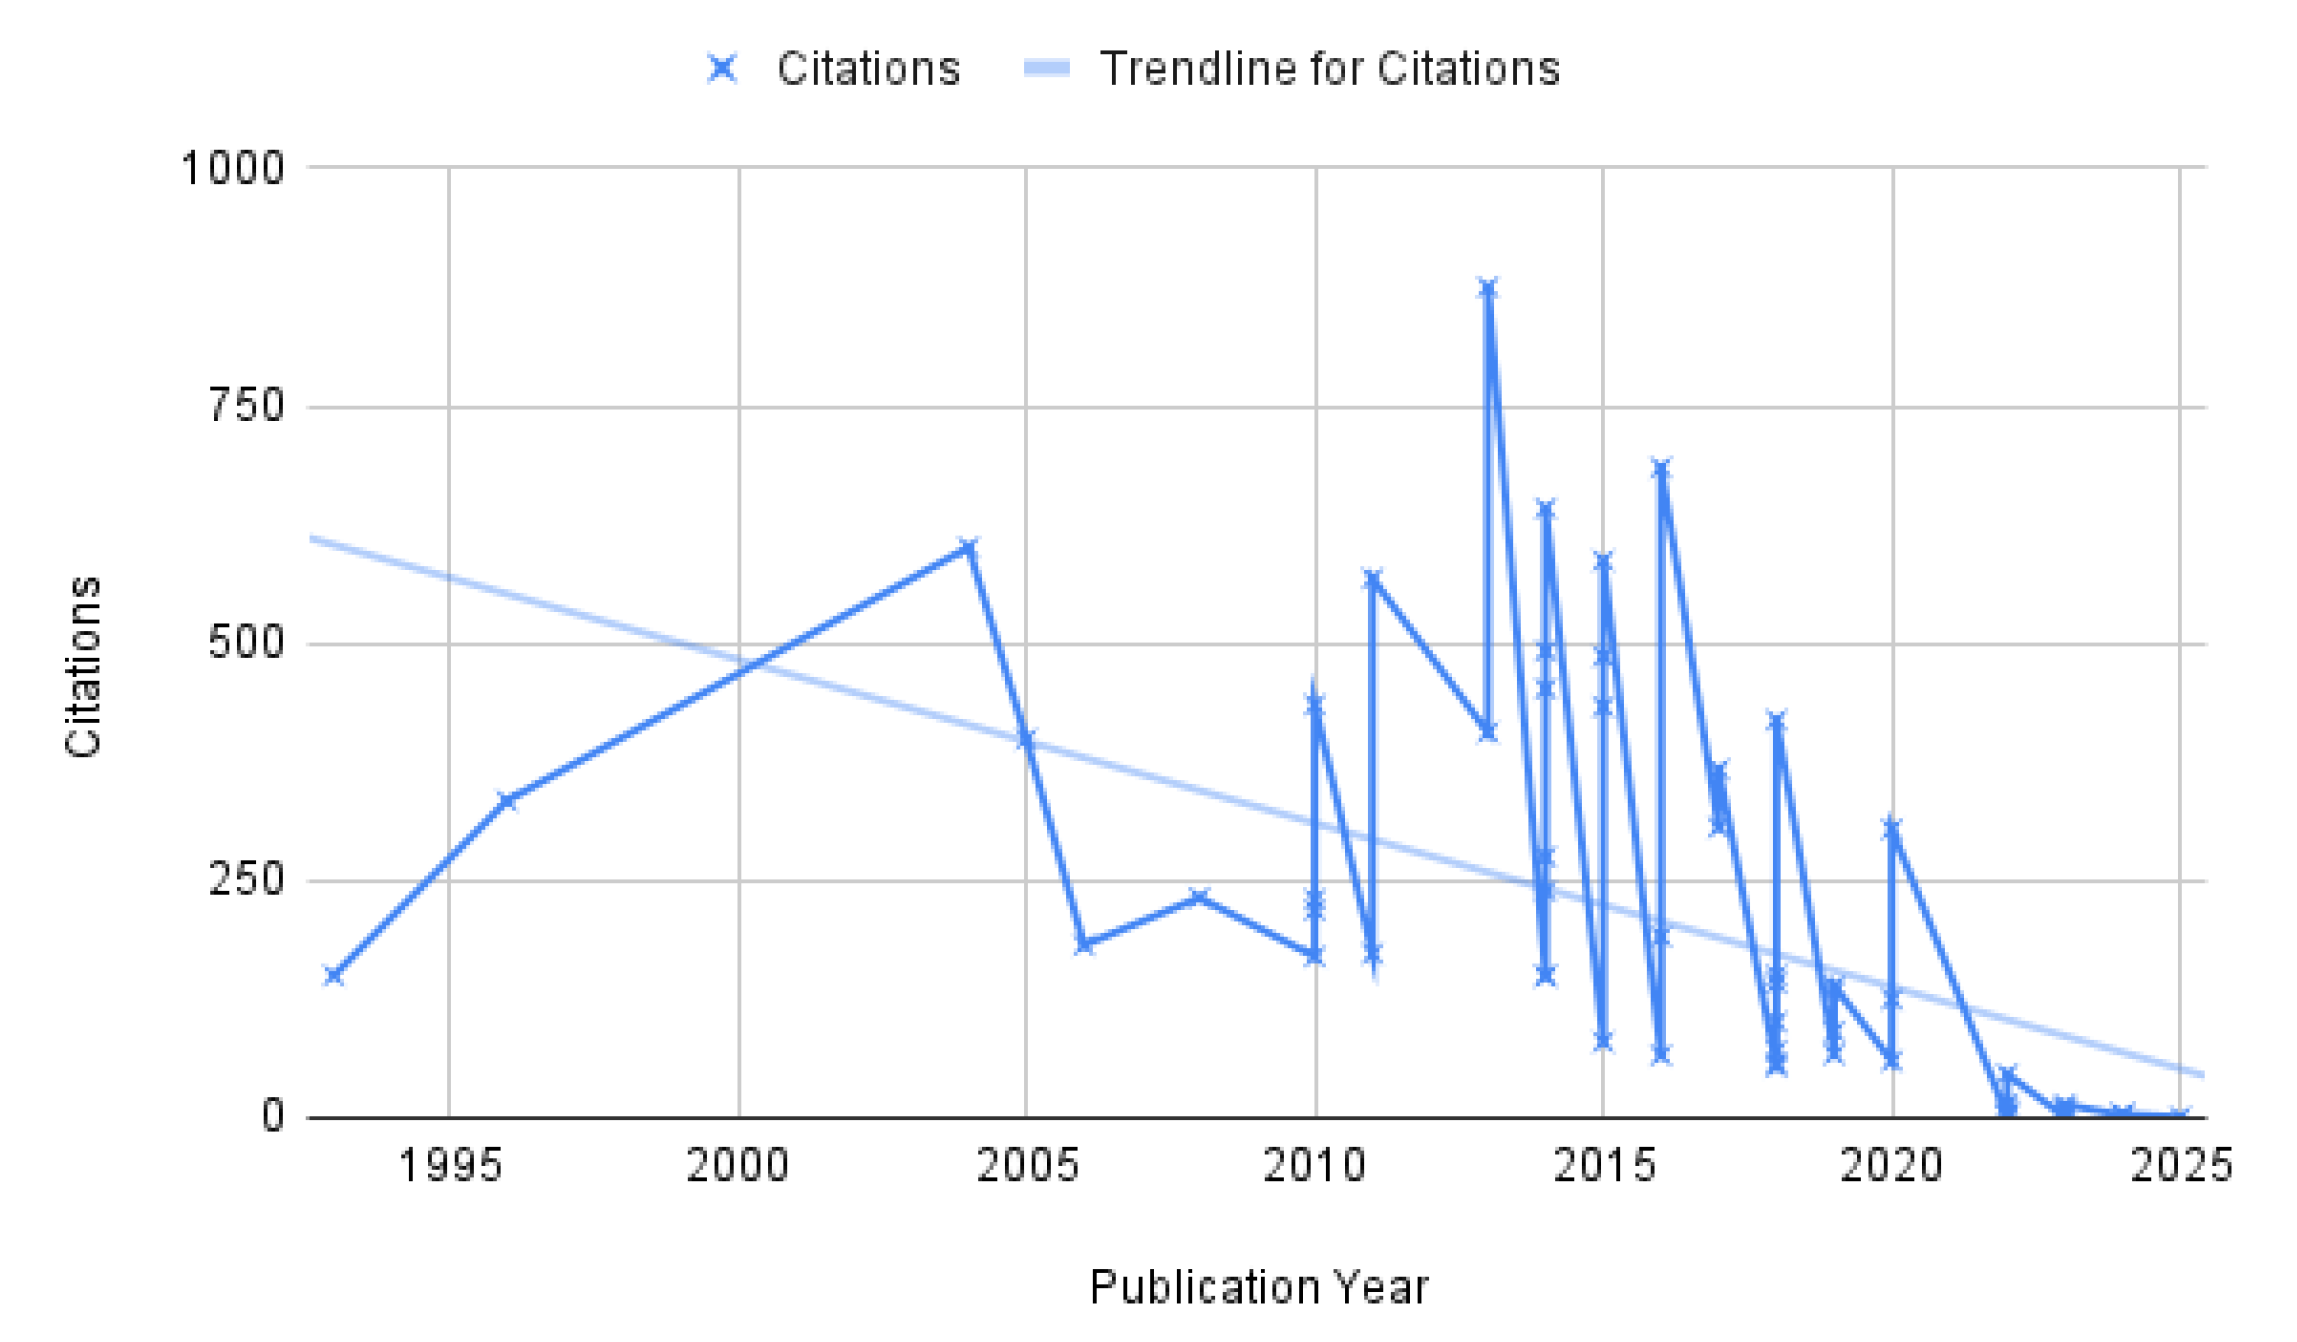
Only works with a total score larger than 12/25 were retained as shown in Figure 1. We see from the Figure 2 that research on network monitoring, specially network-wide monitoring, has significantly increased after 2010, which aligns with introduction of SDNs and programmable switches.

3. Background in Network Monitoring

3.1. Key Concepts and Terminology

Network monitoring is the foundation for understanding and managing the behavior of communication networks. It encompasses the collection of data about network state and traffic, the analysis of these data to infer performance or detect faults, and the visualization or reporting of network conditions to operators. Several key concepts recur in discussions of network-wide monitoring:
Network topology: The topology defines how devices are interconnected and what pathways data can traverse. Topology strongly influences monitoring strategy. Monitoring can be scoped to a single network element or span multiple hops, depending on how components are connected. For example, a link-level monitor might track errors or utilization on one link, whereas a path-level monitor examines traffic across a sequence of links between a source and destination. Knowing the topology is essential for correlating where issues occur and for placing monitoring tools at strategic points (e.g., at bottleneck links or critical junctions). Topology awareness also enables network-wide approaches that try to capture a holistic view of the network’s state at once by aggregating data from many devices.
Flow: In network monitoring, a flow denotes a stream of packets sharing common properties (such as source/destination IP, port, and protocol). Flows are also a unit of measurement because they aggregate packet behavior into higher level transactions or conversations. Classic flow-based monitoring systems like Cisco’s NetFlow and the IETF’s IP Flow Information eXport (IPFIX) use this concept to reduce data volume by recording summaries of traffic rather than every packet. For instance, instead of logging millions of packets individually, a flow record might report that N bytes and M packets were exchanged between host A and host B over a given time. Flow monitoring thus provides an efficient way to observe traffic patterns, and standards exist to export flow records from devices to collectors.
Telemetry: Network telemetry refers to the automated, continuous collection of network data from devices and its streaming to a central system for analysis. Telemetry data can include a wide range of metrics: interface counters, link latency measurements, queue lengths, flow records, event logs, and more, typically gathered at high frequency and fidelity. In essence, telemetry provides the raw visibility into the network’s operation, serving as the input for monitoring and analytics systems. Modern telemetry systems are designed for scalability and efficiency; as networks grow, the volume of telemetry data can be enormous, raising challenges in data transport, storage, and real-time processing.
Observability: Network observability is a broad concept that extends beyond basic monitoring to achieve a deep understanding of network internal state through its external outputs. In practice, observability means not only collecting telemetry data but also correlating and analyzing it in a way that yields actionable insights about the network. Observability-oriented tools utilize telemetry data such as metrics, event logs, and traces from across the topology to provide end-to-end insight and early warning of issues, often employing advanced analytics or machine learning to detect subtle anomalies.

3.2. Architectural Paradigms: Traditional, Software-Defined, and Programmable Networks

To understand the evolution of network-wide monitoring, it is essential to first grasp the broader progression in network architectures. From traditional fixed-function networks, through software-defined networking (SDN), to fully programmable data planes. Each paradigm brings distinct principles and operational characteristics that fundamentally shape how networks are built, managed, and evolved.
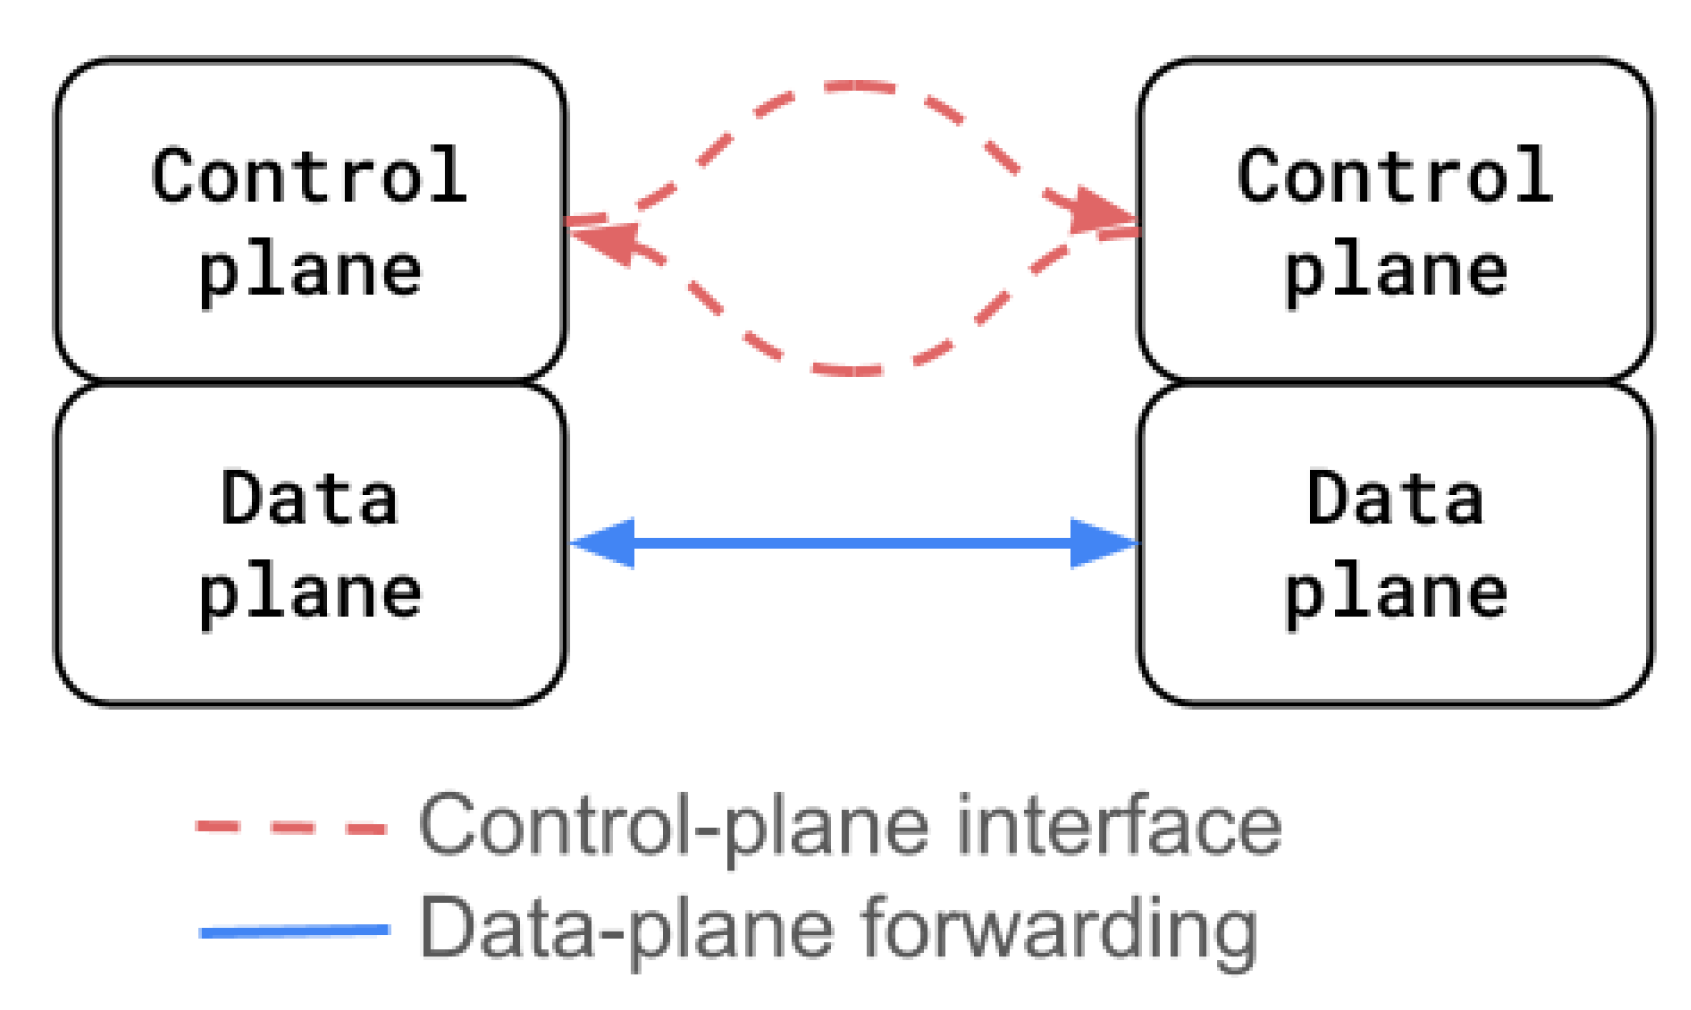
Traditional Networks: Traditional networks are characterized by their vertically integrated design, where each network device, such as a router or switch, combines both the control plane (responsible for making decisions about routing or forwarding) and the data plane (which performs the actual packet forwarding) as shown in Figure 3. Devices run distributed protocols like OSPF, BGP, or spanning tree to dynamically discover topology and compute forwarding tables independently. Control logic is embedded in proprietary, closed-source firmware tied to each vendor’s hardware. This tight coupling makes networks relatively static and hardware-driven, with changes requiring manual configuration of device-specific policies. As a result, introducing new forwarding behaviors or protocols often necessitates upgrading hardware or vendor firmware, slowing innovation and limiting flexibility. These networks have served as the backbone of enterprise and ISP infrastructure for decades but are increasingly challenged by demands for agility and programmability.
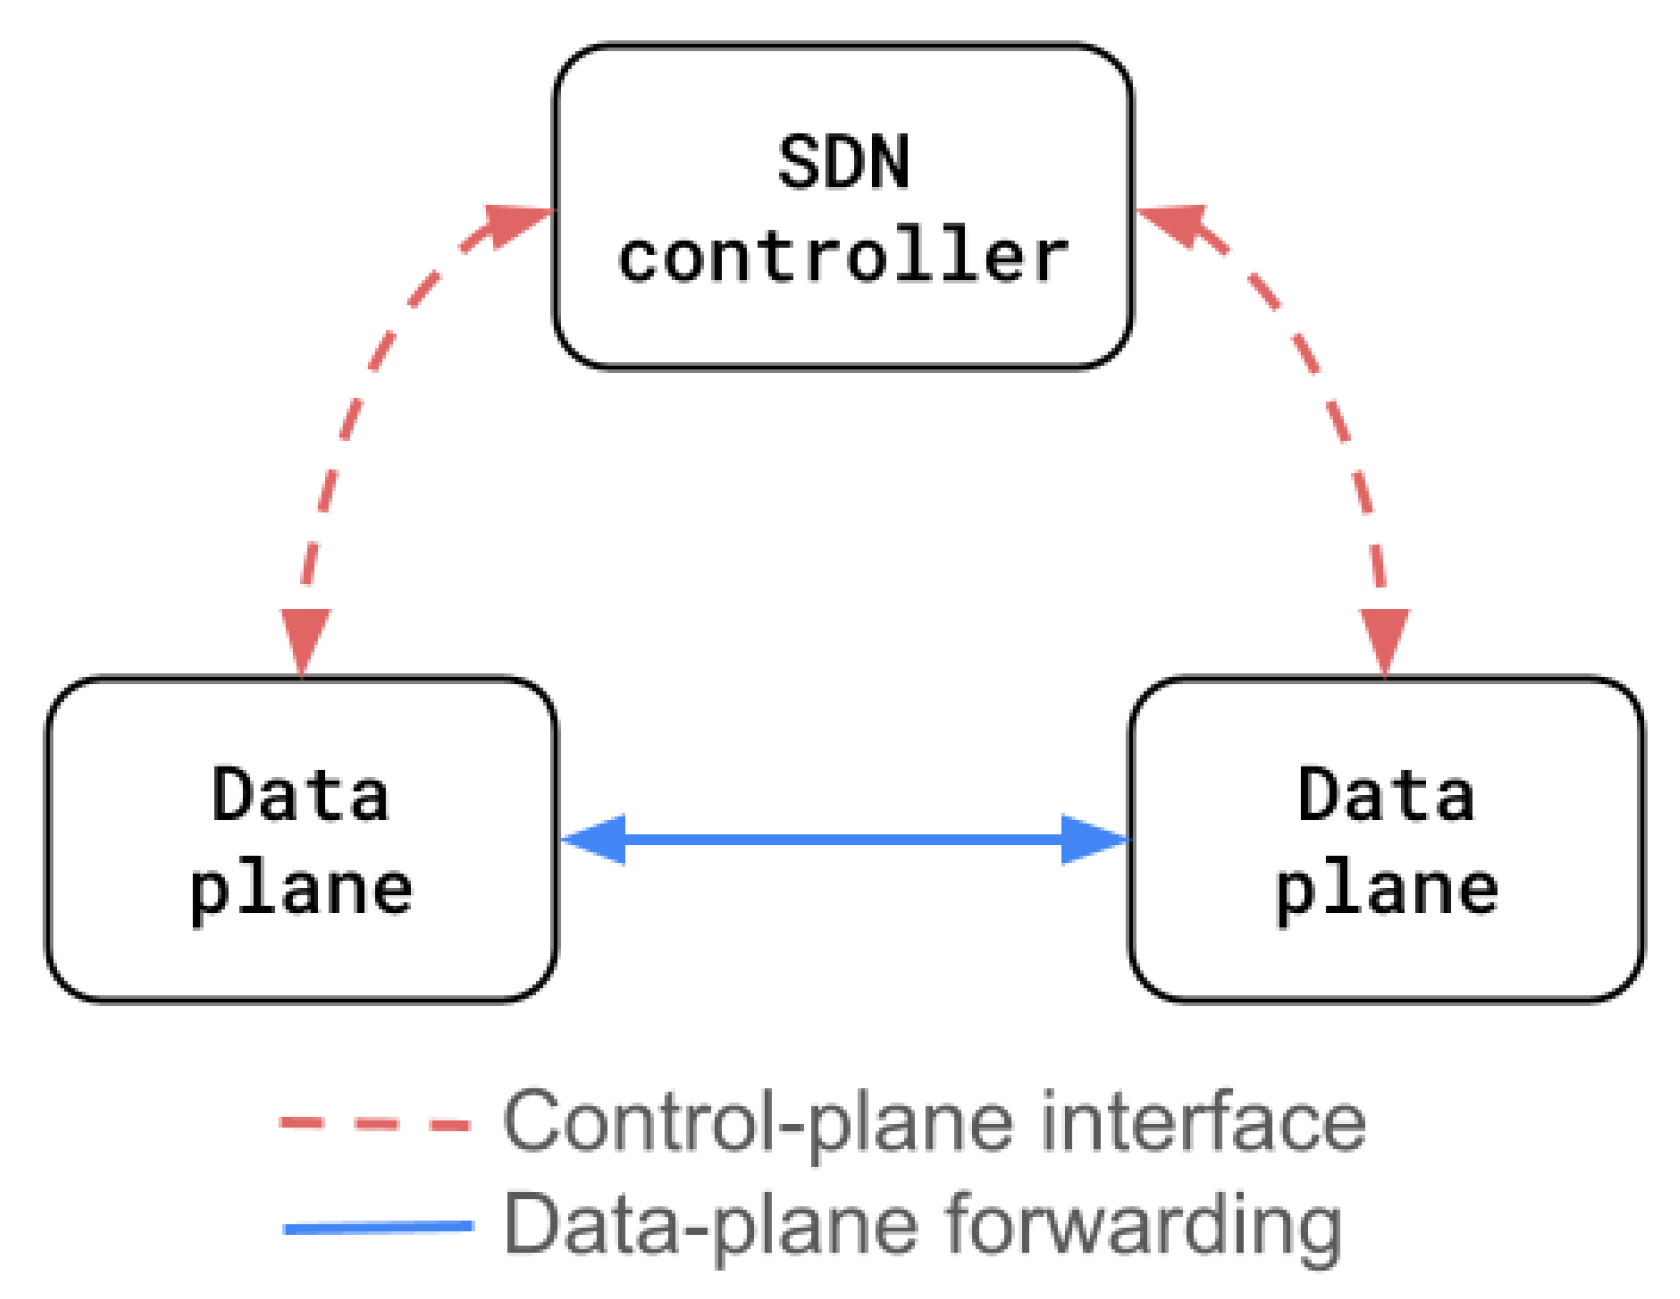
Software-Defined Networks (SDN): SDN introduces a pivotal shift by decoupling the control plane from the data plane as shown in Figure 4. The control plane is centralized, typically embodied in an SDN controller that maintains a global view of the network’s topology and policies. The data plane is distributed, consisting of simple forwarding devices (switches or routers) that rely on the controller for instructions. The standard example is OpenFlow [14], where the controller programs flow tables on switches to dictate forwarding behavior. This separation enables network programmability at the control layer. Operators or applications can dynamically adjust forwarding rules across the network through software APIs, without needing to reconfigure each device individually. Compared to conventional flow monitoring (e.g., NetFlow/sFlow) that is largely device local and static, SDN’s architecture promotes centralized policy enforcement, easier orchestration, and rapid innovation in traffic engineering, security, and multi-tenant slicing. However, the data plane itself remains largely fixed-function, limited to matching packets against flow tables and performing predefined actions.
Programmable Networks and Data Planes: Programmable networks take the concept of flexibility further by extending customizability into the data plane itself. Using languages like P4 [15] and hardware platforms such as programmable ASICs or FPGAs, operators can define how packets are parsed, processed, and forwarded at each switch. This means that not only can policies change dynamically (as in SDN), but the very packet processing pipeline, what headers to look at, what state to maintain, how to perform lookups, is programmable.
Concretely, the data-plane of a programmable switch, as shown in Figure 5, begins with a parser that steps through a finite-state machine to slice raw bits into structured headers and metadata. Packets then traverse a fixed-depth pipeline of match-action tables (MATs). Each stage consults fast memories, SRAM for exact matches and TCAM for ternary or longest-prefix lookups, to decide which actions to execute. Actions run on per-stage ALUs, performing integer adds, bitwise ops, header rewrites, and hash computations in one clock cycle while optionally reading or writing register arrays that hold state across packets (counters, sketches, flow history). After the final stage, the deparser stitches the possibly modified headers and payload back into a contiguous bitstream for egress, achieving line-rate processing under programmer control (e.g., via P4) within the switch’s resource limits.
Such networks can embed novel functionalities directly into forwarding devices, including advanced telemetry, in-network load balancing, stateful packet processing, or security checks, all executed at line rate. This data-plane programmability breaks free from the constraints of vendor-defined protocols and enables rapid experimentation with new network functions, tailored to specific applications or operational goals. Key characteristics of programmable networks include fine-grained control over parsing and pipeline stages, runtime reconfigurability, and deep integration with control-plane orchestration, which together empower networks to be not just software-defined, but software-constructed at every layer.
Specifically for network monitoring, this turns traditional, poll-based flow monitoring into in-pipeline measurement. Custom parsers expose protocol/overlay/INT headers; MATs can attach per packet, per hop evidence (timestamps, queue depth, output port, device/path/tenant IDs); and stateful primitives (registers, meters, counters, sketches) realize heavy-hitter detection, cardinality, and threshold-based triggers at line rate.
Together, these three architectural paradigms trace the journey from static, appliance-driven infrastructures to dynamic, software-controlled, and ultimately fully programmable network fabrics. Each step in this evolution increases operational agility, enables richer optimization, and creates new possibilities. However, it also introduces new complexities that demand correspondingly advanced approaches to monitoring and observability.

3.3. Taxonomy

The practice of network monitoring can be categorized along several dimensions, reflecting where and how measurements are obtained. One important axis is the spatial scope of monitoring, i.e., the vantage point over the network that a measurement technique covers. We classify monitoring approaches into four broad categories based on scope: (1) single node or link, (2) path (multi-hop sequence), (3) whole network or large subgraph, and (4) hybrid combinations.
Single node/link monitoring This category covers techniques that focus on observing traffic or metrics at one network element, a single device or a single communication link. It is the most localized form of monitoring. Classic examples include reading interface counters on a router, sampling packets on one link, or maintaining sketches for traffic estimation at one switch. Many traditional tools fall in this category, for instance, using SNMP to poll a specific router’s MIB (Management Information Base) for CPU load or bytes transmitted, or enabling NetFlow on a router to collect flow records only for that router’s traffic. Single point monitoring is straightforward and has low complexity; each device can be managed independently. Local data structures like counters, gauges, or sketches are often used; these reside on the device and summarize local traffic. The strength of single node monitoring is its simplicity and directness, it can pinpoint device specific issues (a failing interface, an overloaded router) effectively. However, it provides a limited view: problems that are happening end-to-end or across multiple hops may not be recognizable from any single vantage point.
Path level monitoring: Path level monitoring focuses on the experience or performance of traffic along a specific route through the network (from point A to point B, across multiple hops). This is essentially a multi-point approach, but scoped to a contiguous sequence of links and nodes forming a path. Active probing is a common technique here, for instance, tools like traceroute send packets with increasing TTL to discover the sequence of hops to a destination, measuring delay at each hop. Aside from probes, path monitoring can involve collecting per-hop data for actual flows. SDN controllers, for example, can query each switch along the path of a given flow to retrieve the flow’s count of bytes or packets at that hop. In-band telemetry (INT) is another approach, it effectively makes the user traffic itself into a probe carrier, by having each hop attach information.
Network-wide monitoring: Techniques in this category strive to observe the network as a whole, or at least a significant portion of it, in a coordinated way. The goal is to obtain a global or network-wide view of the state, rather than focusing on one element or one path. One approach is to use carefully designed sets of probes or jobs that collectively cover the entire graph of the network. Another approach is to optimally place monitors or taps in the network e.g., select a subset of nodes that should perform packet capture or flow logging such that every flow in the network is observed by at least one of those monitors. This is powerful for detecting systemic issues like widespread congestion, global routing inconsistencies, or correlated failures. The trade-off is complexity and data volume, these methods often require significant support from controllers or external computation to decide what to measure where, and to process the mountain of data that a whole network view can produce.
Hybrid approaches Hybrid monitoring schemes combine elements of the above categories, either in parallel or dynamically, to leverage their respective strengths. One common hybrid pattern is a hierarchical approach: local monitoring at each node is always running, but mostly quiet; when a local metric crosses a threshold or an anomaly is detected, that node will trigger a report to a central system. The central controller then correlates reports from multiple nodes to diagnose a network-wide issue. This way, routine data are kept local (reducing overhead), and only significant events escalate to the global level. Another hybrid strategy is load-aware or event driven probing; the controller might normally do lightweight network-wide polling infrequently, but if certain conditions are met (say, an increase in latency on a few paths), it ramps up the frequency of active probes or issues new measurement requests targeting the suspected problem area. Essentially, the monitoring adapts from coarse to fine-grained based on triggers. Hybrid approaches aim to be efficient and robust, it reduce unnecessary data collection by focusing effort where needed, and improve coverage by using more than one method to cross-verify information. Hybrid approaches are increasingly feasible in SDN/progammable networks where a controller can orchestrate multiple data collection methods simultaneously.
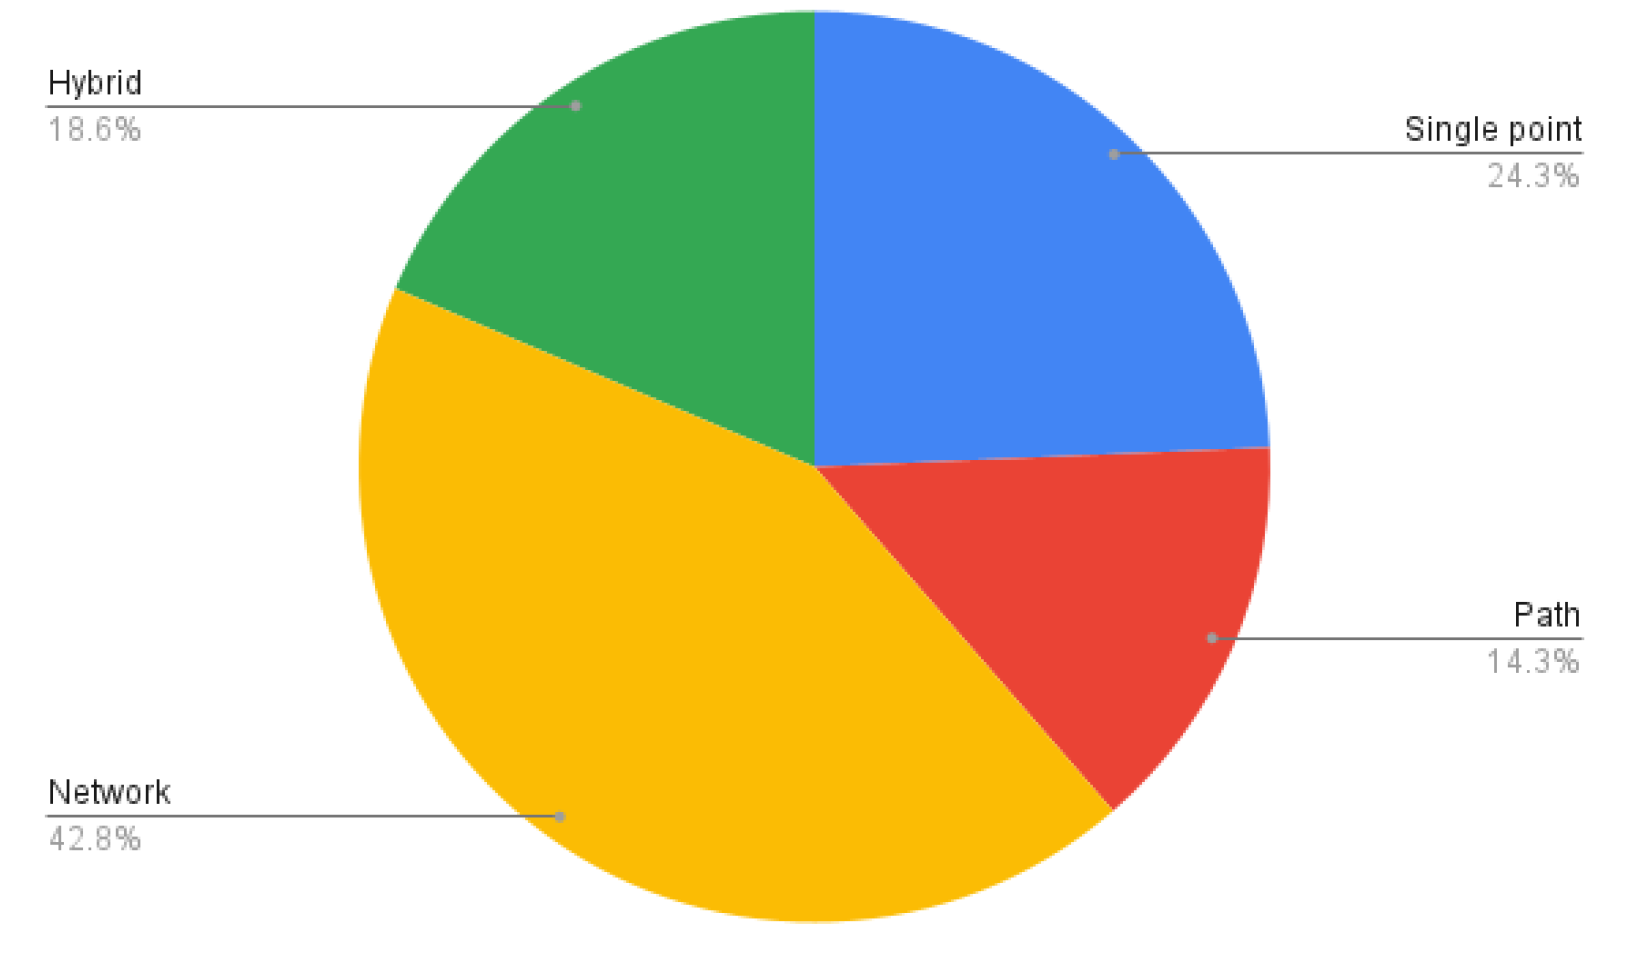
Table 2 distills the taxonomy at a glance, aligning each monitoring category with its characteristic techniques. Figure 6 also reveals how research efforts are distributed across different categories of network monitoring approaches. This distribution highlights that while there is substantial interest in achieving global, coordinated visibility across networks, researchers also continue to explore fine-grained local techniques and hybrid designs that integrate multiple vantage points to balance overhead with comprehensive insight.

4. Findings and Discussion

4.1. Single Point Monitoring

Estan et al. [16] introduce “Sample and Hold”, a technique that selectively samples packets and then tracks all subsequent packets in the same flow, significantly reducing overhead while maintaining accuracy. By leveraging this method, the system efficiently captures heavy-hitter flows and supports flexible traffic analysis.
Yuan et al. [17] introduce “ProgMe”, which allows operators to specify flow group definitions using set theory-based predicates, enabling diverse and customizable measurement tasks without modifying router firmware. By supporting arbitrary flow groupings and on-the-fly reconfiguration, ProgME empowers network operators to perform fine-grained, application-specific measurements with low overhead.
Curtis et al. [18] introduce “Mahout”, which leverages software agents on end hosts to identify elephants early based on connection behavior and then informs the network to treat them differently e.g., by rerouting them to avoid congestion. This offloads monitoring work from the network infrastructure, reducing switch complexity and overhead, while still enabling fine-grained traffic engineering.
Yu et al. [19] introduce a three-stage pipeline: hashing, filtering, and counting that allows operators to implement a wide range of measurement tasks using a small, fixed set of hardware primitives. The system supports multiple concurrent measurement applications (e.g., heavy hitters, flow size distribution) and simplifies development by allowing high-level configuration of the measurement logic.
Yu et al. [20] introduce “FlowSense” that leverages flow-removed messages which are already sent by switches to controllers when flows expire to infer real-time utilization metrics such as link load and traffic matrices. This eliminates the need for active probes or periodic polling, thus incurring zero additional measurement overhead.
Malboubi et al. [21] present iSTAMP, a traffic measurement framework that intelligently balances aggregate and per-flow monitoring within resource constrained SDN switches. It partitions TCAM space into two regions: one holds aggregate (wildcard) rules to coarsely measure many flows, while the other houses rules for fine-grained monitoring of the most informative (“rewarding”) flows. iSTAMP uses a compressive sensing approach to reconstruct complete flow distributions from aggregated measurements and applies a multi-armed bandit algorithm to dynamically select high impact flows for detailed tracking.
Srinivas et al. [25] propose Marple, a powerful query driven telemetry framework that enables network operators to express complex performance queries such as microburst detection, packet reordering, or per-flow latency tracking using a high-level language featuring constructs like map, filter, groupby, and zip. It compile these queries into data-plane programs that run directly on programmable switches, leveraging specialized line-rate key-value stores to perform flexible aggregations (e.g., moving averages, out-of-order counts) on-chip. This is complemented by a software-backed cache architecture that offloads evicted entries to off-chip DRAM without compromising deterministic forwarding.
Gupta et al. [26] introduce Sonata, which offers a declarative, data-flow query interface for operators to define rich telemetry tasks (e.g., detecting heavy hitters or scanning for anomalies), which the system automatically splits between programmable switches and stream processors. It partitions the query execution by pushing the filtration and aggregation on the data plane at line rate, while handling complex tasks and dynamically refining queries to focus only on relevant traffic, dramatically reducing data and computation.
Sonchack et al. [27] present “*Flow”, which has a query plan optimizer and a runtime system that dynamically compiles and merges monitoring logic to fit within the limited resources of programmable hardware (e.g., switches or NICs). It is designed to enable scalable, hardware-accelerated network monitoring that supports multiple, concurrent, and dynamic queries.
Chiesa and Verdi [28] introduce PipeCache, a system designed to enable accurate data-plane network monitoring on high speed ASIC switches that use multiple packet processing pipelines, each with its own memory. Existing monitoring solutions like heavy-hitter and super-spreader detection assume a single shared memory region, but when traffic is split across pipes, accuracy can degrade dramatically (e.g., up to 3000× higher flow-size estimation error). PipeCache addresses this by mapping each traffic class to a dedicated “monitoring pipe”, caching per class state in ingress pipes, and piggybacking cached updates on packets destined for the correct pipe.
Sun et al. [22] propose OmniWindow, a flexible framework for implementing window-based telemetry algorithms on programmable switches. It enables a variety of streaming network measurement tasks, such as heavy-hitter detection, flow size estimation, and rate monitoring within both tumbling and sliding window semantics. OmniWindow achieves this by splitting large measurement windows into fine-grained sub-windows and maintaining lightweight sketches per sub-window. This decomposition allows efficient, incremental updates and evictions, minimizing memory consumption and enabling constant-time, high-speed operations on data-plane hardware.
Landau-Feibish et al. [23] explore tailored variants of structures like count-min sketches, bloom filters, and more advanced quantile and heavy-hitter sketches, demonstrating how they support critical telemetry tasks (e.g., flow counting, anomaly detection) efficiently directly in the data plane. By synthesizing these techniques and highlighting future avenues, the paper charts a path for deploying efficient, approximate network monitoring within hardware constrained environments.
Wang et al. [24] propose Confluence, a sketch-based measurement system tailored for multi-pipeline programmable switches, which typically split traffic across independent pipelines and memories. Confluence introduces novel data structures that collect short term stats in each ingress pipeline and converge them at egress pipelines. The system addresses the challenge of how to query and update shared sketch buckets under hardware constraints with a specially designed algorithm whose correctness is theoretically proven.
Discussion: Raw counters and fine grained polling provide fast locality but miss path context and can inflate control-plane load; on-chip memory limits further constrain what can be tracked per flow/queue. Authors address this with compact, line-rate summaries (e.g., sketches and hierarchical counters), event-driven activation (sampling/stamping only past thresholds such as queue watermarks or ECN marks), and local aggregation that exports digests instead of raw samples. Multi-pipeline consistency fixes and approximate data structures trade tiny accuracy loss for large gains in speed and footprint. Overall, single point methods excel at precise, low latency evidence collection and per device actuation, but they require careful orchestration (rates, placement, windowing) and often benefit from integration with path- or network-wide telemetry to recover end-to-end context without exceeding resource or export budgets.

4.2. Path-Based Monitoring

Traceroute [29] is an early method for path discovery that leverages IP options to trace the route that packets take through the network. Specifically, it proposes using the Record Route (RR) and Loose Source and Record Route (LSRR) IP options to collect information about the routers traversed along a packet’s path. When enabled, the RR option instructs routers to append their IP address to the packet header, thereby allowing the sender to observe the path incrementally.
Snell et al. [30] introduce NetPIPE, a benchmarking tool designed to evaluate network performance across diverse protocols and data paths. It systematically sends varying block sizes between hosts, from a single byte up to large buffers, and measures round-trip latency and throughput, generating detailed “signature” and “saturation” performance graphs. These visualizations expose protocol-level overheads and anomalies.
Katz-Bassett et al. [31] propose a system for accurately tracing the reverse network path from a destination back to a source, addressing the challenge that traditional traceroute tools can only measure the forward path. The system works by combining several measurement techniques such as IP Record Route, IP Timestamp, and spoofed packets with information from cooperating vantage points distributed across the Internet. By cleverly coordinating these techniques, Reverse Traceroute reconstructs the reverse path without requiring control over the remote destination.
Zhu et al. [32] propose Everflow, a scalable system for tracing and analyzing individual packets across massive datacenter networks. Everflow enables precise fault diagnosis such as latency spikes, silent packet drops, and load imbalances by using switch-based match-and-mirror rules to selectively capture packets and forward them to analysis servers.
Kim et al. [33] introduce a flexible and efficient method for collecting fine-grained network telemetry by embedding measurement data directly within packets as they traverse the network. Leveraging programmable data planes (e.g., P4 enabled switches), the system allows operators to specify which telemetry metadata (e.g., timestamps, queue lengths, device IDs) should be inserted at each hop. This in-band approach eliminates the need for out-of-band probing or periodic polling, enabling accurate, real-time visibility with minimal overhead.
Kim et al. [34] propose sINT that operates via probabilistic insertion based on observed network state changes. Ingress switches tag packets with a telemetry header at a rate adjusted dynamically to the frequency of significant metrics (like latency or queue-depth variations), and intermediate switches update telemetry fields using a uniform sampling method. Egress nodes then forward sampled telemetry data to the controller, which uses this information along with a heuristic flow selection algorithm for path consistency and event detection.
Basat et al. [35] introduce PINT, which selectively annotates packets based on a tunable probability. Each switch along the path decides independently, also probabilistically, whether to include its own telemetry data. This design dramatically lowers the bandwidth and processing overhead while still providing statistically meaningful insights into network behavior.
Papadopoulos et al. [36] introduce two novel techniques: DLINT (Deterministic Lightweight INT) and PLINT (Probabilistic Lightweight INT) to reduce the bandwidth and header overhead of traditional P4-based INT mechanisms. DLINT employs a per-flow aggregation strategy, where telemetry data are spread across multiple packets in a coordinated way. Switches maintain lightweight per-flow state, aided by bloom filters, to ensure each hop’s data are captured without redundancy. PLINT, on the other hand, uses reservoir sampling, allowing every switch node to insert telemetry metadata probabilistically into packets, eliminating the need for cross-switch coordination.
Qian et al. [37] introduce OffsetINT, a refined in-band network telemetry (INT) scheme that drastically reduces telemetry overhead without sacrificing accuracy. OffsetINT transmits only compact offsets between successive values, capitalizing on their small differences, and reassembles the full telemetry context at the end-host.
Bae et al. [38] propose a technique to reduce the bandwidth overhead of in-band network telemetry (INT) by quantizing telemetry data before embedding it into packets. Instead of recording raw, high-precision values (e.g., exact queue lengths or timestamps), the system maps these values into coarser quantization levels, significantly reducing the number of bits needed per telemetry field. This method strikes a balance between measurement accuracy and telemetry footprint, enabling broader deployment of INT in high-speed or resource-limited networks.
Discussion: Path methods span inference from probes to in-path evidence from the network itself. Probe-based tools are easy to deploy and low overhead but could be fragile in practice. Example: IP options are often filtered, paths are asymmetric and dynamic, middleboxes rewrite state, and timing is coarse or end-to-end only. Switch-assisted techniques like match-and-mirror yield precise packet traces at the cost of TCAM entries and export bandwidth while INT embeds hop metadata for real-time, hop accurate diagnosis but consumes header budget/MTU, on-chip resources, and collector capacity. Recent INT variants reduce overhead via probabilistic selection, distribution across packets, delta/quantized encodings or trade footprint for estimation, reconstruction complexity, or potential detection latency and blind spots under bursty conditions.

4.3. Network-Wide Monitoring

Claude et al. [60] address how to strategically deploy a limited set of passive taps and active beacon generators in a network to maximize monitoring coverage while minimizing deployment cost. The authors formally model the placement of these devices as combinatorial optimization problems, one to minimize the number of monitors needed to observe all traffic, the other to maximize flow coverage under budget constraints. They prove these problems are NP-hard and present both approximation results and Mixed Integer Programming (MIP) formulations, along with efficient heuristics.
Suh et al. [50] tackle the problem of optimally placing traffic monitors in a network to balance deployment cost against monitoring coverage. It formulates two complementary NP-hard problems: (1) minimizing the number of monitors needed to cover a set of flows, and (2) maximizing flow coverage under a fixed budget. To address them, the authors propose practical greedy heuristics that strategically add monitors based on marginal coverage gains.
Sekar et al. [51] introduce cSamp, a coordinated, system-wide flow monitoring framework that enhances visibility by treating the network as one unified system rather than managing individual routers independently. It uses hash-based coordination so that each router monitors distinct subsets of flows without explicit communication. Moreover, cSamp employs a network-wide optimization engine, aware of router resource constraints, to generate per-router sampling manifests that align with global monitoring objectives.
Ballard et al. [67] propose “OpenSAFE”, which routes arbitrary traffic flows selected via user-defined policies to analysis tools at line rate using software-defined networking. OpenSAFE introduces ALARMS, a domain-specific language for expressing monitoring paths (inputs → filters → sinks) with abstractions for filtering, load balancing (e.g., ALL, RR, HASH), and reusable “waypoints”. It leverages OpenFlow to dynamically install these policies, enabling scalable, finely controlled traffic redirection without impacting production forwarding.
Tootoonchian et al. [55] present OpenTM, a system that uses built-in per-flow byte and packet counters in OpenFlow switches to gather traffic statistics with minimal overhead. Leveraging routing information from the controller, OpenTM intelligently selects a subset of switches to query for each flow, managing both monitoring load and measurement accuracy.
Adrichem et al. [61] introduce OpenNetMon, an SDN-based monitoring module designed to provide timely and accurate per-flow metrics including throughput, delay, and packet loss in OpenFlow networks. OpenNetMon enables precise QoS-aware traffic engineering by polling edge (ingress/egress) switches at an adaptive rate, increasing when traffic fluctuates and backing off during steady periods, to balance monitoring accuracy against overhead. It derives throughput and packet loss using flow counters, and measures delay by injecting small probe packets along monitored paths; replies travel via a dedicated VLAN to avoid control-plane scheduling delays.
Yu et al. [62] present DCM that aims to fulfill two key requirements: (1) allow different monitoring actions (like flow counting or packet sampling) on distinct flow groups and (2) distribute this load across the network to avoid overloading any switch. It achieves this using a two-stage bloom filter architecture at each switch: an admission filter to detect eligible flows, and action filters to classify flows into measurement categories. The SDN controller centrally installs and updates these filters, balancing monitoring assignments and mitigating false positives by global coordination.
Chowdhury et al. [68] introduce PayLess, an adaptive SDN monitoring framework designed to balance accuracy, timeliness, and control-plane overhead in flow statistics collection. PayLess exposes a RESTful API that allows applications to request flow and aggregate metrics at customizable resolutions without managing low-level polling logic. It features an adaptive polling scheduler that dynamically adjusts query frequency based on network conditions, achieving near real-time accuracy with significantly fewer messages than periodic polling strategies.
Su et al. [56] propose CeMon and introduce two key schemes. Maximum Coverage Polling Scheme (MCPS): The system models the polling node selection as a weighted set cover problem, using heuristics to choose a minimal subset of switches to poll in order to cover the maximum number of active flows. Adaptive Fine-Grained Polling Scheme (AFPS): Supplements MCPS by adaptively adjusting per-flow polling intervals using variety of sampling algorithms. By integrating these schemes, CeMon efficiently balances global polling efficiency with fine-grained flow monitoring, enabling scalable, timely, and precise traffic insight in SDN environments.
Guo et al. [39] propose Pingmesh, a network-wide, always on latency probing system deployed across Microsoft data centers. It orchestrates every server to participate in layered, complete-graph probes to collect comprehensive TCP/HTTP latency measurements. It achieves this by deploying lightweight Pingmesh Agents on servers that follow instructions from a central controller to issue pings as directed; the results are aggregated through a scalable storage and analysis pipeline (Cosmos/SCOPE), enabling real-time latency monitoring, SLA tracking, and rapid network troubleshooting at macro and micro levels.
Liu et al. [52] introduce OpenMeasure, a network-wide framework that dynamically tracks the most informative flows within hybrid SDN environments. It uses online learning algorithms such as weighted-linear prediction model and a multi-armed bandit approach to continuously identify valuable flows. The SDN controller, leveraging its global network view, then strategically installs flow metering rules across switches. Flow statistics and link data are periodically pulled into an inference engine that reconstructs traffic matrices and identifies heavy hitters. Through runtime measurement rule updates, OpenMeasure enhances monitoring fidelity while minimizing resource usage.
Yaseen et al. [57] propose a novel measurement primitive, SpeedLight, that captures causally consistent, near-synchronous snapshots of network-wide state across programmable switches. It enables operators to query the entire data plane (e.g., counters, queue depths, path statistics) at a specific logical moment, addressing limitations of traditional tools that provide only isolated or path level measurements. SpeedLight achieves this by combining in data-plane snapshot markers piggybacked on live traffic with tightly coordinated control-plane synchronization (e.g., using PTP), ensuring that each switch’s captured state represents the network at almost the same instant.
Marques et al. [40] formulates a novel framework called INTO (In-Band Network Telemetry Orchestration). It tackles the challenge of deploying INT judiciously to balance monitoring coverage with resource overhead. Specifically, INTO defines two optimization problems: INTO Concentrate, which minimizes the number of flows used for telemetry, and INTO Balance, which evenly distributes telemetry load across flows. Both are proven NP complete.
Tian Pan et al. [41] introduce INT-path, a framework that transforms basic In-Band Network Telemetry (INT) into a network-wide monitoring system by strategically planning the routes of probe packets. It decouples the underlying telemetry mechanism (source routing INT probes) from the path generation policy, and uses an Euler trail-based algorithm to compute a minimal set of non-overlapping paths that collectively cover every link in the network—ensuring efficient link-level visibility with minimal overhead. By embedding each probe’s route directly into its header, INT-path encodes the network’s status into a compact “bitmap image”, turning troubleshooting into a pattern recognition problem and enabling scalable, comprehensive telemetry, especially suited for symmetric topologies like data centers.
Cheng Tan et al. [42] propose NetBouncer, a robust system for quickly detecting and pinpointing both hard and gray failures and packet drops that evade standard detection in large-scale closely structured data center networks. NetBouncer actively injects lightweight IP-in-IP probe packets from end-hosts, which travel through predefined paths, bounce back, and carry path-level success/failure stats. It constructs a probing plan optimized for coverage with minimal resource use and uses a latent-factor inference algorithm to estimate per-link drop probabilities, distinguishing device from link level failures. By correlating probe outcomes across host pairs, NetBouncer achieves accurate localization within a minute, even for gray failures, without requiring specialized hardware—proving effective in production (e.g., Azure) deployments.
Ding et al. [63] presents NWHHD+, a system and deployment strategy enabling scalable heavy-hitter detection across hybrid networks of legacy and P4 programmable switches. It tackles the challenge of limited initial deployment by proposing a greedy algorithm that selects which legacy switches to upgrade based on maximizing the number of distinct flows observed (via HyperLogLog [82]). On top of that, NWHHD+ employs a novel, distributed heavy-hitter detection strategy using local count-min sketches and adaptive thresholds at each programmable switch. Switches flag potential heavy hitters, sending compact summaries to a central controller, which reconciles these by considering both local and global thresholds.
Huang et al. [58] propose OmniMon, a novel, network-wide telemetry architecture that delivers both resource efficiency and zero-error, flow-level accuracy across large scale data centers. It employs a split-and-merge approach: telemetry tasks are partitioned (the “split”) among hosts, switches, and a centralized controller, then combined (“merge“) to reconstruct exact, end-to-end per-flow metrics. OmniMon embeds metadata directly in packets, in-band fields like host/switch identifiers and epoch stamps, and employs strict epoch synchronization across all network entities. Packet loss is inferred via a system of linear equations that accounts for network topology and flow paths. Together, these techniques enable error free reconstruction of per-flow network-wide metrics.
Gu et al. [53] propose ACM, a system that significantly improves the accuracy of large-flow detection in SDN-based network-wide measurements. ACM leverages collaborative monitoring by merging count–min sketch results from multiple monitors assigned to large flows, thereby increasing their estimation fidelity. It formulates the monitor assignment challenge as an NP hard optimization problem and introduces two solutions: an offline approximation algorithm (iLPTA) and an online two-stage distribution algorithm (TODA), both designed to preserve load balance and accuracy trade-offs.
Liu et al. [59] introduce CoCaTel, which captures causally consistent execution traces, including packet processing events across ingress/egress pipelines and control-plane actions by constructing detailed space–time event graphs. This approach enables operators to pose complex queries like “did this flow rule change cause the downstream delay?” and diagnose anomalies such as PFC deadlocks more effectively than traditional timestamp or sampling-based telemetry.
Agarwal et al. [54] propose HeteroSketch, which clusters network devices based on their resource capabilities and monitoring demands. It then solves a multi-objective placement problem to assign compact sketch-based measurement tasks tailored to each cluster. HeteroSketch refreshes its placement dynamically using fast re-optimization and selective re-sketching, ensuring adaptability as traffic patterns change. By coordinating sketch deployment across the network and balancing accuracy with resource usage, it achieves high-fidelity flow monitoring while reducing memory and control overhead compared to naïve per-switch deployments.
Yuan et al. [43] present INT-react, a scalable and robust path planning framework for network-wide in-band network telemetry (INT). It tackles the challenge of covering mega-scale topologies (millions of edges) while maintaining resilience against link or device failures. Unlike earlier INT-path schemes, INT-react employs an O(E) (linear-in-edges) algorithm that computes redundant, minimal, edge covering probe paths, ensuring each network link is monitored multiple times across disjoint paths. By optimizing cover sets and fault tolerance in one pass, INT-react guarantees quick recovery, even when failures occur, without overloading the network with redundant probes.
Zhang et al. [64] propose Hawkeye, a hybrid INT framework combining proactive segment routing (SR) with passive telemetry sampling to achieve real-time network visibility with minimal overhead. Hawkeye merges SR and INT by dynamically configuring SR-INT packets—probe packets that are source-routed and carry embedded telemetry across multiple hops—while passively piggybacking metadata on selected data packets. With a programmable dataplane, the system adapts telemetry intensity (e.g., path selection, sampling rate, metadata types) in real time via SDN control.
Thummar et al. [65] propose a hierarchically distributed INT framework that shifts telemetry intelligence and analysis from centralized collectors to the network fabric itself. The system leverages an SDN controller to allocate tiered INT tasks across multiple switches, reducing both packet overhead and redundant computations.
Marques and Gaspary [44] present a unified framework that leverages INT and data-plane programmability to enhance both network monitoring and resilient operation. The authors formalize the INT orchestration problem, balancing granularity vs. overhead, as NP-complete, and offer efficient polynomial-time heuristics (INTO) to select flow subsets for telemetry with minimal cost. They propose IntSight, which embeds path wise, per-packet telemetry into flows, consolidating metrics directly at egress switches to detect and diagnose SLO violations. Finally, the paper introduces Felix, a data-plane reaction mechanism that preloads alternate forwarding tactics, enabling sub-millisecond reroute around link or node failures—orders of magnitude faster than control-plane rerouting.
Zhang et al. [45] propose GrayINT, a specialized system for detecting and pinpointing gray failures those elusive, intermittent packet losses in data center networks using a hybrid INT approach. GrayINT periodically injects simplified INT probe packets that traverse all possible routes, allowing end-hosts to build and maintain dynamic path tables. When a path vanishes from these tables due to subtle failures, the system triggers detection and reroutes traffic immediately to maintain connectivity. Hosts then upload expired path metadata to a central controller, which analyzes overlapping failures across multiple paths to accurately localize the faulty link or device.
Zhang et al. [46] present INT-Balance, a telemetry path planning framework that ensures even coverage and overhead across the network. The system models the network as a graph of nodes and links, then splits the graph at every odd-degree node into multiple path segments. These segments are then recombined into probe paths of approximately equal length, ensuring each link is monitored with balanced load and comparable latency. By planning paths with uniform size, INT-Balance prevents hotspots, where some links receive many probes and others few, leading to fair load distribution and efficient, scalable network-wide telemetry.
Zhang et al. [47] introduce AdapINT, a dynamic in-band telemetry framework that adapts to varying monitoring needs and shifting network conditions. It uses a dual-timescale probing approach: (1) long-period Auxiliary Probes (APs) gather broad network status and guide topology coverage via a DFS-based deployment, while (2) short-period Dynamic Probes (DPs) focus on task-specific data collection. To determine DP paths, AdapINT employs a deep reinforcement learning-based algorithm (DPPD), enhanced with transfer learning to optimize for diverse objectives like minimal latency, bandwidth efficiency, or coverage.
Li et al. [48] propose a suite of MTU-aware path segmentation algorithms designed to adapt In-Band Network Telemetry (INT) to real-world MTU constraints while maintaining comprehensive link coverage. The authors propose single path planning algorithms which cover the entire network with the lowest southbound communication overhead, and then propose the INT-Segment algorithm to divide the single long path generated in the previous step into multiple path segments.
Polverini et al. [49] propose SPAN, a selective telemetry framework that strategically applies spatial sampling to dramatically reduce INT overhead. It intelligently selects a subset of network locations for telemetry based on spatial correlations, thereby minimizing redundant data collection while still capturing the essential network dynamics. SPAN combines a theoretical model that optimizes sampling points with real-world experiments to validate performance.
Shou et al. [66] introduce DynaMap, which dynamically plans and remaps telemetry queries such as filters, sketches, and aggregations across programmable switch data planes and external stream processors, adapting in real time to shifting traffic patterns and query workloads. By formally modeling this mapping problem and implementing a heuristic execution algorithm, the system offloads as much processing as possible onto data-plane targets at runtime.
Discussion: Treating the network as a single measurement substrate enables global coverage, coordinated sampling, and rapid fault localization, but forces constant trade-offs among coverage, accuracy, and cost. Placement and path planning problems (for taps, probes, or INT routes) are NP-hard, so systems balance optimality with greedy or heuristic orchestration to keep control-plane churn and southbound updates in check. SDN polling frameworks and coordinated sketches distribute load and reduce duplication, yet must contend with per switch resource limits (TCAM/SRAM, pipeline stages) and multi-pipeline ASIC. Open challenges include ochestraction across heterogeneous vendors/targets, policy isolation, incremental deployment in hybrid (legacy + P4) fabrics.

4.4. Hybrid

Minlan Yu et al. [78] present SNAP, which passively collects TCP level statistics and socket call logs at hosts with low overhead. It then correlates these metrics across hosts, links, switches, and application components to pinpoint the root cause of performance issues whether they stem from application behavior (e.g., send-buffer misuse), OS-level interactions, or network congestion.
Handigol et al. [72] introduce NetSight. It generates small “postcards” at each switch; logging details like packet header, switch ID, output port, and matched flow rules, which are then collected and assembled into complete end-to-end packet trajectories. Operators can query these histories using expressive filters (e.g., “which switch modified this flow’s header?”), enabling fast root-cause analysis of misconfigurations, loops, or unexpected path behaviors.
Rasley et al. [73] introduce Planck, an innovative, SDN driven measurement architecture designed for ultra-fast monitoring on commodity data-center switches. It repurposes oversubscribed port mirroring, redirecting traffic from multiple ports into a single monitor port, as a high speed sampling mechanism. Downstream Planck collectors then analyze these traffic samples to derive link utilization statistics and detect elephant flows.
Suh et al. [74] present OpenSample, which leverages sFlow packet sampling to deliver near real-time visibility into network load and individual flow behavior. OpenSample exploits commodity switches’ sampling capabilities to achieve a remarkably fast 100 ms control loop. The collected flow samples are forwarded to a centralized controller (built on Floodlight), where they are analyzed to detect elephant flows and measure link utilization.
Masoud et al. [79] propose Trumpet, an active, fine-grained network event monitoring system that runs at end hosts rather than in the network core. It allows operators to define expressive, programmable network-wide events such as congestion bursts, correlated losses, or transient performance anomalies. It detects these events at millisecond latency scales by inspecting every packet at line rate. Trumpet achieves millisecond latency by using a simple trigger language specifying packet filters and predicates, which the controller compiles into per-host triggers. These triggers are installed on software switches (like DPDK-based monitors) to efficiently perform two-phase packet processing: (1) a match-and-scatter phase that matches each incoming packet and keeps per 5-tuple flow statistics; and (2) a gather-test-and-report phase which runs at each trigger’s time granularity, gathers per-trigger statistics, and reports when triggers are satisfied.
Liu et al. [75] present UnivMon, a unified and general sketching framework for monitoring multiple network metrics with one data structure. UnivMon enables accurate estimation of diverse metrics such as heavy hitters, entropy, flow-size distributions, and DDoS detection without customizing sketches for each task. It does this by deploying a multi-level, universal sketch in the data plane, processing every packet through layered counters. In the control plane, different analytics algorithms “late-bind” to the same underlying sketch, extracting metric-specific insights.
Huang et al. [80] propose SketchVisor, a resilient network measurement framework tailored to software-based packet processing platforms like Open vSwitch. It enhances traditional sketch-based data-plane monitoring (e.g., count-min sketches) by adding a dual-path architecture: a normal path that processes packets through full sketches for high accuracy, and a fast path that handles overload conditions. It further recovers accurate network-wide measurement results via compressive sensing.
Tammana et al. [81] presents SwitchPointer, a hybrid telemetry system that combines the strengths of in-network visibility and end-host analysis. Switches operate not as full telemetry stores, but as directory services that record which end-hosts have relevant per-packet state for each time epoch, embedding s w i t c h I D + e p o c h I D into packet headers. Meanwhile, end-hosts log full packet headers and metadata. When a network anomaly is detected at an end-host, the central analyzer queries the switch directories (this pointer service) to pinpoint which hosts should be polled for detailed logs.
Harrison et al. [76] propose a distributed heavy-hitter detection system that operates seamlessly across a network of programmable PISA switches. The system models the network as a single “big switch” and uses adaptive per-switch thresholds to efficiently decide when to report potential heavy-hitters to a central coordinator. It embeds threshold-based detection logic and lightweight sketches directly in the data plane (using P4 and Tofino hardware), minimizing communication overhead.
Liu et al. [69] introduce NetVision, an active, probe-based telemetry platform designed to deliver high coverage and scalable network monitoring over programmable data planes. It supports a suite of API primitives that let operators specify telemetry tasks, such as end-to-end delay measurement, packet rate monitoring, and link/node black hole detection, via a flexible service interface. NetVision proactively injects tailored probe packets with custom paths, constructed using Segment Routing labels that traverse the network infrastructure, collecting targeted state information while minimizing overhead. These probes carry instructions and metadata, enabling in-network devices to report precise metrics back to a central controller, providing fine-grained, service-oriented telemetry with balanced overhead and broad visibility.
Tang et al. [70] introduce Sel-INT, a telemetry framework that enables runtime programmable, selective in-band telemetry using Protocol Oblivious Forwarding (POF) and an extended Open vSwitch (OVS-POF). It reduces the overhead of traditional INT by adjusting the packet sampling rate and telemetry field selection dynamically at runtime. Sel-INT is controlled via POF-enabled flow and group tables that the SDN controller updates on-the-fly, allowing it to modify monitoring locations, data types, and sampling rates. A Data Analyzer parses and interprets telemetry from selected packets, achieving high monitoring accuracy (errors under 3%) while significantly lowering processing overhead and bandwidth consumption.
Min et al. [71] present a scalable cross-domain INT solution tailored for complex, multi-domain networks. It proposes injecting tunneled INT probes across domain boundaries to consistently collect telemetry data without modification to intermediate public networks. The paper details a tunnel-based encapsulation mechanism that preserves INT metadata end-to-end, along with a lightweight message processing pipeline to extract and aggregate cross-domain state.
Xie et al. [77] present FINT, a dynamic, runtime configurable in-band telemetry system optimized for data center environments. It enables network operators to adjust telemetry tasks and metadata fields on the fly, in contrast to fixed intensity INT schemes that cannot adapt to shifting conditions. By introducing a “triple bitmap” mechanism, FINT lets the system selectively embed only the most valuable telemetry metadata including queue depth, latency, or drop rates—into a packet’s INT header. A greedy selection algorithm (MSG) ensures each packet carries maximal useful information while preventing INT headers from growing too large, crucial for reducing flow completion delays in latency sensitive “mice” flows.
Discussion: Hybrid monitoring blends host level signals, in-network evidence, and network-wide orchestration to recover end-to-end context at practical cost. Key tradeoffs include (i) generality versus finite on-chip resources, unified sketches, and multi-query pipelines compete for TCAM/SRAM and pipeline stages, and (ii) timeliness versus control-plane churn, adaptive sampling, and runtime remapping improve freshness but can oscillate and trigger southbound update storms. Open challenges include robust cross-plane causality, i.e., aligning host logs, packet trajectories, and control actions under clock skew and dynamic paths.

5. Open Issues and Future Research Directions

5.1. Scalability

Scalability is a primary concern as networks grow in size, speed, and complexity. Modern networks can consist of thousands of nodes and links, carrying traffic at gigabit or even terabit rates, which means a monitoring system must handle immense volumes of data. A core challenge is that comprehensive telemetry inherently produces a firehose of information, potentially billions of measurement data points per day in a large network. Simply collecting and centralizing all these data can overwhelm links, storage, and processing resources. In real deployments, hard ceilings on export bandwidth, collector throughput, and on-chip resources (SRAM/TCAM/pipeline stages) surface early; per packet or per hop evidence scales with both traffic intensity and path length, and aggressive control plane updates can introduce rule churn that becomes a bottleneck in its own right.
Future research is focused on data reduction and efficient processing techniques that maintain visibility. Research directions include hierarchical telemetry (local, edge, and global collectors) and methods to dynamically adjust the granularity of monitoring based on network conditions (adapting what data are collected at runtime to focus on hot spots). Future monitoring architectures will likely combine streaming analytics (to catch events in real-time) with selective long-term storage (to keep only what is necessary for trend analysis or compliance), ensuring that the system can grow without sacrificing performance or incurring prohibitive costs.

5.2. Performance

Network monitoring should not only scale in volume but also perform efficiently in terms of timeliness and overhead. Performance, in this context, has a dual meaning. First, the monitoring system must operate at high speed to provide real-time or near real-time insights. Second, it must do so without unduly impacting the network’s primary function (forwarding user traffic). There is an inherent tension here: deeper and more frequent measurements can impose overhead on network devices and links, potentially introducing latency or using bandwidth for telemetry data. One open issue is how to balance the fidelity of monitoring with its cost. For example, actively probing a network path with too many test packets could itself contribute to congestion, and overly frequent polling of devices can strain their CPUs.
While programmable switches have introduced computational capabilities into the data plane, they still necessitate offloading certain processing tasks to the control plane. This is primarily due to the intrinsic limitations of programmable data plane devices, which typically lack support for floating-point arithmetic and are constrained to performing operations on integer values. Consequently, network functionalities that depend on complex mathematical computations cannot be directly implemented within the data plane. To address these limitations, approximation algorithms are often employed, accepting a controlled loss in precision to achieve enhanced performance and scalability. Moving forward, there is a clear need for both more effective mechanisms to offload computational tasks to external servers and advances that expand the computational expressiveness of data plane hardware itself.

5.3. Maintenance and Deployment

Maintainability and operability are still major pain points for network-wide telemetry. Future work should make safe change a first-class goal: define telemetry intent declaratively with typed, versioned profiles; automatically discover each device’s capabilities; and use policy-as-code to enforce rate/byte limits and collector backpressure so systems degrade gracefully (for example, adaptive downsampling instead of packet drops).
Heterogeneity and incremental rollout are the norm in production. Different vendors, chip generations, and administrative domains mean not every field or action is supported everywhere. Practical deployments use tiered profiles, a portable baseline plus optional enhancements where hardware allows, combine on-path and off-path methods, and fall back to controller side summaries when programmability is limited. A key research direction is a portable measurement IR that compiles to device specific programs while preserving semantics, paired with capability negotiation so each domain can advertise what it can observe and at what cost.

5.4. Intent-Based Observability

Intent-based observability elevates network monitoring from reactive data collection to proactive, goal driven stewardship.
Rather than configuring countless counters, sketches, and probes by hand, operators now express high-level intents for example, “keep end-to-end latency below 5 ms for premium video flows” or “minimize telemetry overhead during peak traffic.” These are translated into the right mix of network measurement tasks. Continuous telemetry from the network feeds AI/ML analytics that infer the network’s state, predict violations, and plan remedial actions; all while suppressing irrelevant data and surfacing only what matters for the declared intent. This goal-aware posture dramatically reduces noise and speeds troubleshooting. Rather than flooding operators with low-level alerts like “CPU > 90 % , it surfaces context rich findings such as “videos have high jitter”, immediately pointing to policy impact.
This shift sets new research priorities for network-wide telemetry. First is an expressive, verifiable intent language that combines performance SLOs, safety constraints, and explicit cost/overhead budgets, along with compilers that target heterogeneous devices via capability discovery while preserving semantics. Second is stability and safety of adaptive measurement: preventing oscillations when intents trigger changes, bounding control plane churn, and proving resource feasibility before activation. Third is trust and accountability: provenance rich data, skew tolerant correlation across planes, and operator facing explanations of why the system chose a given measurement or action. Finally, the community needs benchmarks and datasets that couple diagnostic accuracy with cost and latency to compare approaches under realistic, network-wide workloads.

5.5. Self-Driving Networks

Self-driving networks take the vision of automated monitoring a decisive step further by closing the loop between measurement, analytics, decision making, and enforcement. A self-driving fabric continuously senses congestion, latency, loss, and policy compliance, then feeds these signals into machine-learning models that predict emerging faults or SLA violations. For example, if a microburst threatens the “≤5 ms latency” constraint for premium video flow, the controller dynamically reallocates queues, tweaks ECMP hashes, or redirects telemetry rates without operator intervention. Crucially, it reasons holistically: decisions on telemetry placement, path reconfiguration, and failure remediation are optimized together rather than in silos. The result is a living, adaptive system that not only observes itself but also learns from every perturbation, gradually refining its policies the way autonomous vehicles refine their driving models. As networks grow to hyperscale and application demands tighten, this self-healing, self-optimizing paradigm is poised to redefine “monitoring” as an active guardian of user experience rather than a passive dashboard of after the fact metrics. Key research directions include co-design of measurement and control so that explainable telemetry plans. Learning components must be robust to drift and partial observability, with explainable decision paths so operators can audit why the system escalated telemetry or changed routes.

5.6. AI Engineering for Network Monitoring

Foundation models (FMs) are emerging as general purpose anomaly detectors and encoders for telemetry. Time series FMs (TSFMs) such as Datadog’s Toto [83] report state of the art forecasting on observability workloads and promise zero shot anomaly detection without per metric tuning, enabled by a large, domain-specific benchmark. Multimodal and domain-specialized LLMs are being positioned to fuse metrics, logs, configs, and topology context for root cause analysis. Cisco’s Deep Network Model (DNM) [84] exemplifies an LLM trained on decades of networking expertise that powers a conversational AI Assistant for issue identification, diagnosis, and remediation guidance.
Key challenges in the area:
  • Data scarcity and generalization: rare failures and proprietary traces limit pretraining. Synthetic data, transfer learning, federation, and large-scale simulators are needed.
  • Latency/compute: inline detection demands model compression, efficient TSFM designs, and edge/offload inference.
  • Interpretability/trust: operators need attributions linking anomalies to specific signals or protocol states.
  • Systems integration: fit into existing net operation workflows and guardrails.
Promising directions include network specific FMs (time-series + configs + topology graphs/GNNs), multimodal architectures that jointly encode telemetry and unstructured logs, and causal reasoning that maps symptoms to fault propagation. A cross-disciplinary agenda: networking, ML, and systems should target self adaptive measurement loops that balance overhead versus visibility while delivering actionable, explainable outputs in real time.

6. Conclusions

The evolution of network monitoring from traditional device centric methods to SDN enabled strategies and onward to fully programmable network observability reveals a clear trajectory toward greater visibility, flexibility, and intelligence in managing networks. In this survey, we highlighted how early monitoring relied on single point metrics and simple flow records, providing limited insight, whereas modern approaches leverage centralized controllers, network-wide telemetry, and in-band data plane programming to achieve fine-grained, real-time observability. Moreover, the shift from reactive monitoring to proactive observability is well underway. Today’s programmable networks can not only detect problems faster but also lay the groundwork for automated remediation through closed-loop control.
Looking forward, several research directions stand out for advancing network-wide monitoring in programmable architectures. Scalability and performance concerns must be addressed so that monitoring systems can keep up with ever expanding networks without overwhelming operators or infrastructure. Intent-based observability will elevate monitoring from metric collection to goal driven verification, continuously mapping measured state to the high level intents expressed by operators or applications. Finally, progress toward self-driving networks promises autonomous control loops that learn from telemetry, anticipate faults, and reconfigure the infrastructure without human intervention. In conclusion, as networks continue to grow in complexity, the advancements in monitoring and observability will play a pivotal role in ensuring these networks remain performant and reliable, and ultimately moving us closer to self-driving networks that can robustly manage their own operations based on the rich telemetry they continuously collect.

Funding

This research received no external funding.

Conflicts of Interest

The authors declare no conflicts of interest.

Abbreviations

The following abbreviations are used in this manuscript:
5GFifth Generation Mobile Network
AIArtificial Intelligence
APIApplication Programming Interface
ASIC   Application Specific Integrated Circuit
ASAutonomous System
BGPBorder Gateway Protocol
CPUCentral Processing Unit
DCMDistributed and Collaborative Monitoring
DPDKData Plane Development Kit
DDoSDistributed Denial of Service
FPGAField-Programmable Gate Array
HTTPHypertext Transfer Protocol
IBNIntent-Based Networking
INTIn-Band Network Telemetry
IoTInternet of Things
IPFIXIP Flow Information eXport
ISPInternet Service Provider
MLMachine Learning
MTUMaximum Transmission Unit
NFVNetwork Function Virtualization
NMSNetwork Management System
OSPFOpen Shortest Path First
P4Programming Protocol-independent Packet Processors
PTPPrecision Time Protocol
QoSQuality of Service
SDNSoftware-Defined Networking
SLAService Level Agreement
SLOService Level Objective
SNMPSimple Network Management Protocol
SRSegment Routing
TCAMTernary Content Addressable Memory
TCPTransmission Control Protocol
TTLTime to Live
VLANVirtual Local Area Network
WANWide Area Network
XAIExplainable Artificial Intelligence

References

  1. Roughan, M. A case study of the accuracy of SNMP measurements. J. Electr. Comput. Eng. 2010, 2010, 812979. [Google Scholar] [CrossRef]
  2. Claise, B. Cisco Systems NetFlow Services Export Version 9. RFC 3954, 2004. Available online: https://doi.org/10.17487/RFC3954 (accessed on 12 September 2025).
  3. Li, Y.; Miao, R.; Kim, C.; Yu, M. FlowRadar: A Better NetFlow for Data Centers. In Proceedings of the 13th USENIX Symposium on Networked Systems Design and Implementation (NSDI 16), Santa Clara, CA, USA, 16–18 March 2016; pp. 311–324. [Google Scholar]
  4. Lee, S.; Levanti, K.; Kim, H.S. Network monitoring: Present and future. Comput. Netw. 2014, 65, 84–98. [Google Scholar] [CrossRef]
  5. Svoboda, J.; Ghafir, I.; Prenosil, V. Network Monitoring Approaches: An Overview. Int. J. Adv. Comput. Netw. Its Secur.—IJCNS 2015, 5, 88–93. [Google Scholar]
  6. So-In, C. A Survey of Network Traffic Monitoring and Analysis Tools. 2006. Available online: https://www.cse.wustl.edu/~jain/cse567-06/ftp/net_traffic_monitors3.pdf (accessed on 1 July 2025).
  7. Kore, A.; Bhat, M.; Gorana, O.; Ghugul, A.; Saha, S. Survey on monitoring of network using open source software. Int. J. Res. Anal. Rev. (IJRAR) 2019, 6, 271–275. [Google Scholar]
  8. Moceri, P. SNMP and Beyond: A Survey of Network Performance Monitoring Tools. 2006. Available online: https://www.cse.wustl.edu/~jain/cse567-06/ftp/net_traffic_monitors2.pdf (accessed on 12 September 2025).
  9. Tsai, P.W.; Tsai, C.W.; Hsu, C.W.; Yang, C.S. Network Monitoring in Software-Defined Networking: A Review. IEEE Syst. J. 2018, 12, 3958–3969. [Google Scholar] [CrossRef]
  10. Zheng, H.; Jiang, Y.; Tian, C.; Cheng, L.; Huang, Q.; Li, W.; Wang, Y.; Huang, Q.; Zheng, J.; Xia, R.; et al. Rethinking Fine-Grained Measurement From Software-Defined Perspective: A Survey. IEEE Trans. Serv. Comput. 2022, 15, 3649–3667. [Google Scholar] [CrossRef]
  11. D’Alconzo, A.; Drago, I.; Morichetta, A.; Mellia, M.; Casas, P. A Survey on Big Data for Network Traffic Monitoring and Analysis. IEEE Trans. Netw. Serv. Manag. 2019, 16, 800–813. [Google Scholar] [CrossRef]
  12. Nobre, J.C.; Mozzaquatro, B.A.; Granville, L.Z. Network-Wide Initiatives to Control Measurement Mechanisms: A Survey. IEEE Commun. Surv. Tutor. 2018, 20, 1475–1491. [Google Scholar] [CrossRef]
  13. Tan, L.; Su, W.; Zhang, W.; Lv, J.; Zhang, Z.; Miao, J.; Liu, X.; Li, N. In-band Network Telemetry: A Survey. Comput. Netw. 2021, 186, 107763. [Google Scholar] [CrossRef]
  14. McKeown, N.; Anderson, T.; Balakrishnan, H.; Parulkar, G.; Peterson, L.; Rexford, J.; Shenker, S.; Turner, J. OpenFlow: Enabling innovation in campus networks. ACM SIGCOMM Comput. Commun. Rev. 2008, 38, 69–74. [Google Scholar]
  15. Bosshart, P.; Daly, D.; Gibb, G.; Izzard, M.; McKeown, N.; Rexford, J.; Schlesinger, C.; Talayco, D.; Vahdat, A.; Varghese, G.; et al. P4: Programming protocol-independent packet processors. SIGCOMM Comput. Commun. Rev. 2014, 44, 87–95. [Google Scholar] [CrossRef]
  16. Estan, C.; Keys, K.; Moore, D.; Varghese, G. Building a better NetFlow. SIGCOMM Comput. Commun. Rev. 2004, 34, 245–256. [Google Scholar] [CrossRef]
  17. Yuan, L.; Chuah, C.N.; Mohapatra, P. ProgME: Towards programmable network measurement. SIGCOMM Comput. Commun. Rev. 2007, 37, 97–108. [Google Scholar] [CrossRef]
  18. Curtis, A.R.; Kim, W.; Yalagandula, P. Mahout: Low-overhead datacenter traffic management using end-host-based elephant detection. In Proceedings of the 2011 Proceedings IEEE INFOCOM, Shanghai, China, 10–15 April 2011; pp. 1629–1637. [Google Scholar] [CrossRef]
  19. Yu, M.; Jose, L.; Miao, R. Software defined traffic measurement with OpenSketch. In Proceedings of the 10th USENIX Conference on Networked Systems Design and Implementation, NSDI’13, Lombard, IL, USA, 2–5 April 2013; pp. 29–42. [Google Scholar]
  20. Yu, C.; Lumezanu, C.; Zhang, Y.; Singh, V.; Jiang, G.; Madhyastha, H.V. FlowSense: Monitoring Network Utilization with Zero Measurement Cost. In Proceedings of the Passive and Active Measurement, Hong Kong, China, 18–19 March 2013; Roughan, M., Chang, R., Eds.; Springer: Berlin/Heidelberg, Germany, 2013; pp. 31–41. [Google Scholar]
  21. Malboubi, M.; Wang, L.; Chuah, C.N.; Sharma, P. Intelligent SDN based traffic (de)Aggregation and Measurement Paradigm (iSTAMP). In Proceedings of the IEEE INFOCOM 2014 - IEEE Conference on Computer Communications, Toronto, ON, Canada, 27 April–2 May 2014; pp. 934–942. [Google Scholar] [CrossRef]
  22. Sun, H.; Li, J.; He, J.; Gui, J.; Huang, Q. OmniWindow: A General and Efficient Window Mechanism Framework for Network Telemetry. In Proceedings of the ACM SIGCOMM 2023 Conference, ACM SIGCOMM ’23, New York, NY, USA, 10–14 September 2023; pp. 867–880. [Google Scholar] [CrossRef]
  23. Landau-Feibish, S.; Liu, Z.; Rexford, J. Compact Data Structures for Network Telemetry. ACM Comput. Surv. 2025, 57, 1–31. [Google Scholar] [CrossRef]
  24. Wang, C.; Tian, Y.; Wu, Y.; Zhang, X. Confluence: Improving network monitoring accuracy on multi-pipeline data plane. Comput. J. 2025, bxaf039. [Google Scholar] [CrossRef]
  25. Narayana, S.; Sivaraman, A.; Nathan, V.; Goyal, P.; Arun, V.; Alizadeh, M.; Jeyakumar, V.; Kim, C. Language-Directed Hardware Design for Network Performance Monitoring. In Proceedings of the Conference of the ACM Special Interest Group on Data Communication, SIGCOMM ’17, Los Angeles, CA, USA, 21–25 August 2017; Association for Computing Machinery: New York, NY, USA, 2017; pp. 85–98. [Google Scholar] [CrossRef]
  26. Gupta, A.; Harrison, R.; Canini, M.; Feamster, N.; Rexford, J.; Willinger, W. Sonata: Query-driven streaming network telemetry. In Proceedings of the 2018 Conference of the ACM Special Interest Group on Data Communication, SIGCOMM ’18, Budapest, Hungary, 20–25 August 2018; Association for Computing Machinery: New York, NY, USA, 2018; pp. 357–371. [Google Scholar] [CrossRef]
  27. Sonchack, J.; Michel, O.; Aviv, A.J.; Keller, E.; Smith, J.M. Scaling Hardware Accelerated Network Monitoring to Concurrent and Dynamic Queries With *Flow. In Proceedings of the 2018 USENIX Annual Technical Conference (USENIX ATC 18), Boston, MA, USA, 11–13 July 2018; pp. 823–835. [Google Scholar]
  28. Chiesa, M.; Verdi, F.L. Network Monitoring on Multi-Pipe Switches. Proc. Acm Meas. Anal. Comput. Syst. 2023, 7, 1–13. [Google Scholar] [CrossRef]
  29. Malkin, G.S. Traceroute Using an IP Option. RFC 1393. 1993. Available online: https://www.rfc-editor.org/info/rfc1393 (accessed on 12 September 2025). [CrossRef]
  30. Snell, Q.O.; Mikler, A.R.; Gustafson, J.L. NetPIPE: A Network Protocol Independent Performance Evaluator. 1996. p. 6. Available online: https://www.researchgate.net/publication/2813386_NetPIPE_A_Network_Protocol_Independent_Performance_Evaluator (accessed on 1 July 2025).
  31. Katz-Bassett, E.; Madhyastha, H.V.; Adhikari, V.K.; Scott, C.; Sherry, J.; Van Wesep, P.; Anderson, T.; Krishnamurthy, A. Reverse traceroute. In Proceedings of the 7th USENIX Conference on Networked Systems Design and Implementation, NSDI’10, San Jose, CA, USA, 28–30 April 2010; p. 15. [Google Scholar]
  32. Zhu, Y.; Kang, N.; Cao, J.; Greenberg, A.; Lu, G.; Mahajan, R.; Maltz, D.; Yuan, L.; Zhang, M.; Zhao, B.Y.; et al. Packet-Level Telemetry in Large Datacenter Networks. In Proceedings of the 2015 ACM Conference on Special Interest Group on Data Communication, SIGCOMM ’15, London, UK, 17–21 August 2015; Association for Computing Machinery: New York, NY, USA, 2015; pp. 479–491. [Google Scholar] [CrossRef]
  33. Kim, C.K.; Sivaraman, A.; Katta, N.; Bas, A.; Dixit, A.; Wobker, L.J. In-band Network Telemetry via Programmable Dataplanes. 2015. Available online: https://nkatta.github.io/papers/int-demo.pdf (accessed on 12 September 2025).
  34. Kim, Y.; Suh, D.; Pack, S. Selective In-band Network Telemetry for Overhead Reduction. In Proceedings of the 2018 IEEE 7th International Conference on Cloud Networking (CloudNet), Tokyo, Japan, 22–24 October 2018; pp. 1–3. [Google Scholar] [CrossRef]
  35. Ben Basat, R.; Ramanathan, S.; Li, Y.; Antichi, G.; Yu, M.; Mitzenmacher, M. PINT: Probabilistic In-band Network Telemetry. In Proceedings of the Annual Conference of the ACM Special Interest Group on Data Communication on the Applications, Technologies, Architectures, and Protocols for Computer Communication, SIGCOMM ’20, Virtual Event, 10–14 August 2020; Association for Computing Machinery: New York, NY, USA, 2020; pp. 662–680. [Google Scholar] [CrossRef]
  36. Papadopoulos, K.; Papadimitriou, P.; Papagianni, C. Deterministic and Probabilistic P4-Enabled Lightweight In-Band Network Telemetry. IEEE Trans. Netw. Serv. Manag. 2023, 20, 4909–4922. [Google Scholar] [CrossRef]
  37. Qian, M.; Cui, L.; Tso, F.P.; Deng, Y.; Jia, W. OffsetINT: Achieving High Accuracy and Low Bandwidth for In-Band Network Telemetry. IEEE Trans. Serv. Comput. 2024, 17, 1072–1083. [Google Scholar] [CrossRef]
  38. Bae, C.; Lee, K.; Kim, H.; Yoon, S.; Hong, J.; Pack, S.; Lee, D. Quantized In-band Network Telemetry for Low Bandwidth Overhead Monitoring. In Proceedings of the 2024 20th International Conference on Network and Service Management (CNSM), Prague, Czech Republic, 28–31 October 2024; pp. 1–5. [Google Scholar] [CrossRef]
  39. Guo, C.; Yuan, L.; Xiang, D.; Dang, Y.; Huang, R.; Maltz, D.; Liu, Z.; Wang, V.; Pang, B.; Chen, H.; et al. Pingmesh: A Large-Scale System for Data Center Network Latency Measurement and Analysis. In Proceedings of the 2015 ACM Conference on Special Interest Group on Data Communication, SIGCOMM ’15, London, UK, 17–21 August 2015; Association for Computing Machinery: New York, NY, USA, 2015; pp. 139–152. [Google Scholar] [CrossRef]
  40. Marques, J.A.; Luizelli, M.C.; da Costa Filho, R.I.T.; Gaspary, L.P. An optimization-based approach for efficient network monitoring using in-band network telemetry. J. Internet Serv. Appl. 2019, 10, 12. [Google Scholar] [CrossRef]
  41. Pan, T.; Song, E.; Bian, Z.; Lin, X.; Peng, X.; Zhang, J.; Huang, T.; Liu, B.; Liu, Y. INT-path: Towards Optimal Path Planning for In-band Network-Wide Telemetry. In Proceedings of the IEEE INFOCOM 2019—IEEE Conference on Computer Communications, Paris, France, 29 April–2 May 2019; pp. 487–495. [Google Scholar] [CrossRef]
  42. Tan, C.; Jin, Z.; Guo, C.; Zhang, T.; Wu, H.; Deng, K.; Bi, D.; Xiang, D. NetBouncer: Active Device and Link Failure Localization in Data Center Networks. In Proceedings of the 16th USENIX Symposium on Networked Systems Design and Implementation (NSDI 19), Boston, MA, USA, 26–28 February 2019; pp. 599–614. [Google Scholar]
  43. Yuan, Q.; Li, F.; Pan, T.; Xu, Y.; Wang, X. INT-react: An O(E) Path Planner for Resilient Network-Wide Telemetry Over Megascale Networks. In Proceedings of the 2022 IEEE 30th International Conference on Network Protocols (ICNP), Lexington, KY, USA, 30 October–2 November 2022; pp. 1–11. [Google Scholar] [CrossRef]
  44. Marques, J.; Gaspary, L. Advancing Network Monitoring and Operation with In-band Network Telemetry and Data Plane Programmability. In Proceedings of the NOMS 2023–2023 IEEE/IFIP Network Operations and Management Symposium, Miami, FL, USA, 8–12 May 2023; pp. 112–119. [Google Scholar] [CrossRef]
  45. Zhang, K.; Su, W.; Shi, H.; Zhang, K.; Zhang, W. GrayINT—Detection and Localization of Gray Failures via Hybrid In-band Network Telemetry. In Proceedings of the 2023 24st Asia-Pacific Network Operations and Management Symposium (APNOMS), Sejong, Republic of Korea, 6–8 September 2023; pp. 405–408. [Google Scholar]
  46. Zhang, Y.; Pan, T.; Zheng, Y.; Song, E.; Liu, J.; Huang, T.; Liu, Y. INT-Balance: In-Band Network-Wide Telemetry with Balanced Monitoring Path Planning. In Proceedings of the ICC 2023 - IEEE International Conference on Communications, Rome, Italy, 28 May–1 June 2023; pp. 2351–2356. [Google Scholar] [CrossRef]
  47. Zhang, P.; Zhang, H.; Pi, Y.; Cao, Z.; Wang, J.; Liao, J. AdapINT: A Flexible and Adaptive In-Band Network Telemetry System Based on Deep Reinforcement Learning. IEEE Trans. Netw. Serv. Manag. 2024, 21, 5505–5520. [Google Scholar] [CrossRef]
  48. Li, F.; Yuan, Q.; Pan, T.; Wang, X.; Cao, J. MTU-Adaptive In-Band Network-Wide Telemetry. IEEE/ACM Trans. Netw. 2024, 32, 2315–2330. [Google Scholar] [CrossRef]
  49. Polverini, M.; Sardellitti, S.; Barbarossa, S.; Cianfrani, A.; Di Lorenzo, P.; Listanti, M. Reducing the In band Network Telemetry overhead through the spatial sampling: Theory and experimental results. Comput. Netw. 2024, 242, 110269. [Google Scholar] [CrossRef]
  50. Suh, K.; Guo, Y.; Kurose, J.; Towsley, D. Locating network monitors: Complexity, heuristics, and coverage. In Proceedings of the Proceedings IEEE 24th Annual Joint Conference of the IEEE Computer and Communications Societies, Miami, FL, USA, 13–17 March 2005; Volume 1, pp. 351–361. [Google Scholar] [CrossRef]
  51. Sekar, V.; Reiter, M.K.; Willinger, W.; Zhang, H.; Kompella, R.R.; Andersen, D.G. CSAMP: A system for network-wide flow monitoring. In Proceedings of the 5th USENIX Symposium on Networked Systems Design and Implementation, NSDI’08, San Francisco, CA, USA, 16–18 April 2008; pp. 233–246. [Google Scholar]
  52. Liu, C.; Malboubi, A.; Chuah, C.N. OpenMeasure: Adaptive flow measurement & inference with online learning in SDN. In Proceedings of the 2016 IEEE Conference on Computer Communications Workshops (INFOCOM WKSHPS), San Francisco, CA, USA, 10–14 April 2016; pp. 47–52. [Google Scholar] [CrossRef]
  53. Gu, J.; Song, C.; Dai, H.; Shi, L.; Wu, J.; Lu, L. ACM: Accuracy-Aware Collaborative Monitoring for Software-Defined Network-Wide Measurement. Sensors 2022, 22, 7932. [Google Scholar] [CrossRef]
  54. Agarwal, A.; Liu, Z.; Seshan, S. HeteroSketch: Coordinating Network-wide Monitoring in Heterogeneous and Dynamic Networks. In Proceedings of the 19th USENIX Symposium on Networked Systems Design and Implementation (NSDI 22), Renton, WA, USA, 4–6 April 2022; pp. 719–741. [Google Scholar]
  55. Tootoonchian, A.; Ghobadi, M.; Ganjali, Y. OpenTM: Traffic Matrix Estimator for OpenFlow Networks. In Proceedings of the Passive and Active Measurement, Zurich, Switzerland, 7–9 April 2010; Krishnamurthy, A., Plattner, B., Eds.; Springer: Berlin/Heidelberg, Germany, 2010; pp. 201–210. [Google Scholar]
  56. Su, Z.; Wang, T.; Xia, Y.; Hamdi, M. CeMon: A cost-effective flow monitoring system in software defined networks. Comput. Netw. 2015, 92, 101–115. [Google Scholar] [CrossRef]
  57. Yaseen, N.; Sonchack, J.; Liu, V. Synchronized network snapshots. In Proceedings of the 2018 Conference of the ACM Special Interest Group on Data Communication, SIGCOMM ’18, Budapest, Hungary, 20–25 August 2018; Association for Computing Machinery: New York, NY, USA, 2018; pp. 402–416. [Google Scholar] [CrossRef]
  58. Huang, Q.; Sun, H.; Lee, P.P.C.; Bai, W.; Zhu, F.; Bao, Y. OmniMon: Re-architecting Network Telemetry with Resource Efficiency and Full Accuracy. In Proceedings of the Annual Conference of the ACM Special Interest Group on Data Communication on the Applications, Technologies, Architectures, and Protocols for Computer Communication, SIGCOMM ’20, Virtual Event, 10–14 August 2020; Association for Computing Machinery: New York, NY, USA, 2020; pp. 404–421. [Google Scholar] [CrossRef]
  59. Liu, Y.; Foster, N.; Schneider, F.B. Causal network telemetry. In Proceedings of the 5th International Workshop on P4 in Europe, EuroP4 ’22, Rome, Italy, 9 December 2022; Association for Computing Machinery: New York, NY, USA, 2022; pp. 46–52. [Google Scholar] [CrossRef]
  60. Chaudet, C.; Fleury, E.; Lassous, I.G.; Rivano, H.; Voge, M.E. Optimal positioning of active and passive monitoring devices. In Proceedings of the 2005 ACM Conference on Emerging Network Experiment and Technology, CoNEXT ’05, Toulouse, France, 24–27 October 2005; Association for Computing Machinery: New York, NY, USA, 2005; pp. 71–82. [Google Scholar] [CrossRef]
  61. Adrichem, N.; Doerr, C.; Kuipers, F. OpenNetMon: Network monitoring in OpenFlow Software-Defined Networks. In Proceedings of the 2014 IEEE Network Operations and Management Symposium (NOMS), Krakow, Poland, 5–9 May 2014; pp. 1–8. [Google Scholar] [CrossRef]
  62. Yu, Y.; Qian, C.; Li, X. Distributed and collaborative traffic monitoring in software defined networks. In Proceedings of the Third Workshop on Hot Topics in Software Defined Networking, HotSDN ’14, Chicago, IL, USA, 22 August 2014; Association for Computing Machinery: New York, NY, USA, 2014; pp. 85–90. [Google Scholar] [CrossRef]
  63. Ding, D.; Savi, M.; Antichi, G.; Siracusa, D. An Incrementally-Deployable P4-Enabled Architecture for Network-Wide Heavy-Hitter Detection. IEEE Trans. Netw. Serv. Manag. 2020, 17, 75–88. [Google Scholar] [CrossRef]
  64. Zhang, K.; Zhang, W.; Liu, L.; Tan, L.; Zhang, Y.; Gao, W. Hawkeye: Efficient In-band Network Telemetry with Hybrid Proactive-Passive Mechanism. In Proceedings of the 2022 IEEE Intl Conf on Parallel & Distributed Processing with Applications, Big Data & Cloud Computing, Sustainable Computing & Communications, Social Computing & Networking (ISPA/BDCloud/SocialCom/SustainCom), Melbourne, Australia, 17–19 December 2022; pp. 903–912. [Google Scholar] [CrossRef]
  65. Thummar, D.; Nawab, I.; Kulkarni, S.G. Distributed In-band Network Telemetry. In Proceedings of the 2023 IEEE/ACM 23rd International Symposium on Cluster, Cloud and Internet Computing Workshops (CCGridW), Bangalore, India, 1–4 May 2023; pp. 287–289. [Google Scholar] [CrossRef]
  66. Shou, C.; Bhatia, R.; Gupta, A.; Harrison, R.; Lokshtanov, D.; Willinger, W. Query Planning for Robust and Scalable Hybrid Network Telemetry Systems. Proc. ACM Netw. 2024, 2, 1–27. [Google Scholar] [CrossRef]
  67. Ballard, J.R.; Rae, I.; Akella, A. Extensible and scalable network monitoring using OpenSAFE. In Proceedings of the 2010 Internet Network Management Conference on Research on Enterprise Networking, INM/WREN’10, San Jose, CA, USA, 27 April 2010; p. 8. [Google Scholar]
  68. Chowdhury, S.R.; Bari, M.F.; Ahmed, R.; Boutaba, R. PayLess: A low cost network monitoring framework for Software Defined Networks. In Proceedings of the 2014 IEEE Network Operations and Management Symposium (NOMS), Krakow, Poland, 5–9 May 2014; pp. 1–9. [Google Scholar] [CrossRef]
  69. Liu, Z.; Bi, J.; Zhou, Y.; Wang, Y.; Lin, Y. NetVision: Towards Network Telemetry as a Service. In Proceedings of the 2018 IEEE 26th International Conference on Network Protocols (ICNP), Cambridge, UK, 25–27 September 2018; pp. 247–248. [Google Scholar] [CrossRef]
  70. Tang, S.; Li, D.; Niu, B.; Peng, J.; Zhu, Z. Sel-INT: A Runtime-Programmable Selective In-Band Network Telemetry System. IEEE Trans. Netw. Serv. Manag. 2020, 17, 708–721. [Google Scholar] [CrossRef]
  71. Min, C.; Zhao, D.; Lu, H. The Processing Method of the Message Based on the In-band Network Telemetry Technology. In Proceedings of the 2022 International Conference on Service Science (ICSS), Zhuhai, China, 13–15 May 2022; pp. 21–24. [Google Scholar] [CrossRef]
  72. Handigol, N.; Heller, B.; Jeyakumar, V.; Mazières, D.; McKeown, N. I know what your packet did last hop: Using packet histories to troubleshoot networks. In Proceedings of the 11th USENIX Conference on Networked Systems Design and Implementation, NSDI’14, Seattle, WA, USA, 2–4 April 2014; pp. 71–85. [Google Scholar]
  73. Rasley, J.; Stephens, B.; Dixon, C.; Rozner, E.; Felter, W.; Agarwal, K.; Carter, J.; Fonseca, R. Planck: Millisecond-scale monitoring and control for commodity networks. SIGCOMM Comput. Commun. Rev. 2014, 44, 407–418. [Google Scholar] [CrossRef]
  74. Suh, J.; Kwon, T.; Dixon, C.; Felter, W.; Carter, J. OpenSample: A Low-Latency, Sampling-Based Measurement Platform for Commodity SDN. In Proceedings of the 2014 IEEE 34th International Conference on Distributed Computing Systems, Madrid, Spain, 30 June–3 July 2014; pp. 228–237. [Google Scholar] [CrossRef]
  75. Liu, Z.; Manousis, A.; Vorsanger, G.; Sekar, V.; Braverman, V. One Sketch to Rule Them All: Rethinking Network Flow Monitoring with UnivMon. In Proceedings of the 2016 ACM SIGCOMM Conference, SIGCOMM ’16, Florianopolis, Brazil, 22–26 August 2016; Association for Computing Machinery: New York, NY, USA, 2016; pp. 101–114. [Google Scholar] [CrossRef]
  76. Harrison, R.; Cai, Q.; Gupta, A.; Rexford, J. Network-Wide Heavy Hitter Detection with Commodity Switches. In Proceedings of the Symposium on SDN Research, SOSR ’18, Los Angeles, CA, USA, 28–29 March 2018; Association for Computing Machinery: New York, NY, USA, 2018. [Google Scholar] [CrossRef]
  77. Xie, S.; Hu, G.; Xing, C.; Zu, J.; Liu, Y. FINT: Flexible In-band Network Telemetry method for data center network. Comput. Netw. 2022, 216, 109232. [Google Scholar] [CrossRef]
  78. Yu, M.; Greenberg, A.; Maltz, D.; Rexford, J.; Yuan, L.; Kandula, S.; Kim, C. Profiling network performance for multi-tier data center applications. In Proceedings of the 8th USENIX Conference on Networked Systems Design and Implementation, NSDI’11, Boston, MA, USA, 30 March–1 April 2011; pp. 57–70. [Google Scholar]
  79. Moshref, M.; Yu, M.; Govindan, R.; Vahdat, A. Trumpet: Timely and Precise Triggers in Data Centers. In Proceedings of the 2016 ACM SIGCOMM Conference, SIGCOMM ’16, Florianopolis, Brazil, 22–26 August 2016; Association for Computing Machinery: New York, NY, USA, 2016; pp. 129–143. [Google Scholar] [CrossRef]
  80. Huang, Q.; Jin, X.; Lee, P.P.C.; Li, R.; Tang, L.; Chen, Y.C.; Zhang, G. SketchVisor: Robust Network Measurement for Software Packet Processing. In Proceedings of the Conference of the ACM Special Interest Group on Data Communication, SIGCOMM ’17, Los Angeles, CA, USA, 21–25 August 2017; Association for Computing Machinery: New York, NY, USA, 2017; pp. 113–126. [Google Scholar] [CrossRef]
  81. Tammana, P.; Agarwal, R.; Lee, M. Distributed Network Monitoring and Debugging with SwitchPointer. In Proceedings of the 15th USENIX Symposium on Networked Systems Design and Implementation (NSDI 18), Renton, WA, USA, 9–11 April 2018; pp. 453–456. [Google Scholar]
  82. Flajolet, P.; Fusy, É.; Gandouet, O.; Meunier, F. Hyperloglog: The analysis of a near-optimal cardinality estimation algorithm. Discret. Math. Theor. Comput. Sci. 2007, AH, 127–146. [Google Scholar]
  83. Datadog AI. Available online: https://www.datadoghq.com/about/latest-news/press-releases/datadog-ai-research-launches-new-open-weights-ai-foundation-model-and-observability-benchmark/#:~:text=for%20various%20applications (accessed on 18 August 2025).
  84. Cisco AI. Available online: https://blogs.cisco.com/innovation/network-operations-for-the-ai-age (accessed on 18 August 2025).
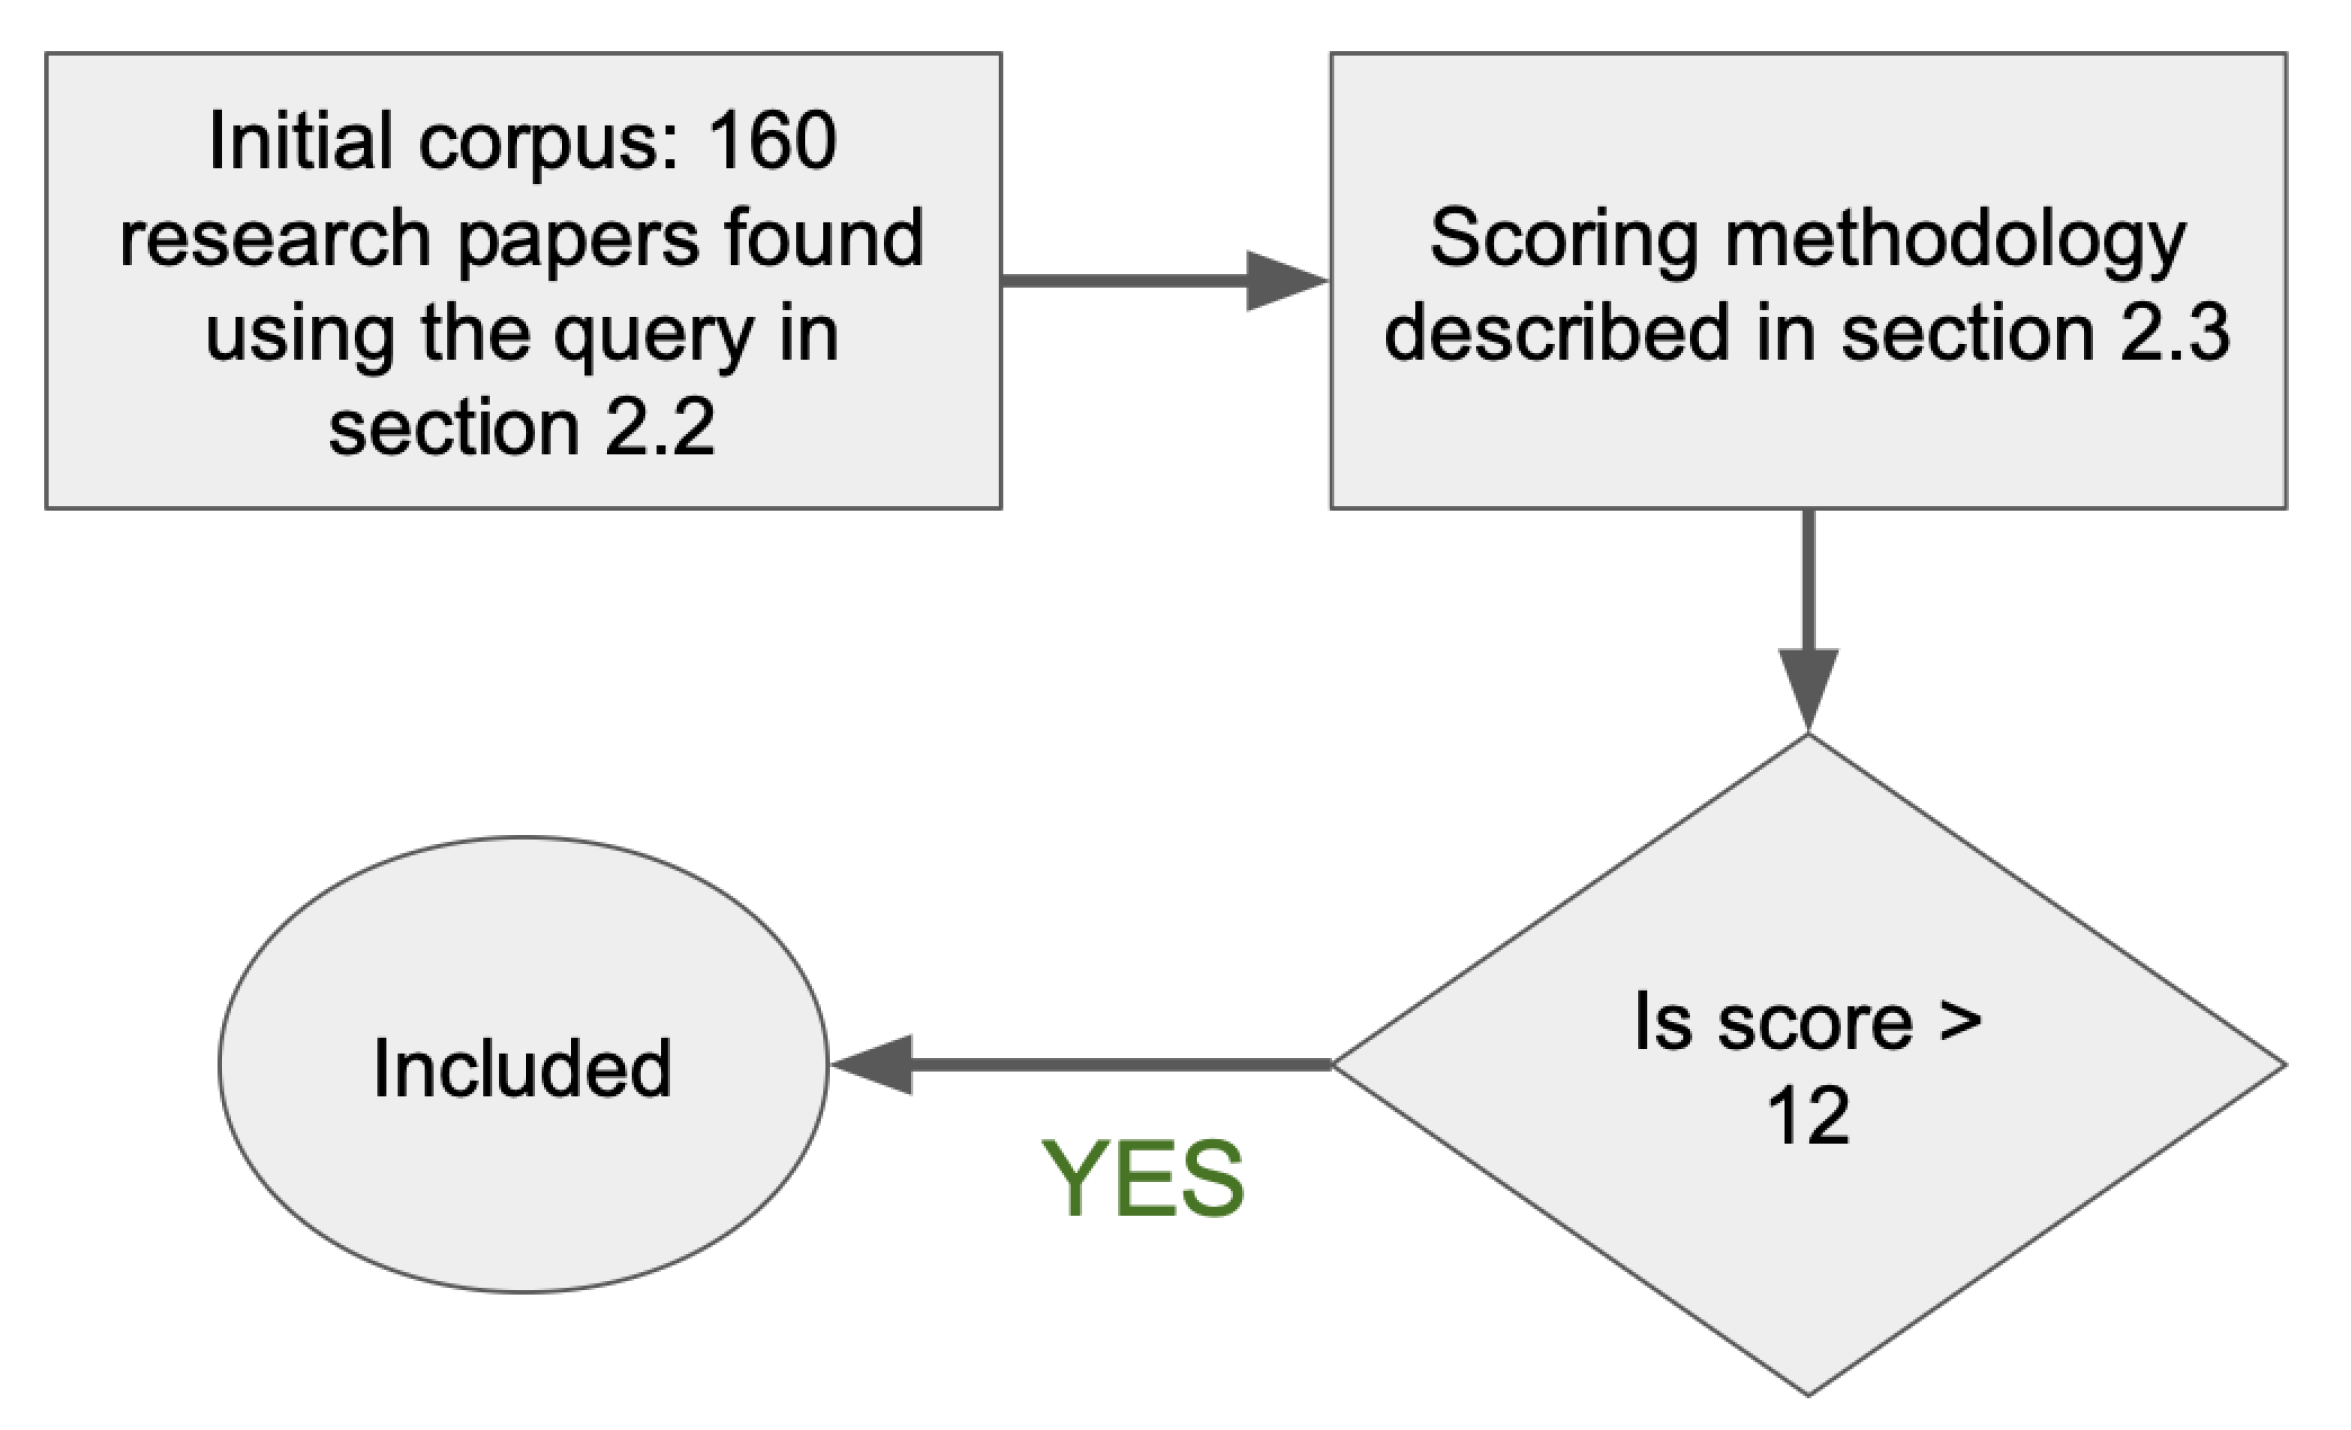
Figure 1. Criteria to filter papers from 160 to 70.
Network 05 00038 g001
Figure 2. Selected papers publication year with the respective citations as of June 2025.
Network 05 00038 g002
Figure 3. Legacy/traditional network where control-plane and data-plane are part of a single switch.
Network 05 00038 g003
Figure 4. Software-defined network where data-plane is separate from logically central controller.
Network 05 00038 g004
Figure 5. Data-plane of a programmable switch.
Network 05 00038 g005
Figure 6. Category breakdown.
Network 05 00038 g006
Table 1. Comparison of prior surveys with this survey.
Prior Survey(s)Scope/PerspectiveHow This Survey Differs
Lee et al. [4]; Svoboda et al. [5]Overview of traditional monitoring: SNMP, flow-level analysis, passive methods.Updates the landscape to SDNs, programmable networks and network-wide monitoring.
SoIn [6]; Kore [7]; Moceri [8]Network monitoring toolsShifts focus from individual tools to system level design principles and end-to-end architectures for next generation network-wide observability.
Tsia et al. [9]; Zheng et al. [10]SDN enabled monitoringUnifies traditional, SDN, and programmable/hybrid settings within a single taxonomy spanning data sources, deployment models, and orchestration
D’Alconzo et al. [11]Big data for traffic monitoringCenters architectural and systemic design: telemetry sources (counters, sketches, probes), placement/orchestration, and deployment trade-offs beyond analytics
Nobre et al. [12]Control and configuration aspects of measurementsIntegrates control/intent with a broader end-to-end taxonomy: telemetry substrates, deployment models (SDN, INT, hybrid), and orchestration frameworks.
Tan et al. [13]In-band Network Telemetry (INT).Generalizes INT as one telemetry pillar within a comprehensive taxonomy spanning traditional polling/counters to programmable and hybrid models.
Table 2. Categories, mechanisms, and representative papers for network monitoring.
CategoryMechanismList of Papers
Single pointLocal sampling, counters, sketches, message interception to controller[16,17,18,19,20,21,22,23,24]
Polling/querying individual nodes[25,26,27,28]
PathActive probing to discover paths and measure path performance[29,30,31,32]
In band network telemetry[33,34,35,36,37,38]
NetworkProbes designed to collectively cover entire network[39,40,41,42,43,44,45,46,47,48,49]
Optimally placing (or updating) monitors to cover all flows, possibly adaptive[50,51,52,53,54]
Optimally polling switches to cover all flows[55,56]
Taking causally consistent snapshots of the network[57,58,59]
Globally optimized distributed measurement tasks and load balancing[60,61,62,63,64,65,66]
Collecting measurements for subset of flows[67,68]
HybridUse probes to collect data across switches and bring to central controller[69,70,71]
Switches report, possibly based on thresholds; data aggregated centrally for correlation[72,73,74,75,76,77]
Event or load driven probes starting from local observations to achieve broader insight[78,79,80]
Switch store pointers to data on end-hosts[81]
Disclaimer/Publisher’s Note: The statements, opinions and data contained in all publications are solely those of the individual author(s) and contributor(s) and not of MDPI and/or the editor(s). MDPI and/or the editor(s) disclaim responsibility for any injury to people or property resulting from any ideas, methods, instructions or products referred to in the content.