


Quality of Experience Experimentation Prediction Framework through Programmable Network Management


Abstract
1. Introduction
- A hybrid simulation environment to run both P4 [2] and Openflow [3], along with Python 2 and 3 instances, DASH and Mininet. With all essential packages installed, an error-free test environment for running this experiment, and applying previous and similar work to compare and contrast results. Our open-source test bed configuration is shown here [4]
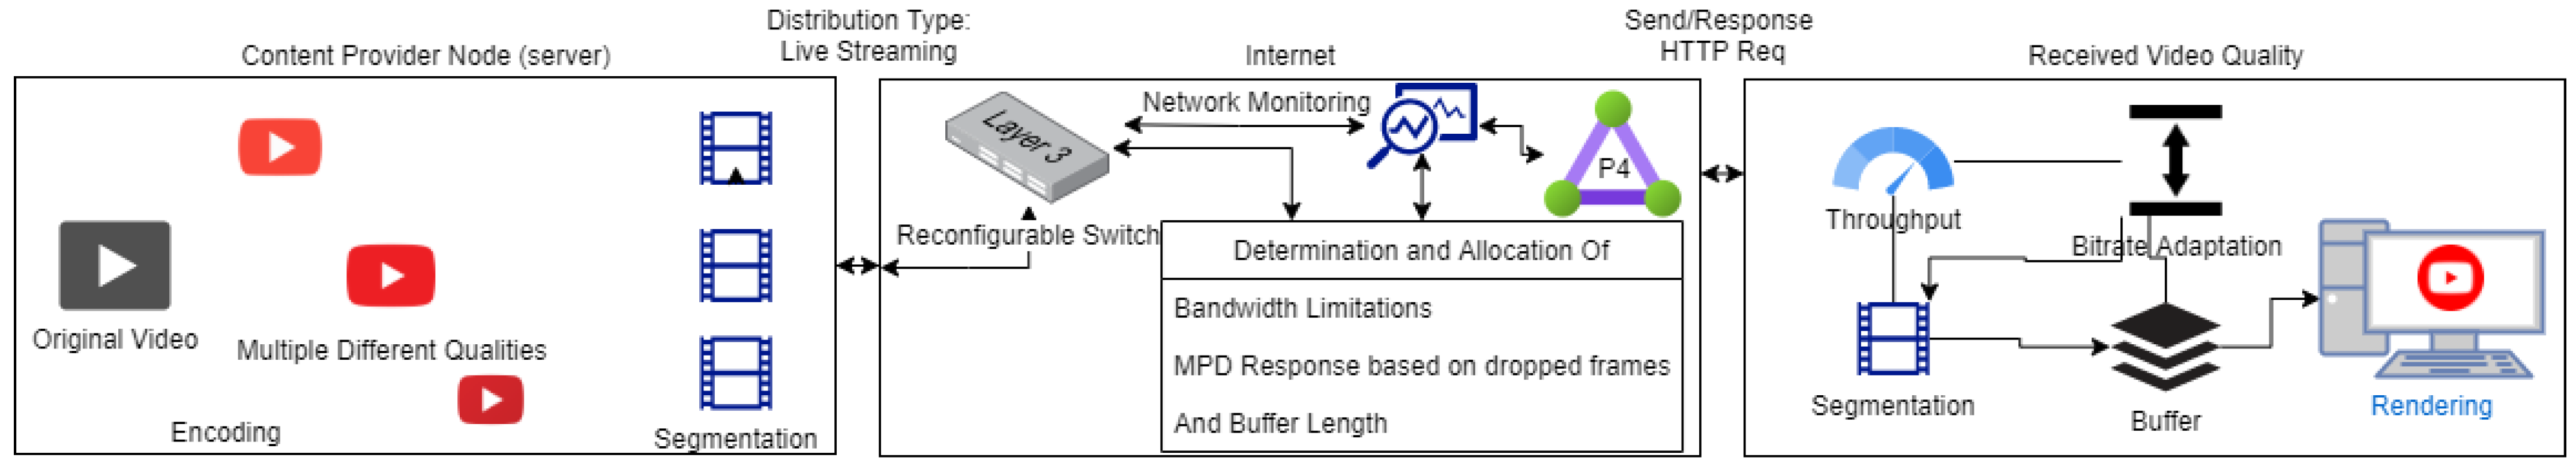
- A P4 SDN test bed over Mininet with the ability to control DASH initial buffering, stalling, switching, monitoring, bit rate adaptation, and bandwidth limitation over selected ports. The test bed provides the capacity for comprehensive user experiments and data collections, which lead to our insights and analysis of congestion for congestion-related experiments along with full re-configurablity over the data plane and everything mentioned above. Our open-source test bed setup is shown here [4]
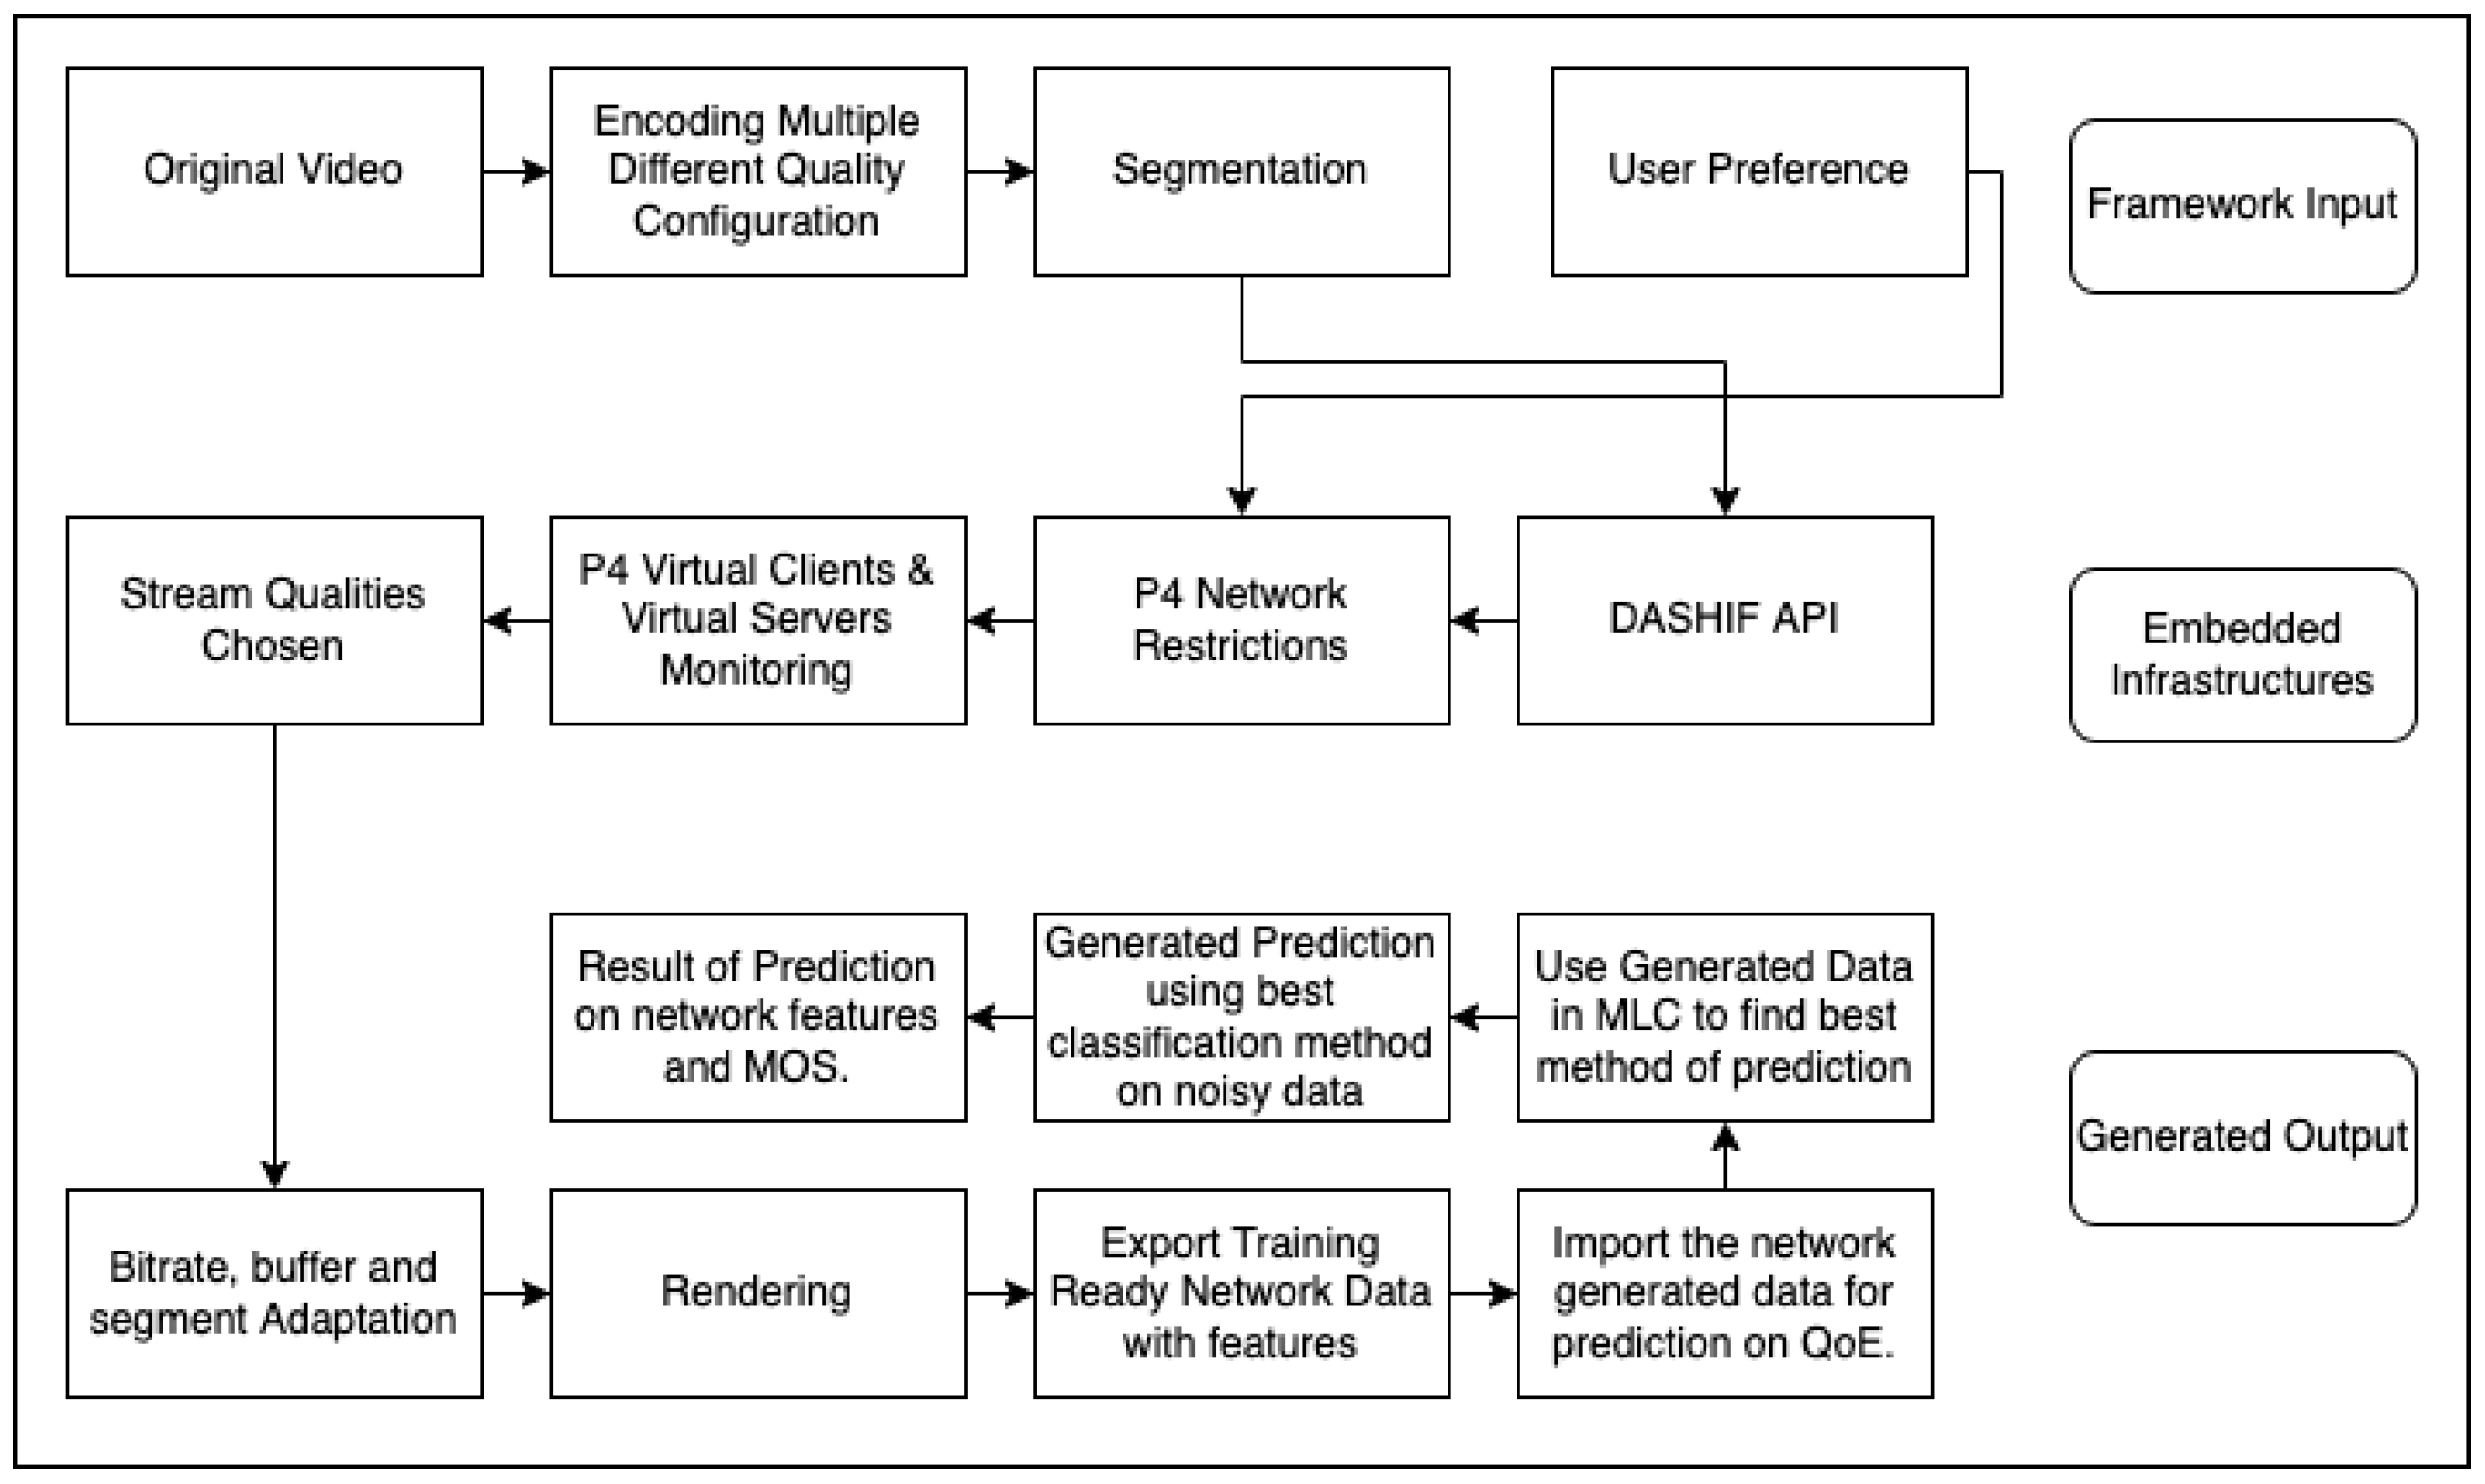
- A proposed experimentation framework structure through programmable network management for the generation of ML training-ready data and MOS/QoE prediction.
- Human experiment with QoE MOS-based feedback to benchmark the accuracy of the predicted QoE and network features.
- Analysis of state-of-the-art machine learning algorithms, along with the creation of an experimentation framework for feature evaluation in network experiments. Our open-source analyses are shown here [4]
2. Problem Space and Related Work
3. Preliminaries and Methodology
3.1. Adaptive Streaming
3.2. DASH Objective Metrics
3.3. Subjective Evaluation of DASH
4. User Experimentation
4.1. General Viewing Conditions
4.2. Technical Test Bed Setup
5. Discussion and Data Analysis
5.1. Experiment Plan and Data Description
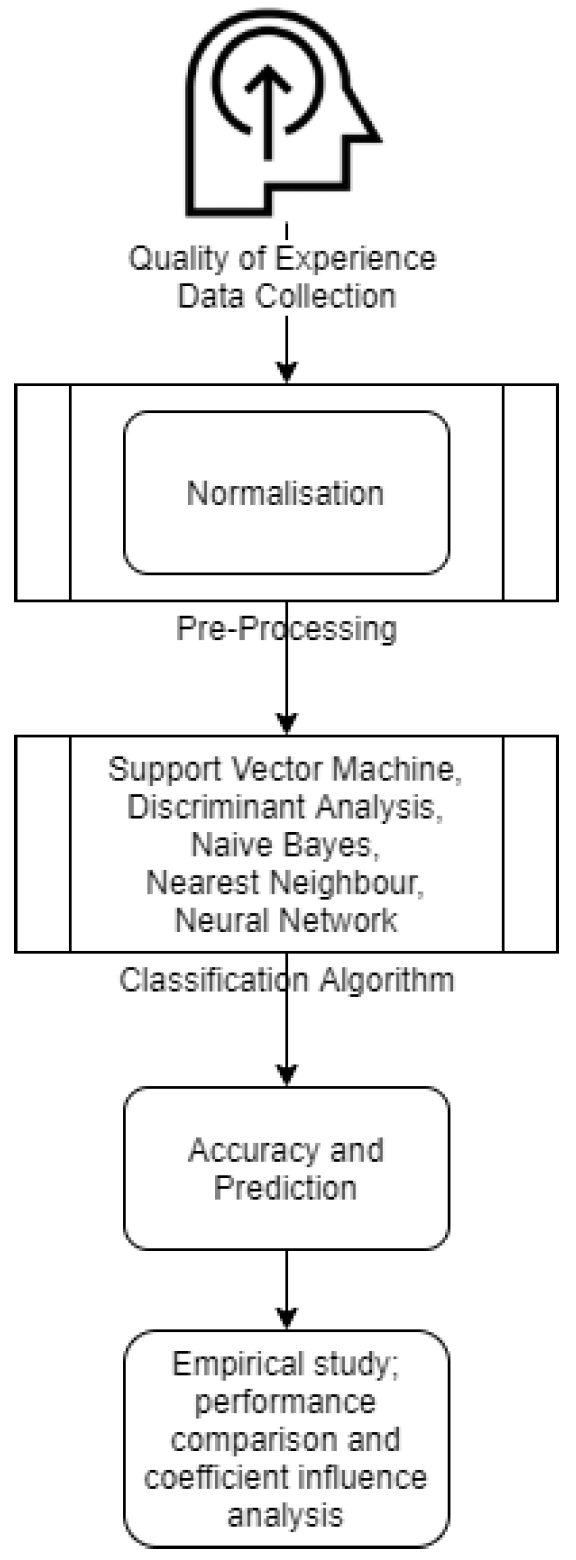
5.2. Machine Learning Classification
5.3. Models Description and Neural Network
5.4. State-of-the-Art Comparison Discussion
6. Conclusions
Author Contributions
Funding
Data Availability Statement
Conflicts of Interest
References
- Basil, A.O.; Mu, M.; Al-Sherbaz, A. A Software Defined Network Based Research on Fairness in Multimedia. In FAT/MM ’19, Proceedings of the 1st International Workshop on Fairness, Accountability, and Transparency in MultiMedia, Nice, France, 25 October 2019; ACM: New York, NY, USA, 2019; pp. 11–18. [Google Scholar] [CrossRef]
- Ke, C.H. P4: Switch: MAC Layer and IP Layer Forwarding. Library of P4 Resources. 2015. Available online: http://csie.nqu.edu.tw/smallko/sdn/p4_forwarding.htm (accessed on 1 October 2018).
- Alsaeedi, M.; Mohamad, M.M.; Al-Roubaiey, A.A. Toward Adaptive and Scalable OpenFlow-SDN Flow Control: A Survey. IEEE Access 2019, 7, 107346–107379. [Google Scholar] [CrossRef]
- Basil, A.O. Experimenation Datasets and Algorithms. 2022. Available online: https://github.com/AhmedOsamaBasil/PhD (accessed on 24 May 2019).
- Yousef, H.; Feuvre, J.L.; Storelli, A. ABR prediction using supervised learning algorithms. In Proceedings of the 2020 IEEE 22nd International Workshop on Multimedia Signal Processing (MMSP), Tampere, Finland, 21–24 September 2020; pp. 1–6. [Google Scholar] [CrossRef]
- Sani, Y.; Raca, D.; Quinlan, J.J.; Sreenan, C.J. SMASH: A Supervised Machine Learning Approach to Adaptive Video Streaming over HTTP. In Proceedings of the 2020 Twelfth International Conference on Quality of Multimedia Experience (QoMEX), Athlone, Ireland, 26–28 May 2020; pp. 1–6. [Google Scholar] [CrossRef]
- Mao, H.; Netravali, R.; Alizadeh, M. Neural Adaptive Video Streaming with Pensieve. In SIGCOMM ’17, Proceedings of the Conference of the ACM Special Interest Group on Data Communication, Los Angeles, CA, USA, 21–25 August 2017; Association for Computing Machinery: New York, NY, USA, 2017; pp. 197–210. [Google Scholar] [CrossRef]
- Meng, Z.; Chen, J.; Guo, Y.; Sun, C.; Hu, H.; Xu, M. PiTree: Practical Implementation of ABR Algorithms Using Decision Trees. In MM ’19, Proceedings of the 27th ACM International Conference on Multimedia, Nice, France, 21–25 October 2019; Association for Computing Machinery: New York, NY, USA, 2019; pp. 2431–2439. [Google Scholar] [CrossRef]
- Zhu, Y.; Song, L.; Xie, R.; Zhang, W. SJTU 4K video subjective quality dataset for content adaptive bit rate estimation without encoding. In Proceedings of the 2016 IEEE International Symposium on Broadband Multimedia Systems and Broadcasting (BMSB), Nara, Japan, 1–3 June 2016; pp. 1–4. [Google Scholar] [CrossRef]
- Moorthy, A.K.; Choi, L.K.; Bovik, A.C.; de Veciana, G. Video Quality Assessment on Mobile Devices: Subjective, Behavioral and Objective Studies. IEEE J. Sel. Top. Signal Process. 2012, 6, 652–671. [Google Scholar] [CrossRef]
- Chen, C.; Choi, L.K.; de Veciana, G.; Caramanis, C.; Heath, R.W.; Bovik, A.C. Modeling the Time—Varying Subjective Quality of HTTP Video Streams With Rate Adaptations. IEEE Trans. Image Process. 2014, 23, 2206–2221. [Google Scholar] [CrossRef] [PubMed]
- Ghadiyaram, D.; Bovik, A.C.; Yeganeh, H.; Kordasiewicz, R.; Gallant, M. Study of the effects of stalling events on the quality of experience of mobile streaming videos. In Proceedings of the 2014 IEEE Global Conference on Signal and Information Processing (GlobalSIP), Atlanta, GA, USA, 3–5 December 2014; pp. 989–993. [Google Scholar] [CrossRef]
- Duanmu, Z.; Zeng, K.; Ma, K.; Rehman, A.; Wang, Z. A Quality-of-Experience Index for Streaming Video. IEEE J. Sel. Top. Signal Process. 2017, 11, 154–166. [Google Scholar] [CrossRef]
- Bampis, C.G.; Li, Z.; Moorthy, A.K.; Katsavounidis, I.; Aaron, A.; Bovik, A.C. Study of Temporal Effects on Subjective Video Quality of Experience. IEEE Trans. Image Process. 2017, 26, 5217–5231. [Google Scholar] [CrossRef] [PubMed]
- Duanmu, Z.; Rehman, A.; Wang, Z. A Quality-of-Experience Database for Adaptive Video Streaming. IEEE Trans. Broadcast. 2018, 64, 474–487. [Google Scholar] [CrossRef]
- Lederer, S.; Mueller, C.; Timmerer, C. Dynamic adaptive streaming over HTTP dataset. In Proceedings of the 3rd Multimedia Systems Conference, Chapel Hill, NC, USA, 22–24 February 2012. [Google Scholar]
- Ben Letaifa, A. Adaptive QoE monitoring architecture in SDN networks: Video streaming services case. In Proceedings of the 2017 13th International Wireless Communications and Mobile Computing Conference (IWCMC), Valencia, Spain, 26–30 June 2017; pp. 1383–1388. [Google Scholar] [CrossRef]
- Wang, L.; Delaney, D.T. QoE Oriented Cognitive Network Based on Machine Learning and SDN. In Proceedings of the 2019 IEEE 11th International Conference on Communication Software and Networks (ICCSN), Chongqing, China, 12–15 June 2019; pp. 678–681. [Google Scholar] [CrossRef]
- Abar, T.; Ben Letaifa, A.; El Asmi, S. Machine learning based QoE prediction in SDN networks. In Proceedings of the 2017 13th International Wireless Communications and Mobile Computing Conference (IWCMC), Valencia, Spain, 26–30 June 2017; pp. 1395–1400. [Google Scholar] [CrossRef]
- Abar, T.; Letaifa, A.B.; Asmi, S.E. Real Time Anomaly detection-Based QoE Feature selection and Ensemble Learning for HTTP Video Services. In Proceedings of the 2019 7th International conference on ICT Accessibility (ICTA), Hammamet, Tunisia, 13–15 December 2019; pp. 1–6. [Google Scholar] [CrossRef]
- Al-Issa, A.E.; Bentaleb, A.; Barakabitze, A.A.; Zinner, T.; Ghita, B. Bandwidth Prediction Schemes for Defining Bitrate Levels in SDN-enabled Adaptive Streaming. In Proceedings of the 2019 15th International Conference on Network and Service Management (CNSM), Halifax, NS, Canada, 21–25 October 2019; pp. 1–7. [Google Scholar] [CrossRef]
- Basil, A.O.; Mu, M.; Al-Sherbaz, A. Novel Quality of Experience Experimentation Framework Through Programmable Network Management. In Proceedings of the 2022 IEEE 19th Annual Consumer Communications Networking Conference (CCNC), Las Vegas, NV, USA, 8–11 January 2022; pp. 485–486. [Google Scholar] [CrossRef]
- INT, I. P.913: Methods for the Subjective Assessment of Video Quality, Audio Quality and Audiovisual Quality of Internet Video and Distribution Quality Television in Any Environment. 2021. Available online: https://www.itu.int/rec/T-REC-P.913-202106-P/en (accessed on 13 June 2022).
- Goto, S.; Shibata, M.; Tsuru, M. Dynamic optimization of multicast active probing path to locate lossy links for OpenFlow networks. In Proceedings of the 2020 International Conference on Information Networking (ICOIN), Barcelona, Spain, 7–10 January 2020; pp. 628–633. [Google Scholar] [CrossRef]
- Bhat, D.; Rizk, A.; Zink, M.; Steinmetz, R. Network Assisted Content Distribution for Adaptive Bitrate Video Streaming. In MMSys’17, Proceedings of the 8th ACM on Multimedia Systems Conference, Taipei Taiwan, 20–23 June 2017; Association for Computing Machinery: New York, NY, USA, 2017; pp. 62–75. [Google Scholar] [CrossRef]
- Bentaleb, A.; Begen, A.C.; Zimmermann, R.; Harous, S. SDNHAS: An SDN-Enabled Architecture to Optimize QoE in HTTP Adaptive Streaming. IEEE Trans. Multimed. 2017, 19, 2136–2151. [Google Scholar] [CrossRef]
- Kleinrouweler, J.W.; Cabrero, S.; Cesar, P. Delivering Stable High-Quality Video: An SDN Architecture with DASH Assisting Network Elements. In MMSys ’16, Proceedings of the 7th International Conference on Multimedia Systems, Klagenfurt, Austria, 10–13 May 2016; Association for Computing Machinery: New York, NY, USA, 2016. [Google Scholar] [CrossRef]
- Bhattacharyya, R.; Bura, A.; Rengarajan, D.; Rumuly, M.; Xia, B.; Shakkottai, S.; Kalathil, D.; Mok, R.K.P.; Dhamdhere, A. QFlow: A Learning Approach to High QoE Video Streaming at the Wireless Edge. IEEE/ACM Trans. Netw. 2022, 30, 32–46. [Google Scholar] [CrossRef]
- Liotou, E.; Samdanis, K.; Pateromichelakis, E.; Passas, N.; Merakos, L. QoE-SDN APP: A Rate-guided QoE-aware SDN-APP for HTTP Adaptive Video Streaming. IEEE J. Sel. Areas Commun. 2018, 36, 598–615. [Google Scholar] [CrossRef]


| Database | Source Videos | Test Videos | Encoding Configurations | Test case Formation | HAS-Related Impairments | Resolution Adaption |
|---|---|---|---|---|---|---|
| LIVEMVQA [10] | 10 | 200 | H.264 at 4 levels | hand-crafted | switching or stalling | No |
| LIVEQHVS [11] | 3 | 15 | H.264 at 21 levels | hand-crafted | switching | No |
| LIVEMSV [12] | 24 | 176 | no compression | hand-crafted | stalling | No |
| Waterloo SQoE-I [13] | 20 | 180 | H.264 at 7 levels | hand-crafted | switching | Yes |
| LIVE-Netflix Video QoE Database [14] | 14 | 112 | H.264 at 6 levels | hand-crafted | initial buffering and stalling and switching | No |
| Waterloo SQoE-III [15] | 20 | 450 | H.264 at 11 levels | simulated | initial buffering and stalling and switching | Yes |
| ITEC DASH [16] | 7 | 131 | H.264 at 6 levels | hand-crafted | initial buffering and stalling and switching | Yes |
| Our Dataset | 6 | 120 | H.264 at 6 levels | simulated | initial buffering and stalling and switching and monitoring | Yes |
| Codec | Bandwidth of Activation | Resolution |
|---|---|---|
| avc1.64001f | 3,134,488 bps | 1024 × 576 |
| avc1.64001f | 4,952,892 bps | 1280 × 720 |
| avc1.640028 | 9,914,554 bps | 1920 × 1080 |
| avc1.64000d | 507,246 bps | 320 × 180 |
| avc1.640015 | 759,798 bps | 480 × 270 |
| avc1.64001e | 1,013,310 bps | 640 × 360 |
| avc1.64001e | 1,883,700 bps | 768 × 432 |
| avc1.640033 | 14,931,538 bps | 3840 × 2160 |
| MOS | Definition | Description | Class |
|---|---|---|---|
| 1 | Bad | Unsatisfactory Perceived Quality | 1 |
| 2 | Poor | Unsatisfactory Perceived Quality | 2 |
| 3 | Fair | Acceptable Perceived Quality | 3 |
| 4 | Good | Satisfactory Perceived Quality | 4 |
| 5 | Excellent | Highly Satisfactory Perceived Quality | 5 |
| Bandwidth | Anchor | Initial Loading Time | Quality Switch Pattern |
|---|---|---|---|
| Low | Low Quality Reference | Long | Auto but constant low quality allocated |
| Medium | Medium Quality Reference | Short, but noticeable | Auto but constant mid range quality allocated |
| High | High Quality Reference | Very Short | Auto, but maximum ranges of quality are allocated |
| Video | Controlled Bandwidth Limitations | Observed Quality Range | Observed Initial Load Delay | Configuration of Quality Switch Pattern | Resolutions Chosen from Segmentation Collection |
|---|---|---|---|---|---|
| Video 1 | Limited to 0.05 Mbits/s | 45,373 | 2.66 s (Long) | Auto but constant low/bad quality allocated | 1 out of 20 Resolutions Chosen |
| Video 2 | Limited to 0.1 Mbits/s | 45,373 to 88,482 | 2.2 s (Long) | Auto but constant low/poor quality allocated | 2 out of 20 Resolutions Chosen |
| Video 3 | Limited to 0.3 Mbits/s | 45,373 to 317,328 | 1.58 s (Short but noticeable) | Auto but constant mid range quality allocated | 2 out of 20 Resolutions Chosen |
| Video 4 | Limited to 0.5 Mbits/s | 45,373 to 503,270 | 1.52 s (Short but noticeable) | Auto but high ranges of quality allocated | 3 out of 20 Resolutions Chosen |
| Video 5 | Unlimited | 987,061 to 3,792,491 | 1.17 s (Very Short) | Auto but maximum ranges of quality allocated | 2 out of 20 Resolutions Chosen |
| Dataset | Features |
|---|---|
| QoE Recored Parameters | Initial Buffer Length |
| Live Buffer Length | |
| Bitrate Downloading | |
| Dropped Frames | |
| Latency | |
| Round-trip Time | |
| Video Resolution | |
| Scoring Factors | vMOS |
| Video/Range (Mbits/s) | Quality Range (bps) | Initial Load Delay (s) |
|---|---|---|
| 0.05 | ≤45,373 | 2.66 |
| 0.1 | ≤88,482 | 2.2 |
| 0.3 | ≤317,328 | 1.58 |
| 0.5 | ≤503,270 | 1.52 |
| unlimited | ≤3,792,491 | 1.17 |
| Feature/MLC Prediction | Reso-Lution (%) | Buffer Length (%) | Bitrate (%) | Dropped Frames (%) | MOS (%) | Total Miss-Classification Cost (MOS) | Prediction Speed (obs/s) (MOS) | Training Time (s) (MOS) |
|---|---|---|---|---|---|---|---|---|
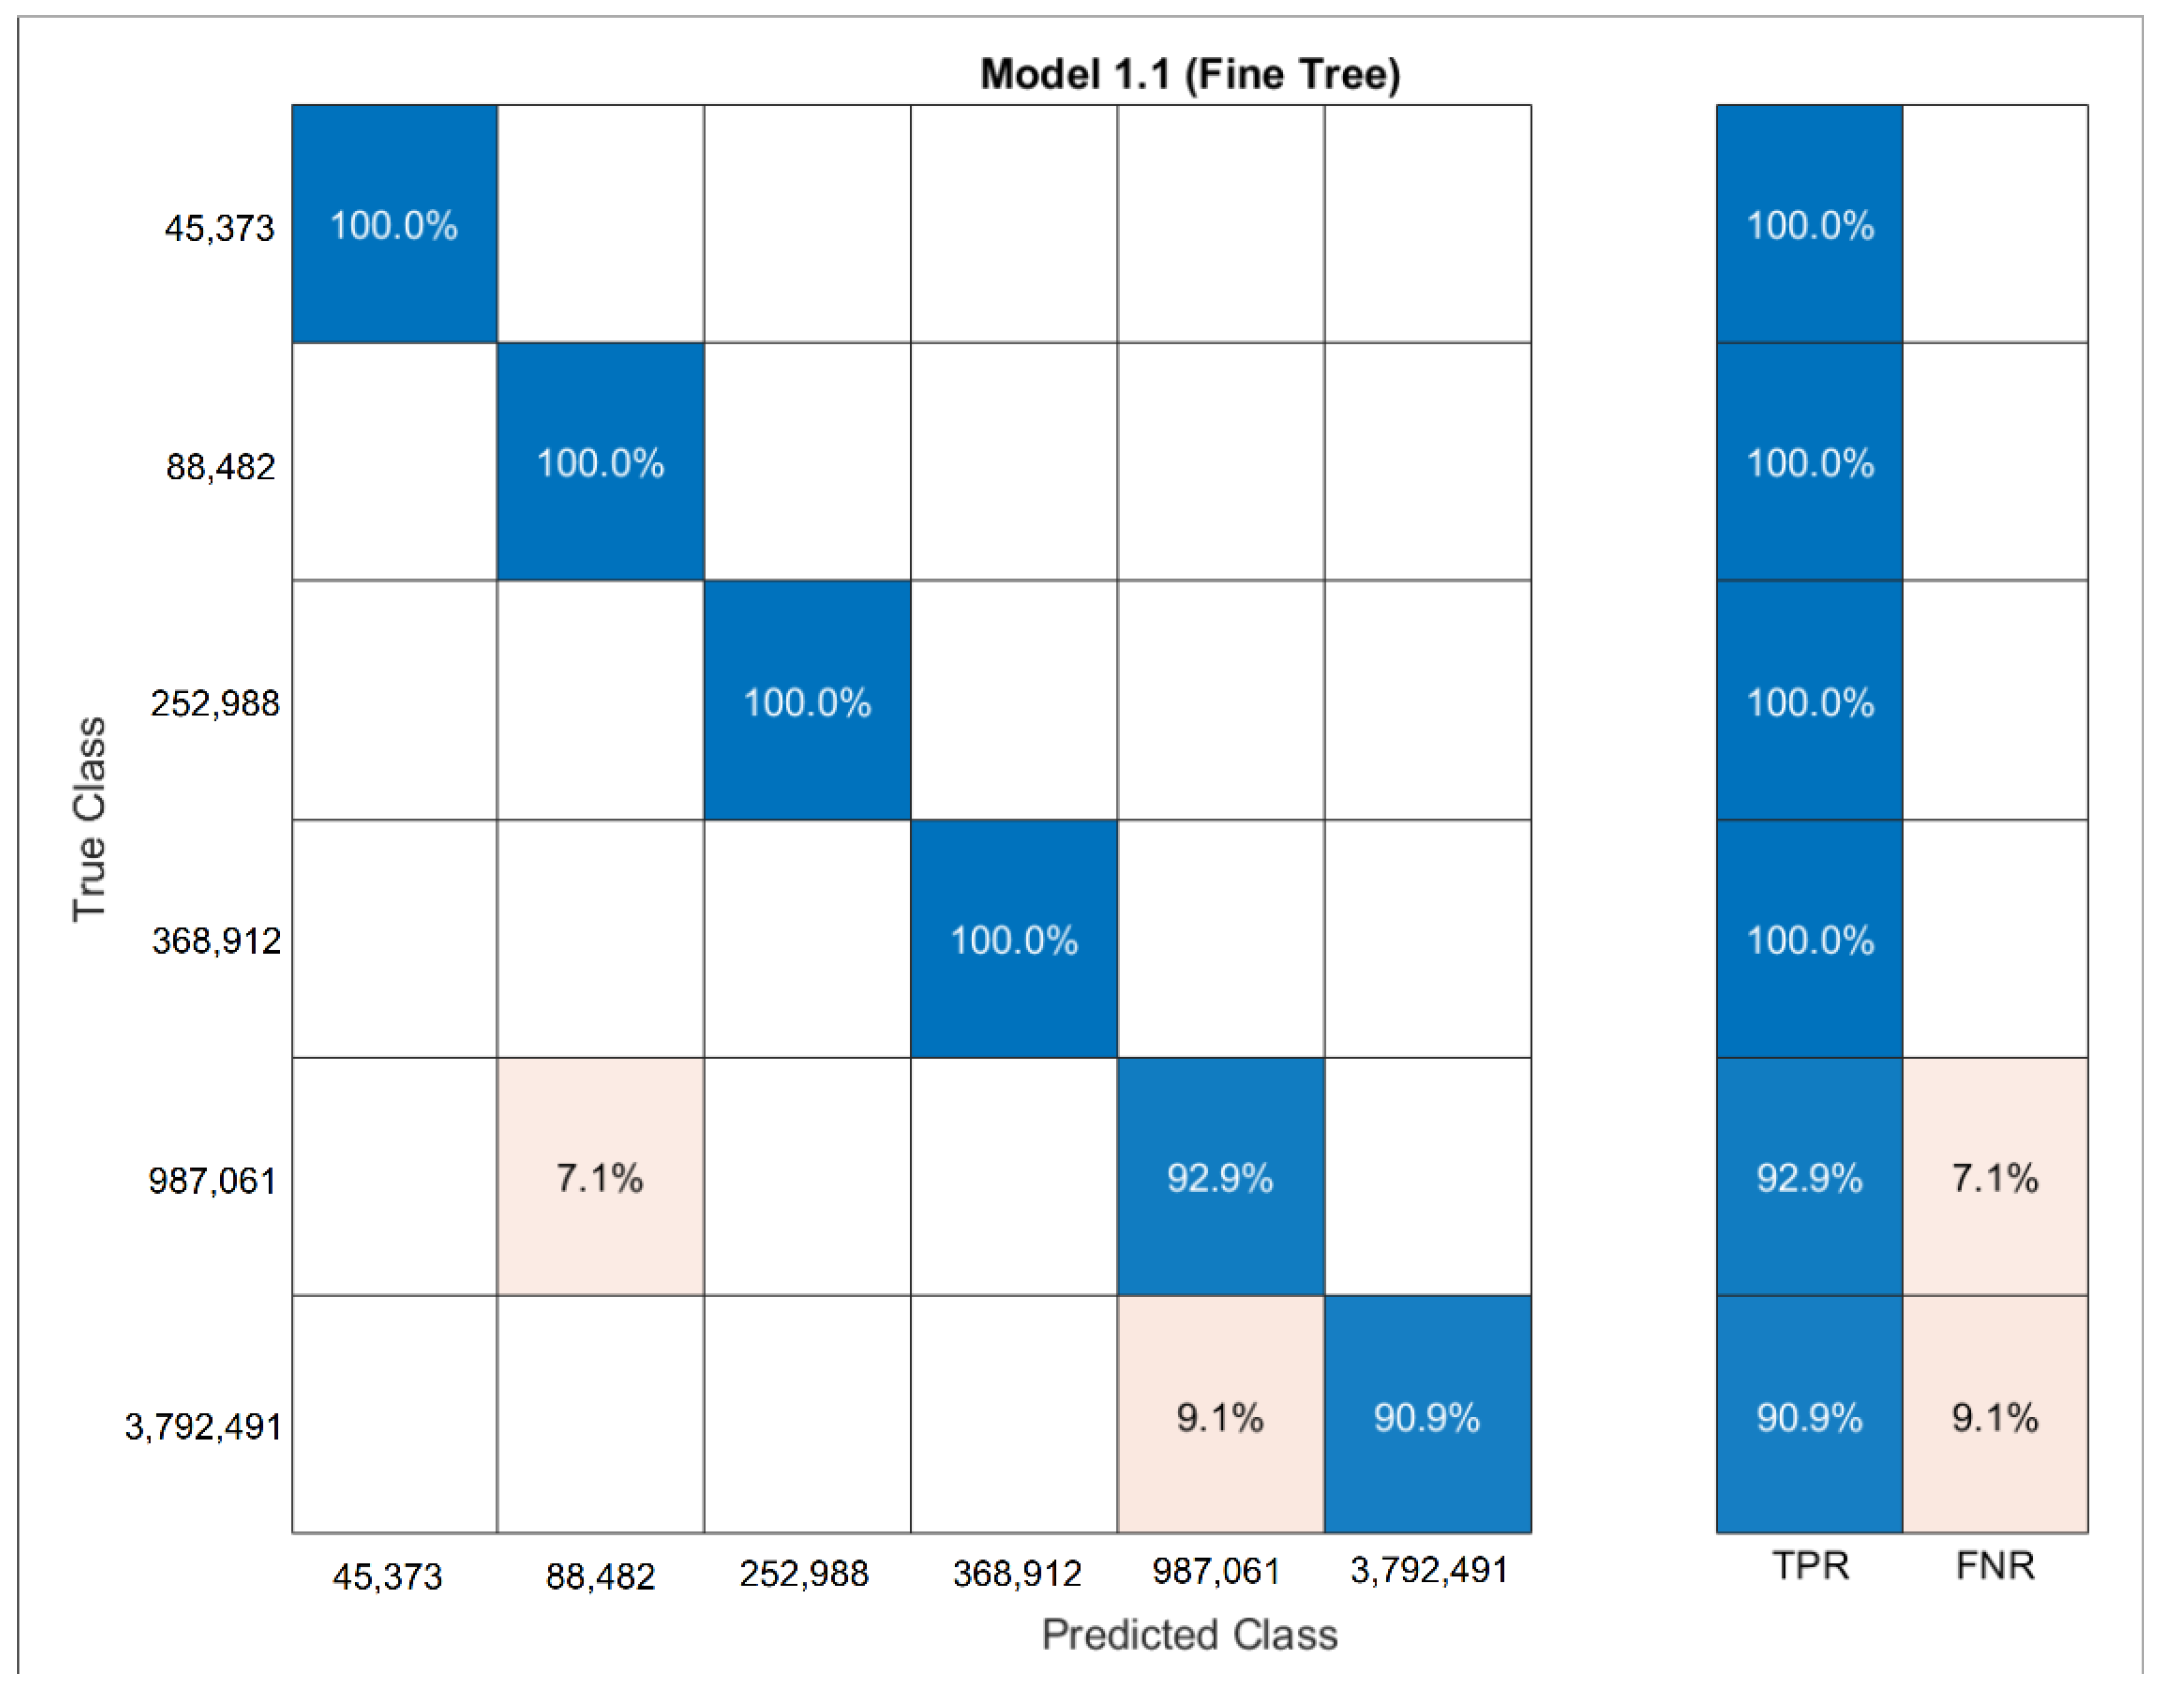
| Fine Tree | 98.8 | 41.2 | 97.6 | 47.1 | 99.4 | 1 | ∼2300 | 5.3971 |
| Medium Tree | 98.8 | 42.4 | 97.6 | 47.1 | 99.4 | 1 | ∼2400 | 4.7336 |
| Coarse Tree | 92.9 | 41.2 | 84.1 | 40.0 | 99.4 | 1 | ∼2400 | 3.7631 |
| Kernel Naive Bayes | 97.6 | N.A. | N.A. | 60.6 | 99.4 | 1 | ∼360 | 12.252 |
| Linear SVM | 74.1 | 44.1 | 66.5 | 42.9 | 79.4 | 35 | ∼1600 | 7.2777 |
| Quadratic SVM | 78.2 | 88.2 | 70.0 | 82.4 | 79.4 | 35 | ∼1600 | 7.0385 |
| Cubic SVM | 78.2 | 88.2 | 70.0 | 86.5 | 79.4 | 35 | ∼2000 | 6.3877 |
| Fine Gaussian SVM | 77.6 | 38.8 | 65.3 | 77.6 | 79.4 | 35 | ∼2100 | 7.0037 |
| Medium Gaussian SVM | 78.2 | 38.8 | 65.9 | 46.5 | 79.4 | 35 | ∼2000 | 7.5385 |
| Coarse Gaussian SVM | 70.6 | 39.4 | 55.9 | 44.7 | 79.4 | 35 | ∼1700 | 7.4505 |
| Fine KNN | 78.2 | 91.2 | 78.2 | 91.8 | 79.4 | 35 | ∼4200 | 8.1421 |
| Medium KNN | 75.9 | 40.0 | 78.2 | 41.2 | 79.4 | 35 | ∼4000 | 8.0454 |
| Coarse KNN | 32.4 | 28.2 | 31.2 | 28.2 | 26.5 | 125 | ∼3900 | 7.9715 |
| Cosine KNN | 75.9 | 40.0 | 78.2 | 41.2 | 79.4 | 35 | ∼5700 | 7.9047 |
| Cubic KNN | 75.9 | 40.0 | 78.2 | 41.2 | 79.4 | 35 | ∼2200 | 8.2537 |
| Weighted KNN | 78.2 | 91.2 | 78.2 | 91.8 | 79.4 | 35 | ∼6000 | 8.1849 |
| Boosted Trees | 32.4 | 48.8 | 96.5 | 61.8 | 26.5 | 125 | ∼4400 | 9.1509 |
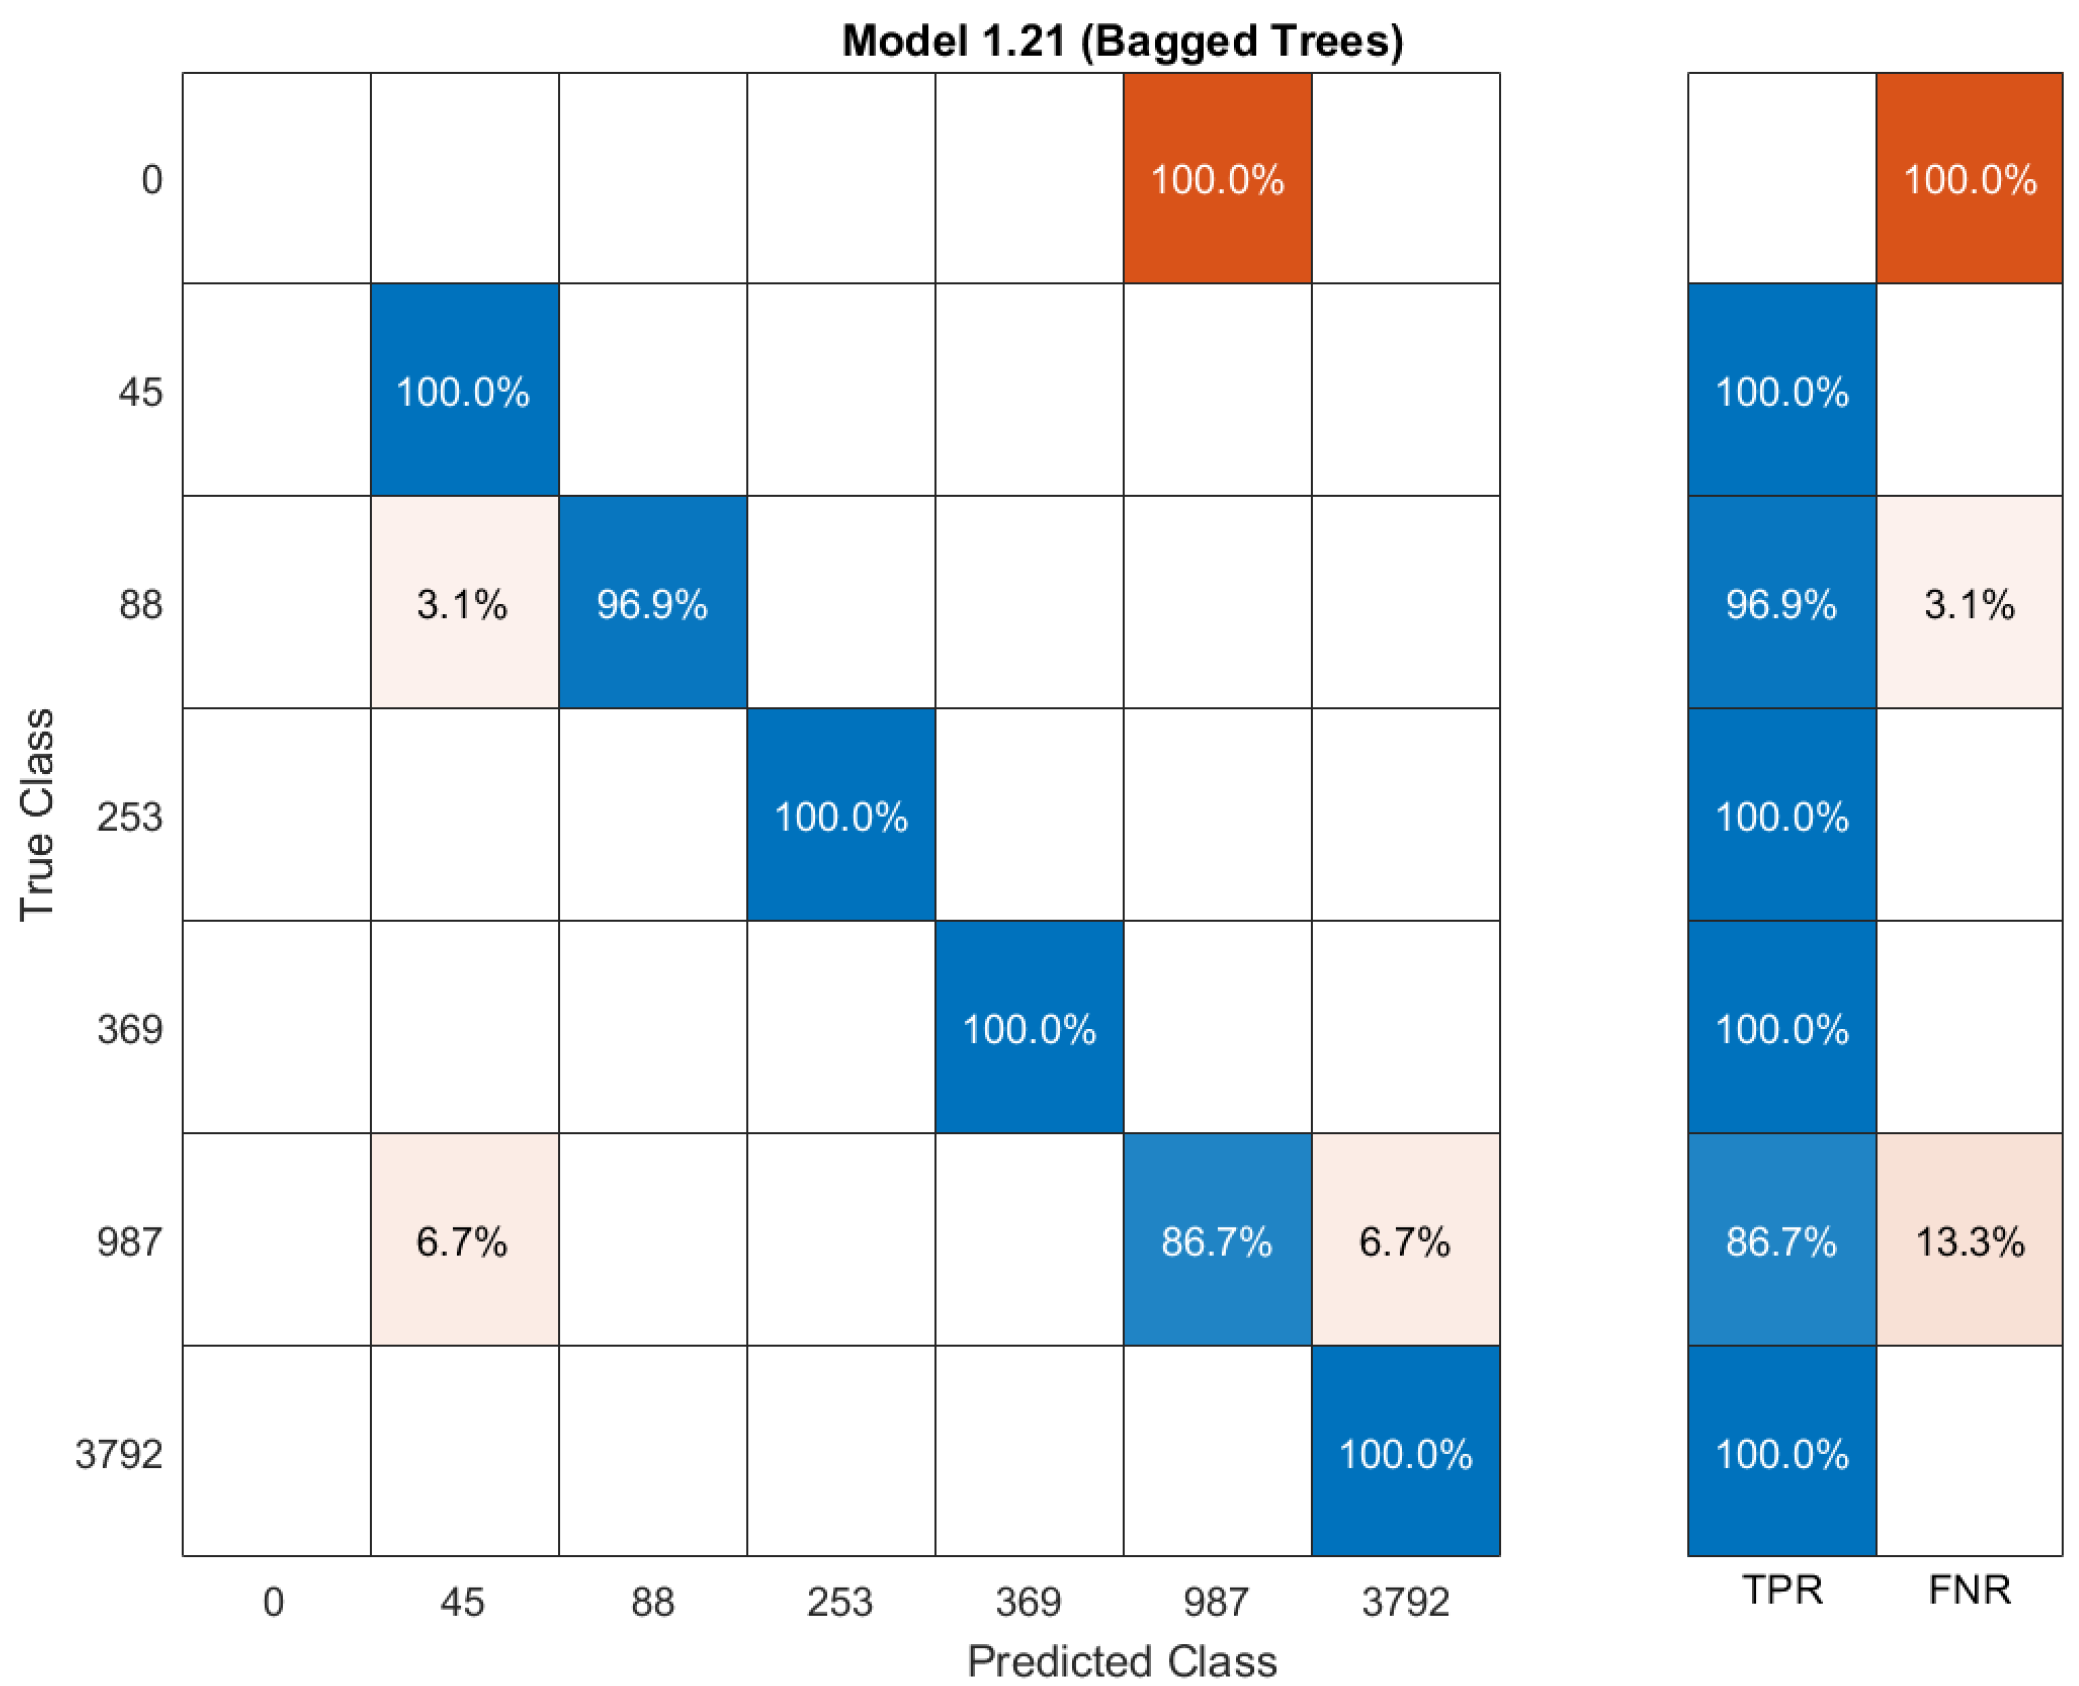
| Bagged Trees | 97.1 | 36.5 | 97.6 | 39.4 | 99.9 | 0 | ∼1200 | 10.69 |
| Subspace Discriminant | 81.2 | 30.6 | 52.9 | 78.2 | 86.5 | 22 | ∼610 | 11.817 |
| Subspace KNN | 84.7 | 85.3 | 82.4 | 70.0 | 85.9 | 32 | ∼560 | 11.567 |
| RUSBoosted Trees | 85.3 | 60.0 | 53.5 | 57.1 | 27.6 | 125 | ∼9200 | 11.404 |
| Feature/MLC Prediction | Resolution | Buffer Length | Bitrate | Dropped Frames | MOS |
|---|---|---|---|---|---|
| Fine Tree | 98.8 | Not ideal | 97.6 | Not ideal | Not ideal |
| Medium Tree | 98.8 | Not ideal | 97.6 | Not ideal | Not ideal |
| Fine KNN | Not ideal | 91.2 | Not ideal | 91.8 | Not ideal |
| Weighted KNN | Not ideal | 91.2 | Not ideal | 91.8 | Not ideal |
| Bagged Tree | Not ideal | Not ideal | Not ideal | Not ideal | 99.9 |
| Solution | Approach | Network | Prediction | HAS Strategy | SDN Add-On | Weakness | Asset | Resolution Adaptation |
|---|---|---|---|---|---|---|---|---|
| Bhat [25], Bentaleb [26] | Hybrid | Fixed | No | Bit Rate Recommendation and buffer level | Internal and external SDN- based resource management components | Outdated User Communication interface | Optimized QoE per user. | No |
| Kleinrouweler [27] | Hybrid | Fixed | No | Chosen bit rates pushed to each user | HAS Aware Service Manager | Users have to manually cooperate with the service manager | Explicit adaptation assistance with fairness criteria | No |
| Bhat [25] | Hybrid | Fixed | ARIMA short term prediction | User assisted with information about cache location and link bandwidth | SABR Module | Overhead due to bandwidth and cache occupancy monitoring | Video segment decision remains at the user’s control (scalable) | No |
| Bhattacharyya [28] | Hybrid | Fixed | No | Optimum bit rate that ensures fairness pushed to user | Orchestrating OpenFlow Module | Utility functions need to be precalculated and stored for all video content at each resolution | Optimized QoE, Heterogeneity support, Fairness | No |
| Liotou [29] | Bit Rate Guidance | Mobile | Longer-term (cluster based) | Rate-guided, prediction-based | QoE-SDN APP | Assumes VSP- MNO collaboration | Network Exposure feedback enabled, no change needed at HAS clients | No |
| Our Experimentation Framework | Hybrid Resolution Adaptation for best QoE Prediction | Fixed, Virtual | Prediction for overall QoE using video’s features and vice versa prediction for video’s features for further experimentation design on network level. | Initial buffering, stalling and switching influenced by network restrictions. | P4 based dataplane configurations to customize network limitations depending on experimentations to export QoE training-ready data. | Overall predictions are exterior to the SDN Testbed | Framework produces network features and QoE noisy data in training ready status along with recommended classifiers for each feature. Open-source Test bed image for recreation and further testings. | Yes |
Publisher’s Note: MDPI stays neutral with regard to jurisdictional claims in published maps and institutional affiliations. |
© 2022 by the authors. Licensee MDPI, Basel, Switzerland. This article is an open access article distributed under the terms and conditions of the Creative Commons Attribution (CC BY) license (https://creativecommons.org/licenses/by/4.0/).
Share and Cite
Al-Mashhadani, A.O.B.; Mu, M.; Al-Sharbaz, A. Quality of Experience Experimentation Prediction Framework through Programmable Network Management. Network 2022, 2, 500-518. https://doi.org/10.3390/network2040030
Al-Mashhadani AOB, Mu M, Al-Sharbaz A. Quality of Experience Experimentation Prediction Framework through Programmable Network Management. Network. 2022; 2(4):500-518. https://doi.org/10.3390/network2040030
Chicago/Turabian StyleAl-Mashhadani, Ahmed Osama Basil, Mu Mu, and Ali Al-Sharbaz. 2022. "Quality of Experience Experimentation Prediction Framework through Programmable Network Management" Network 2, no. 4: 500-518. https://doi.org/10.3390/network2040030
APA StyleAl-Mashhadani, A. O. B., Mu, M., & Al-Sharbaz, A. (2022). Quality of Experience Experimentation Prediction Framework through Programmable Network Management. Network, 2(4), 500-518. https://doi.org/10.3390/network2040030