1. Introduction
Schumann resonances (SRs) occur in the lowest part of the Extra Low Frequencies (ELFs), which extend through a range of 2 Hz–2 kHz. They were named in honor of the German physicist Schumann, who predicted the existence of these waves [
1]; however, it was Balser and Wagner [
2,
3] who confirmed their presence experimentally. They are identified as atmospheric electromagnetic waves in the frequency range of 2 to 50 Hz and are characterized by a set of spectral modes centered around 7.8, 14, 21, 28, and 35 Hz.
SRs have been identified as quasi-stationary electromagnetic waves created in the spherical cavity between the earth’s surface and the lower layers of the ionosphere, which acts as a waveguide. The primary sources of SRs are lightning discharges, which emit electromagnetic radiation in a very wide range of frequencies. These signals are, in turn, amplified by the natural waveguide between the surface of the earth and the lower layers of the ionosphere, thus creating the characteristic resonances.
The interest of the scientific community in SRs during the last 20 years is due to their potential association with various geophysical phenomena, as has been proposed in many publications. Several meteorological, climatological, geophysical, and other parameters have been reportedly related to SR variations [
4,
5,
6,
7,
8]. The collection of SR data presents difficulties and particularities because the final signal is extremely weak (in the order of 10
−12 pT). The reliable extraction of a very weak SR signal from a background of much stronger electromagnetic waves requires good filters that can isolate the frequency range of interest and accurate amplifying steps without distortion and noise. The very low intensity of the original signal requires an observational environment free from parasitic electromagnetic noise. This requires that data collection be performed very far from areas with electromagnetic “contamination”, such as urban areas, electric energy transfer lines, areas with anthropogenic activities, etc. Thus, it becomes clear that SR observations present substantial difficulties in their implementation.
The main purpose of our experiment was to guarantee clear SR measurements free from external parasitic noise. This is very important for the separation of signals created by real geophysical phenomena from electromagnetic interferences incited by anthropogenic sources. We previously performed a similar experiment under different planning [
9]. In that experiment, we obtained and analyzed signals from one recording system in two different places and in three different time periods. In the present attempt, the idea was to work the other way around. We used two different recording systems in the same place at two different dates six months apart from each other. We expect that the results of the present work will assist ELF observers to obtain more clear SR time series.
2. Hardware and Prescriptions of Observations
The experiment took place near the top of Mount Parnon in the south of Greece, close to the town of Sparta in the territory of Laconia (37°13′18.33″ N/22°36′42.12″ E;
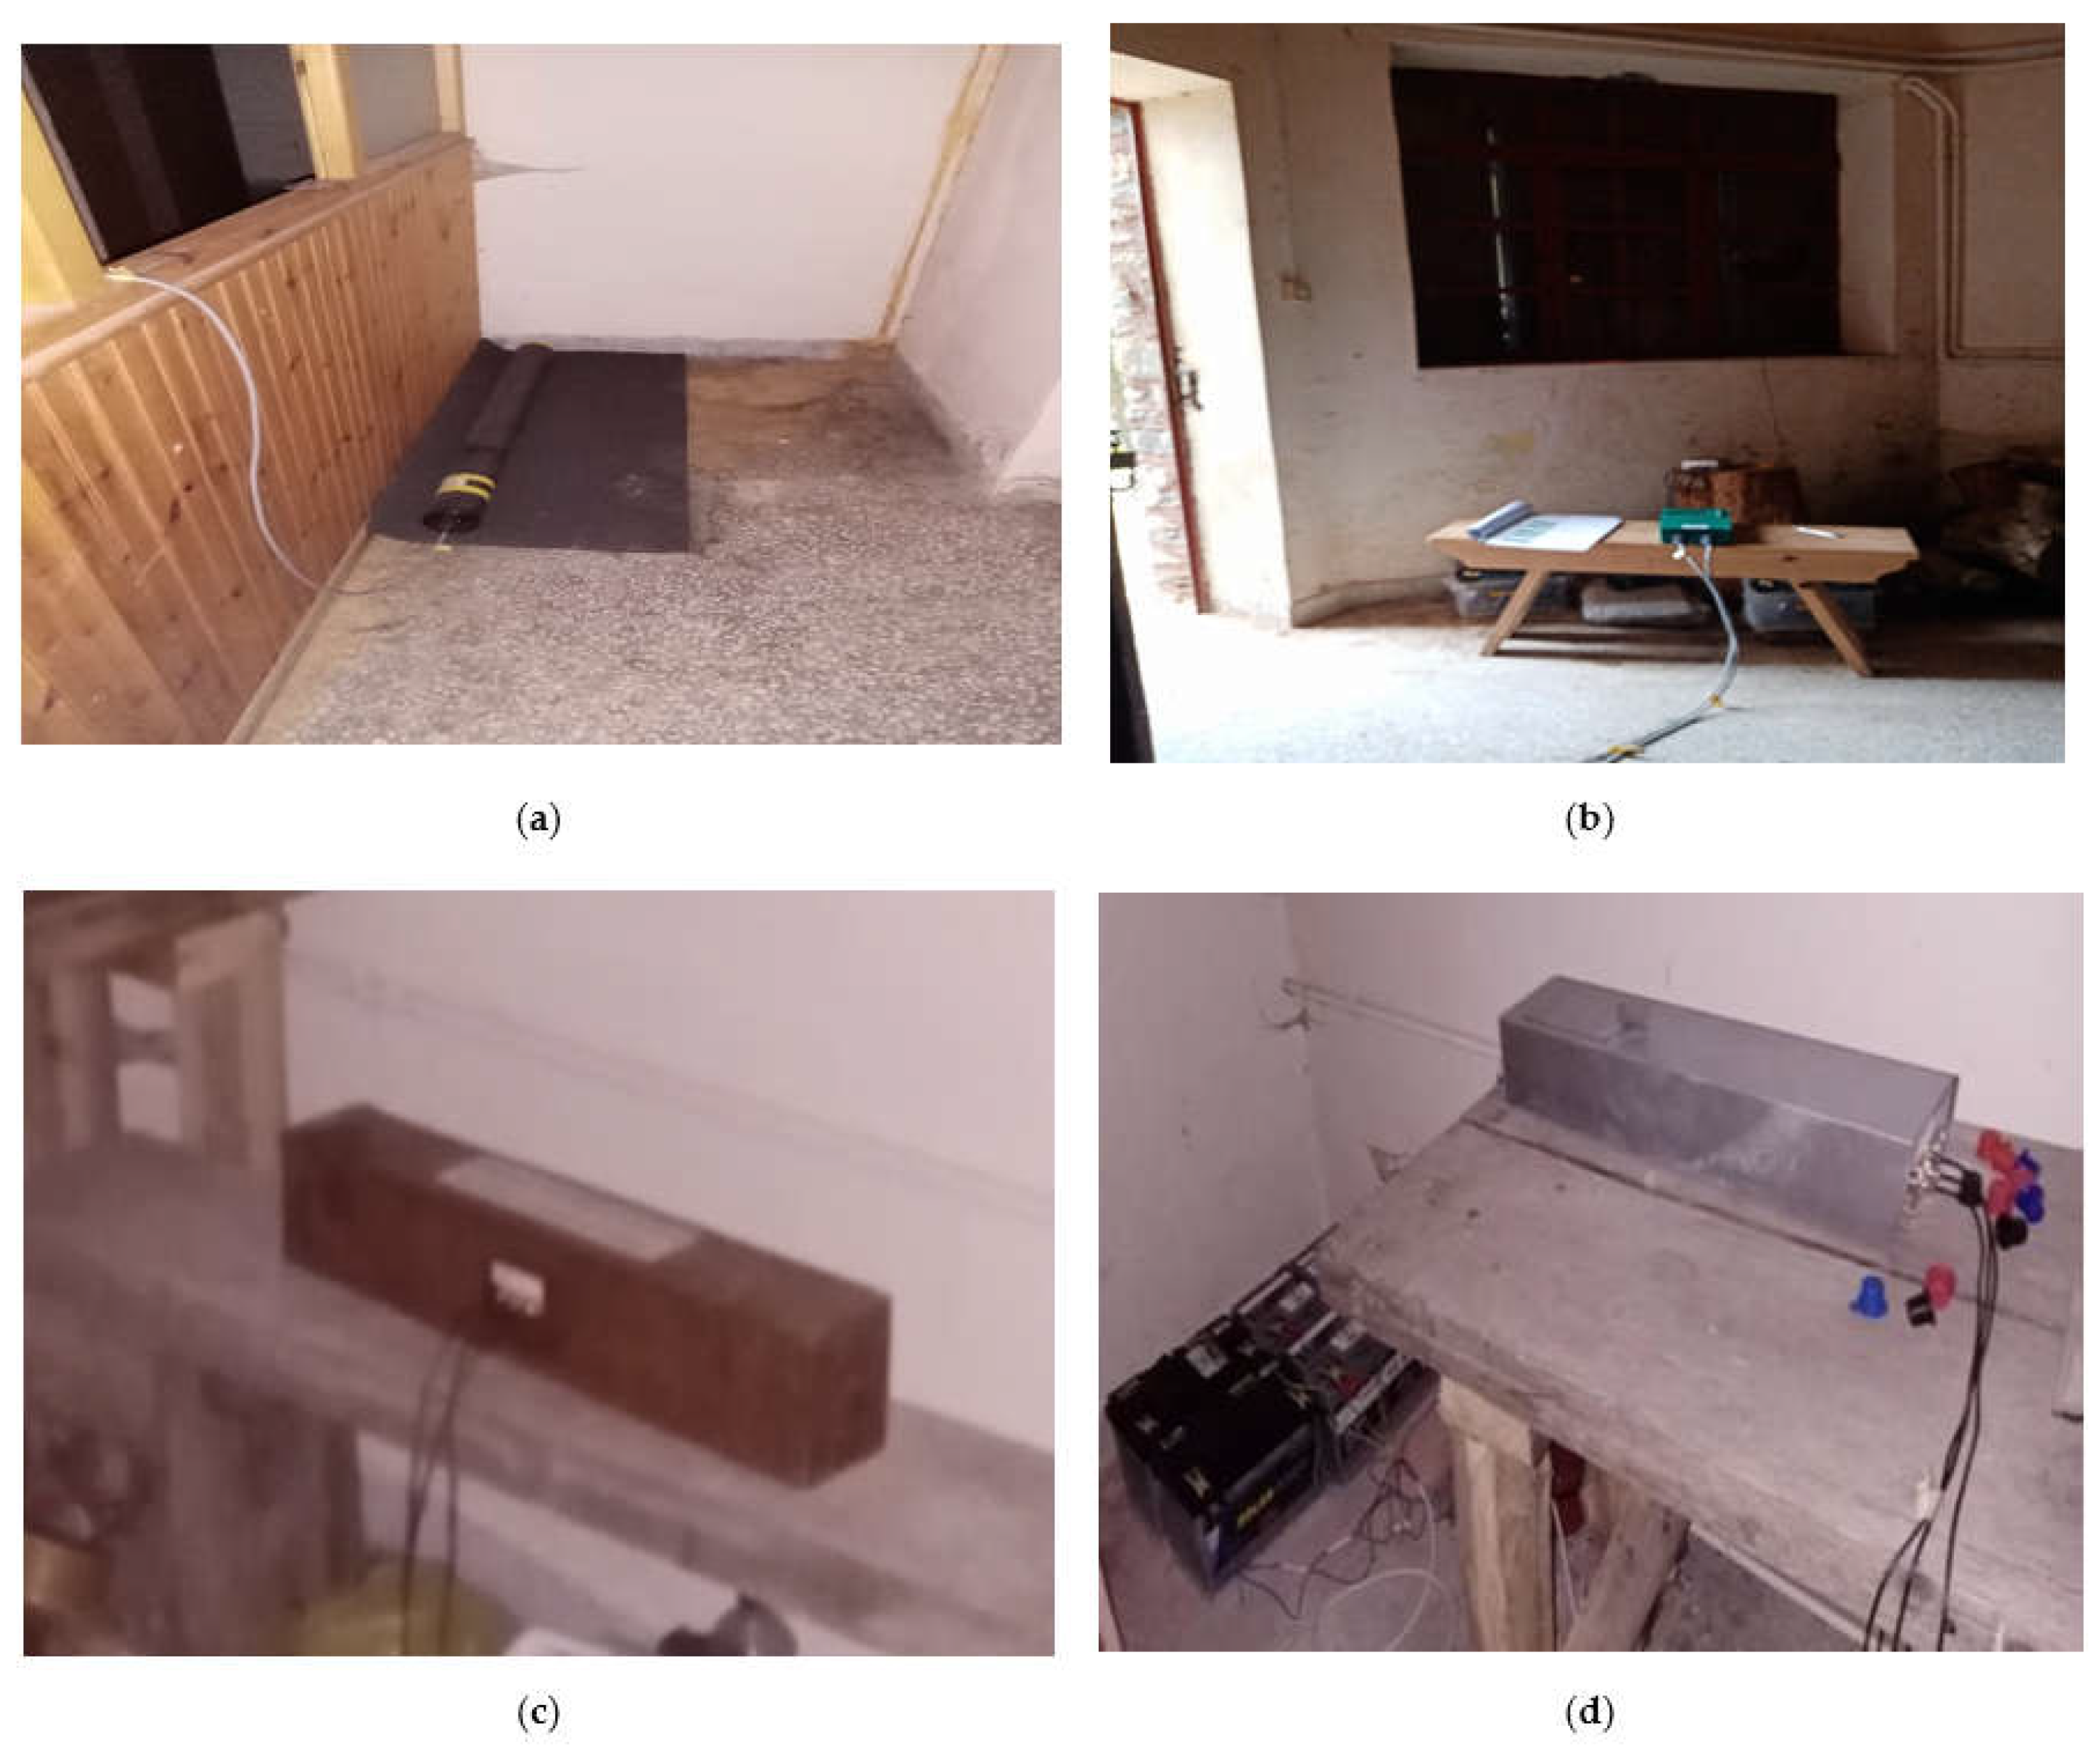
Figure 1a). The experiments consisted of the incitement of several ‘noises’ that simulated the most common disturbances made by walkers and picnickers close to a peaceful observational site, isolated in the countryside. In the present article, the most representative results of these actions are reported. The building in
Figure 1b is a forest shelter that hosts two ELF/SR recording systems. The first is a two-coil system developed and operated by the AGH University in Krakow Poland. It consists of two 100 cm long coils orientated in the north–south and east–west directions with 120,000 turns of copper wire and a two-channel GPS-synchronized logger that stores data in a CF card. The second is a system that was developed in Greece. It consists of a single 60 cm long north–south oriented coil with 40,000 turns of 0.24 mm copper wire and a logger that digitizes recordings and stores them in 10 min files on a simple SD card. Both systems are battery powered. Photos of the main parts of both systems inside the building are presented in
Figure 2.
The technical details of the Greek system can be found in [
10,
11,
12], while details on the Polish system can be found in [
13].
The observation site was far from any electromagnetic contamination source (5 km away from the nearest village) in a very isolated place, which provided an ideal environment for SR measurements. The experiments described below took place on 28 December 2020 and 28 June 2021 from the morning to the early afternoon (08:00–14:00 UT) under fair weather conditions on both dates.
3. Induced Anthropogenic Noises and Parasitic Recordings Observed in Both Systems
Here, we present typical raw SR data and relevant spectra as recorded by both systems during the days when the experiments took place. From
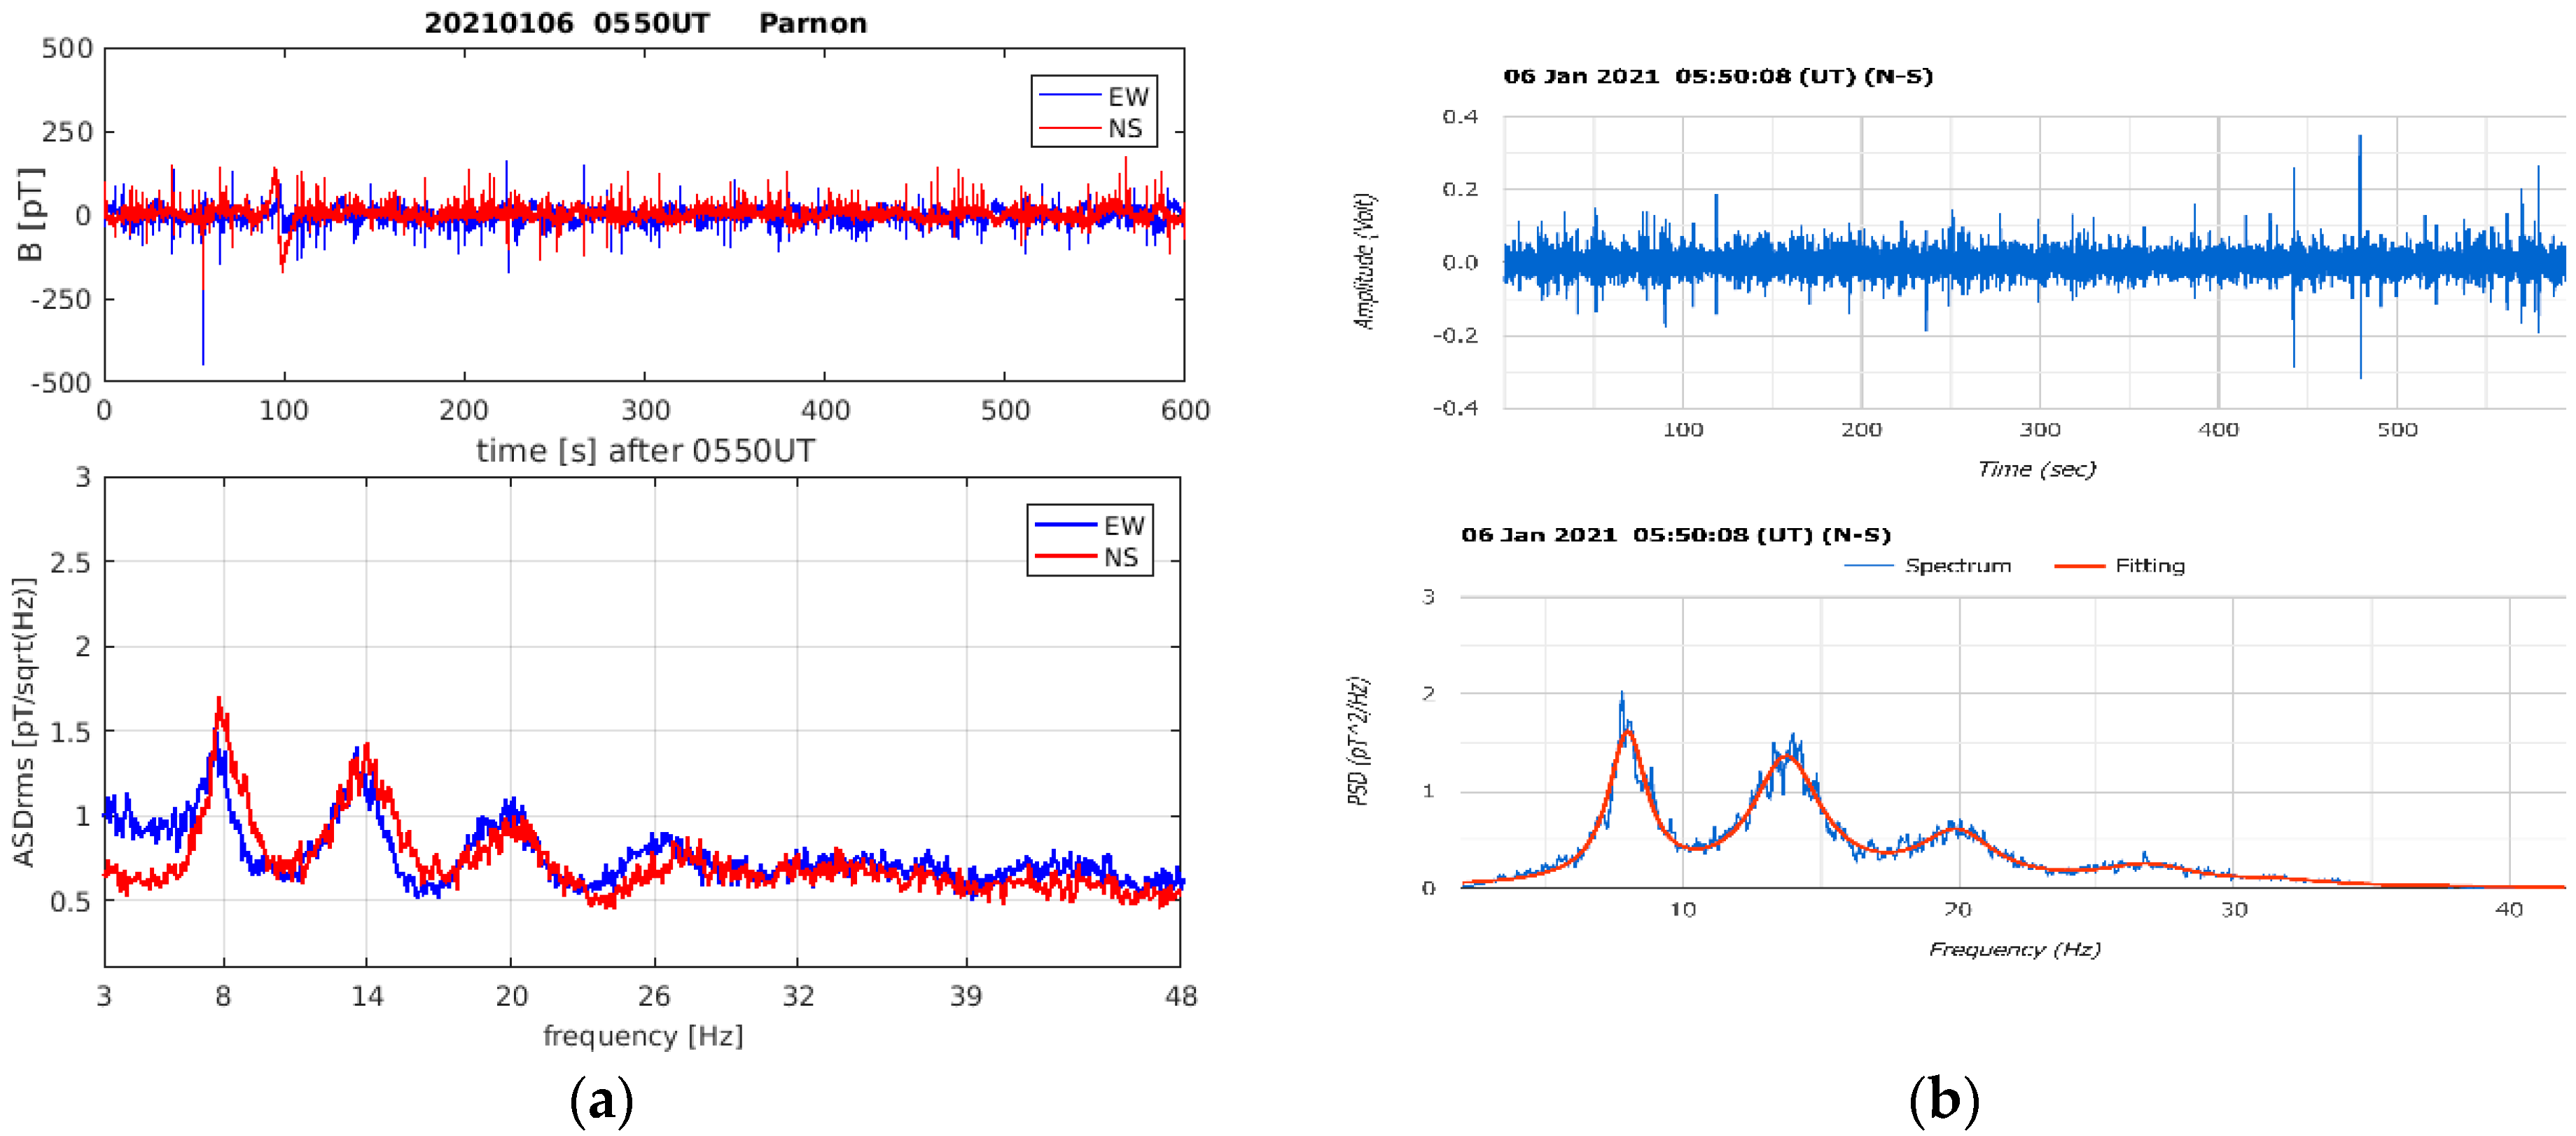
Figure 3, it is clear that both systems recorded the same things. Some differences in the raw data are due to the different amplification systems. The Greek system is dedicated to the observation of Schumann resonances (0–50 Hz). The Polish system is much more broadband: the coils cover a frequency range from 0.02 Hz to 1.1 kHz, and the receiver features a Bessel anti-aliasing filter with an energy bandwidth of 900 Hz. Both systems can very clearly record typical Schumann resonance frequencies at 7.8, 14.0. 20.0, and 26 Hz.
Figure 3a,b. are benchmarks for comparison with ELF perturbations, which can be identified by any divergence from the standard form of this figure. In
Table 1, all actions carried out are described, while in
Table 2, the outcomes and grade of importance are presented.
3.1. Coil Shaking (Case No. 1 in Table 1)
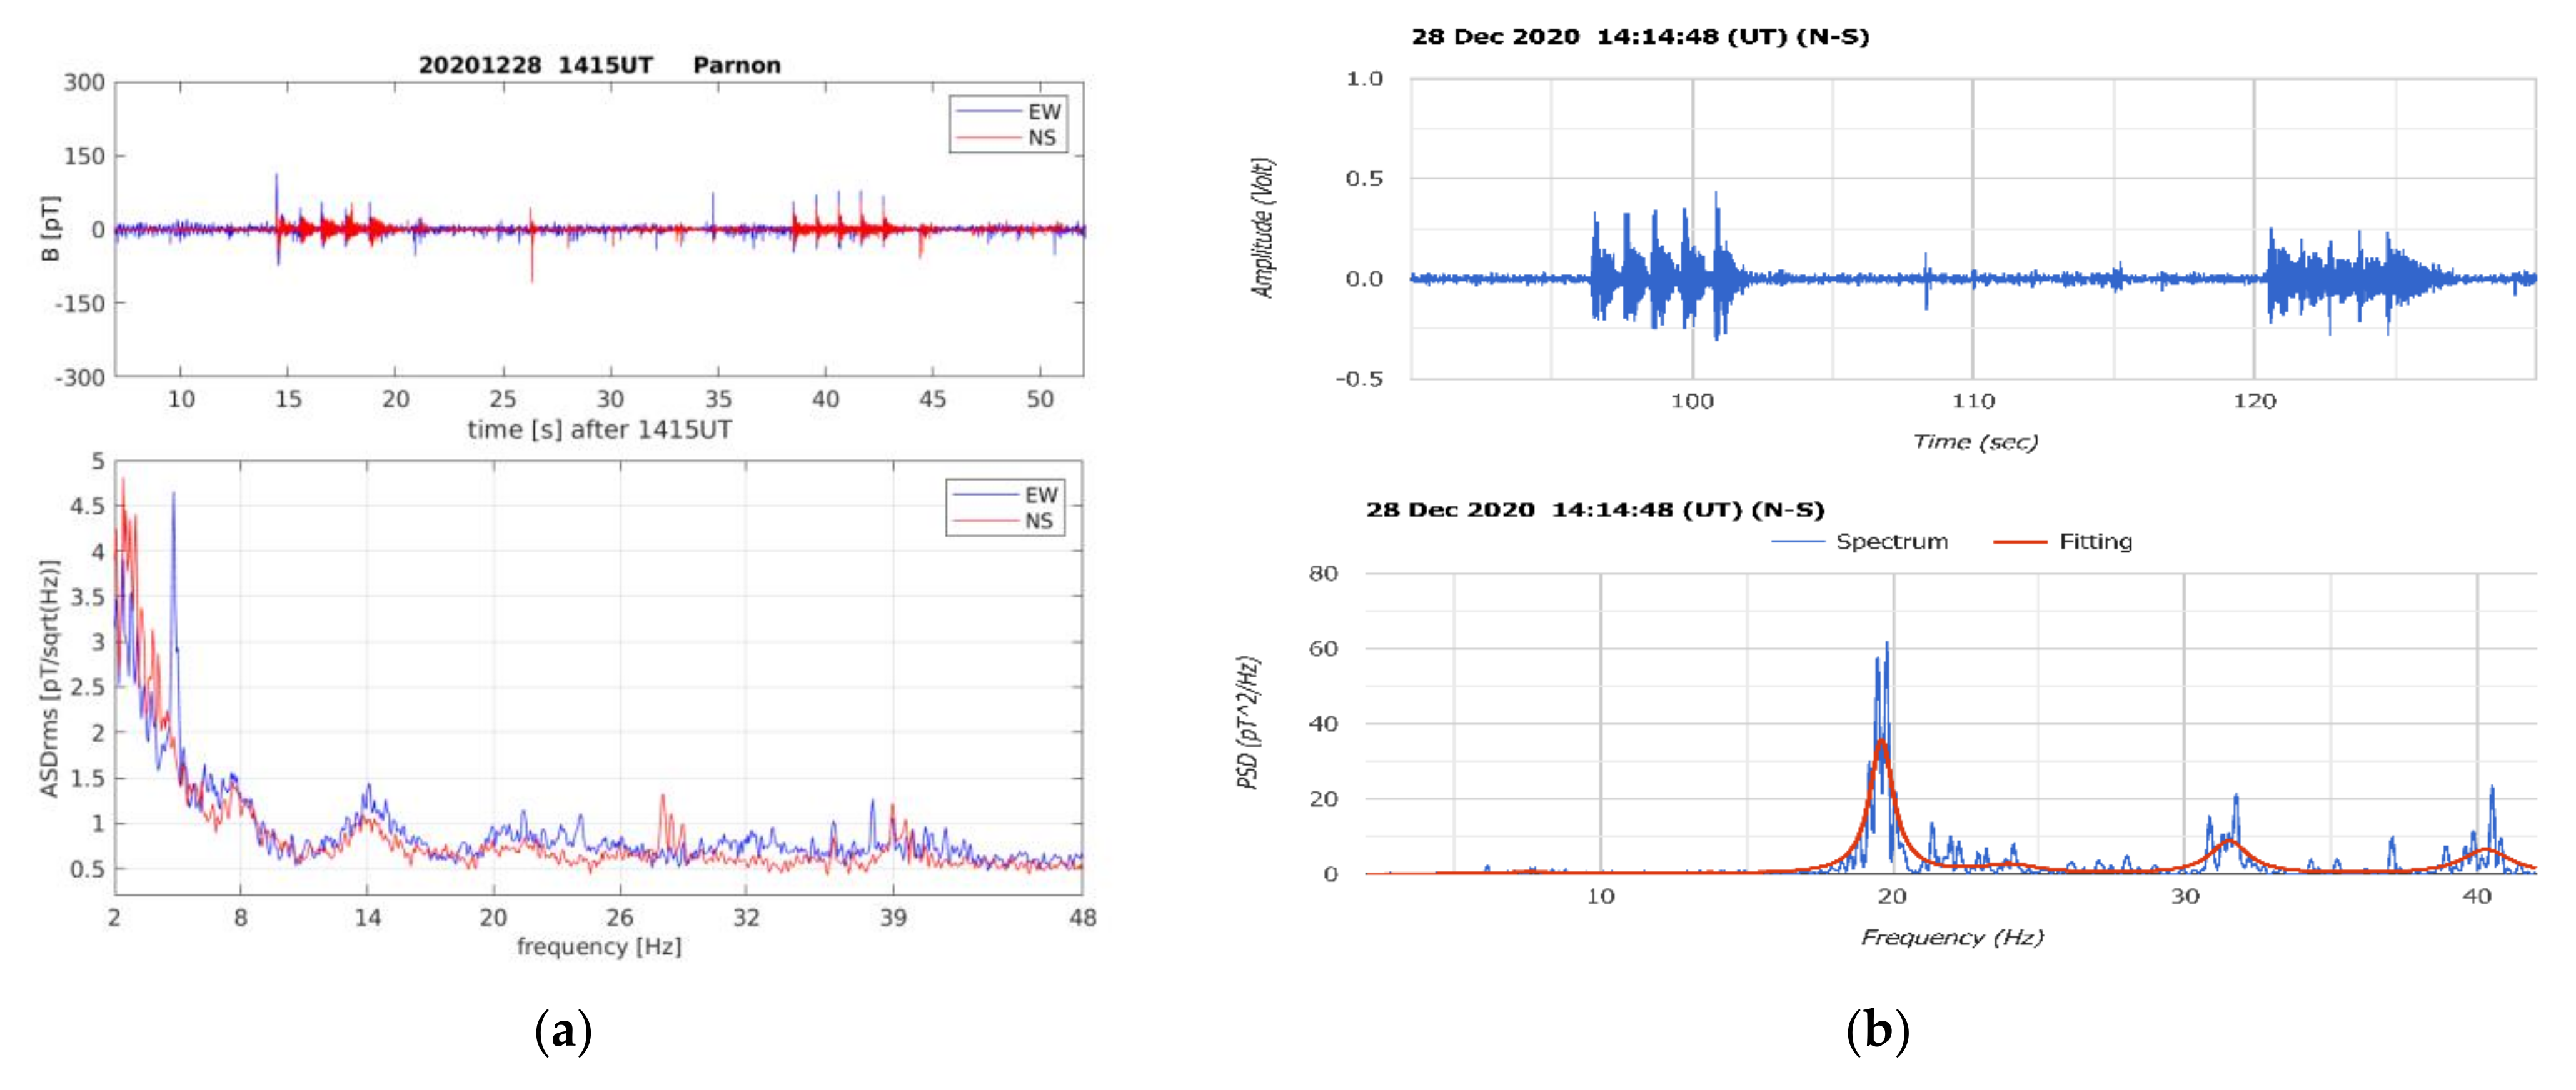
The first experiment was a common perturbation, namely the vibration of the coils by hand a few degrees back and forth. This is a simple way to reproduce ground vibrations due to earthquakes. Two series of vibrations were induced in both systems, the first in the N-S direction and the other in the E-W direction. It is clear from
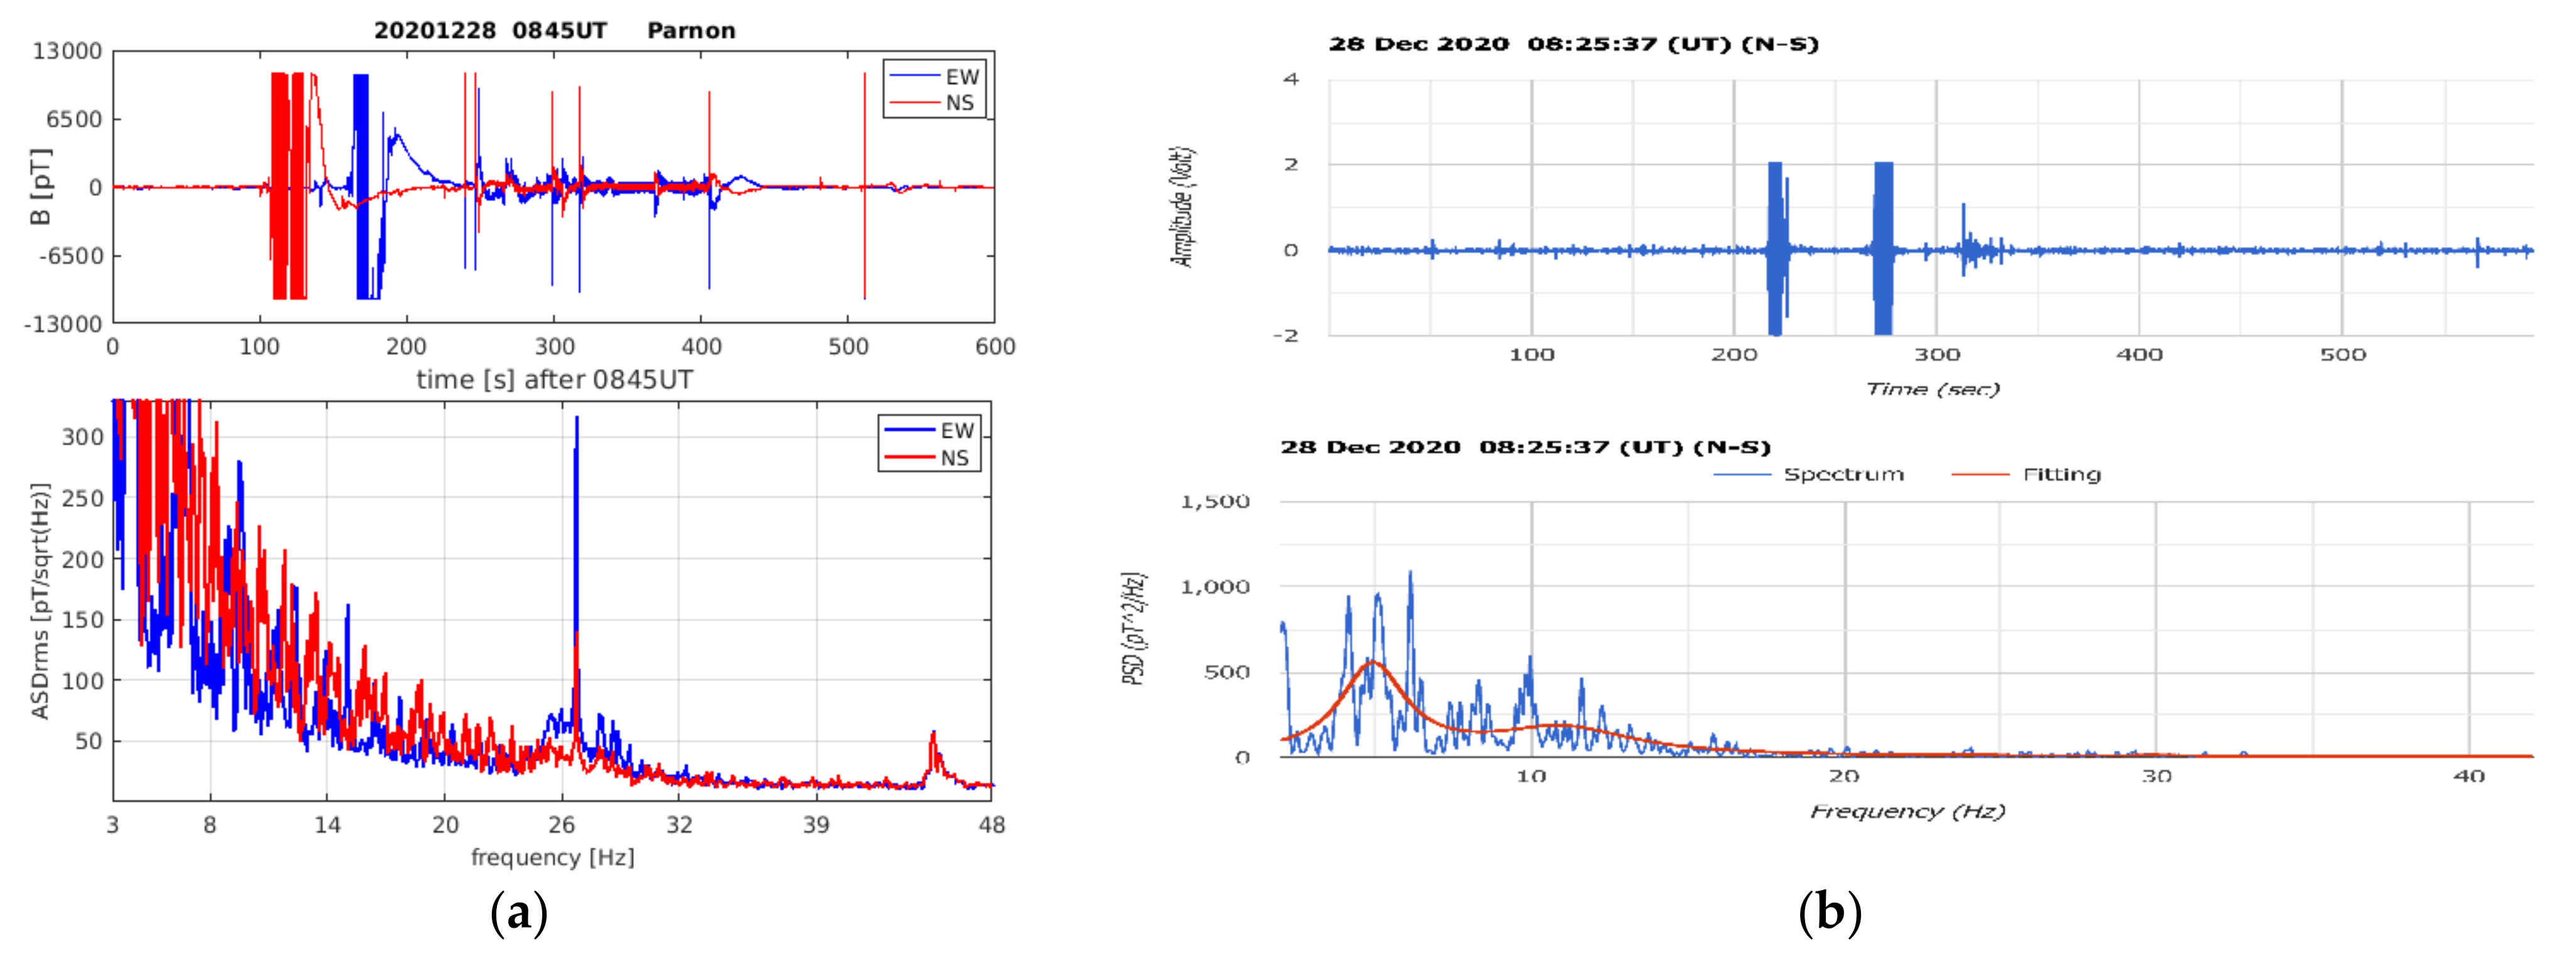
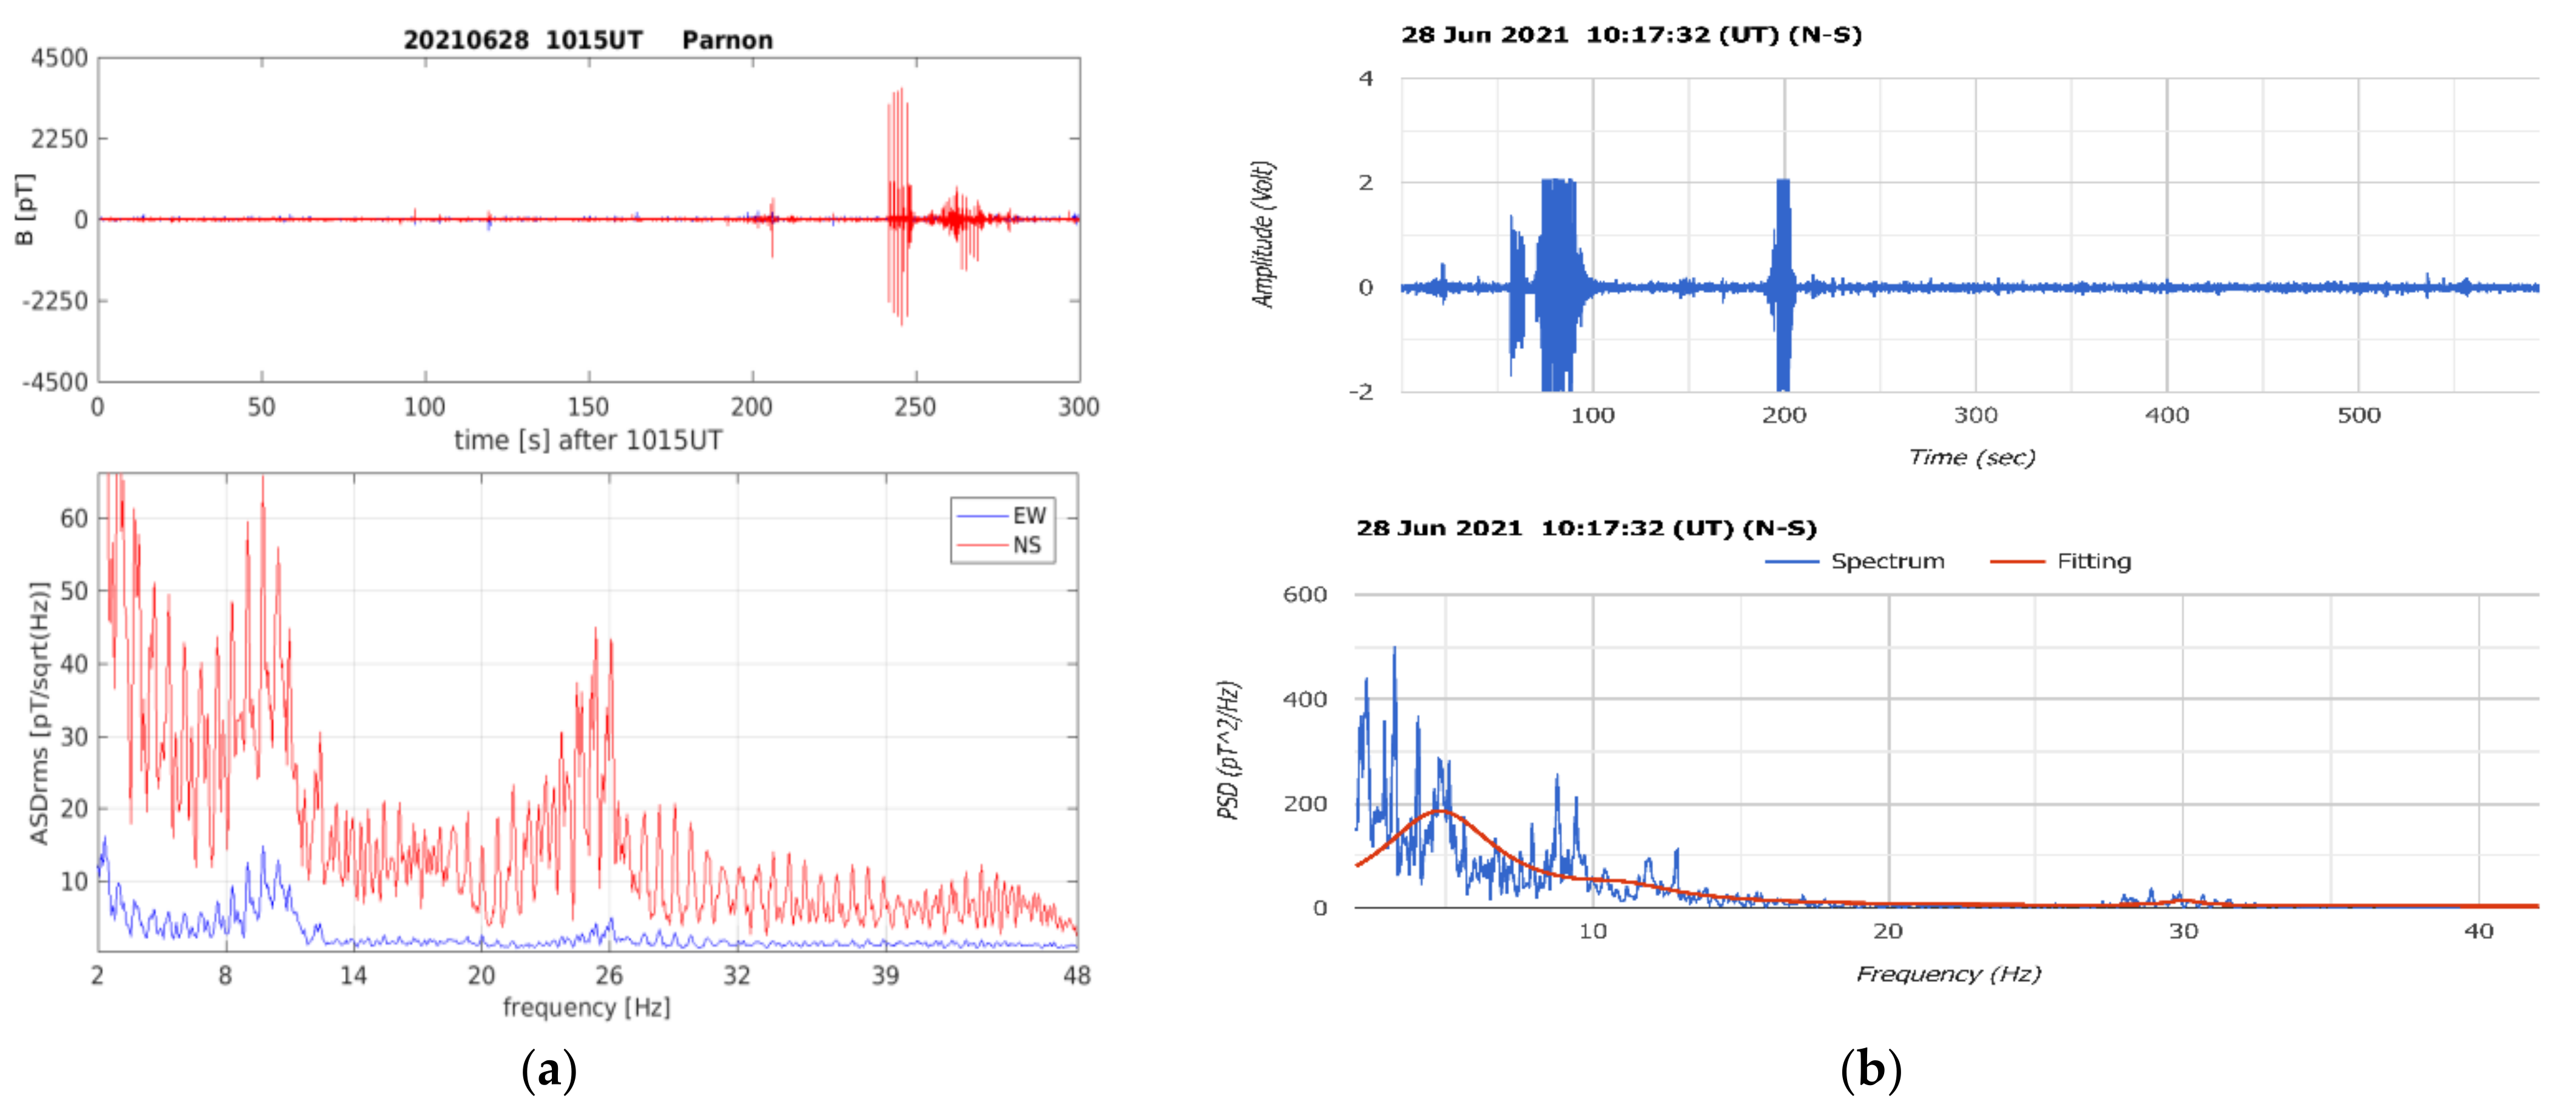
Figure 4 that the vibrations were very well imprinted in the raw data but not in the spectra in both systems. As can be seen from the figure, coil vibrations led to the saturation of the recording channels, which in turn led to strong distortions in the spectra. The first strip in
Figure 4b represents five consecutive movements of a few centimeters each in the N-S direction, and the second strip shows ten slight movements in the E-W direction. All shifts were very clearly recorded by both systems.
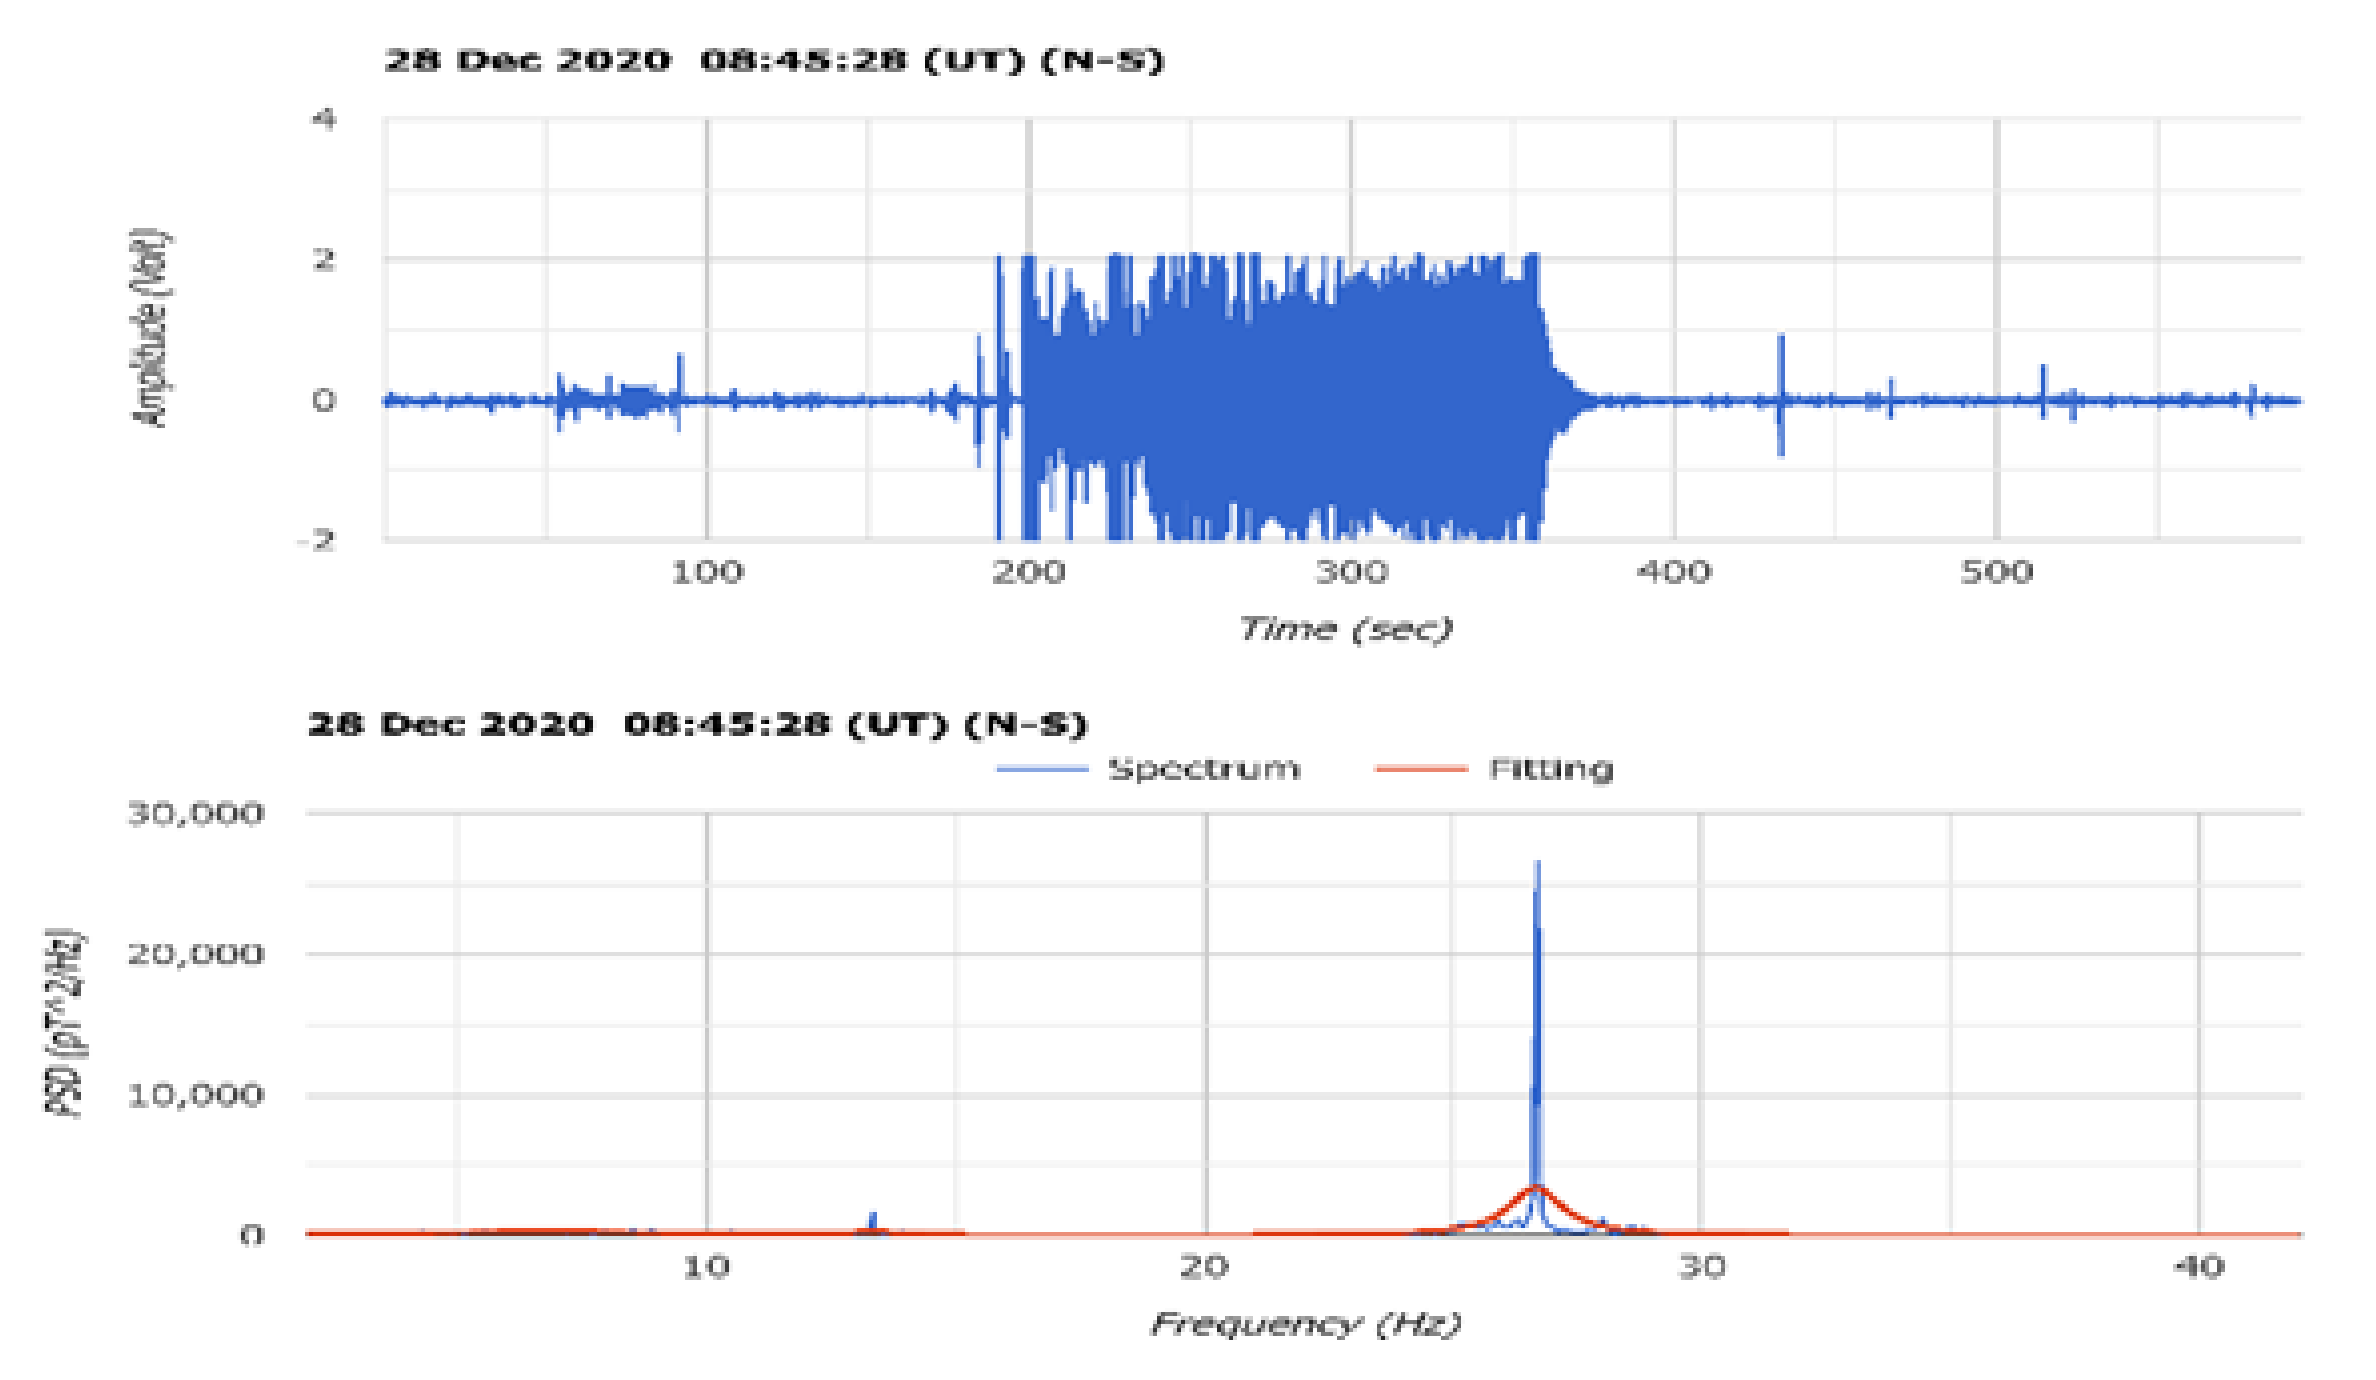
Another interesting issue was the magnetic coupling between coils. As shown in
Figure 5, we observed a clear signal in the Greek coil after rolling the Polish coil. This is a typical case of mutual induction between coils, something which implies that coils and systems in an SR observational site should be immovable. The event was certified by the local time (08.45) when the Greek coil was unperturbed, but the Polish coils were shaken. The distance between the coils was about 3.20 m.
Before we close the subject of shaking coils, it is important to note that a substantial difference between the simple artificial movement of a coil and a possible pre-seismic signal, which may be produced by ground movement, exists. This is a very important finding because it helps to differentiate artificial noise from the possible pre-seismic signals mentioned in previous publications [
14,
15,
16].
There is an obvious difference between
Figure 4b and
Figure 6. In the first case, the bulk of the power spectrum is concentrated between 15 and 30 Hz, which is denoted as a specific feature of a pre-seismic signal. On the contrary, in the second case (
Figure 4a,b), most of the power spectrum is restricted to the range of 0–15 Hz. The contrast between
Figure 4b and
6 are due to the fact that the simulation of ground vibrations by moving the coils artificially creates quite a different spectrum than a possible pre-seismic signal.
3.2. Running Car Engine (Case No. 2 in Table 1)
The next action we explored was the engine of a car running at high RPM for some time. The corresponding records of this activity can be seen in
Figure 7a,b. A raw data disturbance is obvious in both panels of these figures during the interval of 150–250 s (upper panels) when the car engine was running at around 5000 rpm. The difference in the time when the disturbance appears in the plots is due to the different starting time of the files in the two systems. In the Polish system, a new file was opened at 13:15:00 UTC, while in the Greek system, the file was opened at 13:13:42.
3.3. Gun Shooting (Case No. 3 in Table 1)
In
Figure 8, recordings during gunshots are presented. This was an attempt to check possible interferences with the SR recordings from hunters’ passage by the area. Weak visible signals appeared in the range 300–900 Hz, mainly in the N-S coil of the Polish system. This could perhaps be evidence that “noises” without an electromagnetic background do not substantially affect SR recordings.
3.4. Knocks on Metal Doors and Windows (Cases No. 4, 5, and 6 in Table 1)
In
Figure 9, a particular signal due to five strong knocks on the metal door of the shelter, very close to the Polish and Greek N-S coils, and five other knocks on the window by the door is shown. The aim of this action was to reproduce noises that could possibly be made by walkers and picknickers. In both coils, the signals looked like narrow strips of high intensity data; however, after zooming in, a fine structure was revealed where the five knocks appeared very clearly. In the Polish coil (
Figure 9a), details of the five knocks were also clearly sketched in the raw data (
Figure 9b). It should be noted that the amplitude was very high (from 4000 to 6000 pT), which is comparable to amplitudes associated with powerful discharges from local thunderstorms. It is also important to note that only the N-S coil, which lies parallel to the metal surface, recorded the five knocks. This was the first evidence of mutual induction between magnetic field changes from the metal door vibration and the N-S coil parallel to the door. On the contrary, the E-W coil located perpendicular to the door, and quite far from it, was insensitive to the knocks.
The magnification of the raw data stripes in
Figure 9 revealed interesting details of the knocks in both systems (
Figure 10).
The additional magnification of
Figure 10 revealed the fine structure of the recordings made by the five knocks on the metallic door and window (
Figure 11).
In
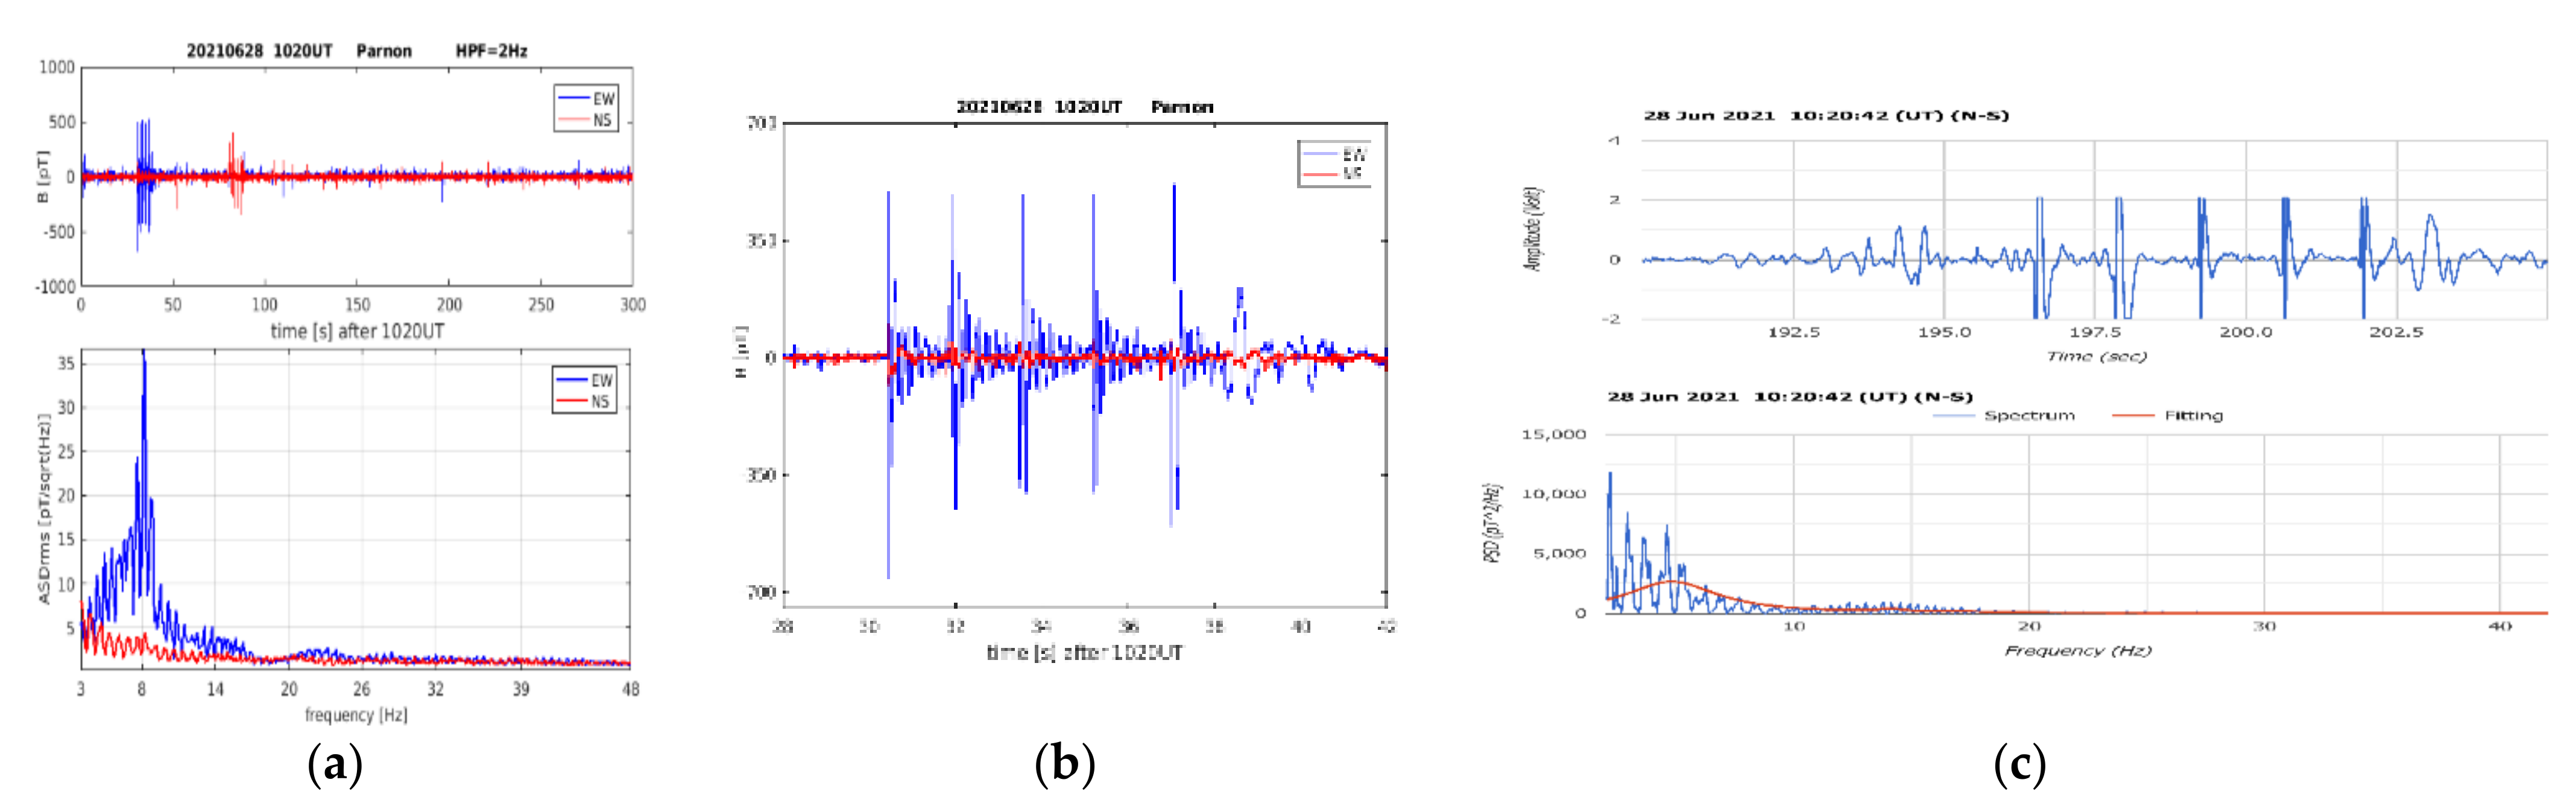
Figure 12, recordings taken during five knocks on two metallic windows close to the E-W coil are presented. In contrast to
Figure 11, where the N-S coil was responding to the knocks, in the present case the E-W was the responding coil. This is clear evidence that the distance between the source and coil is very important for “noise” tracing.
In
Figure 13, the results of five knocks on the metal window and five knocks on the second entrance—which is on the opposite side of the building, in relation to the side where the coils lay, beside the Polish logger—are shown. Although all the coils are located in separate rooms on the other side of the building almost 10 m away, the knocks were recorded very clearly by all the coils.
3.5. Movements and Noises of Metal Objects Outside the Building (Case No. 7 in Table 1)
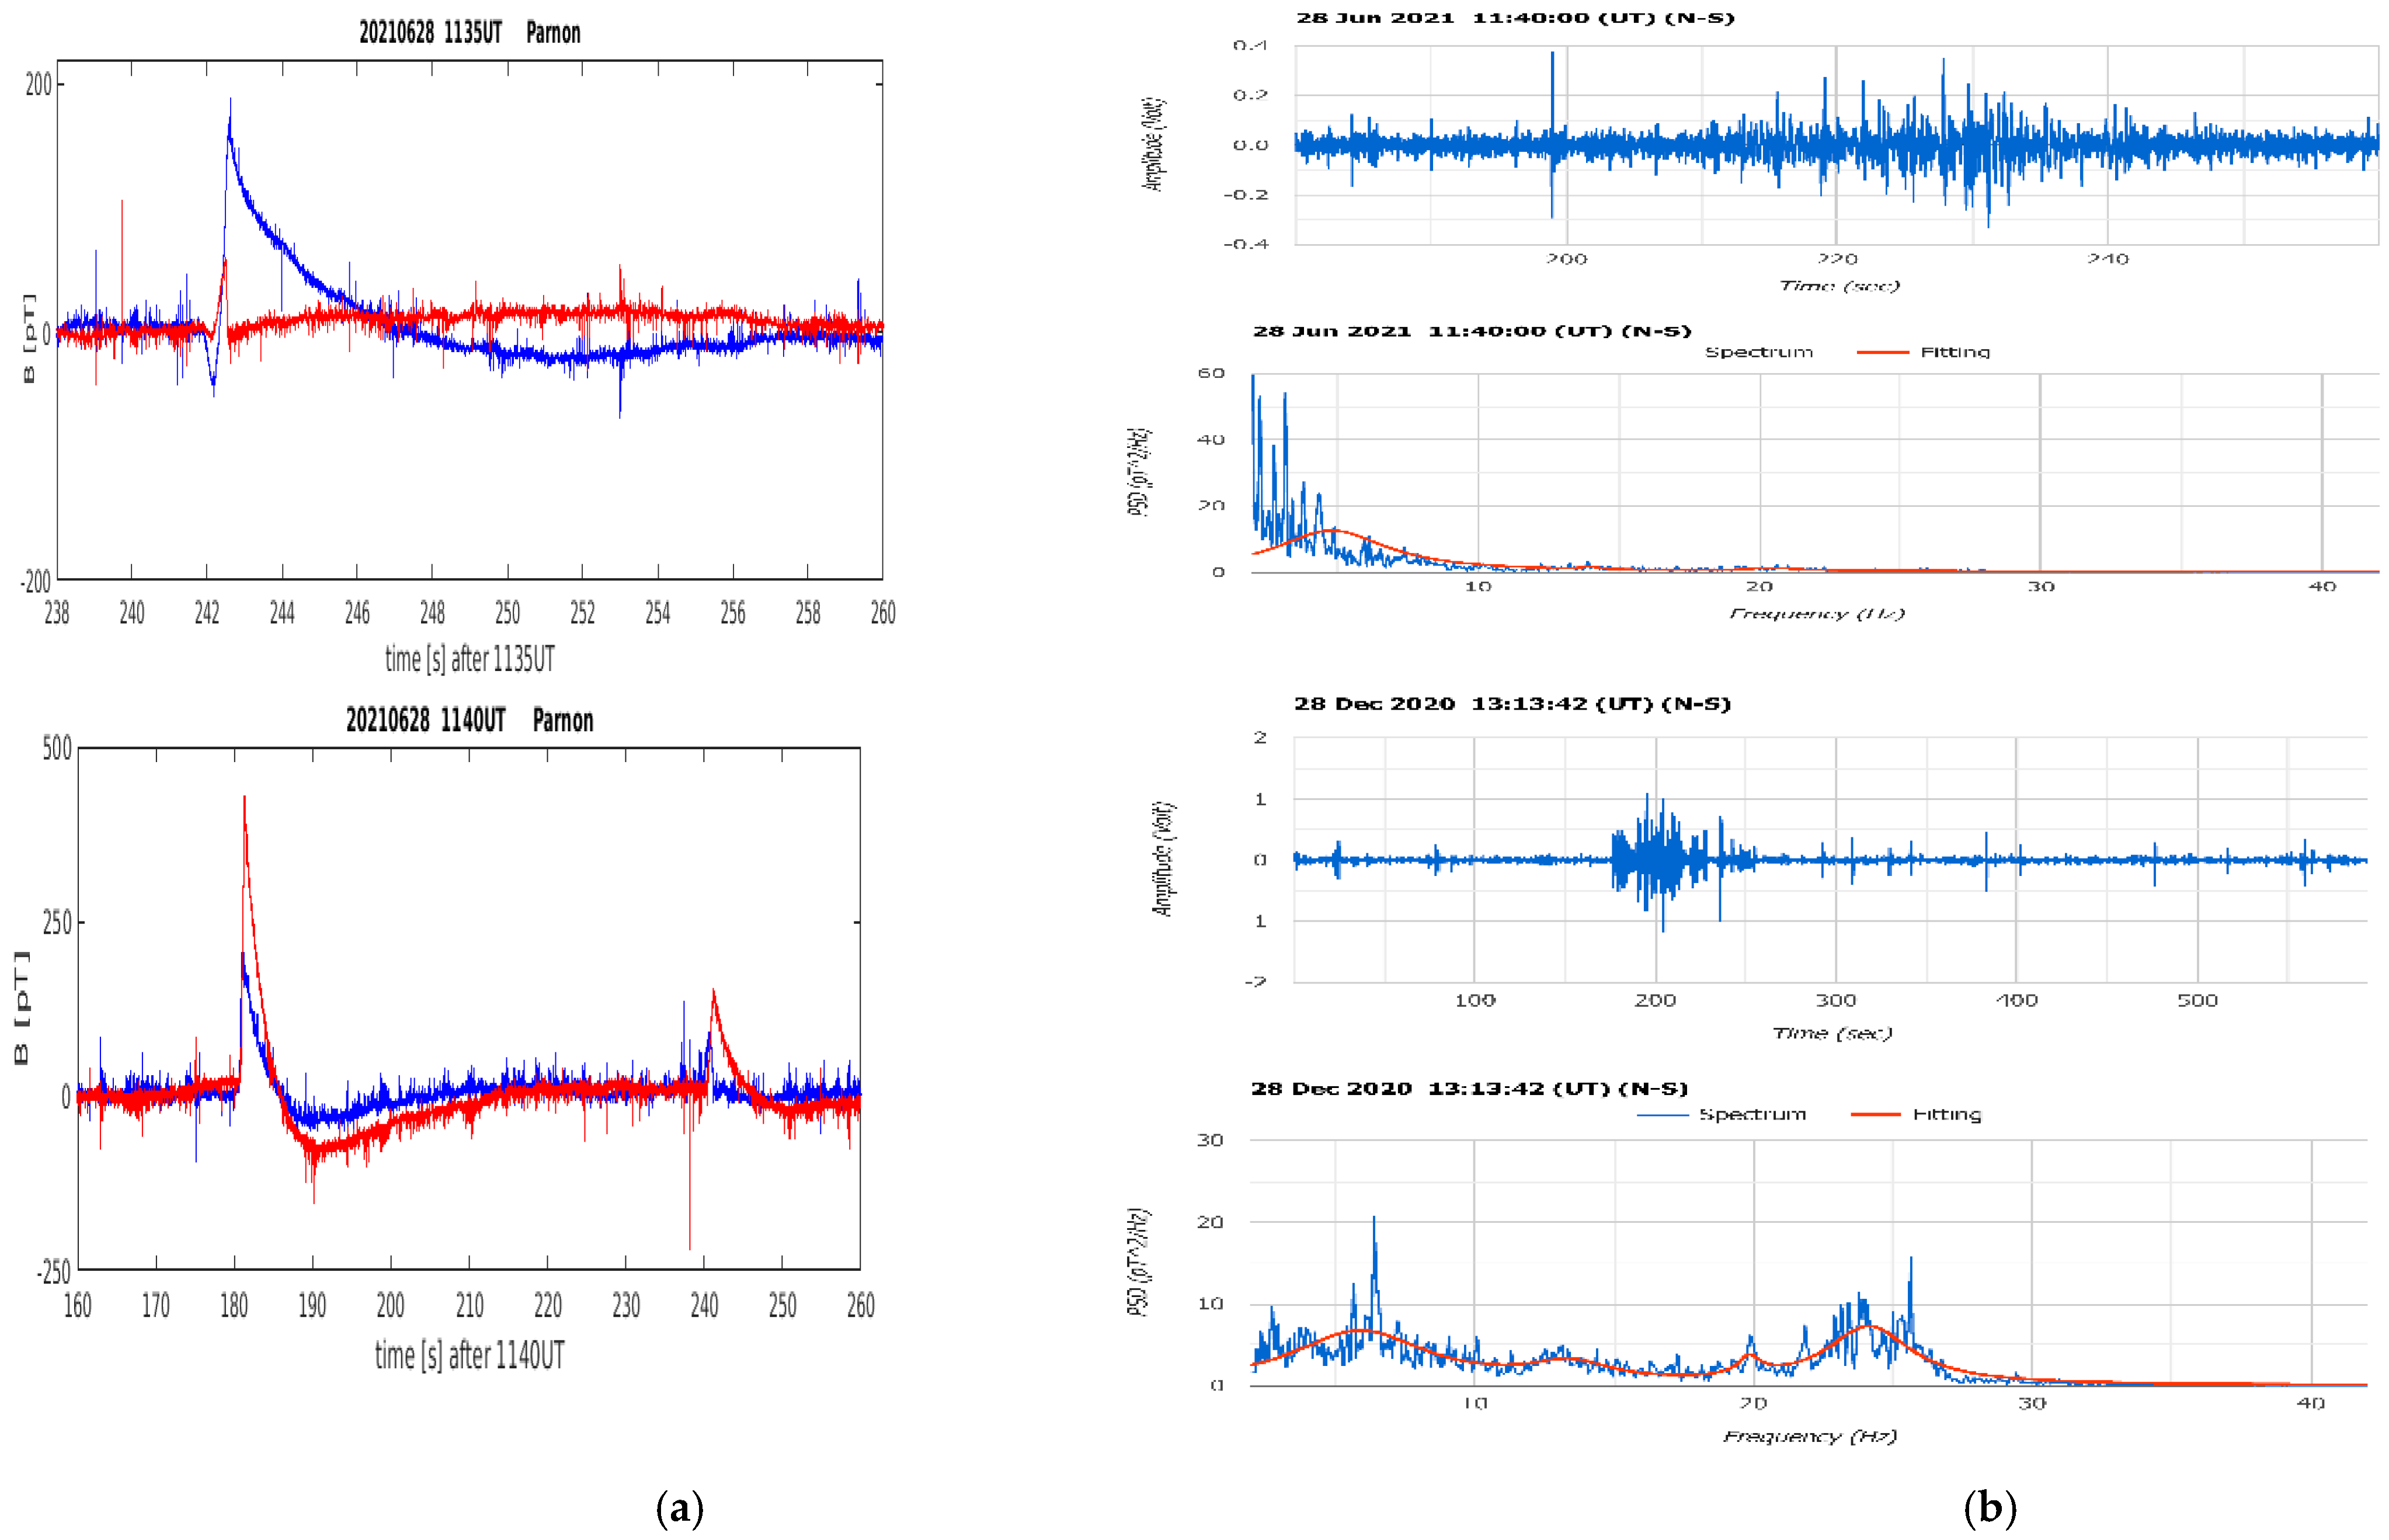
Here, we present noises made by metal objects at some distance from the building. In
Figure 14, signals generated by the noises of closing a car’s trunk and then doors 11 m away from the building are shown. The noises were evident in the recordings, making it clear that most artificial noises are picturized on coil recordings.
3.6. Departure (Case No. 8 in Table 1)
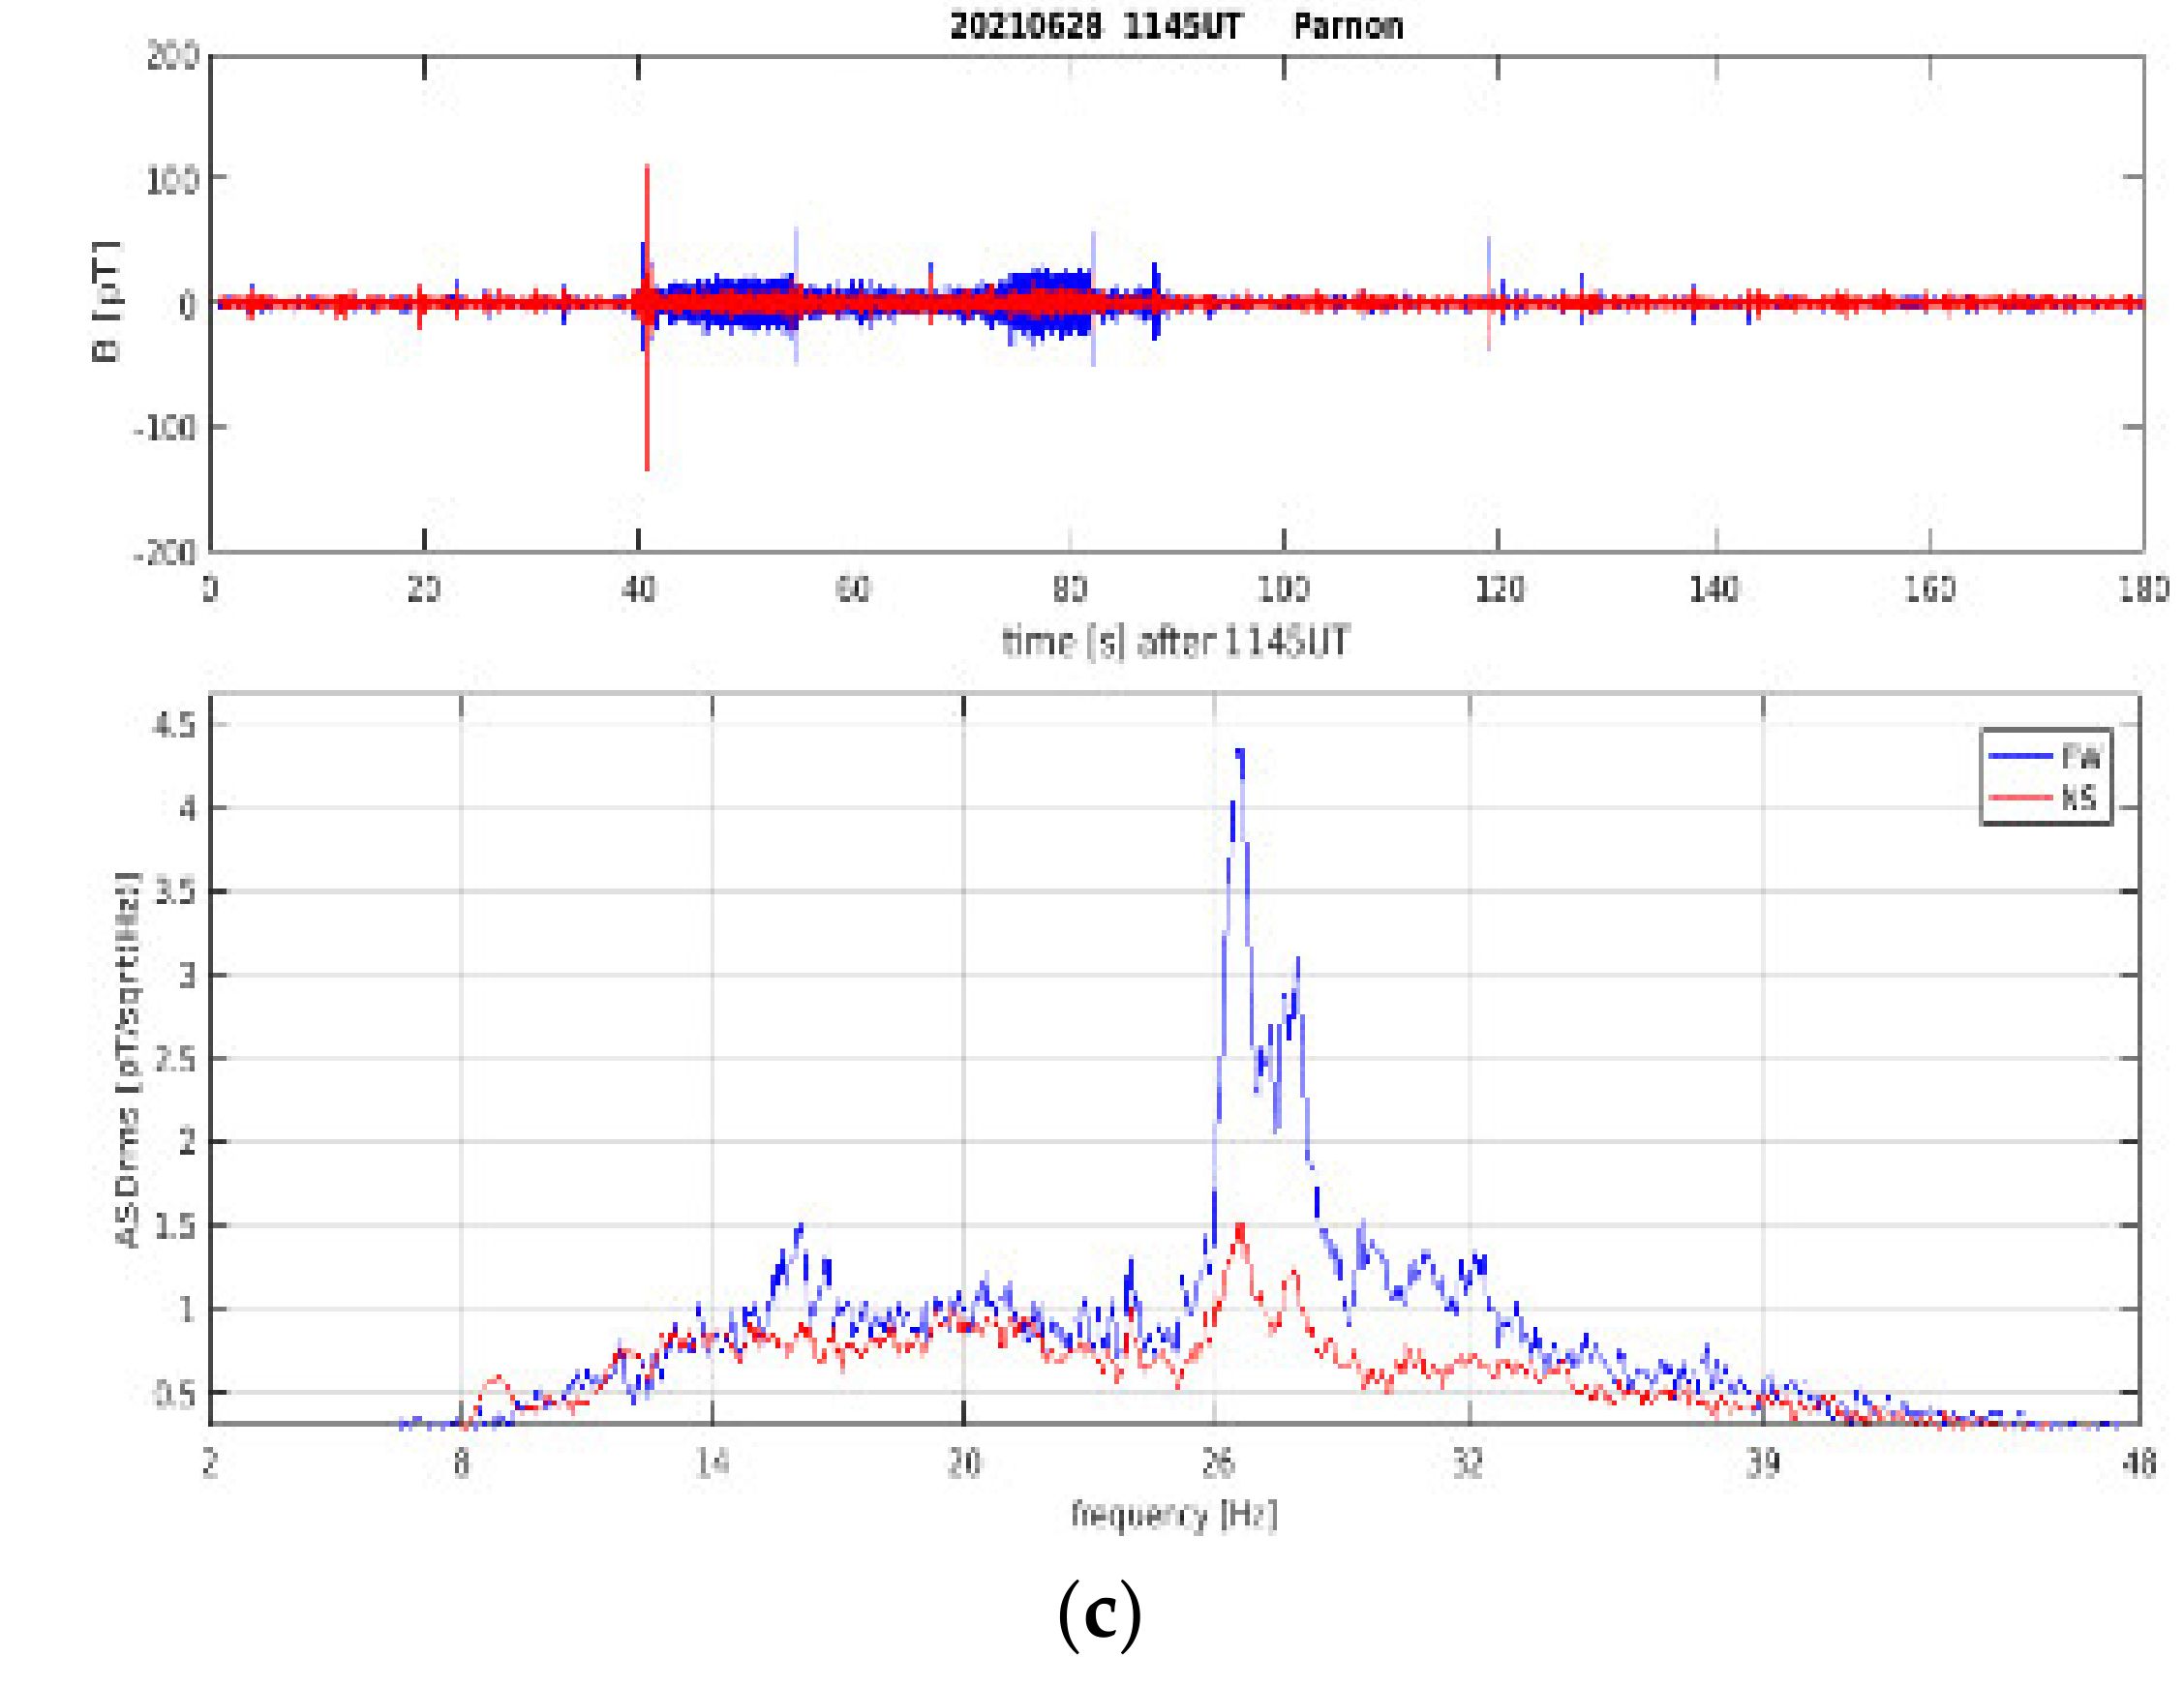
In the last part of the experiment, we simulated a “noisy” departure from the observation site. During departure, the car engine was running at a high RPM, the car stereo was playing at high volume, and the car horn was also in use. All associated disturbances were clearly identifiable as noise, as shown in
Figure 15.
Closing this section, we will proceed to a raw survey of the results we collected after the experiments described above (see
Table 2). The importance of the results was graded from A to D according to the scale presented at the end of
Table 2. The grade for each action was set in relation to the outcomes mentioned in the last column of the table.
From the grading in
Table 2, it is clear that the most significant noises which greatly affected the normal SR recordings were the rolling or vibrations of the coils (Case No. 01) and the knocks on metallic plates close to the coils (Case No. 04).
Evident but less significant were the running of a car engine close to the observational site (Case No. 02) and knocks on metallic plates relatively far from the coils (Case No. 02, 05, 06, and 08).
Weak but evident interferences with the normal raw data showed “noises” made outside the observation site, including closing the doors and trunk of a car (Case No. 9, 10, and 11).
Finally, the interferences coming from gunshots were not significant (Case No. 3).
In
Figure 16, an evaluation of the outcomes listed in
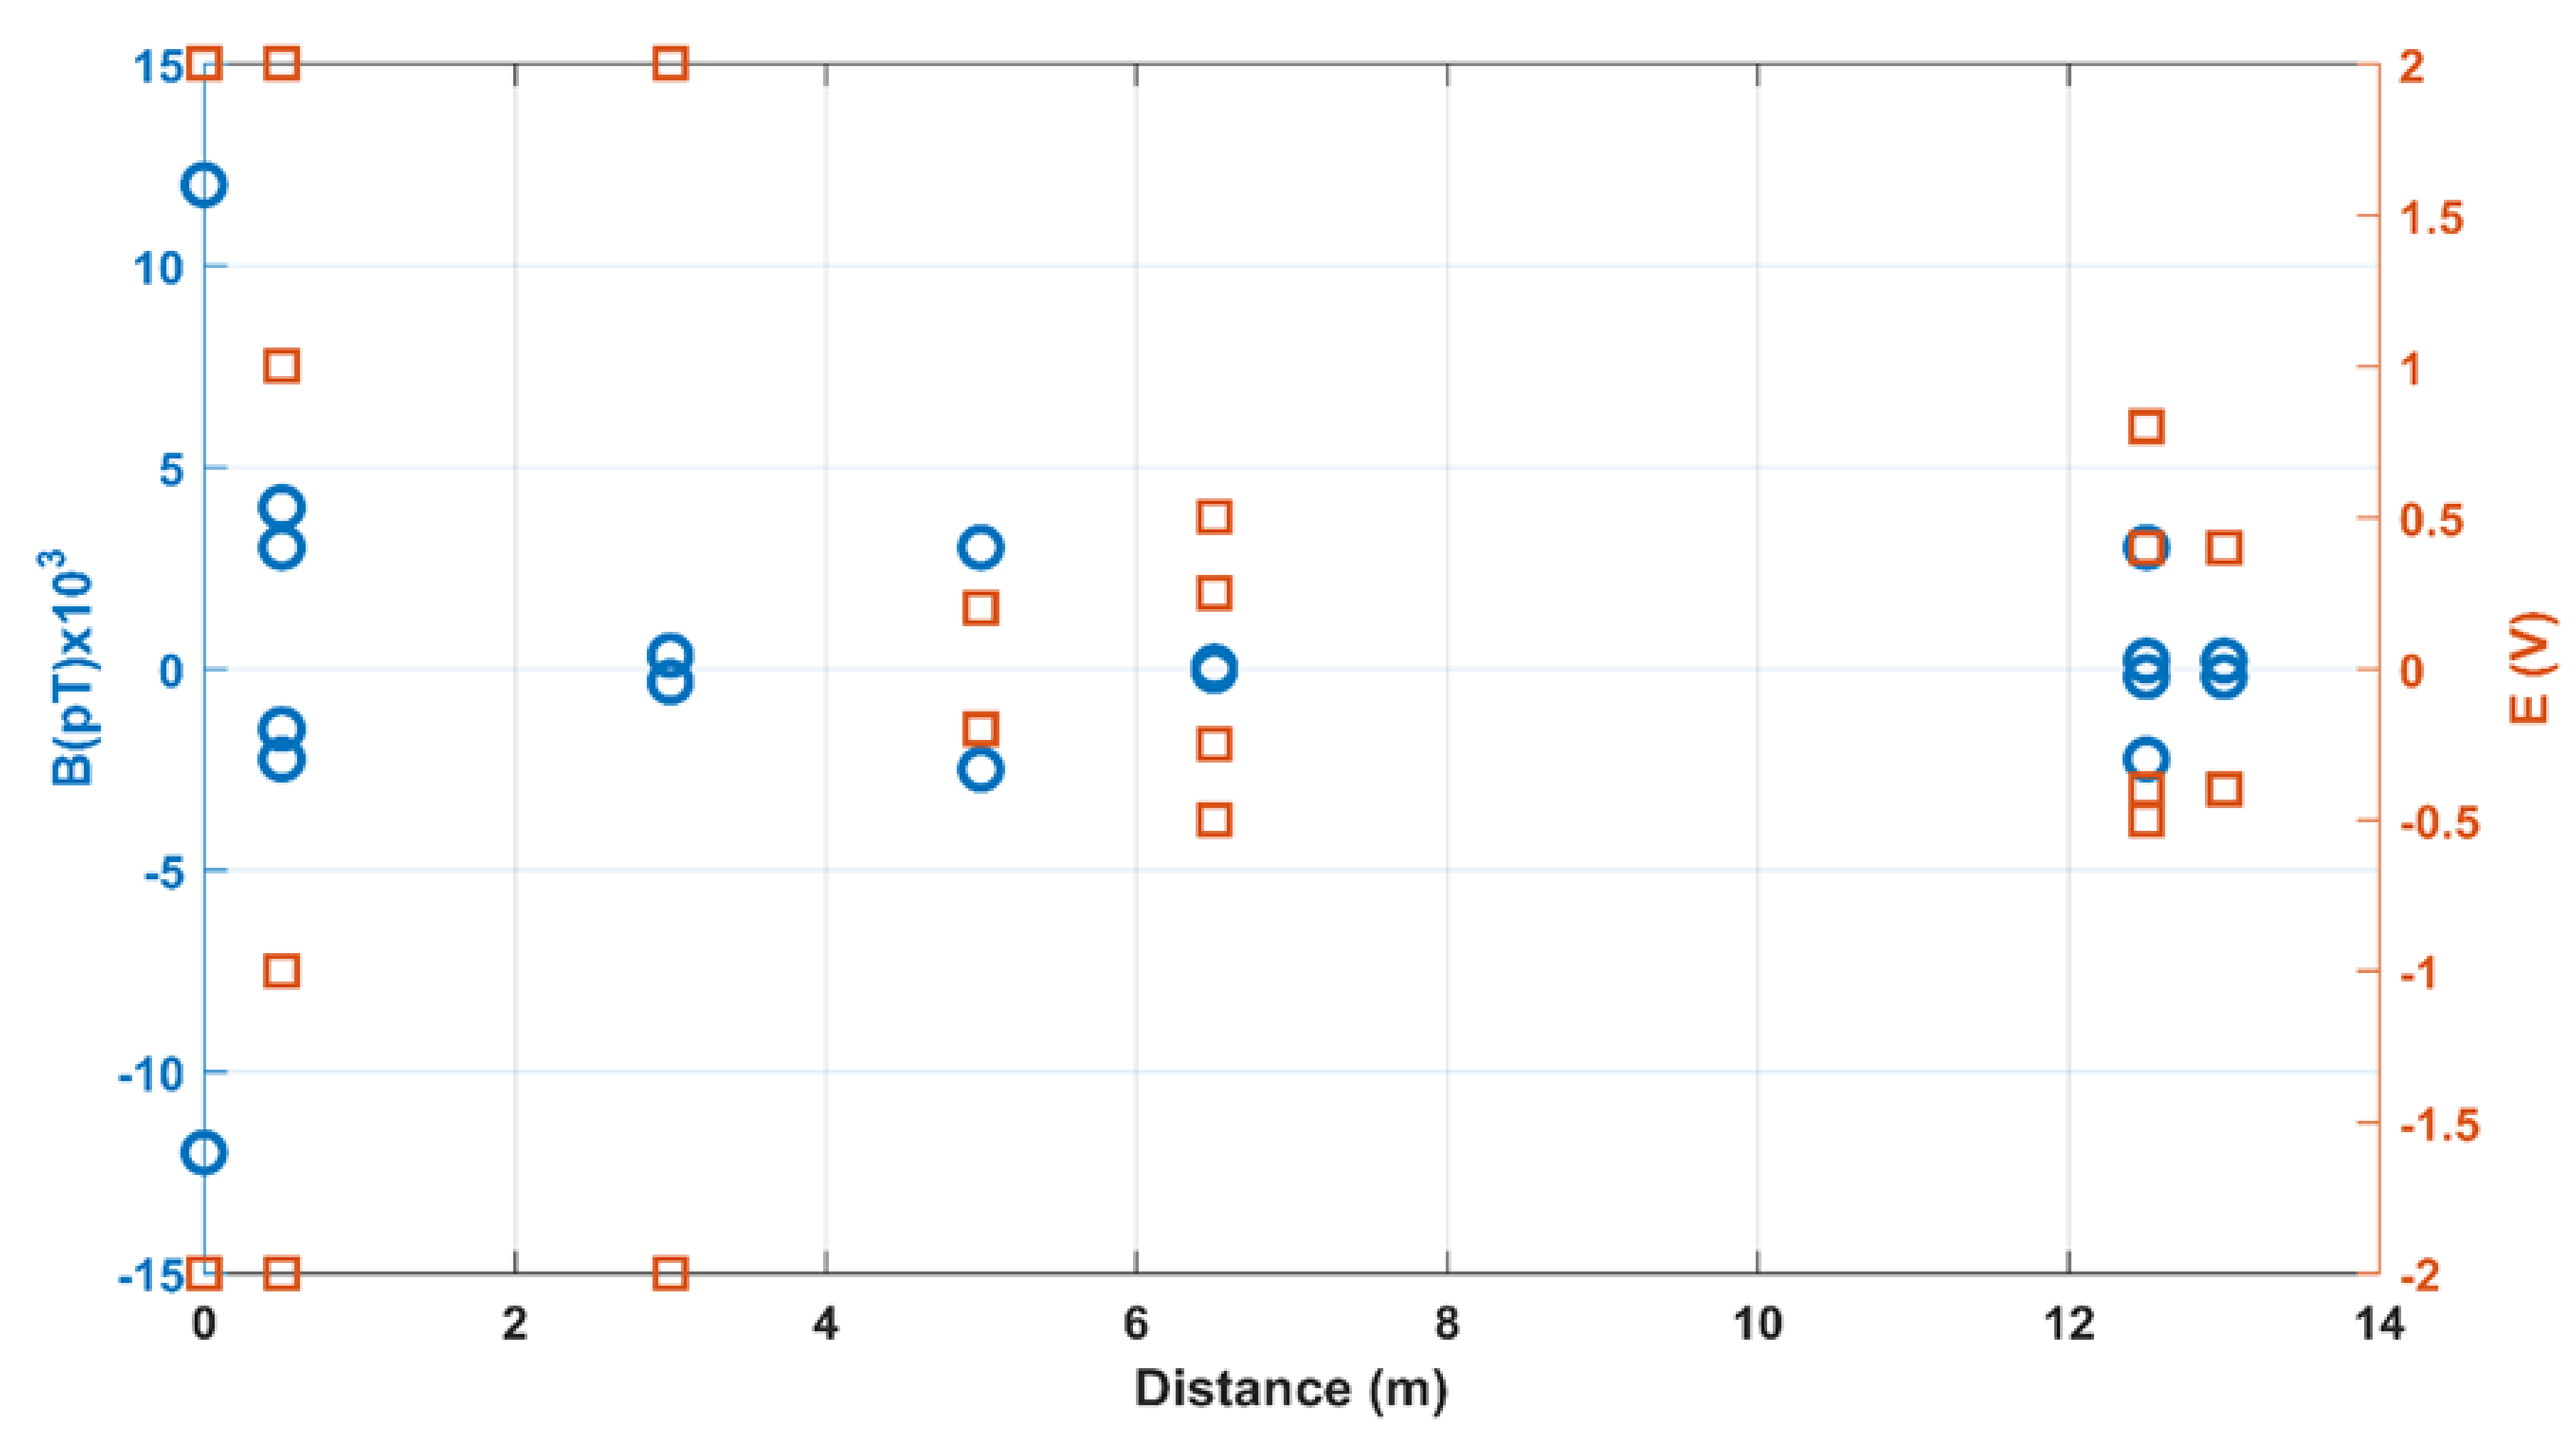
Table 2 is shown. At first glance, it is clear how important distance was. “Noises” occurring very close to the systems (Case No. 01, 04, and 05) caused very intensive responses in both systems, pushing them to the saturation limit. To the contrary, “noises” made farther away created medium- to low-magnitude responses. The difference between Case No. 04, 05, and 08 and Case No. 06 and 07 is very representative. In both groups of cases, the source excitement was the same—knocks on metallic plates—yet the response of the recording systems was different according to the distance. In the first group, where the distance was only half a meter, the signals received were high. An opposite result was observed in the second group, where the distance was greater and the intensity of the signals was much lower. This is an additional indication of how important it is for SR observational sites to be located as far as possible from habituated areas and for the coils to be well anchored to avoid accidental movements and vibrations, which could be considered as normal signals.
4. Possible Interpretation of Disturbances Due to Knocks on Metal Plates
We propose two reasonable scenarios that may account for the disturbances that appeared in our recordings after knocks on the metal doors and windows at the observation site. One scenario is mechanical, and the other electromagnetic.
According to the first scenario, knocks on the metal plates make them vibrate. The vibrations propagate as sound waves and shake the coils, which record SR-like disturbances, as seen in
Figure 4. The distance between the main metal plates (the front door and windows on both sides of the door) and the coils is short (about one meter); thus, the vibrations from propagating acoustic waves seem, at first glance, reasonable.
However, there is a serious negative point in accepting this scenario. It is rather impossible for a simple propagating vibration of a plate to be able to shake a massive coil of several kilograms one meter away. Thus, we propose the second scenario.
According to this scenario, since all metal objects are penetrated by geomagnetic field lines, strong knocks on the plates distort and suppress the magnetic lines, increasing the magnetic flux and triggering a weak electromotive force (EMF), which in the following creates weak circular electric currents in the plate known as “Foucault” currents or “Eddy” currents. “Eddy” currents are weak, but they can create a new “weak” magnetic field perpendicular to the plates, which could overlap with the normal SR recordings and generate the disturbances we observed.
A simple order of magnitude calculation can confirm or disprove our assumption. Let us start with certain reasonable boundary conditions. All the main metal plates, front door, and windows on both sides of the door are almost aligned with the N-S direction of the geomagnetic field (the angle between the N-S direction along which the coils are orientated and the metal plates is almost zero).
The plates are made by wrought iron with dimensions of 2.1 m × 1 m × 0.02 m for the front door and 1.4 m × 1.5 m for the two windows on both sides of it. The two N-S coils, Polish and Greek, lie parallel to the plates and very close to them, with distances of 1.1 m of the Polish coil from the door and 0.5 m of the Greek coil from the right window. The intensity of the geomagnetic field in Greece (middle latitudes, 36°–39° N) is about 45 μT.
Knocks with the butt of a hunting gun on the metal door of the building create vibrations 0.01 m wide (roughly) on an area of about 1 m
2. Knocks on these metal plates from the outside suppress the geomagnetic lines that pass through them, changing the normal magnetic flux Φ and creating a small electromotive force (EMF), E.
If we replace (1) with the following simple relation:
where B is the average local geomagnetic field (45 μT = 45 × 10
−6 T); S is the approximate vibrating area of the metal plate (1 m
2); Δx is the approximate vibration width (0.01 m); and Δt is the time between two successive knocks on the plate (1 s).
We can calculate the inductive EMF as follows:
Since the resistivity of iron is about 8 × 10
−7 Ωm, we can obtain an estimate of the eddy electric current generated in the plate of I = E/R= 0.56 A. The magnetic field due to such an electric current at a distance z can be calculated by the Biot–Savart relation as follows:
where R is the approximate radius of the circular eddy currents (0.5 m), I is the current calculated above (0.56 A), z is the distance of the coil from the door (1 m), and μ
0/4π = 10
−7 Τm/A.
In our case, the distance z is much larger than the radius R (Z = 2R); thus, the above relation may be simplified as:
Which yields a crude estimate of:
Considering that the normal magnetic field intensity of Schumann resonances is approximately 1 pT = 10−12 T, we realize that the calculated value of 10−8 T is much larger than the typical values of SR recordings. Indeed, in our experiments, we recorded strong parasitic signals from knocks on metal plates about 10,000 times larger than the typical SR signal. Simplified calculations were applied, and several arbitrary parameters and acceptances were inserted in the above calculations, including the vibration width of the plate, the radius of the circular eddy current, or the time between successive knocks. Therefore, the calculated result of Bz is approximate. The crucial point is that knocks on metallic plates can create a magnetic field which can overlap with normal SR waves and modify their spectra.
5. Discussion
The main objective of the present article was to confirm that anthropogenic noises and parasitic signals caused by various external disturbances could be identified by SR recording systems. The various actions carried out during the experiment were intended to reproduce “noises” made by excursionists, walkers, picknickers, and hunters who could pass by the observation site. Inferences from this experiment may be used by observers in various SR stations to safely separate accidental noise signals from real raw data. The main goal of this work was to show that two independent recording systems with different designs and implementations could both identify specific anthropogenic noises. Additional technical details were also made clear from the present work. The first is that the coils must be strongly secured in place (they must not move). Mutual induction is generated between coils by the slightest coil movement, which also generates abnormal signals. Another point is that movements by hand or other accidental reasons produce raw data signals similar to the pre-seismic signals detected by several authors [
3,
4,
5] but with quite different spectra, as is evident in
Figure 4 and
Figure 6.
Another very interesting point is that vibrating metal objects, such as doors, windows, and barriers, can create very serious “noisy” signals. Our preliminary calculations showed that knocks on metal plates can generate induction magnetic fields much stronger than that of the very weak SR. These may strongly contaminate the SR signal.
It is noteworthy to mention that an external window shutter on the forest shelter vibrating in the wind was creating strange unexplained signals for months before we realized it.
We close this section with the warning that great care is necessary before we can accept a signal as a geophysical indication of anything.
6. Conclusions
The final conclusion of this work is a list of short recommendations.
Great care should be taken before one can claim that a certain signal is truly geophysical and not artificial noise. An efficient protection from artificial interferences could be the inaccessibility of the observation site to passing, although this could create additional difficulties in visiting to authorized personnel. Placing the site at a great distance from habituated areas and popular places is also a helpful preventative measure.
Although the results of our study seem to have general application, due to the particularities of each observational site, we recommend the confirmation of the interferences presented in this work with in situ experiments.
Finally, for countries with strong seismic activity, such as Greece, it is very important to be able to separate seismogenic signals from signals due to other mechanical disturbances of the observation coils.
Author Contributions
Supervision, J.M. and V.T.; Investigation, I.C. and V.C.; Data curation, V.T. and G.T.; Software, J.M., Z.N. and G.T.; Validation, V.T. and C.R. All authors have read and agreed to the published version of the manuscript.
Funding
This research received no external funding.
Data Availability Statement
Data available on request.
Acknowledgments
The authors would like to express their gratitude to the forest service of the Lakonia prefecture in the town of Sparta, especially the director, G. Zakkas, and the forest personnel, S. Petrakos, K. Samartzis, N. Sourlis, and K. Tsagaroulis, for their continuous contribution in the establishment and the maintenance of our south observation site on Mount Parnon near the village of Vamvakou. J. Mlynarczyk would like to express his warm thanks to the National Science Centre of Poland for the support offered under the grant 2015/19/B/ST10/01055.
Conflicts of Interest
The authors declare no conflict of interest.
References
- Schumann, W.O. On the free oscillations of a conducting sphere which is surrounded by an air layer and an iono-sphere shell. Z. Nat. 1952, 7, 149–154. (In German) [Google Scholar]
- Balser, M.; Wagner, C. Observations of Earth—Ionosphere Cavity Resonances. Nature 1960, 188, 638–641. [Google Scholar] [CrossRef]
- Balser, M.; Wagner, C.A. Diurnal power variations of the Earth-ionosphere cavity modes and their relationship to worldwide thunderstorm activity. J. Geophys. Res. Earth Surf. 1962, 67, 619–625. [Google Scholar] [CrossRef]
- Sekiguchi, M.; Hayakawa, M.; Nickolaenko, A.P.; Hobara, Y. Evidence on a link between the intensity of Schumann resonance and global surface temperature. Ann. Geophys. 2006, 24, 1809–1817. [Google Scholar] [CrossRef] [Green Version]
- Tatsis, G.; Votis, C.; Christofilakis, V.; Kostarakis, P.; Tritakis, V.; Repapis, C.; Kalavrezos, P.; Athens, A.O. Preliminary Measurements of Schumann’ Resonances (SR) in the Greek. J. Eng. Sci. Technol. Rev. 2016, 9, 108–111. [Google Scholar] [CrossRef]
- Tatsis, G.; Christofilakis, V.; Chronopoulos, S.; Baldoumas, G.; Sakkas, A.; Paschalidou, A.; Kassomenos, P.; Petrou, I.; Kostarakis, P.; Repapis, C.; et al. Study of the variations in the Schumann resonances parameters measured in a southern Mediterranean environment. Sci. Total Environ. 2020, 715, 136926. [Google Scholar] [CrossRef] [PubMed]
- Williams, E. Lightning and climate: A review. Atmos. Res. 2005, 76, 272–287. [Google Scholar] [CrossRef]
- Williams, E.R. The Schumann Resonance: A Global Tropical Thermometer. Science 1992, 256, 1184–1187. [Google Scholar] [CrossRef] [PubMed]
- Tritakis, V.; Contopoulos, I.; Florios, C.; Tatsis, G.; Christofilakis, V.; Baldoumas, G.; Repapis, C. Anthropogenic Noise and its Footprint on ELF Schumann Resonance Recordings. Front. Earth Sci. 2021, 9, 163. [Google Scholar] [CrossRef]
- Tatsis, G.; Votis, C.; Christofilakis, V.; Kostarakis, P.; Tritakis, V.; Repapis, C. A prototype data acquisition and processing system for Schumann resonance measurements. J. Atmos. Sol.-Terr. Phys. 2015, 135, 152–160. [Google Scholar] [CrossRef] [Green Version]
- Tatsis, G.; Christofilakis, V.; Chronopoulos, S.K.; Kostarakis, P.; Nistazakis, H.E.; Repapis, C.; Tritakis, V. Design and Implementation of a Test Fixture for ELF Schumann Resonance Magnetic Antenna Receiver and Magnetic Permeability Measurements. Electronics 2020, 9, 171. [Google Scholar] [CrossRef] [Green Version]
- Votis, C.I.; Tatsis, G.; Christofilakis, V.; Chronopoulos, S.K.; Kostarakis, P.; Tritakis, V.; Repapis, C. A new portable ELF Schumann resonance receiver: Design and detailed analysis of the antenna and the analog front-end. EURASIP J. Wirel. Commun. Netw. 2018, 2018, 155. [Google Scholar] [CrossRef] [Green Version]
- Mlynarczyk, J.; Kulak, A.; Klucjasz, S.; Martynski, K.; Kubisz, J.; Popek, M. New Broadband ELF Receiver for Studying Atmospheric Discharges in Central Europe. In Proceedings of the 2018 Baltic URSI Symposium, Poznan, Poland, 15–17 May 2018. [Google Scholar]
- Christofilakis, V.; Tatsis, G.; Votis, C.; Contopoulos, I.; Repapis, C.; Tritakis, V. Significant ELF perturbations in the Schumann Resonance band before and during a shallow mid-magnitude seismic activity in the Greek area (Kalpaki). J. Atmos. Sol.-Terr. Phys. 2019, 182, 138–146. [Google Scholar] [CrossRef]
- Florios, K.; Contopoulos, I.; Christofilakis, V.; Tatsis, G.; Chronopoulos, S.; Repapis, C.; Tritakis, V. Pre-seismic Elec-tromagnetic Perturbations in Two Earthquakes in Northern Greece. Pure Appl. Geophys. 2019, 177, 787–799. [Google Scholar] [CrossRef]
- Florios, K.; Contopoulos, I.; Tatsis, G.; Christofilakis, V.; Chronopoulos, S.; Repapis, C.; Tritakis, V. Possible earthquake forecasting in a narrow space-time-magnitude window. Earth Sci. Inform. 2021, 14, 349–364. [Google Scholar] [CrossRef]
Figure 1.
Map of the area where the observation site was located (a). Forest shelter where the recording systems were hosted (b).
Figure 1.
Map of the area where the observation site was located (a). Forest shelter where the recording systems were hosted (b).
Figure 2.
Instrumentation inside the observation site. In the upper panel, the coil (a) and the logger (b) of the Polish system are shown. In the lower panel, the coil (c) and the logger (d) of the Greek system are presented.
Figure 2.
Instrumentation inside the observation site. In the upper panel, the coil (a) and the logger (b) of the Polish system are shown. In the lower panel, the coil (c) and the logger (d) of the Greek system are presented.
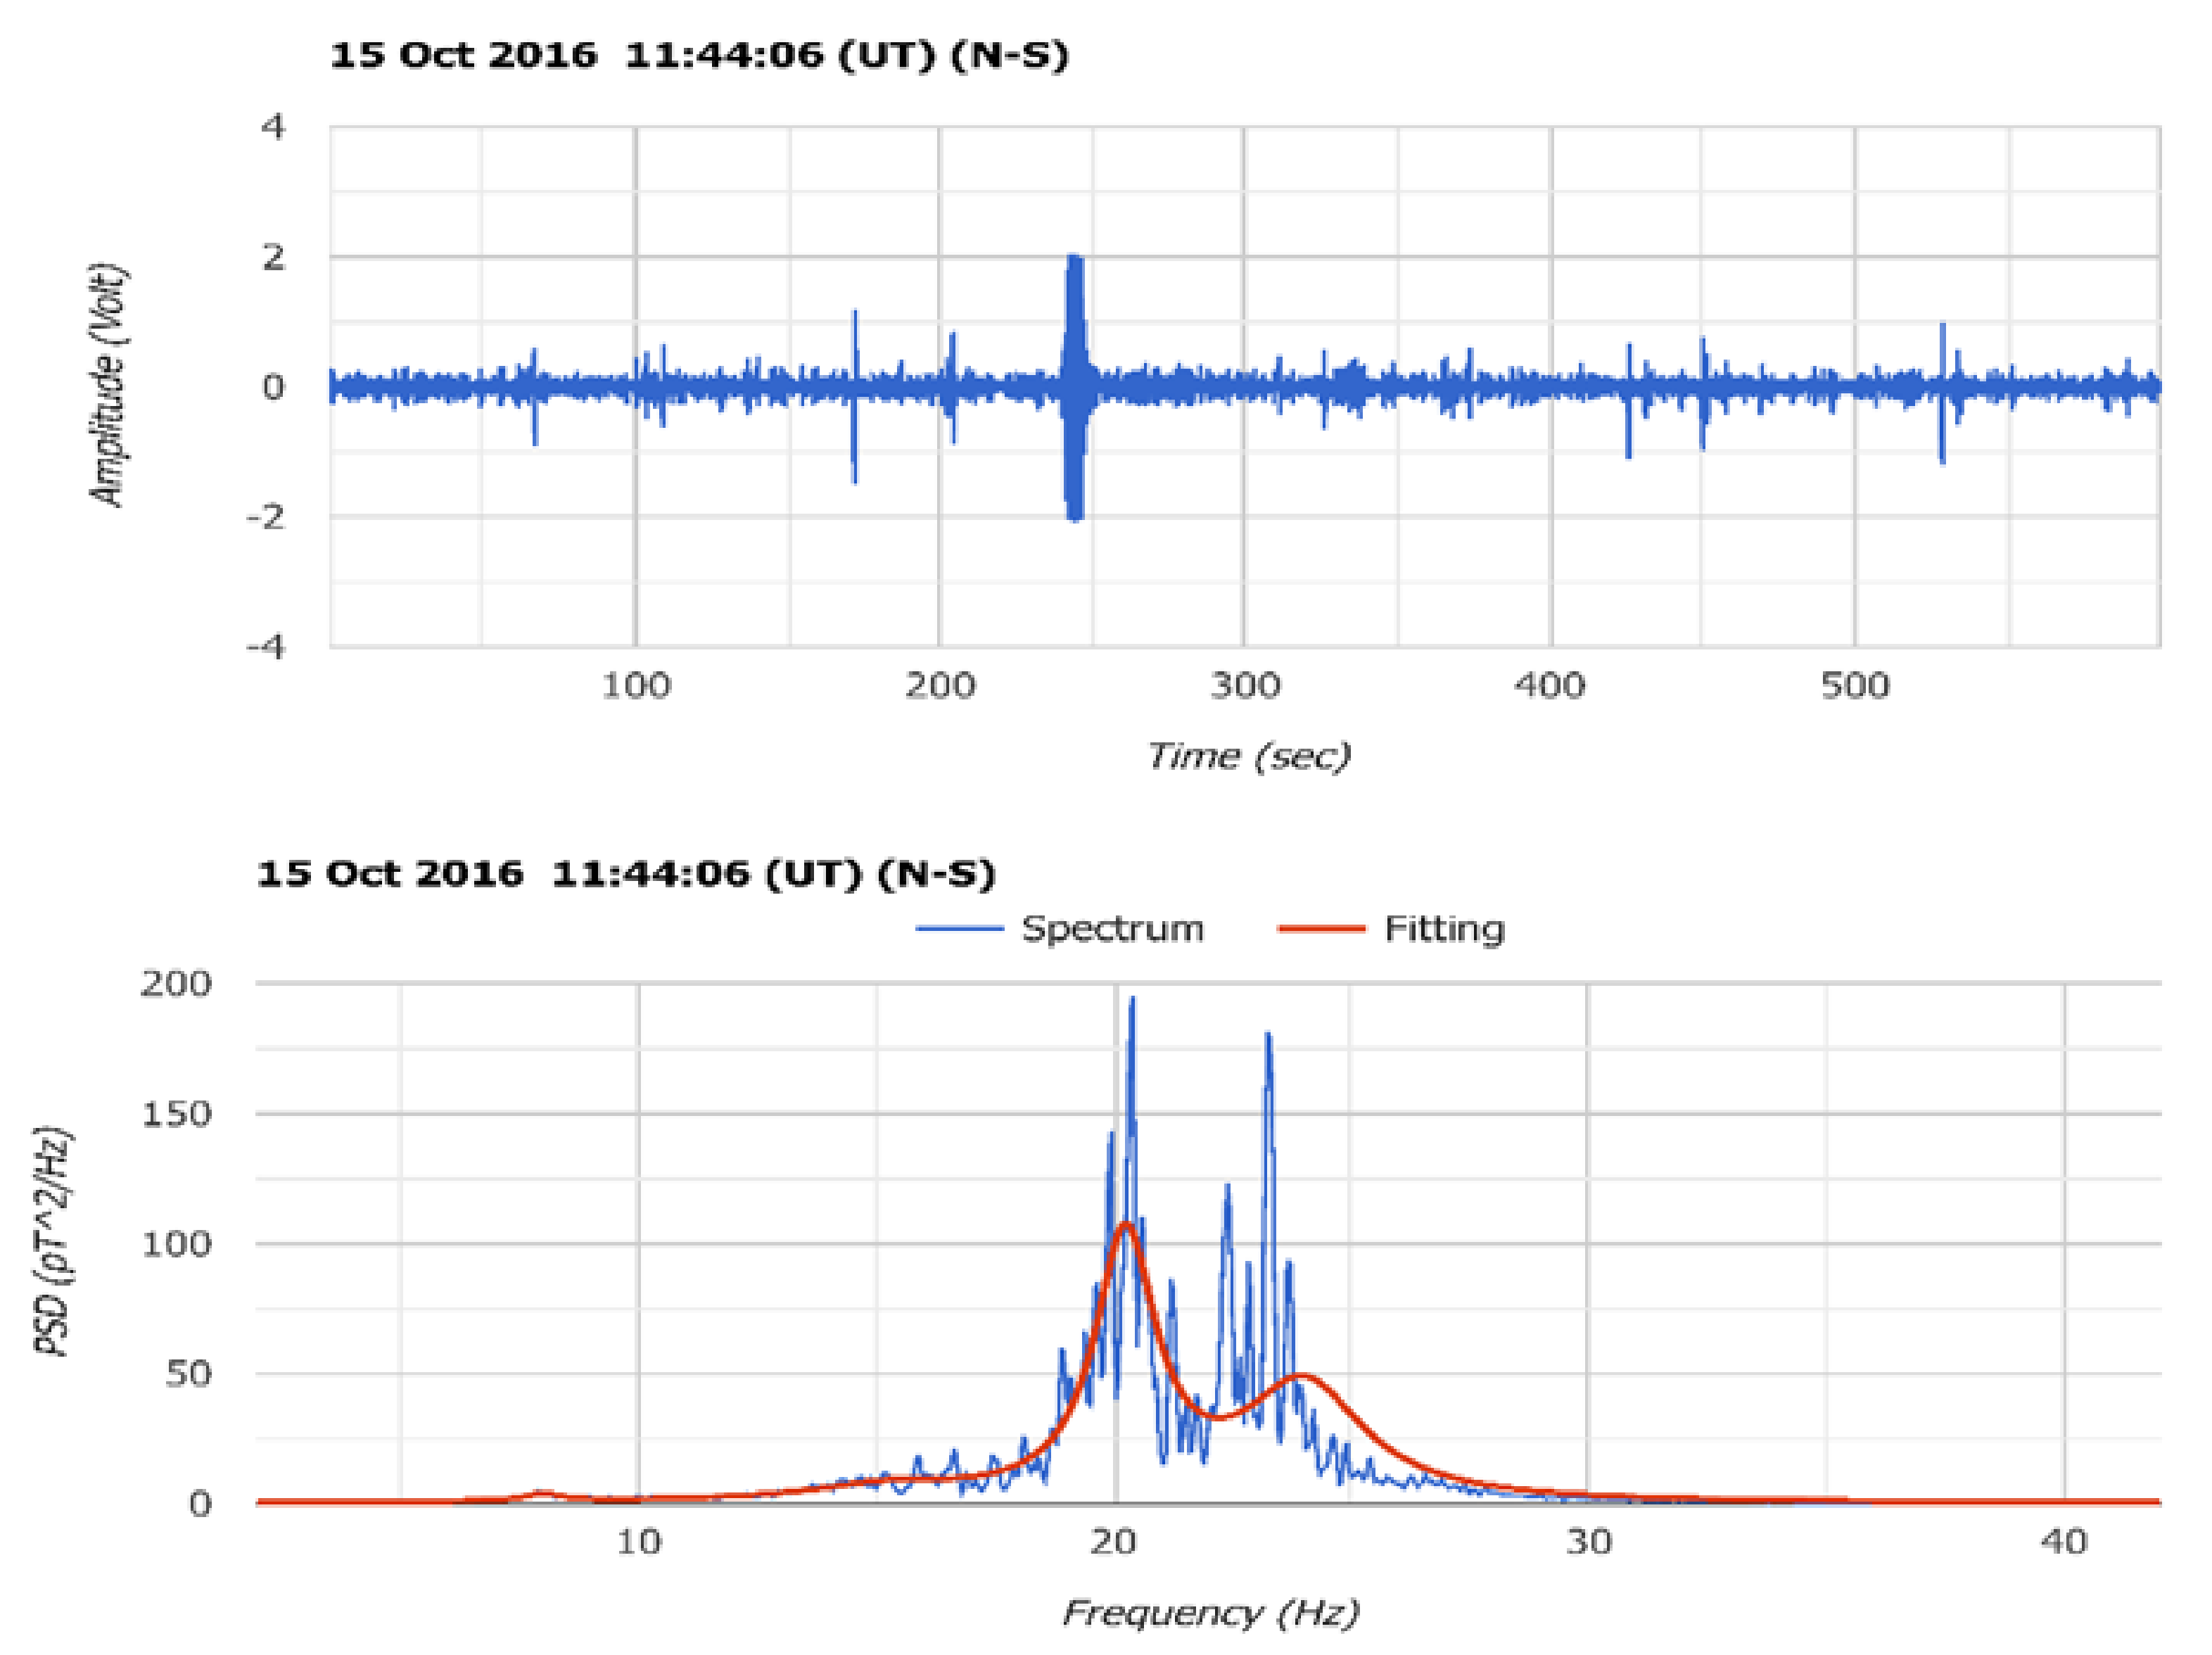
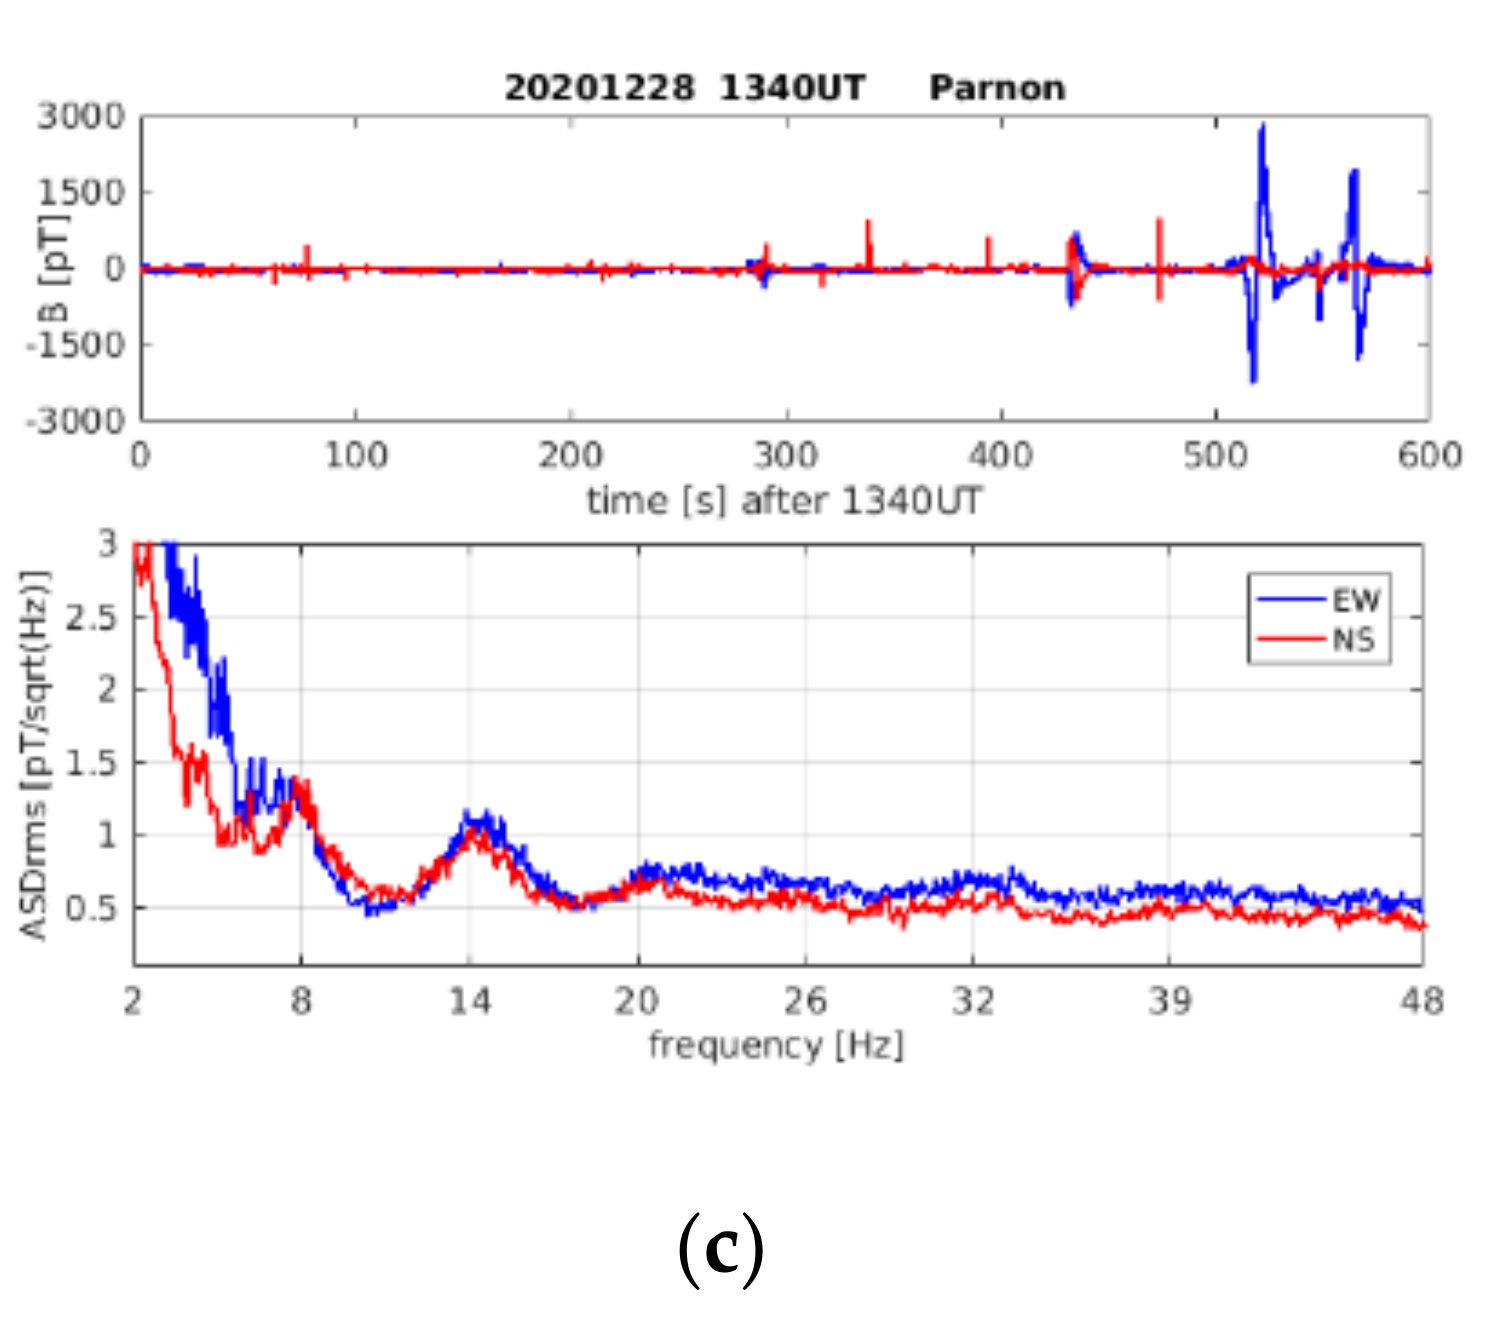
Figure 3.
Normal recordings from the Polish (a) and Greek (b) systems. Blue/red lines in the left panel represent recordings of the E-W/N-S orientated coils, respectively. The Greek system (b) consists of only N-S recordings (blue line). The red line is a simple Lorentz fitting.
Figure 3.
Normal recordings from the Polish (a) and Greek (b) systems. Blue/red lines in the left panel represent recordings of the E-W/N-S orientated coils, respectively. The Greek system (b) consists of only N-S recordings (blue line). The red line is a simple Lorentz fitting.
Figure 4.
Two series of vibrations by hand in both system coils. The first strip (red) in (a) presents a light rolling of the Polish N-S coil, while the blue strip presents another rolling of the E-W coil. The two blue strips in (b) represent vibrations of the Greek coil in the N-S (first strip) and E-W (second strip) directions.
Figure 5.
Interference signal in the Greek coil due to the rolling of the Polish coils.
Figure 5.
Interference signal in the Greek coil due to the rolling of the Polish coils.
Figure 6.
Possible pre-seismic signal received a few hours before a medium-sized earthquake at Kalpaki very close to the north SR observation site in northern Greece (Kalpaki).
Figure 6.
Possible pre-seismic signal received a few hours before a medium-sized earthquake at Kalpaki very close to the north SR observation site in northern Greece (Kalpaki).
Figure 7.
Car engine running around 5000 RPM. Characteristic disturbances are clear within the interval of 150-250 s (upper panels), while a spectrum power increase in the range of 20-30 Hz is also common in both systems: Polish (a) and Greek (b).
Figure 7.
Car engine running around 5000 RPM. Characteristic disturbances are clear within the interval of 150-250 s (upper panels), while a spectrum power increase in the range of 20-30 Hz is also common in both systems: Polish (a) and Greek (b).
Figure 8.
Recordings after a hunting gun shot. A weak N-S signal in the 300-900 Hz frequency range of the Polish system (a,c) is evident. The Greek system recording Completed (b) does not present any noticeable.
Figure 8.
Recordings after a hunting gun shot. A weak N-S signal in the 300-900 Hz frequency range of the Polish system (a,c) is evident. The Greek system recording Completed (b) does not present any noticeable.
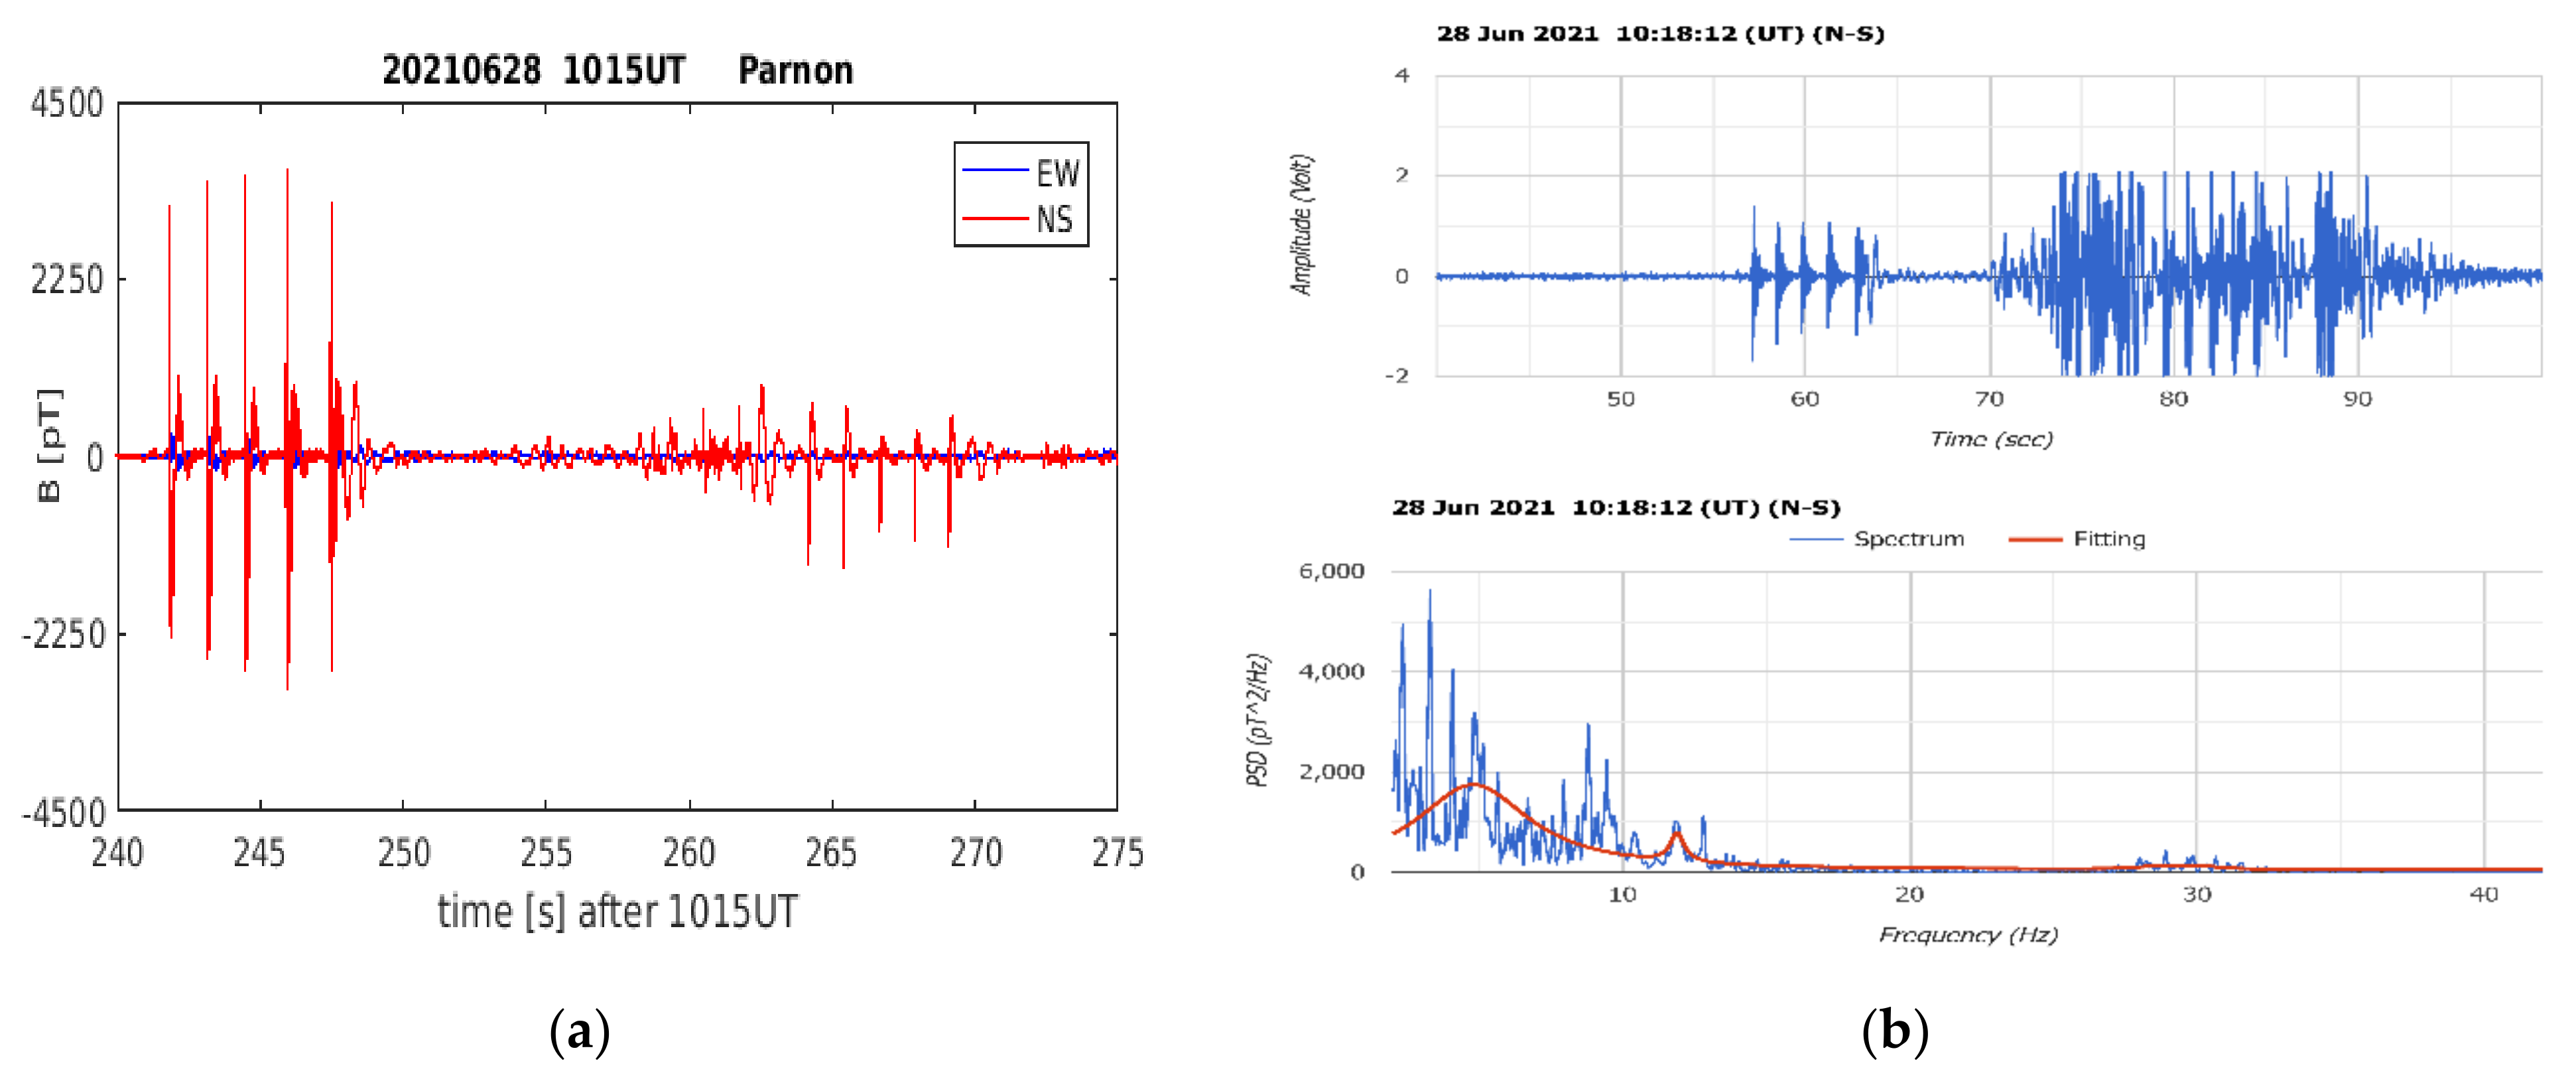
Figure 9.
Two sets of vibrations recorded by the Polish (a) and Greek (b) systems after five knocks on the metal front door and metal window of the building.
Figure 9.
Two sets of vibrations recorded by the Polish (a) and Greek (b) systems after five knocks on the metal front door and metal window of the building.
Figure 10.
Magnification of
Figure 9. Five knocks on the front door and the window to the right of it, behind which the Polish and the Greek N-S coil are located. The data from the Greek system is shown in (
b) and the data from the Polish system in (
a). The five knocks are clearly identifiable in both recordings.
Figure 11.
Details of
Figure 10b. Five knocks on the front door (
a) and five knocks on the side window (
b) above the Greek coil (distance 1.3 m) recorded by the Greek system. In both cases, detailed vibrations of the metallic objects are evident.
Figure 11.
Details of
Figure 10b. Five knocks on the front door (
a) and five knocks on the side window (
b) above the Greek coil (distance 1.3 m) recorded by the Greek system. In both cases, detailed vibrations of the metallic objects are evident.
Figure 12.
Five knocks on the window to the left of the front door ((a), first strip) and five knocks on the window above the Polish E-W coil ((a), second strip). Magnification of the five knocks on the E-W window recordings by the Polish coil (panel (b)) and similar recordings by the Greek N-S coil 6.5 m away (panel (c)).
Figure 13.
Five knocks on the window above the Polish logger and five knocks on the second entrance of the building, by the logger. Two blocks of five knocks each were recorded by the Polish (a) and Greek (b) coils.
Figure 13.
Five knocks on the window above the Polish logger and five knocks on the second entrance of the building, by the logger. Two blocks of five knocks each were recorded by the Polish (a) and Greek (b) coils.
Figure 14.
Recordings after closing the trunk and the doors of a car as recorded by the Polish system (a). Similar noises were recorded by the Greek coil (b). Upper panels relate to the trunk closing while the lower panels represent the doors.
Figure 14.
Recordings after closing the trunk and the doors of a car as recorded by the Polish system (a). Similar noises were recorded by the Greek coil (b). Upper panels relate to the trunk closing while the lower panels represent the doors.
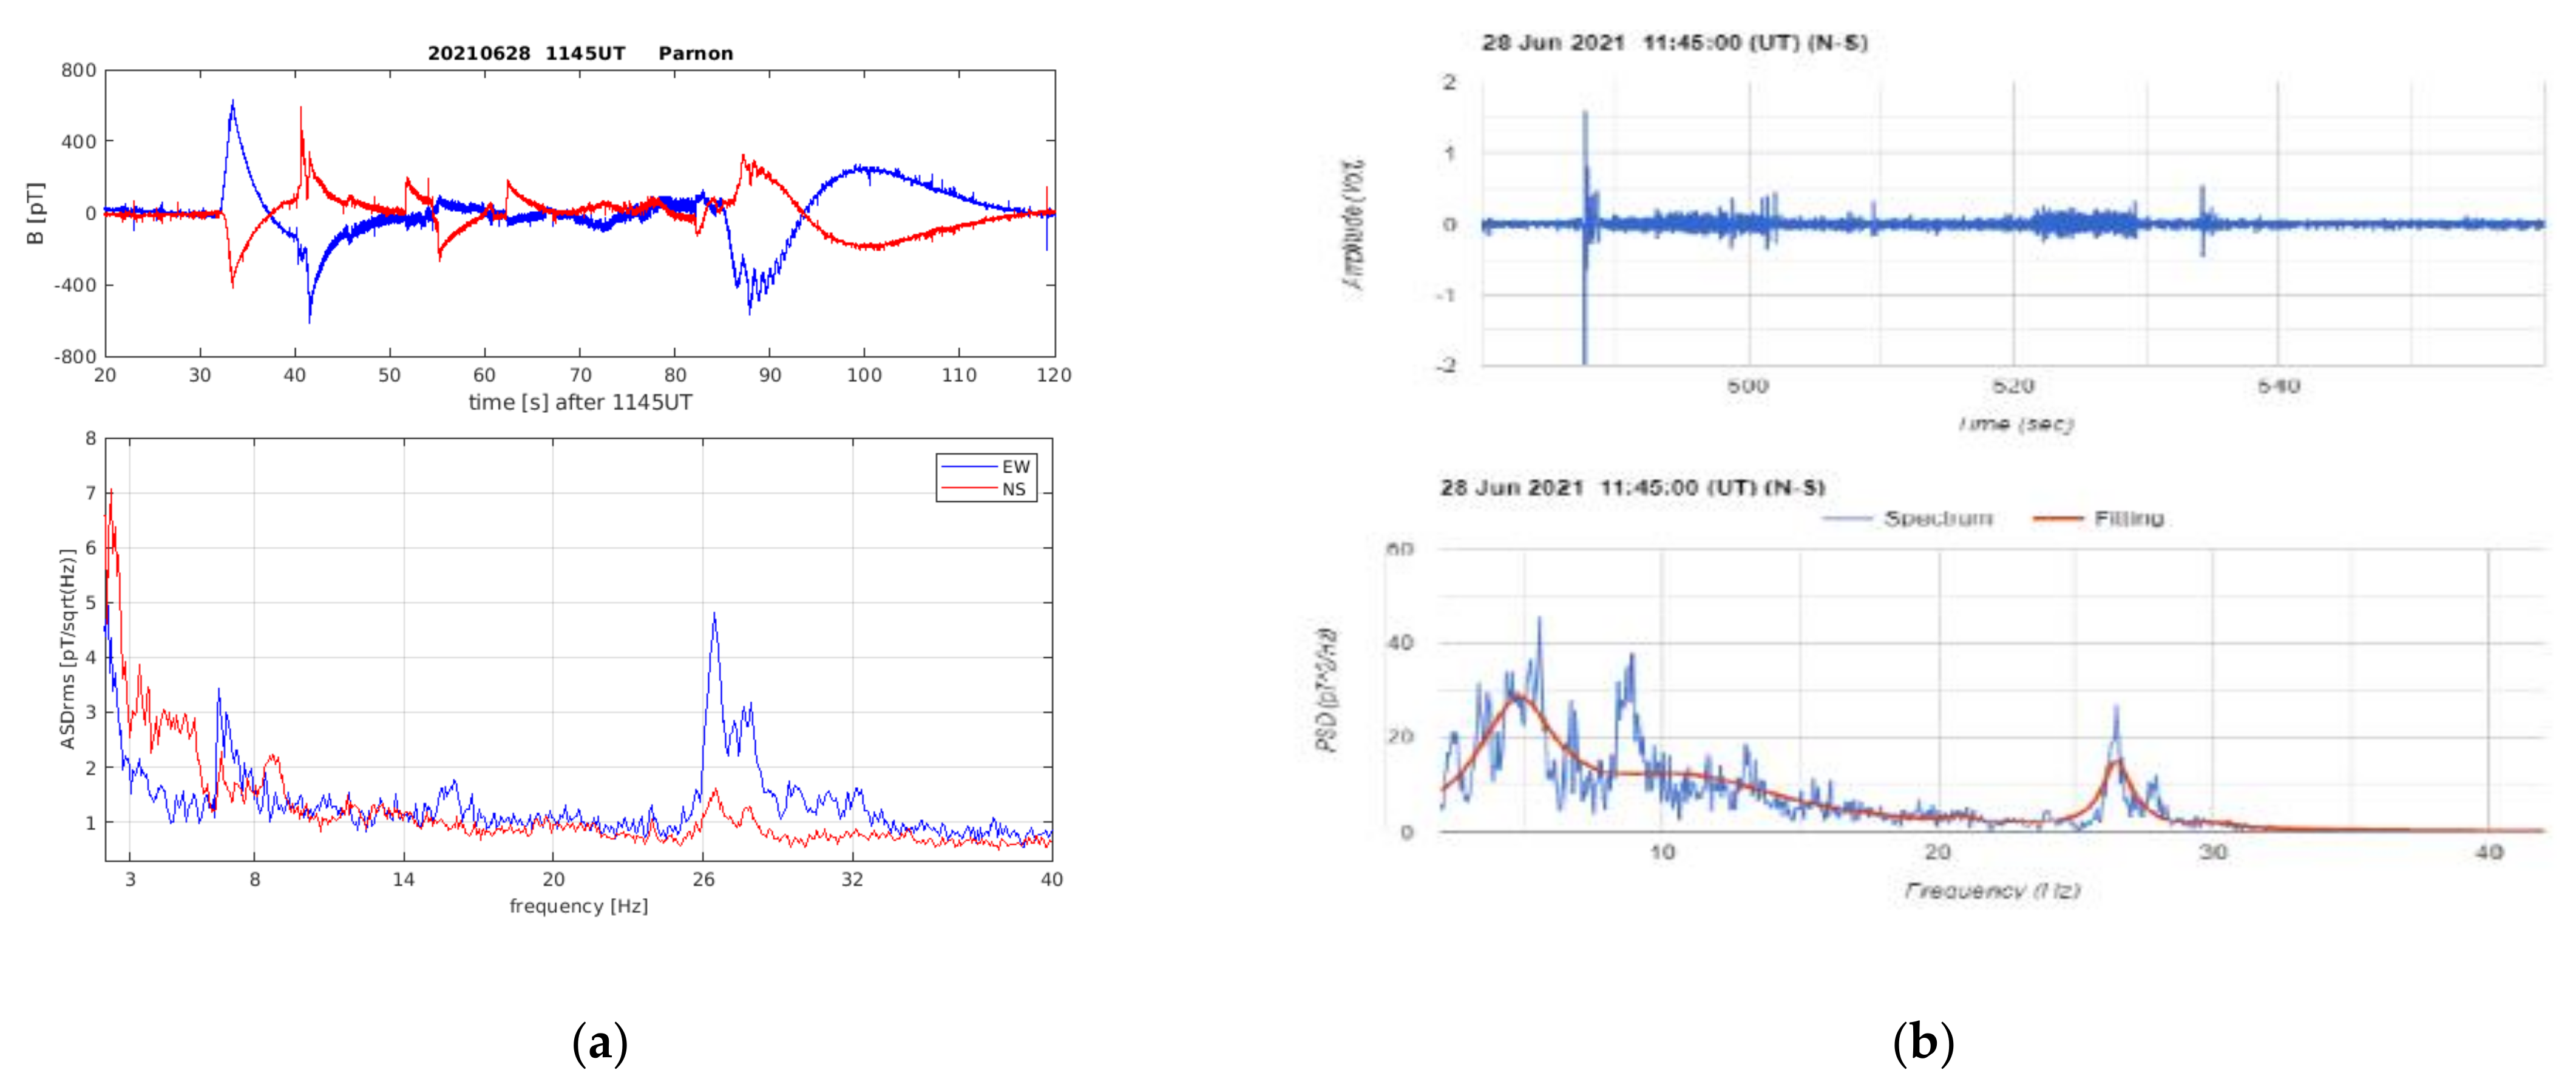
Figure 15.
Recordings during a noisy departure from the station place. A mixture of the car engine, music from the stereo, and horn sounds represented by the Polish (a) and Greek (b) coils. The lower panel (c) represents a detail of the upper panel after filtering out the frequencies below 14 Hz and above 39 Hz to spotlight a characteristic noise around 27 Hz, which was recorded by both systems.
Figure 16.
Schematic representation of the results in
Table 2, where the significance of the “noises” versus their distance from both systems are depicted. Red squares correspond to the Greek system in voltage E(V) while the blue circles represent the Polish system in magnetic induction B (pt.).
Figure 16.
Schematic representation of the results in
Table 2, where the significance of the “noises” versus their distance from both systems are depicted. Red squares correspond to the Greek system in voltage E(V) while the blue circles represent the Polish system in magnetic induction B (pt.).
Table 1.
Summary of experimental actions.
Table 1.
Summary of experimental actions.
| No. of Case | Date | Time (UT) | Type of Interference |
|---|
| 01 | 28 December 2020. | 08:46
08:47 | Shake of the N-S and the E-W coils. Slow short rollings up to 10 deg. forward/backward. |
| 02 | 28 December 2020. | 13:16–13:20 | Car engine running at about 5000 rpm. |
| 03 | 28 June 2021. | 13:44 | Shots from a hunting gun. |
| 04 | 28 June 2021. | 13:56
14:10 | Five separate knocks on the front door and the window by the door (which are almost by both the N-S coils). |
| 05 | 28 June 2021. | 10:20 | Five separate knocks on the two windows close to and above the E-W coil. |
| 06 | 28 June 2021. | 14:15 | Five separate knocks on the door and the window close to and above the Polish logger, which is some distance from the coils. |
| 07 | 28 June 2021. | 11:35 | Noises coming from the closing of the trunk and doors of a car. |
| 08 | 28 June 2021. | 14:30 | Departing car engine with high RPM together with tooting klaxon. |
Table 2.
Evaluation of the experimental results.
Table 2.
Evaluation of the experimental results.
| Case No. | Action | Average Intensity of Recordings | Average Distance from the Two Systems (m) | Outcome | Grade |
|---|
| B (pT) | E (Volts) |
|---|
| 01 | Rolling of coils | +/−12,000 | +/−2.0 | None | Two narrow saturated strips in the raw data. Unformed spectrum. | A |
| 02 | Running car engine | −2250/+3000 | −0.5/+0.8 | 12.50 | Disturbances in the raw data. A small bulge in the spectrum range 20–30 Hz. | B |
| 03 | Gun shooting | −2500/+3000 | +/−0.2 | 5.0 | Small disturbances close to 1 kHz.Typical but weak spectrum. | D |
| 04 | Knocks on the front door | −2250/+4000 | +/−1.0 | 0.5 | Five distinct frills. High bulges in low frequencies (0–10 Hz). | A |
| 05 | Knocks on the side windows | −1500/+3000 | +/−2,0 | 0.5 | Five distinct frills. High bulges in low frequencies (0–10 Hz). | B |
| 06 | Knocks on the second door | +/−50.00 | +/−0.5 | 6.5 | Similar but weaker picture than the Case No.04 | B |
| 07 | Knocks on the windows far from the coils | +/−50.00 | +/−0.25 | 6.5 | Disturbances in the raw data and suppression of the spectrum to the lowest frequencies | C |
| 08 | Knocks on the windows above the E-W coil. | +/−330.00 | +/−2.0 | 3.0 | Disturbances in the raw data. Bulges in the spectrum range 27–32 Hz. | B |
| 09 | Closing the car trunk | +/−200.00 | +/−0.4 | 12.5 | Weak single peak in the raw data. | C |
| 10 | Closing car doors | +/−200.00 | +/−0.4 | 13.0 | Weak single peak in the raw data. | C |
| 11 | “Noisy” departure | +/−600.00 | +/−1.5 | 80.0 | Wide peaks in the Polish data, single intensive peak in the Greek data. | C |
| Publisher’s Note: MDPI stays neutral with regard to jurisdictional claims in published maps and institutional affiliations. |
© 2022 by the authors. Licensee MDPI, Basel, Switzerland. This article is an open access article distributed under the terms and conditions of the Creative Commons Attribution (CC BY) license (https://creativecommons.org/licenses/by/4.0/).


 ,
, 


