Abstract
Gear transmission error (GTE) is a critical factor influencing the performance and service life of gear systems, as it directly contributes to vibration, noise generation, and premature wear. The present study introduces a combined theoretical and experimental approach to characterizing GTE in a single-stage spur gear system. A six-degree-of-freedom nonlinear dynamic model was formulated to capture coupled lateral–torsional vibrations, accounting for gear mesh stiffness, bearing and coupling characteristics, and a harmonic transmission error component representing manufacturing and assembly imperfections. Simulations and experiments were conducted under healthy and eccentricity-faulted conditions, where a controlled 890 g eccentric mass induced misalignment. Frequency domain inspection of faulty gear data showed pronounced sidebands flanking the gear mesh frequency near 200 Hz, as well as harmonics extending from 500 Hz up to 1200 Hz, in contrast with the healthy case dominated by peaks confined to 50–100 Hz. STFT analysis revealed dispersed spectral energy and localized high-intensity regions, reinforcing its role as an effective fault diagnostic tool. Experimental findings aligned with theoretical predictions, demonstrating that the integrated modelling and time–frequency framework is effective for early fault detection and performance evaluation of spur gear systems.
1. Introduction
GTE is an important factor that affects the performance and reliability of gear systems. GTE refers to deviation of the actual gear tooth position from the ideal or designed position, and it is caused by various factors such as manufacturing errors, installation errors, and deflections due to external loads. One important approach for modeling GTE is based on the gear mesh stiffness function, which represents the relationship between the applied load and the resulting deflection of the gear tooth. This approach has been used to develop various models for predicting the dynamic behavior of gear systems, including the vibration response and the noise level. Gear transmission error is a critical factor influencing the performance and reliability of gear systems, and it can be categorized into static transmission error (STE) and dynamic transmission error (DTE). STE is primarily concerned with the misalignment and deformation of gear teeth under load, which is particularly significant in lightweight gear systems made from composite materials. DTE is defined as the deviation in the position of the output shaft from its expected position in an ideal gear pair, and it is a significant indicator of gear meshing quality and dynamic performance [1,2,3]. A novel nonlinear finite element approach has been developed to accurately estimate STE in such systems, highlighting the advantages of hybrid metal–composite gears in reducing vibrations and noise compared to traditional designs [4]. On the other hand, DTE is influenced by dynamic factors such as time-varying mesh stiffness and gear interactions, which are crucial in high-speed applications like trains. A spatial vehicle–track coupled dynamics model has been proposed to analyze these effects, showing that DTE can significantly impact the lateral and vertical motions of gear pairs, especially when trains navigate curves [5]. Additionally, in split torque gear systems, center distance errors and backlash are identified as critical factors affecting dynamic behavior, with the former having a linear impact and the latter a nonlinear one [6]. Advanced modeling techniques, such as nonlinear transverse–torsional coupled models, further explore the impact of transmission error on system stability, revealing complex routes to chaos influenced by backlash and control parameters [7]. In multistage planetary gear systems, comprehensive meshing errors contribute to complex dynamic behaviors, indicating the sensitivity of these systems to external excitations [8]. To address the challenges of diagnosing gear faults related to transmission errors, innovative methods combining signal processing, machine learning, and numerical simulations have been developed. These include the use of variational modal decomposition and neural networks for fault diagnosis [9], as well as generative adversarial networks to enhance fault sample datasets for improved detection accuracy [10]. The lateral–torsional coupling in spur gears is crucial for understanding their dynamic behavior under different operational conditions. For instance, gear wear affects the meshing stiffness and static transmission error, which in turn influences the dynamic characteristics of the gear system under different load conditions [11]. Misalignment errors, both constant and time-varying, introduce nonlinear tilting moments that lead to pendular vibrations, further complicating the dynamic response of the system and making it prone to sub-harmonic resonance and contact loss, especially at high speeds [12]. Additionally, the coexistence of defects like pitting and cracking can exacerbate lateral–torsional vibrations, with pitting having a more pronounced effect on gear vibrations than cracking [13]. The interaction between lateral and torsional vibrations is also evident in systems with hydrodynamic bearings, where fluid–structure interactions can reduce stability thresholds and convert torsional oscillations into lateral vibrations, as demonstrated through experimental and numerical analyses [14]. Moreover, the presence of nonuniformly distributed meshing forces, due to errors in machining and assembly, can degrade transmission performance by affecting the dynamic center distance and shaft deformation, leading to complex nonlinear behaviors such as quasiperiodic motion and chaos [15]. One approach involves using statistical control charts, such as the exponentially weighted moving average (EWMA), combined with discrete wavelet transform (DWT) to analyze vibration signals and detect gear faults by monitoring shifts in relative wavelet energy (RWE) features [16]. Deep learning techniques, particularly deep convolutional neural networks (DCNN), have also been employed for fault diagnosis by converting vibration signals into images using methods like Continuous Wavelet Transmission (CWT), which has shown high effectiveness in identifying multiple faults [17]. Spectral analysis, enhanced by spectral kurtosis-based blind deconvolution, has been shown to improve fault detection by filtering in the order domain, significantly enhancing performance under varying operational speeds [18]. Additionally, the evolution of coupling faults such as fatigue cracks and wear has been modeled to understand their impact on gear dynamics, providing insights into the fault diagnosis and prognosis of spur gear systems [19].
Despite extensive studies on GTE, most existing models either address static or dynamic effects in isolation or neglect the coupled lateral–torsional interactions that dominate under faulted conditions. Experimental validation of such coupled nonlinear models also remains limited, especially for spur gears with controlled eccentricity defects. The present study addresses this gap by developing a nonlinear coupled lateral–torsional dynamic model integrated with harmonic GTE that is capable of capturing defect-induced responses at the level of a single gear mesh. Although the test rig used for experiments is a two-stage gearbox, the analysis was restricted to one gear stage to maintain direct consistency with the single-stage model. Controlled eccentricity was introduced at this stage to simulate fault conditions and validate the theoretical predictions. Vibration acceleration and velocity responses were measured as practical proxies, since direct GTE measurement requires optical encoders not available in the current experimental setup. The combined theoretical and experimental framework provides a consistent basis for early fault diagnosis, enhanced fault characterization, and improved design and maintenance strategies for spur gear systems.
2. Mathematical Modeling of a Spur Gear
A single-stage spur gear with six degrees of freedom (DOF) is a simplified model that can be used to predict the dynamic response of a gear system. This model is convenient for predicting the dynamic response of a gear system because it takes into account the six most important degrees of freedom while ignoring other more complex degrees of freedom. The six DOF model is especially useful for predicting the vibration and noise of a gear system. The gear teeth are modeled as rigid bodies that interact through contact forces. These forces are calculated based on the geometry and material properties of the gear teeth. The dynamic response of the gear system is then determined by solving the equations of motion for the gear and the supporting structure, taking into account the contact forces, the gear mesh stiffness, and the gear and structure damping. The six DOF model is a nonlinear model, which means that it can predict complex behavior such as gear tooth impacts and gear meshing nonlinearity. Nonlinear behavior can be important in predicting the dynamic response of a gear system, especially under heavy loads.
2.1. Establishment of a Mathematical Single Stage of a Spur Gear Model
The formulation of a mathematical model to study the dynamic behavior of a single involute spur gear is developed based on the diagram presented in Figure 1. The model incorporates multiple rotating components such as an electric motor, shafts, bearings, and flexible couplings to capture the essential dynamic interactions within the drivetrain. When formulating the model, the gearbox casing is treated as rigid to ensure that structural deformations of the housing do not influence the system response. The gears and shafts are lumped in the model to form a unified degree of freedom. The radial stiffness and damping coefficients of all bearings are taken as equal and constant to simplify their representation while maintaining their role in supporting the rotating elements. The torsional stiffness and damping of the input and output couplings are also assumed to be equal and constant to reflect their symmetric role in transmitting torque. Bearing friction is neglected to focus on the primary dynamic effects, while the motor input torque is considered constant, disregarding torque ripple to emphasize the steady-state transmission characteristics of the system.
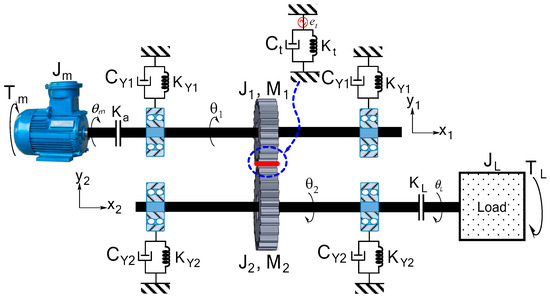
Figure 1.
Schematic diagram of one-stage spur gear system.
The system comprises an input shaft connected to the electric motor and pinion (driver) and an output shaft connected to the load and driven gear. Bearings support the rotating components and reduce friction with each bearing mounted to the gearbox casing. The input and output shafts are connected by flexible couplings that transmit torque and allow for minor misalignments. The motor produces an input torque Tm while the load applies a resistance torque TL during power transmission. The general transmission error, denoted as et, captures deviations in gear meshing. Such misalignment and transmission errors can induce lateral and torsional vibrations, leading to reduced efficiency, accelerated wear of components, and, in severe cases, system failure.
2.2. Kinetic Energy Expression
The kinetic energy of the coupled lateral–torsional system represents the energy associated with the translational and rotational motions of its components. For a single-stage spur gear system, this energy can be expressed as a summation of the contributions from the shafts, gears, and couplings.
where M1 and M2 denote the translational masses of the pinion and gear shafts, respectively, Y1 and Y2 represent their lateral displacements, and Jm, JL, J1, and J2 are the moments of inertia of the motor, load, and gear elements, respectively.
2.3. Potential Energy Expression
The potential energy accounts for the elastic deformation of the shafts, couplings, and meshing gear teeth. It depends on the torsional and lateral displacements of the shafts as well as the deformation of the gear teeth resulting from their contact with the pinion.
where KY1 and KY2 are the lateral stiffnesses of the supporting bearings, Ka and KL are the torsional stiffnesses of the input and output couplings, and Kt represents the gear mesh stiffness. The term [(Y1 + R1θ1) − (Y2 + R2θ2)] captures the relative lateral–torsional deformation across the meshing gears. θ1 is the angular displacement of the input shaft or pinion, θ2 is the angular displacement of the output shaft or driven gear, θL is the angular displacement of the load side resisting torque application point, and θm is the angular displacement of the motor side input torque application point.
2.4. Rayleigh Dissipation Function
Damping effects were modeled using the Rayleigh dissipation function, representing energy loss due to the internal friction and hysteresis within the system’s components.
where CY1 and CY2 denote the lateral damping coefficients of the bearings, while Ca and Cc represent the torsional damping of the input and output couplings.
2.5. Modeling the Transmission Error Term
To incorporate imperfections in gear meshing, a transmission error term e(t) was introduced into the model. e(t) represents the generalized kinematic error in angular displacement between the driving and driven gears, defined as the deviation of the actual position of the driven gear from its ideal position under geometrically perfect conditions. It accounts for imperfections in gear meshing arising from tooth deflections, manufacturing inaccuracies, misalignment, or elastic deformations. The term combines a static component e0 with a harmonic component representing periodic deviations in gear engagement [20]:
where e0 is the static transmission error, en and ϕn represent the amplitude and phase of the nth harmonic of the error, respectively, and ωm denotes the corresponding excitation frequency, while the superscript T indicates the transpose matrix.
2.6. Equation of Motion Governing the System
Lagrange’s dynamics equation is represented by a set of equations that describe the motion of a system of particles in classical mechanics. These equations are derived from the principle of least action and express the dynamics of the system in terms of the Lagrangian, which is a function that summarizes the kinetic, potential, and dissipative energies of the system. Lagrange’s equation of motion can be written as follows:
where q is the generalized coordinate and Fq is the generalized force.
Upon performing algebraic manipulation, the equation of motion that governs the single-stage couple torsional lateral vibration of a spur gear system can be expressed in matrix form.
The system equations of motion were solved using a fourth-order Runge–Kutta method. A fixed step size of 1 × 10⁻⁴ s was chosen after convergence tests confirmed the numerical stability and accuracy of the vibration response. Convergence was verified by comparing results at smaller time steps, where no significant differences were observed.
3. Configuration and Instrumentation of the Coupled Spur Gear Test Rig
The experimental configuration of the coupled lateral–torsional spur gear system provided a framework for evaluating gear transmission error and enhancing fault diagnosis. Transmission error, defined as the deviation of the actual gear position from its ideal kinematic position, arises mainly from tooth profile variations and manufacturing imperfections. It is a dominant source of gear-induced vibration and noise, leading to progressive wear and potential failure. Capturing both lateral and torsional responses allowed for a more comprehensive assessment of the dynamic behavior of the gear system, facilitating early fault detection and diagnostic evaluation.
The gearbox test rig was driven by an electric motor coupled to a dynamometer, operating at a fixed shaft frequency ranging from 50 to 80 Hz, with torque adjusted through the brake control unit. Vibration signals were measured using 352C03 piezoelectric accelerometers, manufactured by PCB Piezotronics, Inc., Depew, New York, United States, mounted on the gearbox casing in the radial direction near the gear mesh line of action. Shaft rotation was monitored by a speed sensor, torque was recorded via the dynamometer, and an eccentric mass of 890 g was introduced to generate static transmission error. NI 9215 modules provided four 16-bit analog input channels (±10 V, 100 kS/s per channel) as shown in Figure 2. Data were sampled at 25.6 kHz with anti-aliasing and stored in LabVIEW 2020 for analysis. Synchronization across channels enabled digitization close to the sensors, reducing noise and simplifying cabling during vibration measurements. Each experimental condition (healthy and faulty gear states) was tested in three independent trials. Data were recorded under identical operating speeds and torque loads for each trial, enabling statistical averaging and reducing the influence of random disturbances. It is important to note that the present test rig configuration does not accommodate direct lubrication circulation or thermal control. The gears operate under dry or near-dry contact conditions, which means that interactions between lubricant film thickness, frictional heating, and gear dynamics could not be reproduced in this study.
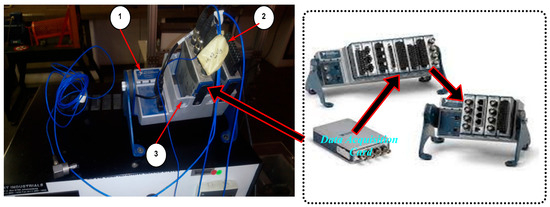
Figure 2.
NI compact DAQ module: 1—terminal block, 2—sensor set, 3—data acquisition set.
Figure 3 shows the gearbox of the three-phase MM 242 geared system engineered for operation with a 220 V, 50 Hz power supply. It uses a two-stage reduction configuration with sequential spur gear sets that transmit mechanical power from the input to the output shaft. The first stage provides an initial speed of 520 rpm and torque amplification, followed by the second stage, which achieves the required output. Both stages employ high-precision spur gears manufactured to tight tolerances, selected for high efficiency, low backlash, and improved load distribution, minimizing transmission errors. However, only one stage was considered in the analysis in order to maintain consistency with the single-stage model. The gearbox casing and gears are made from thermally treated alloy steels to withstand mechanical stresses and thermal loads during heavy-duty, continuous operation. This compact, optimized structure reduces footprint while maintaining housing rigidity to suppress vibration.
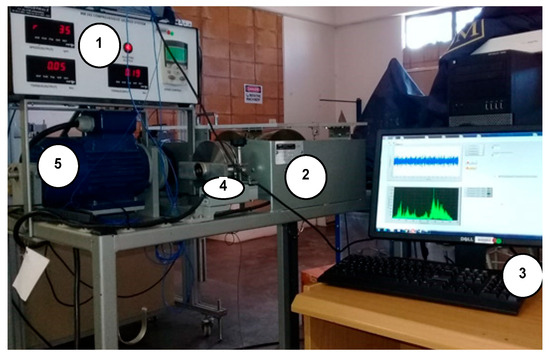
Figure 3.
Comprehensive geared system experimental setup of gearbox: 1—input indicator system, 2—gear set, 3—computer, 4—mechanical brake dynamometer, 5—electrical motor.
The assembly consists of three shafts supported by ball bearings on a steel frame, two fixed gears, and two shiftable gear sets. The second shaft includes an interchangeable inertia mass, and the motor drives the transmission through a coupling between the drive and input shafts. The output shaft is connected to a magnetic powder clutch brake. Figure 4 shows the top view of a two-stage spur gear arrangement for evaluating transmission error and vibration responses. The setup includes a cable drum (1) on the input shaft for controlled loading, two spur gear stages (2) for speed reduction and torque amplification, and an output shaft speed sensor (3) for capturing rotational velocity data to correlate with transmission error. The shafts are supported by ball bearings (4) to maintain alignment and minimize friction effects. A sensor (5) measures lateral and torsional vibrations for time and frequency domain analysis. A lock screw (6) ensures secure gear positioning, the input shaft (7) transmits torque from the motor, and an eccentric mass (8) induces controlled misalignment to simulate gear faults. For validation, controlled eccentricity was applied to one gear stage, and vibration responses from this stage were used for comparison with the single-stage theoretical model.
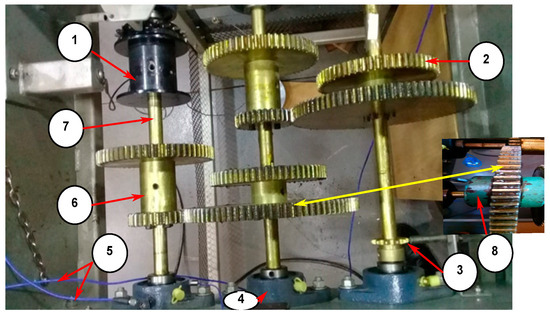
Figure 4.
Top view of two-stage spur gear setup: 1—cable drum, 2—gears, 3—output shaft speed sensor, 4—ball bearings, 5—vibration sensor, 6—lock screw, 7—input shaft, 8—eccentric mass.
Table 1 summarizes the key parameters of the involute spur gear system used in this study, covering the essential mechanical and material properties needed for dynamic modeling. The lateral meshing stiffness and damping coefficients of the bearings define resistance to lateral displacements and energy dissipation, affecting vibration response predictions. The torsional stiffness and damping of the couplings characterize torque transmission while limiting torsional oscillations, reducing dynamic loads on the gear teeth. The main gearing parameters, including mass, number of teeth, and base circle radius, affect gear mesh kinematics and load distribution. Young’s modulus and Poisson’s ratio define the elastic response of gear teeth under load, which is essential for evaluating transmission error and dynamic excitation.

Table 1.
Main parameters of involute spur gear system.
Table 2 summarizes the parameters used for FFT and STFT. For FFT, the 2500 Hz sampling frequency and 1600-point record gave a fine frequency resolution (1.56 Hz) suitable for detecting gear mesh peaks and sidebands. A rectangular window was applied, with normalization by record length to allow consistent amplitude comparison. For STFT, a 1000 Hz sampling frequency with a 256-point Kaiser window (β = 10) and 99% overlap provided a 3.91 Hz frequency resolution while maintaining good temporal continuity. The settings reduced leakage and enabled visualization of transient features in the spectrogram, making them suitable for distinguishing healthy and faulty gear responses.
Table 2.
Signal-processing parameters used for FFT and STFT analyses.
4. Results and Discussion
In this section, the outcomes and discussions of both theoretical and experimental analyses conducted to detect transmission errors in a one-stage spur gear system are presented. The theoretical analysis involved developing mathematical models to simulate the system’s behavior under various operating conditions, whereas the experimental analysis involved testing the gear system under different loads and measuring its actual transmission error. The results and discussions of these analyses are crucial in understanding the gear system’s performance and in developing effective measures to mitigate transmission errors.
4.1. Waveform of Spur Geared System
In a spur geared system, the waveform of the output is directly related to the rotational behavior of the gears. When two spur gears with different numbers of teeth are meshed, the teeth engage and disengage, creating cyclic variations in the output speed and torque. These variations are known as gear mesh frequencies. The waveform of the output of a spur geared system is a complex combination of different frequencies, including the mesh frequency, harmonics of the mesh frequency, and other frequencies related to the rotational speeds of the input and output shafts.
As shown in Figure 5a, the simulated healthy gear response exhibits an almost sinusoidal waveform with a relatively constant amplitude of approximately ±0.9 m/s2, indicating stable meshing between gears operating under normal conditions. Similar dynamic stability for healthy spur gears has been reported in research by Ren et al. [21], where smooth meshing produced sinusoidal-like vibration patterns. Figure 5b presents the experimental healthy gear signal, where real-world effects such as manufacturing tolerances, minor misalignments, and ambient noise cause fluctuations in the range of −5 m/s2 to +6 m/s2. Comparable variability in experimental spur gear responses due to noise and manufacturing deviations has been observed by Maraş et al. [22]. The introduction of an eccentricity fault is shown in Figure 5c. The simulated faulty gear response exhibits pronounced periodic variations, with alternating regions of weaker forces around −1 to +1 m/s2 and stronger forces peaking near ±3 m/s2. These changes correspond to the modulation of gear mesh forces caused by the added eccentric mass. The fault condition broadens the amplitude range and introduces clear periodicity, indicating significant disruption to torque transmission. Specifically, the model simulates a high level of eccentricity by adding an eccentric mass of 890 g, resulting in marked waveform distortion. Experimentally, these observations are confirmed in Figure 5d, which shows irregularities and high-amplitude transients reaching ±6 m/s2 compared to the healthier, more consistent response. These results indicate a strong influence of eccentricity on system dynamics. The experimental findings validate the simulations, demonstrating significant variations in vibration characteristics caused by eccentricity faults, thereby providing a solid basis for fault detection.
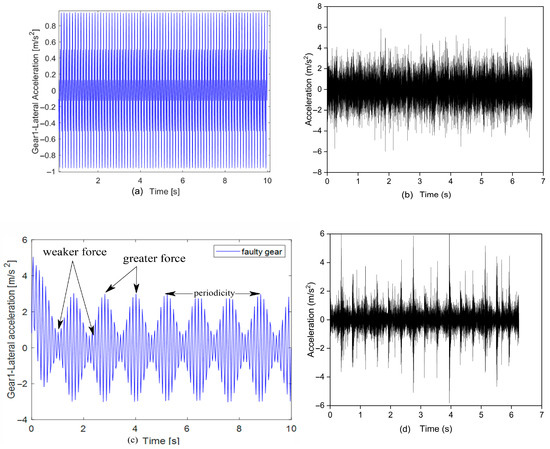
Figure 5.
Dynamic responses of simulated and experimental vibration signals for spur gear system in time domain: (a) simulation of healthy gear; (b) experiment using healthy gear; (c) simulation with gear eccentricity fault; (d) experiment with gear eccentricity fault.
In Figure 6a, the simulated healthy gear shows two dominant peaks at approximately 50 Hz (gear mesh frequency, fGM) and its harmonic near 100 Hz, with a maximum Fast Fourier Transform (FFT) amplitude of about 0.33 m/s2. The spectrum remains relatively clean with minimal sidebands, reflecting stable meshing conditions and little modulation from external sources. Figure 6b presents the experimental healthy gear spectrum, where additional broadband components are observed across 500–1500 Hz. The components with levels reaching up to 0.15 m/s2 are caused by structural vibrations and minor manufacturing imperfections, as well as environmental noise typically found in real-world gear systems. Happi et al. [23] also reported broadband responses associated with structural interactions and fault-induced surface degradation. In Figure 6c, the faulty gear shows sidebands around the gear mesh frequency at 200 Hz and harmonics at 700 Hz and 1200 Hz with values ranging from 0.004 to about 0.009 m/s2. The sidebands represent amplitude and phase modulations introduced by the eccentric mass and indicate periodic variations in gear mesh stiffness. Figure 6d confirms this experimentally, showing pronounced peaks in the 500–800 Hz and 1000–1300 Hz ranges, with amplitudes reaching about 0.06 m/s2, along with an increase in spectral energy across a wider frequency range. The broadening and clustering of frequencies in the faulty spectra signify elevated dynamic excitation introduced by the fault. Similar amplification and frequency clustering in faulty conditions have been observed by Cheng et al. [24], further validating the interpretation of fault-induced excitations in the present study. The appearance of sidebands and increased amplitudes at specific frequencies in both simulated and experimental data highlights the sensitivity of FFT analysis in detecting gear eccentricity.
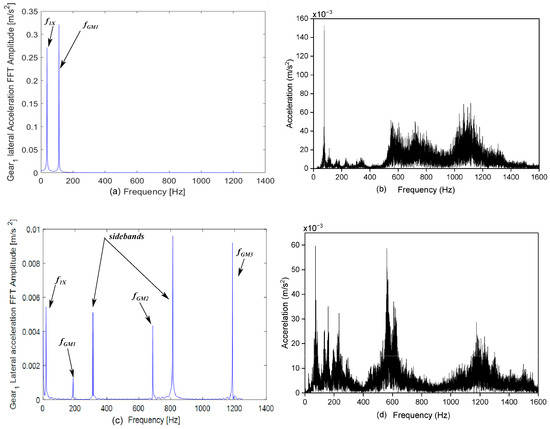
Figure 6.
Dynamic responses of simulated and experimental vibration signals for spur gear system in FFT spectrum: (a) simulation of healthy gear; (b) experiment using healthy gear; (c) simulation with gear eccentricity fault; (d) experiment with gear eccentricity fault.
4.2. Feature Extraction of Time–Frequency Representation of Spur Geared System
Feature extraction from time–frequency representations offers an essential pathway to understanding the complex vibration behavior of spur gear systems under varying operating and fault conditions. Gear dynamics inherently involve non-stationary signals due to the continuous meshing of gear teeth, the modulation of mesh stiffness, and the influence of defects such as eccentricity or tooth profile deviations. Conventional frequency domain methods fail to capture time-varying characteristics, making time–frequency analysis valuable. Short-Time Fourier Transform (STFT) converts vibration signals into a joint time–frequency domain, enabling the detection of transient features and evolving frequency components. Through this approach, key indicators such as frequency distribution, energy concentration, and coherence among frequency components are extracted. The time–frequency features, including localized energy concentrations, frequency trajectories, and inter-frequency coherence, provide a basis for diagnosing gear faults and evaluating the system’s operational state.
4.3. Spur Gear Analysis Through Short-Time Fourier Transform
STFT provides localized spectral information by segmenting the signal into finite windows and applying Fourier analysis to each segment. This approach enables the characterization of transient components, frequency modulations, and other time-dependent features that are not discernible using traditional frequency domain techniques [25].
The spectrogram derived from STFT provides a two–dimensional representation of how the signal’s energy is distributed across both time and frequency. It is obtained by computing the squared magnitude of STFT, which converts the complex-valued transform into a real-valued intensity measure.
where s(t) represents the vibration signal of the spur gear system, g(t) denotes the selected window function applied to segment the signal, and (τ − t) defines the window centered at time t. The variable τ corresponds to the time shift within the windowed segment, while ω denotes the angular frequency component of the analyzed signal.
Figure 7 presents the workflow for vibration signal processing to detect gear mesh errors using STFT. Vibration data are first acquired from the gear system and preprocessed through filtering and normalization to remove noise. STFT converts the time domain signals into a joint time–frequency representation, enabling the generation of spectrograms that visualize energy distribution across time and frequency. Key features are then extracted, compared with known fault patterns, and used for diagnosing the type and severity of gear faults.
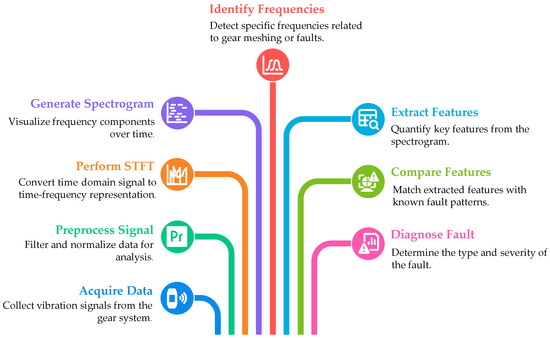
Figure 7.
Vibration signal processing route for gear mesh error detection based on STFT.
In Figure 8a,b, the healthy gear responses show a relatively stable frequency distribution with a dominant component corresponding to the input shaft speed frequency. The simulated spectrum in Figure 8a appears cleaner, with minimal noise, whereas the experimental response in Figure 8b shows additional low-level broadband components, which are attributed to real-world effects such as structural resonances and minor imperfections in gear meshing. Figure 8c,d reveal the impact of gear eccentricity. In the simulated response (Figure 8c), additional frequency bands emerge, reflecting modulations caused by the eccentric mass and the resulting non-uniform mesh stiffness. The experimental response in Figure 8d further confirms this behavior, displaying a broader and more scattered frequency distribution with higher energy levels across multiple bands. These features indicate increased dynamic excitation and a stronger time–frequency variability introduced by the fault.
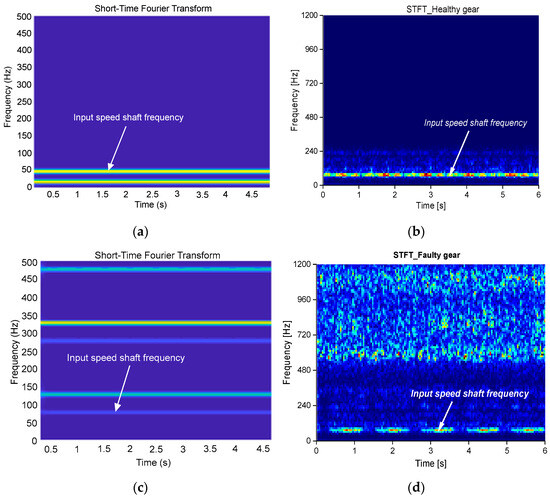
Figure 8.
STFT diagram of simulation and experiment lateral vibration signal responses: (a) simulation of healthy gear; (b) experiment using healthy gear; (c) simulation with gear eccentricity fault; (d) experiment with gear eccentricity fault. Colours indicate amplitude intensity, with dark blue showing low vibration energy and yellow–red showing high energy at dominant frequencies.
Figure 9 presents the FFT analysis of the simulated transmission error responses of healthy and faulty spur gear systems. The blue curve represents the healthy gear, which exhibits relatively small transmission error amplitudes concentrated at discrete frequencies, primarily at the gear mesh frequency and its harmonics. The indicates smooth meshing with minimal deviations from the ideal tooth engagement. In contrast, the red curve for the faulty gear shows a rise in transmission error amplitudes at several frequencies. Enlarged sections of the spectrum highlight variations around 200–400 Hz and 750–850 Hz, as well as above 1000 Hz. The peaks and fluctuations indicate distortion in the gear engagement process and are directly linked to the eccentric mass added to the system. The elevated error levels indicate disrupted kinematic motion between the gears, which compromises the uniformity of torque transmission.
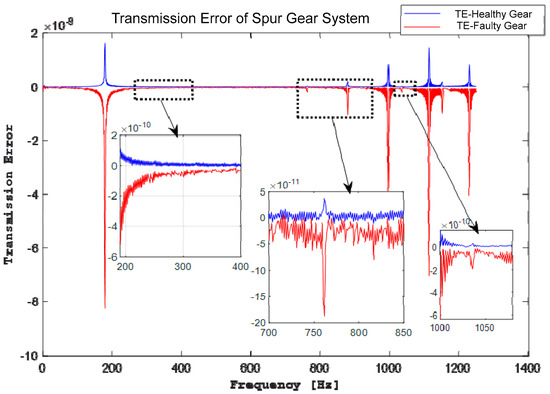
Figure 9.
FFT-simulated transmission error vibration responses of healthy and faulty gear systems.
In Figure 10a, representing the healthy gear, the dominant peak occurs near the gear mesh frequency at approximately 120 Hz, with FFT amplitude levels reaching around 4.5 × 10⁻⁹. The spectral surface beyond this peak remains relatively flat, and the energy levels drop below 1 × 10⁻⁹, indicating stable meshing with minimal transmission error. In contrast, Figure 10b, representing the faulty gear with eccentricity, shows a much more complex response. Several additional peaks emerge, notably between 180–720 Hz and 960–1200 Hz, with FFT amplitude levels again approaching 4.8 × 10⁻⁹ but distributed across a wider frequency range. The increased ridges and spread of energy clearly reflect sideband formations and modulations caused by the added eccentric mass, emphasizing the disturbed gear meshing process.
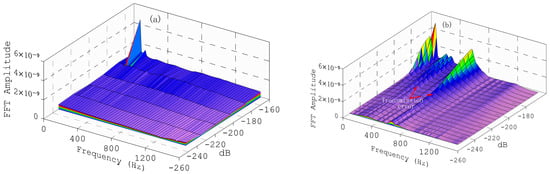
Figure 10.
3D FFT waterfall of healthy and faulty lateral vibration responses: (a) healthy gear; (b) gear transmission error. The colour gradient represents amplitude intensity, with cooler colours (blue to purple) corresponding to lower FFT amplitudes and warmer colours (green to yellow and red) highlighting peaks of higher vibration energy.
Both root mean square (RMS) and standard deviation (σ) are derived from squared signal quantities to capture complementary aspects of the vibration response. RMS is employed to provide a measure of the overall energy content of the signal, reflecting the effective amplitude of vibration. Standard deviation, in contrast, quantifies the extent to which the signal deviates from its mean, thereby highlighting the variability of the response. In fault diagnosis, RMS is particularly sensitive to increases in sustained vibration energy, whereas standard deviation is more responsive to fluctuations and irregularities in the signal. Table 3 presents the summary formulation of RMS and standard deviation along with their conceptualization in gear vibration analysis.
Table 3.
Statistical indicators for gear vibration analysis.
The statistical results shown in Figure 11a indicate that the faulty gear produces a standard deviation of nearly 1.3, whereas that of the healthy gear is limited to around 0.7. This nearly twofold increase demonstrates that the faulty gear produces greater fluctuations around the mean response, indicating irregular tooth meshing and dynamic instability associated with eccentricity. In Figure 11b, the RMS values also exhibit a clear separation. The faulty gear accounts for about two-thirds of the total vibration energy represented in the pie chart, compared to one-third for the healthy gear. The faulty gear not only generates greater sustained vibration energy, but also amplifies the irregularity of the response.
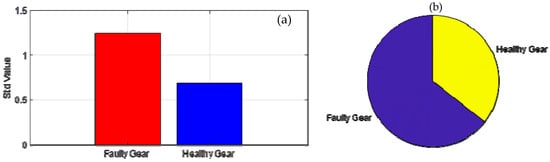
Figure 11.
Statistical characterization of gear vibration: (a) standard deviation, (b) RMS.
5. Physical Meaning of Results in Terms of System Dynamics
The numerical and experimental results presented in the study can be directly linked to the underlying physical mechanisms of spur gear dynamics. In the time domain responses (Figure 5), the nearly sinusoidal waveform observed in the healthy gear reflects uniform meshing between gear teeth. This indicates that torque transfer occurs smoothly, with minimal fluctuation in contact forces. The introduction of eccentricity alters the kinematic relationship between pinion and gear, leading to periodic modulation of the contact force. The resulting waveform distortion, characterized by alternating regions of high and low amplitude, reflects the cyclic loss and recovery of meshing uniformity caused by the misalignment. The frequency domain results (Figure 6) provide additional insight. The healthy gear condition is dominated by the gear mesh frequency and its harmonics, which is expected for a stable system where the primary excitation is periodic tooth engagement. The emergence of sidebands around the mesh frequency in the faulty gear indicates amplitude and phase modulation, a classic dynamic signature of periodic parametric excitation. Physically, these sidebands correspond to repeated stiffness variation in the mesh cycle caused by the eccentric mass, which perturbs the system at multiples of the rotational frequency. During the time–frequency analysis (Figure 8 and Figure 9), the Short-Time Fourier Transform reveals localized energy concentrations and broader spectral dispersion under fault conditions. This behavior represents transient bursts of vibration energy induced by uneven load transfer between teeth. Instead of being confined to discrete frequencies, the energy spreads over a range, reflecting the non-stationary nature of the excitation. Eccentricity introduces time-varying non-uniform stiffness, converting steady meshing into a sequence of transient excitations, which appear in the spectrogram as frequency smearing and increased bandwidth. The three-dimensional FFT waterfall plots (Figure 10) illustrate this difference in another way. For the healthy gear, energy is concentrated at the mesh frequency, confirming stable and predictable transmission. Eccentricity generates additional peaks and ridges across wide frequency bands, showing that gear motion departs from single-frequency behavior and enters multi-frequency excitation. The mechanism involves uneven torque transfer, where fluctuating stiffness channels energy into lateral–torsional vibrations, promoting wear and elevating noise levels.
6. Conclusions
The study presents a comprehensive approach for characterizing gear transmission error in single-stage spur gear systems through a coupled lateral–torsional nonlinear dynamic model integrated with a harmonic transmission error representation. Experimental investigations using controlled eccentricity validated the model and confirmed its ability to replicate fault-induced dynamic responses. STFT analysis provided deeper insights into transient spectral behavior, highlighting broadened frequency dispersions and localized energy concentrations that distinguish healthy from faulty conditions. With a fundamental frequency of 50 Hz, higher-order harmonics were detected in the presence of gear eccentricity faults through STFT analysis. Even-order harmonics were also observed, further confirming the existence of eccentricity-induced defects. The dual theoretical–experimental framework enhances diagnostic precision and advances understanding of the mechanisms governing gear vibration under defect progression. The findings can be applied in gear design to predict fault signatures before failures occur, supporting optimization of gear geometry and materials. STFT analysis can be applied within condition monitoring frameworks to identify faults at an early stage, thereby facilitating preventive maintenance and reducing machine stoppages. Future studies should extend the current framework by integrating controlled lubrication and temperature monitoring systems, enabling the investigation of thermo-tribological effects on transmission error and fault signatures. In addition, real-time monitoring and machine learning could also be incorporated for fault classification, with further application to multistage gear systems and the evaluation of sensitivity under variable speed and load conditions.
Author Contributions
This study was a collaborative effort between multiple individuals. Conceptualization, V.C.S., D.F.S., B.X.T. and A.A.A.; formal analysis, V.C.S. and D.F.S.; writing—original draft preparation, V.C.S. and D.F.S.; review and editing, V.C.S., D.F.S., B.X.T. and A.A.A.; supervision, B.X.T. and A.A.A. All authors have read and agreed to the published version of the manuscript.
Funding
No external funds were received for this research.
Data Availability Statement
The original contributions presented in this study are included in the article. Further inquiries can be directed to the corresponding author.
Acknowledgments
This study was conducted with partial support from the Vaal University of Technology’s Department of Industrial Engineering, Operations Management, and Mechanical Engineering.
Conflicts of Interest
No conflicts of interest have been disclosed by the authors.
Nomenclature
| Symbol | Definition |
| GTE | Gear Transmission Error |
| STE | Static Transmission Error |
| DTE | Dynamic Transmission Error |
| STFT | Short-Time Fourier Transform |
| M1, M2 | Translational masses of the pinion and gear shafts [kg] |
| Y1, Y2 | Lateral displacements of the pinion and gear shafts [m] |
| K1, K2 | Lateral stiffness of the bearings [N/m] |
| Ka, Kc | Torsional stiffness of input and output couplings [N·m/rad] |
| Kt | Gear mesh stiffness [N/m] |
| C1, C2 | Lateral damping coefficients of bearings [N·s/m] |
| Ca, Cc | Torsional damping coefficients of couplings [N·m·s/rad] |
| e(t) | Transmission error function [m] |
| e₀ | Static transmission error [m] |
| eₙ | Amplitude of nth harmonic component of transmission error [m] |
| ωₘ | Excitation frequency [rad/s] |
| ϕn | Phase of nth harmonic component [rad] |
| θ1 | Angular displacement of the input shaft or pinion [rad] |
| θ2 | Angular displacement of the output shaft or driven gear [rad] |
| θL | Angular displacement of the load side [rad] |
| θm | Angular displacement of the motor side [rad] |
| Tm | Motor input torque [N·m] |
| TL | Load torque [N·m] |
| R1, R2 | Base circle radius of the pinion and gear shafts [m] |
| I | Area moment of inertia of the gear tooth cross-section [m4] |
| M | Bending moment distribution along the gear tooth [Nm] |
| P | Applied load along the line of action [N] |
| x | Coordinate along the tooth length |
| E | Young’s modulus of gear material [GPa] |
| ν | Poisson’s ratio of gear material [-] |
| Z | Number of teeth (pinion or gear) [-] |
References
- Horváth, K.; Feszty, D. The Impact of Pitch Error on the Dynamics and Transmission Error of Gear Drives. Appl. Sci. 2025, 15, 7851. [Google Scholar] [CrossRef]
- Sigonde, V.C.; Koueiou, X.T.; Alugongo, A.A. Enhancing fault diagnosis of gear transmission error based on experimental analysis. In Proceedings of the 2022 IEEE 13th International Conference on Mechanical and Intelligent Manufacturing Technologies (ICMIMT), Cape Town, South Africa, 25–27 May 2022; IEEE: Piscataway, NJ, USA, 2022; pp. 135–140. [Google Scholar]
- Li, J.; Zhao, H.; Ren, Y.; Yang, J. Calculation of Time-Varying Mesh Stiffness of Internal Mesh Transmission and Analysis of Influencing Factors. Appl. Sci. 2025, 15, 4599. [Google Scholar] [CrossRef]
- Masmoudi, W.; Wojtowicki, J.L.; Petrone, G.; Franco, F.; De Rosa, S. Evaluating lightweight gear transmission error: A novel nonlinear finite element approach using direct constraint contact algorithm. Front. Mech. Eng. 2023, 9, 1228696. [Google Scholar] [CrossRef]
- Liu, Y.; Chen, Z.; Wang, K.; Zhai, W. Dynamic characteristics analysis of gear transmission and its support bearings of high-speed train on the curve. Veh. Syst. Dyn. 2024, 62, 623–650. [Google Scholar] [CrossRef]
- Ding, J.; Jin, G. Modeling and dynamic analysis of split torsion transmission system considering backlash and center distance errors. Sci. Rep. 2025, 15, 1229. [Google Scholar] [CrossRef] [PubMed]
- Sheng, D.; Lu, F. Dynamic Behavior and Double-Parameter Self-Adaptive Stability Control of a Gear Transmission System. Int. J. Bifurc. Chaos 2023, 33, 2350055. [Google Scholar] [CrossRef]
- Liu, S.; Hu, A.; Zhang, Y.; Xiang, L. Nonlinear dynamics analysis of a multistage planetary gear transmission system. Int. J. Bifurc. Chaos 2022, 32, 2250096. [Google Scholar] [CrossRef]
- Wang, M.; Ma, X.; Hu, Y.; Wang, Y. Gear fault diagnosis based on variational modal decomposition and wide+ narrow visual field neural networks. IEEE Trans. Autom. Sci. Eng. 2021, 19, 3288–3299. [Google Scholar] [CrossRef]
- Gao, Y.; Liu, X.; Xiang, J. Fault detection in gears using fault samples enlarged by a combination of numerical simulation and a generative adversarial network. IEEE/ASME Trans. Mechatron. 2021, 27, 3798–3805. [Google Scholar] [CrossRef]
- Zhang, J.; Wang, J.; Li, X.; Yao, L.; Liu, X. Lateral-Torsional-Coupled Model Based Dynamic Analyses of Spur Gears Under Time-Varying External Load Conditions with Surface Wear. In Dynamics and Fault Diagnosis of Nonlinear Rotors and Impellers; Springer International Publishing: Cham, Switzerland, 2022; pp. 107–133. [Google Scholar]
- Xie, S.; Du, Q.; Hu, Y. Nonlinear dynamics of spur gear systems with time-varying misalignment errors. J. Vib. Control 2024, 30, 3997–4009. [Google Scholar] [CrossRef]
- Happi, K.H.Y.; Kouejou, B.X.T.; Alugongo, A.A. Pitting and Crack Coexistence in a Model-Based Gear Dynamic System (Part I). In Proceedings of the 2022 IEEE 13th International Conference on Mechanical and Intelligent Manufacturing Technologies (ICMIMT), Cape Town, South Africa, 25–27 May 2022; IEEE: Piscataway, NJ, USA, 2022; pp. 120–126. [Google Scholar]
- Stefani, F.A.; Niccolini Marmont Du Haut Champ, C.A.; Silvestri, P.; Massardo, A.F. Experimental and Numerical Analysis of Torsional—Lateral Vibrations in Drive Lines Supported by Hydrodynamic Journal Bearings. Lubricants 2024, 12, 82. [Google Scholar] [CrossRef]
- Jin, B.; Bian, Y.; Liu, X.; Gao, Z. Dynamic modeling and nonlinear analysis of a spur gear system considering a nonuniformly distributed meshing force. Appl. Sci. 2022, 12, 12270. [Google Scholar] [CrossRef]
- Majeed, R.; Haddar, M.; Chaari, F.; Haddar, M. A wavelet-based statistical control chart approach for monitoring and detection of spur gear system faults. In Proceedings of the International Conference on Acoustics and Vibration, Sousse, Tunisia, 19–21 December 2022; Springer International Publishing: Cham, Switzerland, 2022; pp. 140–152. [Google Scholar]
- Raghav, M.S.; Patel, S. Fault diagnosis of spur gearbox by image classification using deep CNN. In Proceedings of the 2024 1st International Conference on Robotics, Engineering, Science, and Technology (RESTCON), Chonburi, Thailand, 16–18 February 2024; IEEE: Piscataway, NJ, USA, 2024; pp. 201–206. [Google Scholar]
- Hashim, S.; Shakya, P. A spectral kurtosis based blind deconvolution approach for spur gear fault diagnosis. ISA Trans. 2023, 142, 492–500. [Google Scholar] [CrossRef]
- Cao, P.; Li, Q.; Feng, K.; Qin, Y. Dynamic modeling of spur gear transmission system with evolutive coupling fault of fatigue crack and wear. Eng. Fail. Anal. 2024, 156, 107820. [Google Scholar] [CrossRef]
- Xiong, Y.; Huang, K.; Xu, F.; Yi, Y.; Sang, M.; Zhai, H. Research on the influence of backlash on mesh stiffness and the nonlinear dynamics of spur gears. Appl. Sci. 2019, 9, 1029. [Google Scholar] [CrossRef]
- Ren, F.; Wang, D.; Shi, G.; Wu, X. Investigation on dynamic characteristics of spur gear transmission system with crack fault. Machines 2022, 10, 664. [Google Scholar] [CrossRef]
- Maraş, S.; Arslan, H.; Birgören, B. Detection of gear wear and faults in spur gear systems using statistical parameters and univariate statistical process control charts. Arab. J. Sci. Eng. 2021, 46, 12221–12234. [Google Scholar] [CrossRef]
- Happi, K.H.Y.; Kouejou, B.X.T.; Alugongo, A.A. Influence of Coexistence of Pitting and Cracking Faults on a Two-Stage Spur Gear System. Vibration 2023, 6, 195–217. [Google Scholar] [CrossRef]
- Cheng, Z.; Huang, K.; Xiong, Y.; Sang, M. Dynamic analysis of a high-contact-ratio spur gear system with localized spalling and experimental validation. Machines 2022, 10, 154. [Google Scholar] [CrossRef]
- Zhang, Q.; Deng, L. An intelligent fault diagnosis method of rolling bearings based on short-time Fourier transform and convolutional neural network. J. Fail. Anal. Prev. 2023, 23, 795–811. [Google Scholar] [CrossRef]


Disclaimer/Publisher’s Note: The statements, opinions and data contained in all publications are solely those of the individual author(s) and contributor(s) and not of MDPI and/or the editor(s). MDPI and/or the editor(s) disclaim responsibility for any injury to people or property resulting from any ideas, methods, instructions or products referred to in the content. |
© 2025 by the authors. Licensee MDPI, Basel, Switzerland. This article is an open access article distributed under the terms and conditions of the Creative Commons Attribution (CC BY) license (https://creativecommons.org/licenses/by/4.0/).