Article

The Use of Gas Dynamics to Estimate the Influence of Flanges on Gear Windage Power Loss

1
LabECAM, ECAM LaSalle, 69005 Lyon, France
2
INSA Lyon, CNRS, LaMCoS, UMR 5259, 69621 Villeurbanne, France
*
Author to whom correspondence should be addressed.
Dynamics 2025, 5(3), 33; https://doi.org/10.3390/dynamics5030033 (registering DOI)
Submission received: 3 July 2025 / Revised: 12 August 2025 / Accepted: 12 August 2025 / Published: 14 August 2025

Abstract

This study aims to develop a new model for windage losses, building upon existing formulation, complemented by dedicated experimental campaigns and a specific methodology designed to isolate and quantify windage losses. The model relies on an analytical approach to flow characterization, incorporating a correction factor accounting for air density reduction. The experimental investigation was carried out on a dedicated test bench and includes both spur and helical gears. The results demonstrate good agreement between the proposed model and the experimental data, with and without the presence of nearby obstacles, such as side flanges, highlighting the model’s robustness across different configurations. The proposed windage loss model reproduces the experimental results with significantly greater accuracy than the original one, yielding relative deviations below 5% compared to almost 20% for spur gears, and below 9% compared to over 21%, and in some cases up to 50%, for helical gears.

1. Introduction

Recent works highlight the need for improving gear materials and surface engineering to withstand ever-increasing operational demands. For instance, a comprehensive evaluation of Diamond-Like Carbon (DLC) coatings on gears has demonstrated significant enhancements in surface properties, including morphology, hardness gradient, residual stress, and microstructure, resulting in an increase in gear contact fatigue limits by about 200 MPa and a scuffing limit temperature rise of 124 °C [1]. Similarly, the development and application of high-strength gears, crucial for advanced systems, such as deep-sea submarines, aircraft engines, aerospace vehicles, nuclear power plants, and high-speed trains, are driven by the growing requirements for load-carrying capacity and service life. These needs emphasize the technical challenges in design, manufacturing, and performance evaluation, and outline research progress in anti-fatigue design, manufacturing processes, and service performance assessment [2]. In addition to these research topics on gear performance, power losses are a key factor limiting energy efficiency, particularly in high-speed geared transmissions. Among the different sources of dissipation, windage losses, generated by the interaction between rotating gears and the surrounding fluid medium, can become predominant at high rotational speeds. Unlike churning losses, which are due to direct interaction with oil, windage losses are primarily aerodynamic and occur when gears rotate in air or in an air/oil mixture. This phenomenon results in a resistive torque due to the fluid being moved and accelerated by the rotating components, leading to a power drain that scales with rotational speed.
This source of dissipation is part of no-load-related losses, especially those associated with oil mixing and pumping. These oil-related losses often constitute the largest fraction of the overall power loss balance in gear transmissions. Detailed studies provide valuable quantitative insights into this subject. Michaelis et al. [3] analyzed the influence of various factors on total gearbox losses, experimentally quantifying the significant impact of oil churning and pumping on efficiency and providing a breakdown of losses between aerodynamic effects, oil mixing, and sealing losses. Similarly, Hildebrand et al. [4] employed advanced CFDs (Computational Fluid Dynamics) [5] simulations to investigate the oil flow inside gearboxes with guiding plates, elucidating the mechanisms of oil-induced losses and presenting comparative percentages of aerodynamic versus oil-related losses under different operating conditions. Additionally, Mauz [6] conducted experimental and modeling studies focused on lubricant effects, demonstrating through measured data that oil mixing and pumping dominate over aerodynamic and mechanical losses, and offering detailed loss distribution analyses crucial for understanding gearbox power dissipation. These works underscore the importance of accounting for oil-induced losses alongside aerodynamic windage when evaluating and modeling power losses in high-speed gear systems.
Windage losses are considered in the case of oil jet lubrication and have been quantified both experimentally and through numerical simulations. In aerospace gearboxes, they can become predominant for pitch-line velocities exceeding 100 m/s. Most studies focus on rotating disks in unconfined fluids, including foundational works by Von Karman [7], Schlichting [8], Daily and Nece [9], and Mann and Marston [10]. Studies, such as those conducted by Handschuh and Kilmain [11], have demonstrated that under high-speed conditions, windage losses can be as significant as gear meshing losses, particularly when using helical gears. Similarly, investigations by Diab [12] showed that windage losses can increase by more than 40% at high rotational speeds, underlining the strong sensitivity of this phenomenon to operating conditions.
Hill [13] and Marchesse [14] showed that, for a spur gear, the fluid is drawn axially through the tooth gaps and expelled radially due to centrifugal forces (Figure 1).
In this context, Dai et al. [15] introduced a simulation methodology based on the Lattice Boltzmann Method (LBM) to investigate windage losses of a shrouded high-speed spur gear, assessing the effects of radial and axial clearance between the gear and its casing. Their results, validated against experiments, led to an improved predictive formulation incorporating air compressibility effects at high Mach numbers, which is particularly relevant for preliminary design stages with tight confinement. Complementarily, Huang et al. [16] proposed a negative pressure regulation method to reduce windage power loss in high-speed gearboxes, combining CFD analysis with a BP neural network optimized by a genetic algorithm to predict optimal parameters for loss reduction, showing good agreement with finite element simulations and open literature data.
Winfree [17] demonstrated the significance of this flow by showing that sealing the tooth ends can reduce losses by up to 78%. Based on these analyses, Marchesse et al. [14] developed a simplified formulation for windage losses by modeling the momentum exchange induced by the projected flow through the teeth, following the same physical approach as Diab. For helical gears, a unilateral air suction mechanism can be observed: the airflow is drawn in on side 1 (suction side), as driven by the gear rotation and the helix angle direction (Figure 2), a behavior that can be visualized using smoke injection techniques, and also reported by Voeltzel et al. [18] and Diab [12].
These losses arise from two main mechanisms: viscous drag on the gear faces and pressure drag across the gear teeth. The former can be modeled analogously to rotating disk flows, as described in early works by von Kármán [8] and later refined by Goldstein [19], while the latter involves complex three-dimensional flow interactions within the inter-tooth regions. The pressure drag contribution is typically high, especially in turbulent regimes, and the power associated with this drag scales with the cube of the tangential velocity.
To mitigate such losses, various passive design strategies can be implemented. Flanges, which are rotating or stationary plates positioned close to the gear side faces, have been shown to reduce the axial suction of air induced by the gear rotation. By obstructing part of the incoming air, flanges reduce the volume of air that is set into motion, and, therefore, the associated windage losses. Studies including Winfree [17], as well as others [12,20], have demonstrated that this approach can lead to significant reductions in windage losses, particularly at high rotational speeds. However, none of these studies proposes an analytical formulation based on flow theory to quantify this reduction.
In the original model, an empirical reduction factor derived from dimensional analysis was included; however, as will be shown in the following sections, it does not accurately capture all configurations.
Diab’s model provided the best correlation with experimental results [12] among five different tested gear configurations, four spur gears and one helical gear. In comparison, Townsend [21] underestimates the losses and does not account for the variation in gear module in his equation. Anderson and Loewenthal [22] also underestimate certain test series, with relative errors reaching up to 50%, while Dawson’s model [20] tends to overestimate ventilating losses. Therefore, Diab’s model will be used as the reference in the remainder of this study, as it also incorporates the influence of nearby obstacles.
To address these challenges, this study proposes a new windage loss model that builds upon the foundational work of Diab [12]. The model is supported by experimental campaigns conducted on a dedicated test rig, designed specifically to isolate windage losses.
After an initial section presenting the windage test bench and the experimental results obtained, a new physical formulation is established. This formulation is then evaluated through direct comparison with the measurements. The approach allows the influence of geometric confinement and other test parameters to be explicitly assessed, providing a solid basis for predicting windage losses in high-speed gear transmissions.

2. Test Bench and Experimental Results

2.1. Test Bench and Test Sample

A test bench dedicated to investigating no-load dependent power loss windage associated with gear rotation at LabECAM was used [23]. It makes it possible to characterize the effects of wall proximity on the gear.
Two gears made of aluminum 2017 A (AU4G) are used in this study, with their geometrical parameters listed in Table 1. These include a standardized spur gear and helical gear.
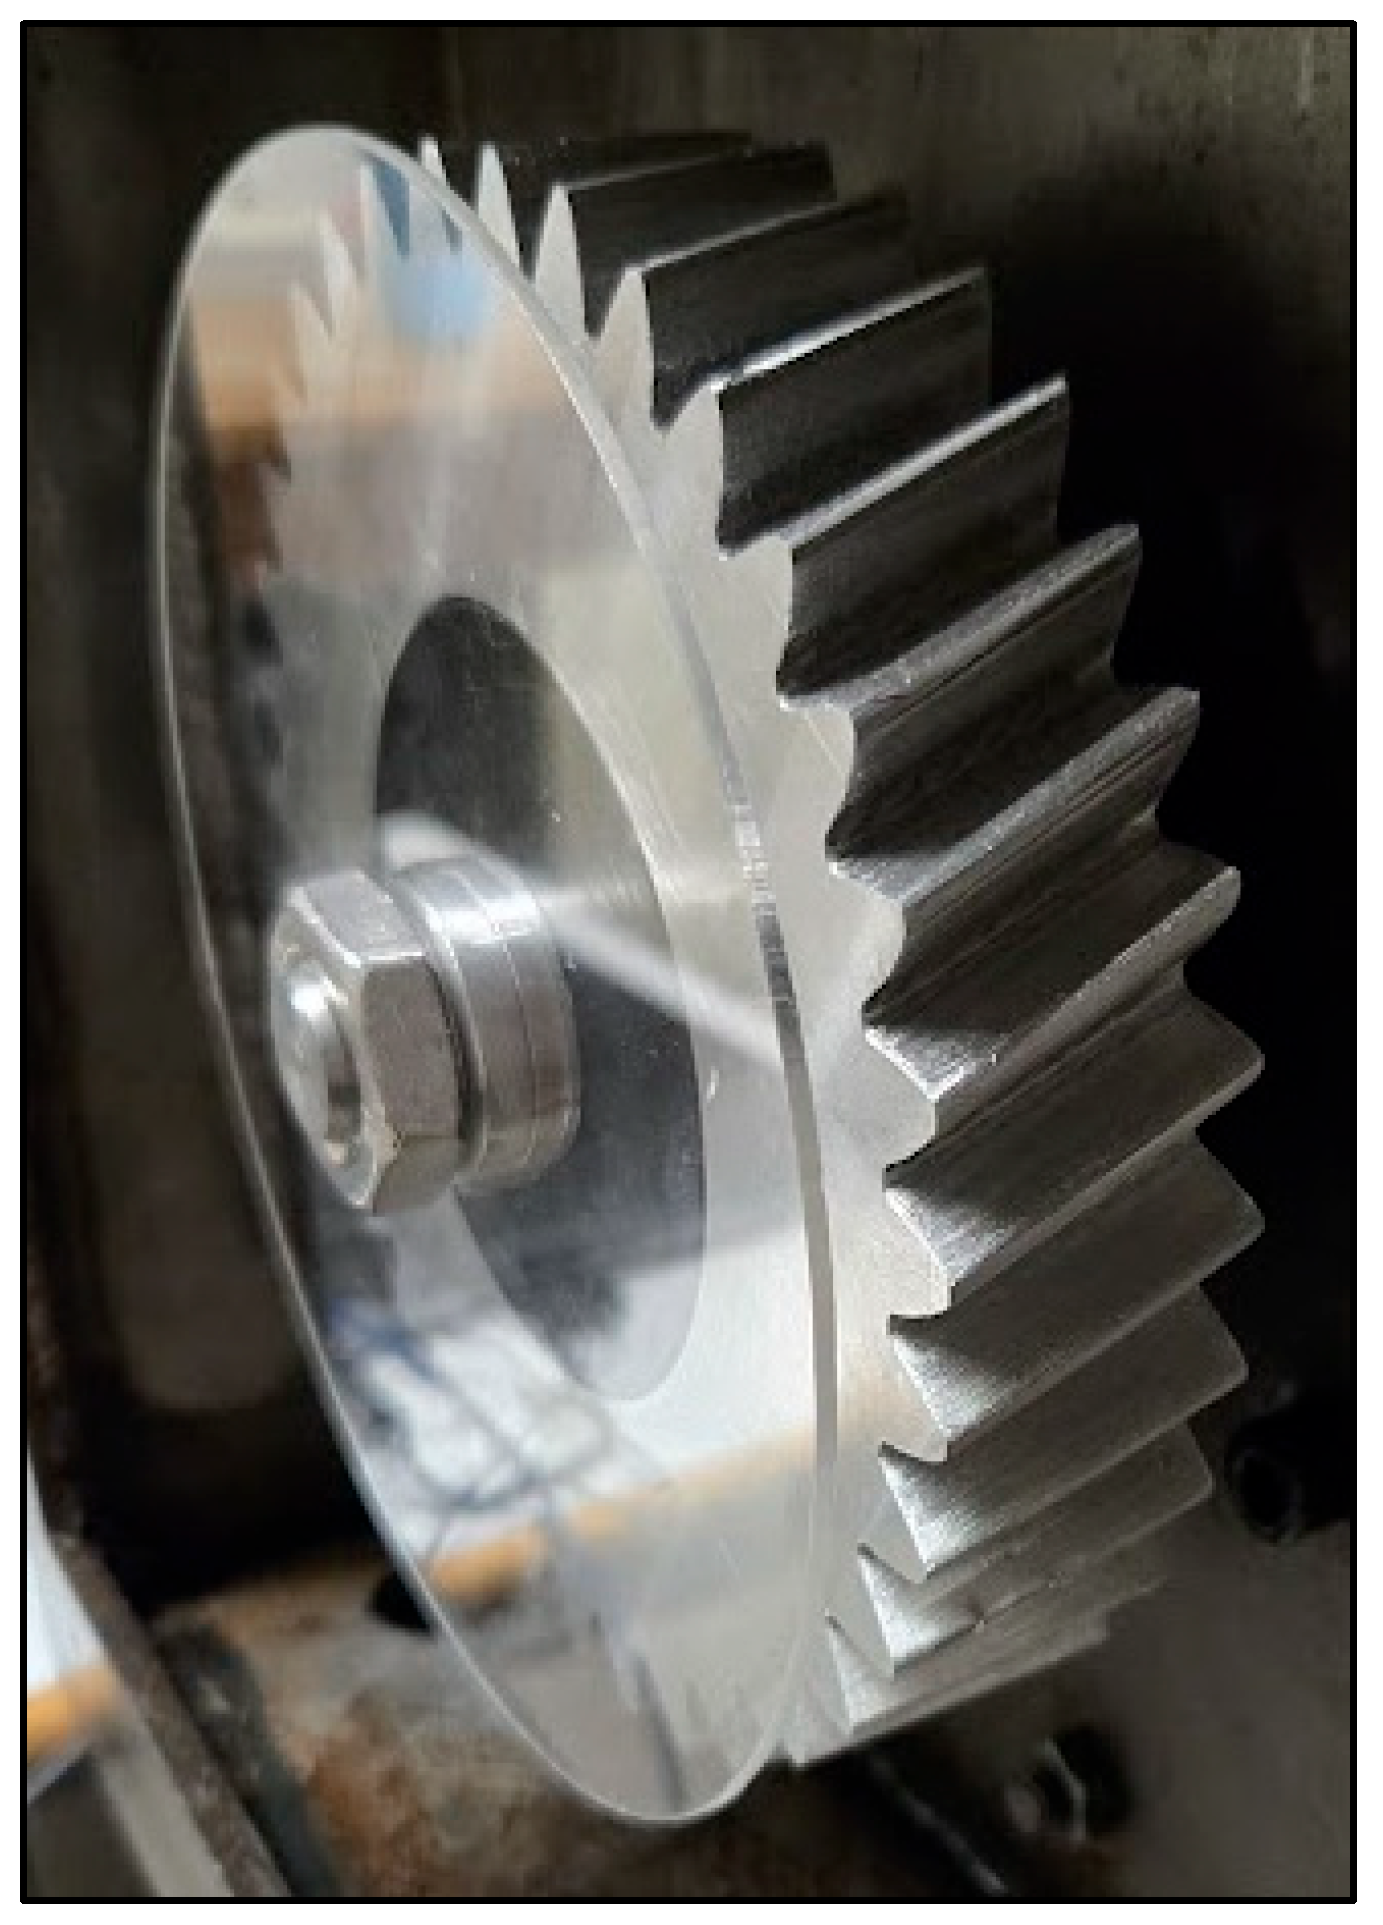
Flanges are mounted on the shaft near the gear during several tests to investigate more precisely the influence of wall proximity on gear performance. These flanges are thin Plexiglas (PMMA) discs with a diameter matching the gear tip diameter (Figure 3).
The windage test bench consists of an electric motor that drives a rotating shaft via a belt (Figure 4). With this setup, the rig can reach a rotational speed of up to 6000 rpm at the output of the driven shaft. Two shafts, each supported by a bearing housing equipped with deep-groove ball bearings (grease-lubricated), transmit motion from the belt to the test gear inside the housing. To measure the air windage losses on the gear, a non-contact dynamic torque meter (DRVL-Ib-2) is installed between the two shafts using flexible couplings. It has a measurement range of 0–2 Nm with an accuracy of ±0.002 Nm, corresponding to a torque measurement uncertainty of 1.25 W or 0.1% at 6000 rpm. Speed control is achieved via a frequency inverter. The housing is a parallelepiped box measuring 400 mm × 265 mm × 100 mm, with a front access door for test preparation and maintenance, equipped with a transparent plexiglass (PMMA) panel that allows observation of the test gear (Figure 5).
The tested gear is mounted on a shaft within the housing. It is axially positioned using spacers on the shaft, allowing adjustment of the distance between the gear flanks and the two housing walls, as illustrated in Figure 6. The distance between the first wall, corresponding to the front cover of the housing, and the first gear flank is denoted as j 1 , while the distance between the second flank and the rear end of the housing, corresponding to the second wall, is referred to as j 2 . Experiments are conducted for a gear rotating in pure air. Additionally, the air temperature inside the housing is measured using a type K thermocouple.

2.2. Experimental Approach

2.2.1. Torque Measurement

Each test consists of multiple speed steps for a given configuration to measure the corresponding torque at each speed. Figure 7 highlights the torque measurement from a test example with spur gear teeth. In this test, three speeds are investigated: 0, 500, and 1000 rpm. Each speed level lasts approximately 300 s in this test example, which is sufficient to account for the torque peaks caused by the speed increase. Indeed, Niel [23] shows that a significant increase in torque is observed during speed ramp-up, attributed to phenomena, such as aerodynamic drag forces on the rolling elements and changes in the internal bearing kinematics due to centrifugal forces. This torque spike also results from grease shearing and heating in the bearings at speed changes, temporarily increasing friction before stabilizing [4,7,24]. It raises the question of how these windage losses should be properly accounted for. For all the series presented later, each speed level lasts 5 min, and the last 4 min are used to calculate the average value, which represents the torque value for each rotational speed.
The torque meter used has a measurement range of 0 to 2 Nm with a voltage output from 0 to 10 V, corresponding to a sensitivity of 0.2 V/Nm.

2.2.2. Windage Losses Determination

To obtain windage loss curves P g e a r as a function of rotational speed from a series of tests on spur gear, the power loss can be calculated. The conversion from torque to power loss is [25]:
P t o t a l = C ω
with,
  • P t o t a l : Power loss of the shaft and gear assembly [W].
  • C : Torque of the shaft line and gear assembly [Nm].
  • ω : Rotational speed [rad/s].
To isolate the gear-related losses, this value must be corrected by subtracting the reference measurement taken at the same rotational speed without the gear, which accounts for losses from the bearing housings and the connecting shaft, using the following equation:
P g e a r = P t o t a l P s h a f t
with,
  • P g e a r : Windage loss of the gear [W].
  • P s h a f t : Power loss of the shaft line [W].
The dependence of windage losses on temperature has been accounted for by monitoring the internal air temperature within the housing, ensuring that all tests are conducted at similar thermal conditions to avoid variations in losses due to temperature changes.

2.2.3. Repeatability

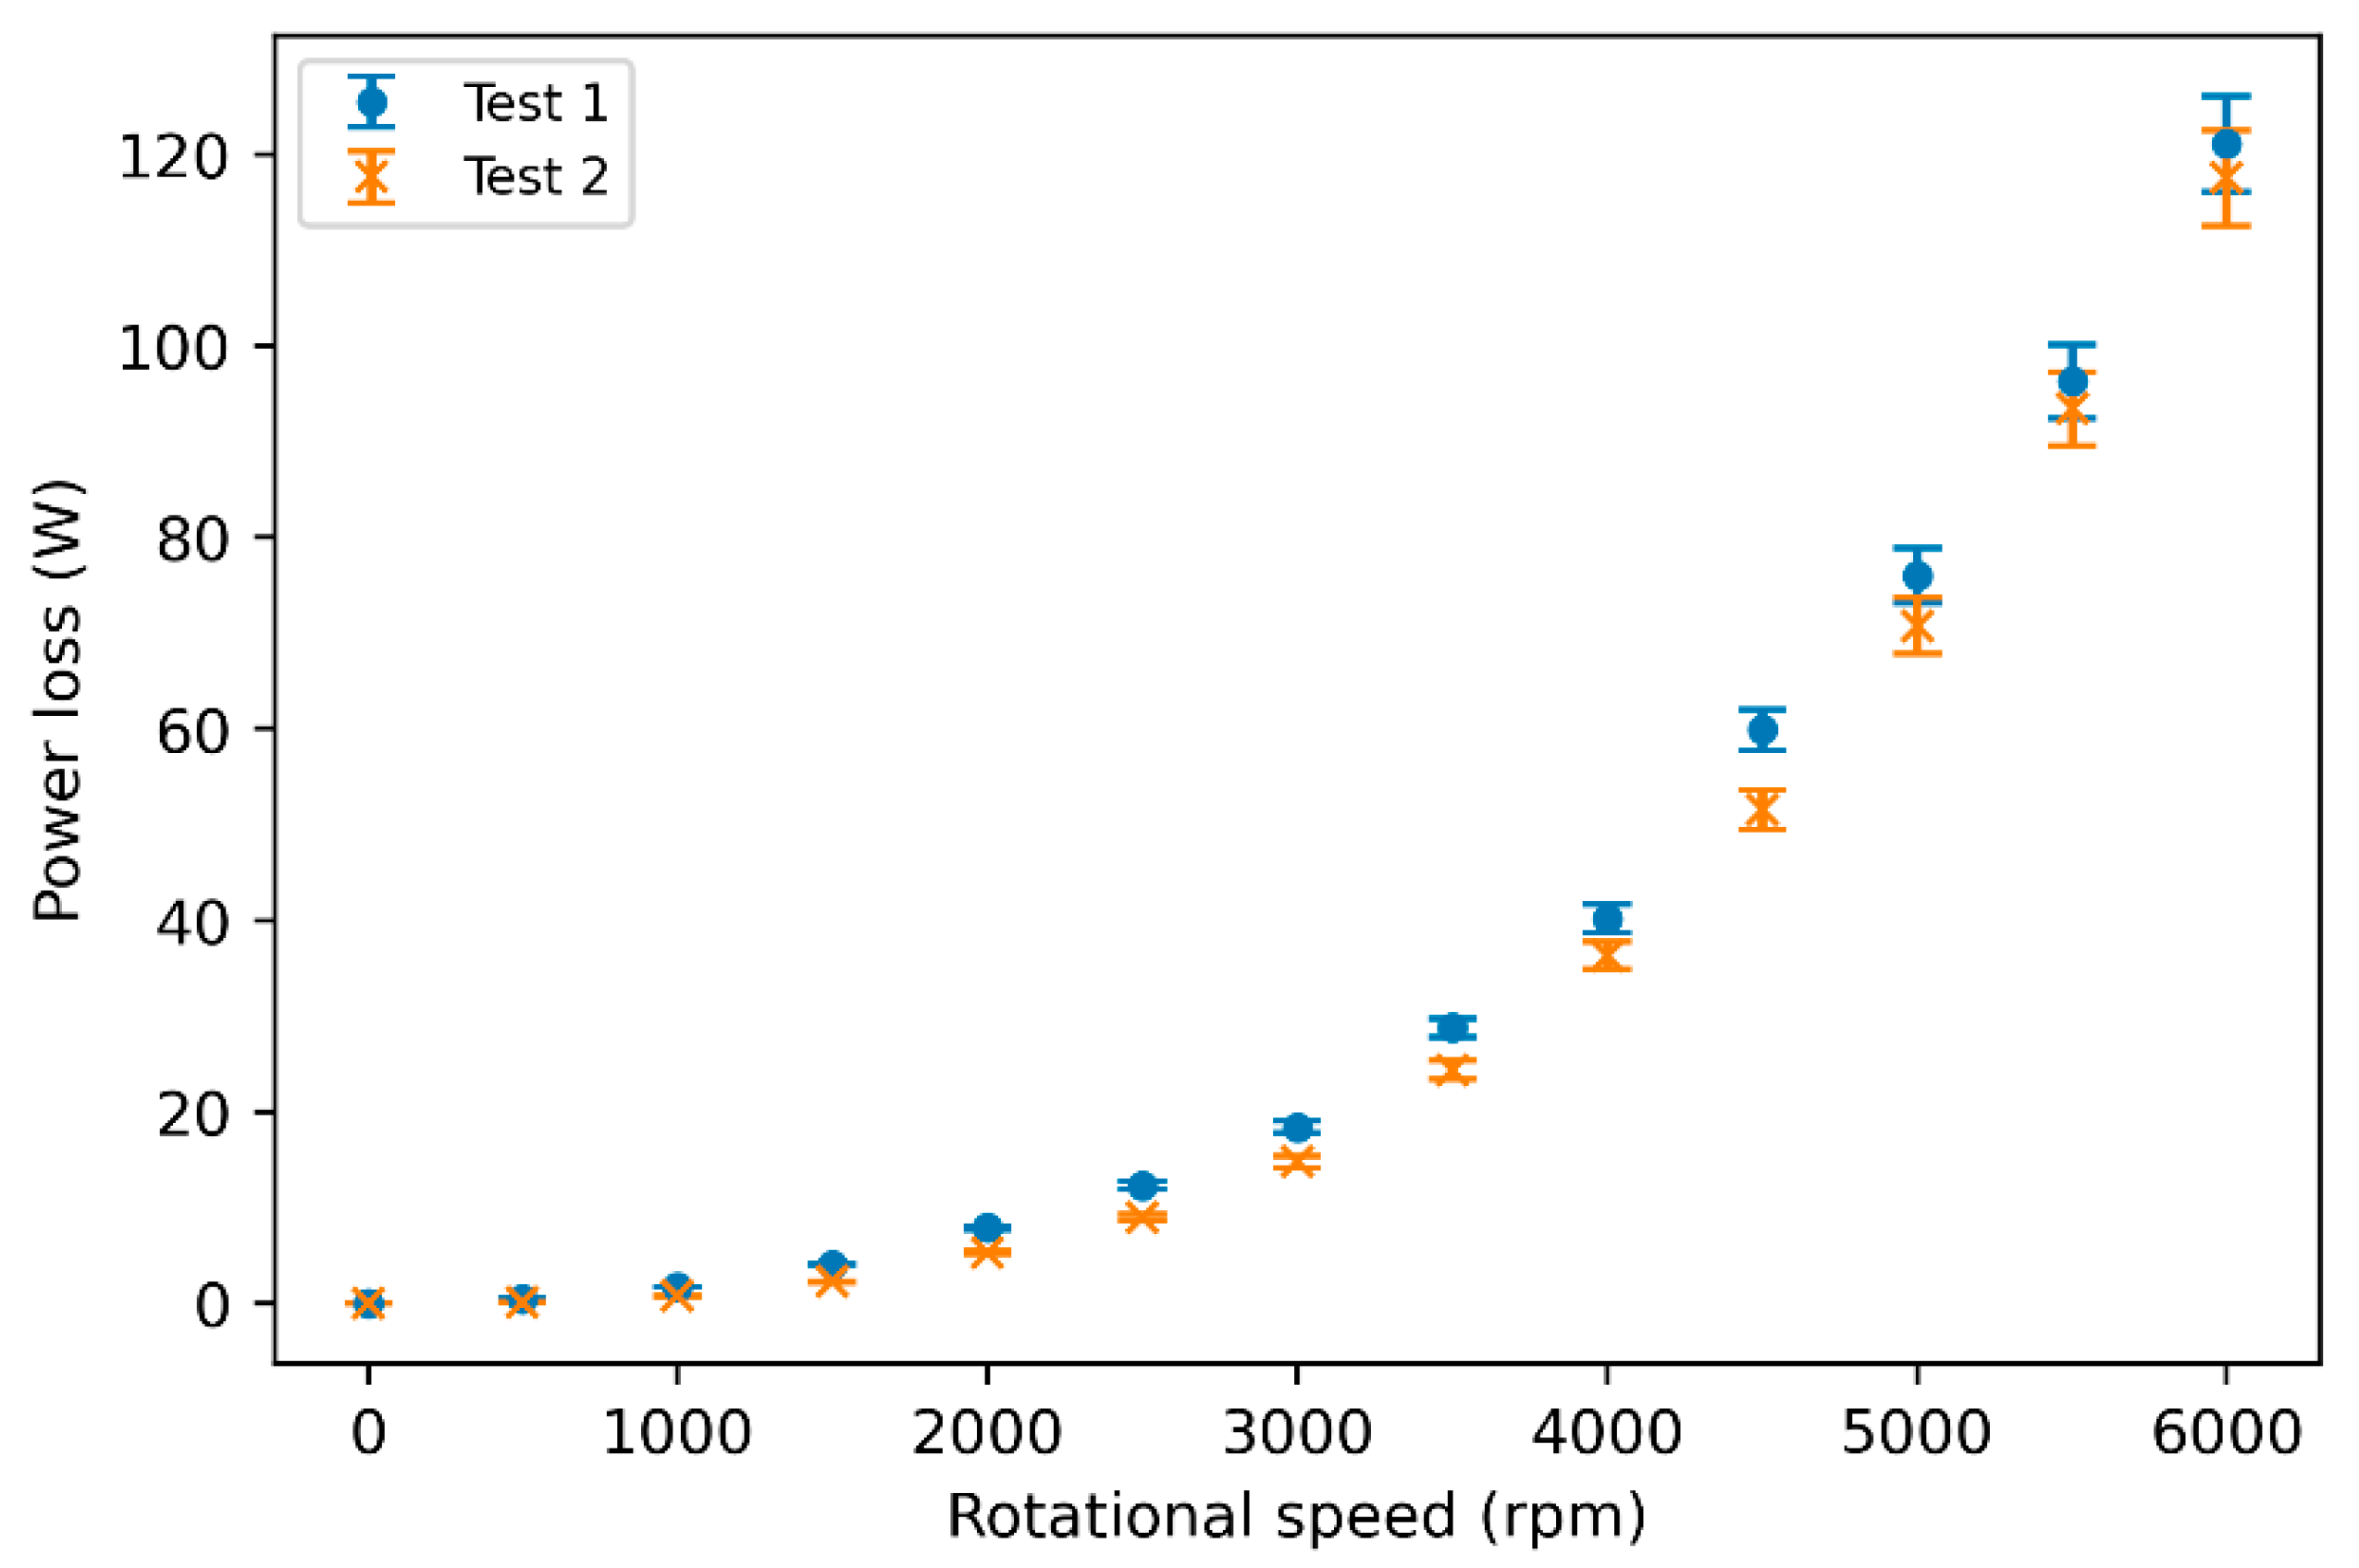
Repeatability tests with the same gearwheel position relative to the housing are shown in Figure 8. The average relative variation due to test repeatability from 3000 to 6000 rpm is 8.6%. As speed increases, this relative variation decreases, reaching only 3% at 6000 rpm. Measurement uncertainty can also be seen in Figure 8 in the form of an error bar, taking into account not only the torquemeter uncertainty of ±0.002 Nm of full scale, but also all the uncertainties associated with testing and post-processing. At 6000 rpm, this total uncertainty corresponds to around 5 W.
Gear windage loss in pure air is represented as a function of rotational speed. At low speeds, it remains minimal: 0.7 W at 1000 rpm. Its evolution follows a classic trend, varying with the cube of the rotational speed [12,20]. Thus, at 6000 rpm, it reaches 121 W and can become dominant compared to other system losses, as discussed in the introduction.

2.3. Experimental Results and Analysis of the Relevance of Diab’s Model

The tests conducted on the windage test bench for this study are labeled as “Tooth type– j 1 / j 2 –Ejection direction,” which takes into account the type of gear (Spur, helical), the distances between the walls and the gear teeth ( j 1 , j 2 ), and the direction of air ejection (Dir 1,2) according to the helix angle in the clockwise rotation direction. An example is shown in Figure 9 for the test series Helical–Inf/35–Dir 2, where Inf refers to a housing without a front door and thus, without an obstacle on that side. One wall is positioned at a distance j 2 of 35 mm in direction 2, and the air ejected by the helical gear moves in direction 2, perpendicular to the tooth flank [18].

2.3.1. Gears Without Obstacles

The tests conducted on the windage test bench in air only allow for the characterization of windage losses for each gear studied. In all the following figures, the windage losses correspond solely to the losses of the gear, with the losses related to the shaft and bearing housing already subtracted, as above-mentioned.
In Figure 10, the spur gear and the helical gear are tested every 500 rpm from 0 to 6000 rpm, with configurations of 38/38 for the spur gear and 35/35–Dir 2 for the helical gear. These losses correspond to the energy dissipated in the form of fluid friction and turbulence in the air as the gear rotates. There is a cubic growth in losses with rotational speed, which is consistent with the behavior of aerodynamic losses and, in this case, with windage losses (air), also confirmed by the work of Townsend [21].
The helical gear generates a more complex airflow than the spur gear, due to its helix angle and the distance between the gear teeth and the walls (spur gear with suction on both sides and ejection perpendicular to the tooth flank, helical gear with suction on one side and air ejection perpendicular to the tooth flank but oriented centrifugally according to the helix angle). Despite the helical gear having a greater width compared to the spur gear, 30 mm versus 24 mm, the windage losses are similar [11,18,21]. Indeed, the helix angle modifies the airflow around the gear, altering the aerodynamics and thereby influencing the resulting windage losses.
By applying Diab’s model [12], (visible in Appendix A: Diab model) to the test series “Spur–Inf/38” and “Helical–Inf/35–Dir 2”, i.e., two test series where the influence of nearby obstacles is very low; Figure 10 highlights that Diab’s model aligns with the trend and test values, with a relative error of 1.2% at 6000 rpm for the test on the spur gear. Diab’s model provides a detailed approach with a laminar–turbulent transition, which allows for a more accurate and faithful modeling of the free helical gear (without obstacles).
This series of tests highlights that for the 24 mm wide spur gear and the 30 mm wide helical gear, the presence of the flange no longer influences the windage losses at distances of 38 mm and 35 mm, respectively.

2.3.2. Walls and Flanges

The study of the influence of nearby elements on the gears will be conducted both by using the walls of the casing of the windage test bench and by using flanges, as shown in Figure 11.
Spur Gear
Figure 11 shows the test series “Spur–0/0” with a flange against both flanks of the gear.
To specifically characterize the impact of a flange on the losses, Table 2 and Figure 12 highlight the variation in distance j1 while keeping all other geometric parameters constant.
The loss values for these test series on spur gear are consistent with previous observations. When the flange is placed at j 1 = 0 mm, the power loss at 6000 rpm is reduced by 13.4% compared to when the flange is positioned at j 1 = 5 mm. Losses continue to increase with larger j 1 distances, showing a relative difference of 6.2% between the 5/25 and 10/25 series, and 9.5% between the 10/25 and 15/25 series. The windage loss for the 15/25 test series reaches the same value as the Inf/30 series, which may indicate a threshold beyond which the flange no longer influences losses for this spur gear.
The presence of an obstacle or flange comes from Diab’s first approach with dimensional analysis [12]. To determine the reduction factor associated with deflectors ξ d = ξ d 1 + ξ d 2 with ξ d 1,2 = h 1,2 r p 0.56 whether a flange is present, and ξ d 1,2 = 0.5 otherwise. For the presence of an obstacle, h 1,2 = H e j 1,2 2 + r t R d 1,2 2 .
  • with,
  • j 1,2 : Distance between gear faces and obstacles [m].
  • r t : Gear head radius [m].
  • R d 1,2 : Obstacle radius [m].
H e , Heaviside function defined by the following:
  • H e = 1 if r t R d 1,2 < 0 .
  • H e = 0 otherwise.
The inclusion of flanges and deflectors in Diab’s model does not cover all possible configurations. The proximity effects of nearby walls are simplified, limiting the model’s accuracy in the presence of surrounding obstacles.
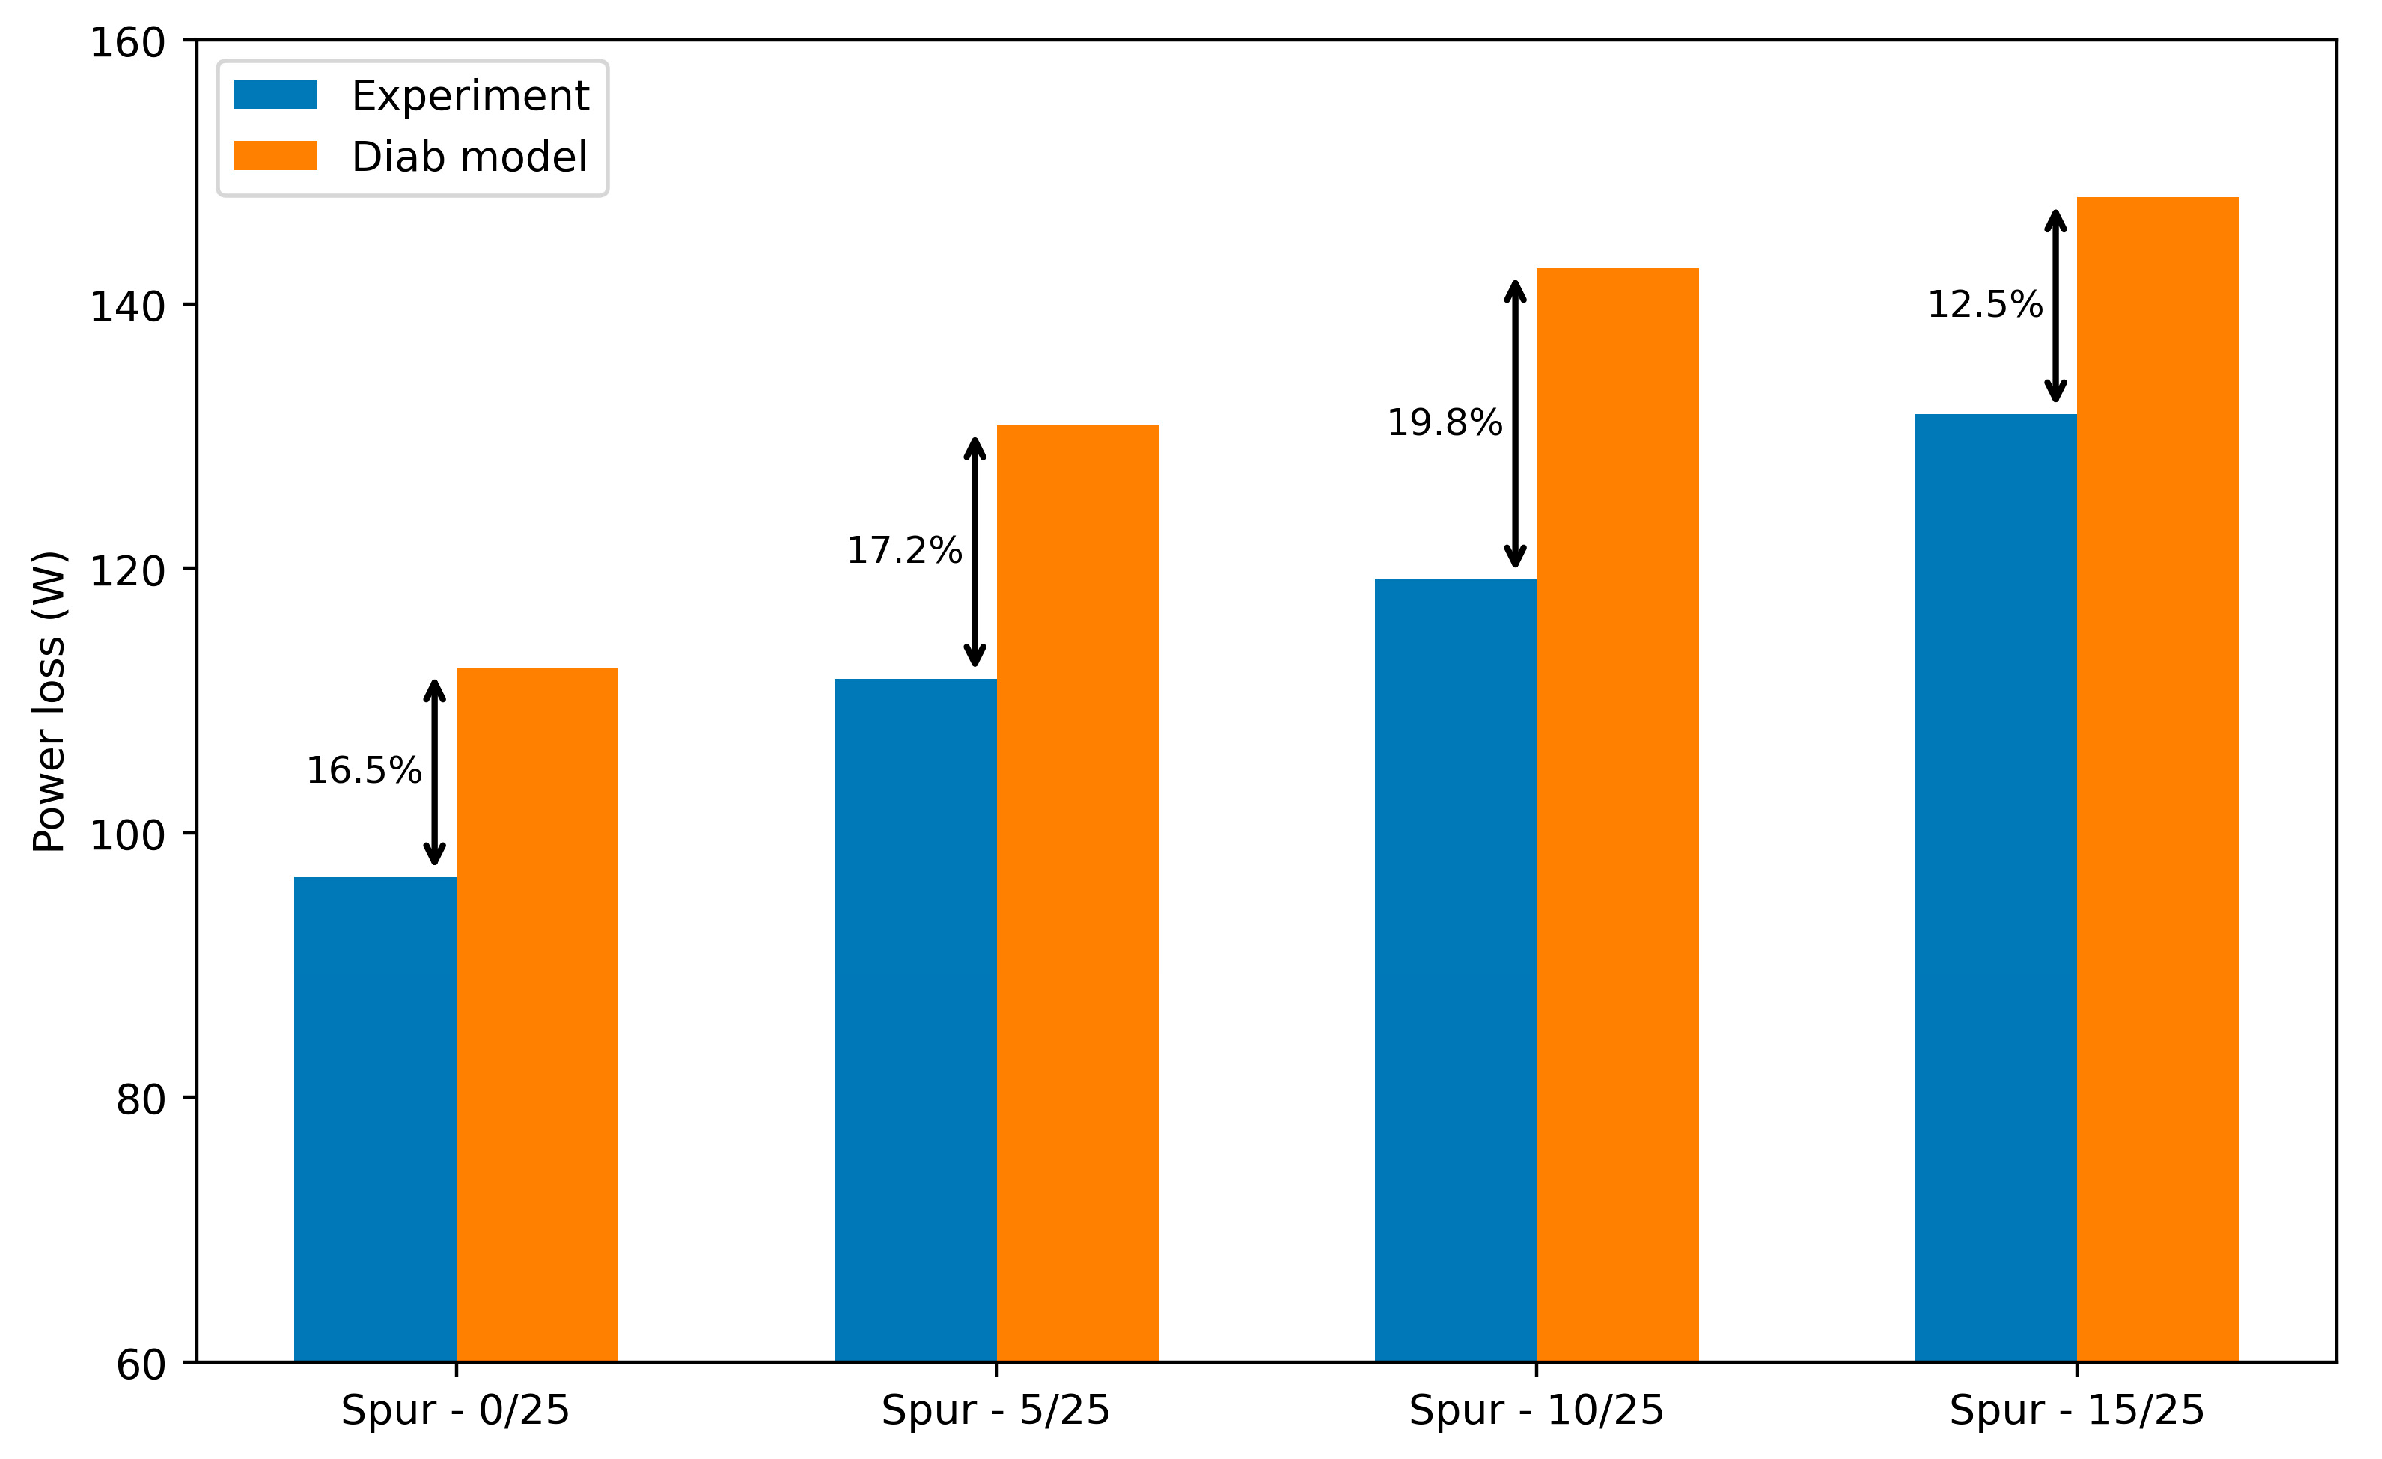
The Diab model accurately captures the trend of increasing losses with greater flange distance, visible in Figure 13, but it overestimates the loss values across all test series, with a relative deviation from 12.5% to 19.8% at 6000 rpm.
Helical Gear
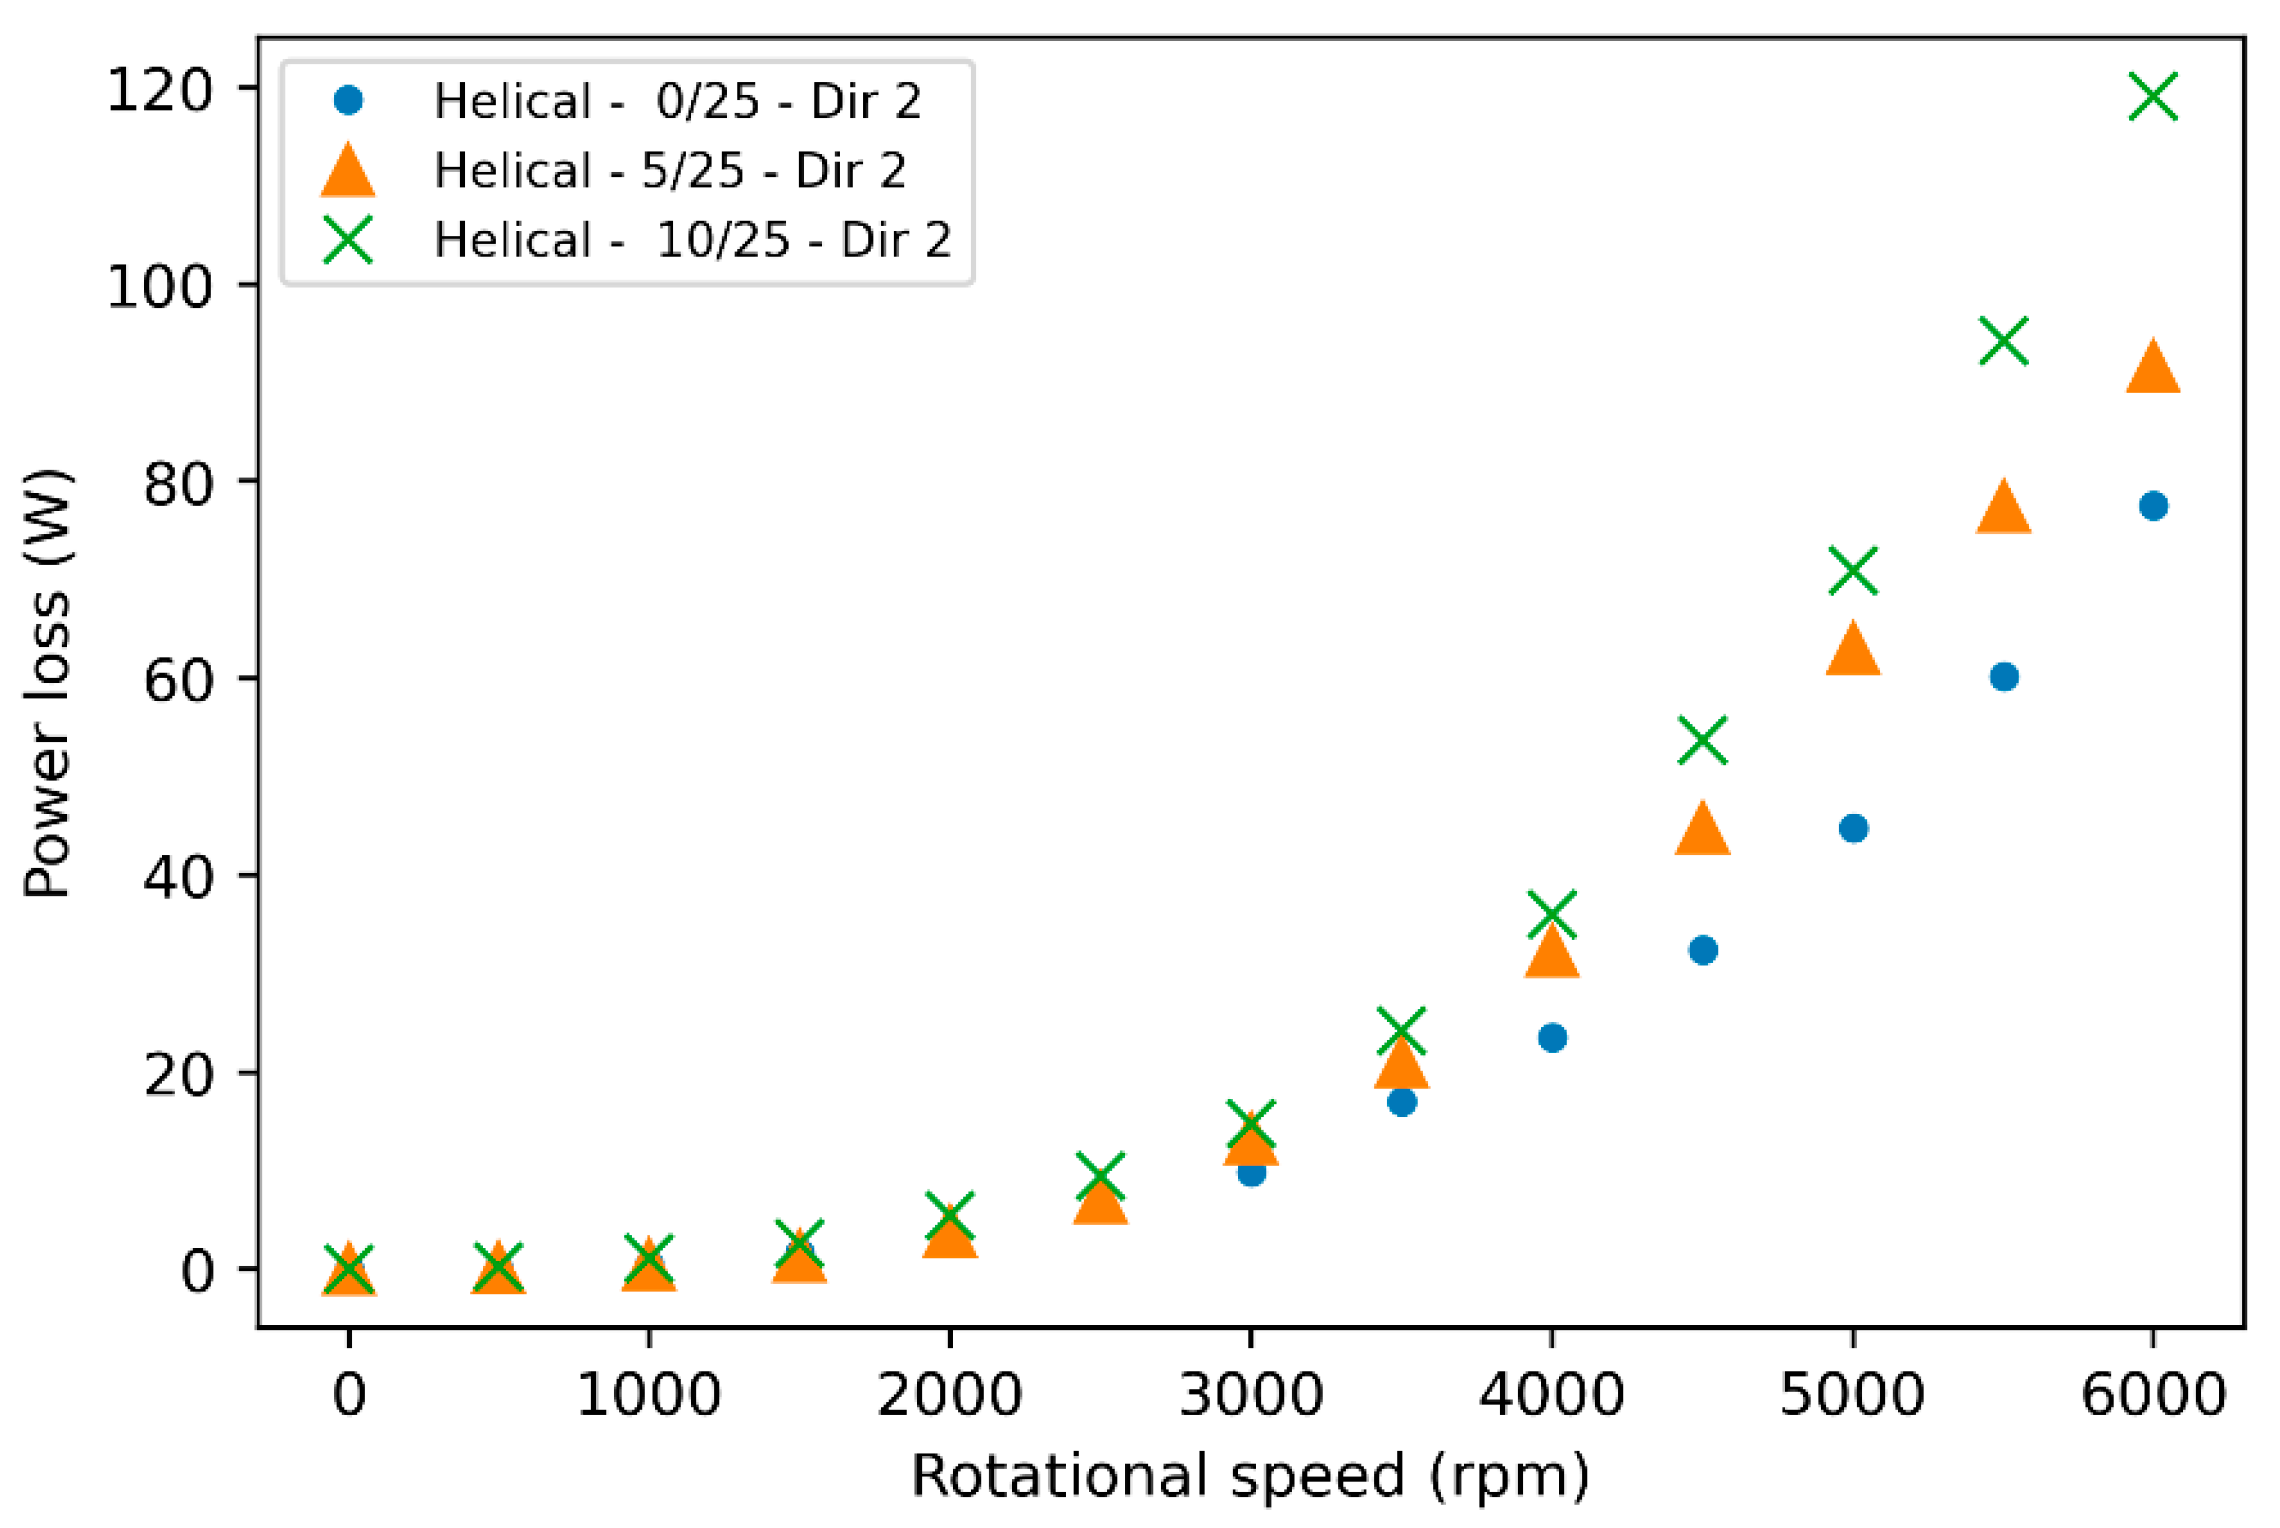
The test configurations are listed in Table 3, and the corresponding results are shown in Figure 14. These tests evaluate the influence of the distance j 1 between the flange and the gear flank on aerodynamic losses, especially at high rotational speeds (>2500 rpm). The main findings are the following:
  • Helical–0/25–Dir 2: With the flange in direct contact with the gear flank ( j 1 = 0 mm), air aspiration into the inter tooth space is minimized, reducing aerodynamic losses. The flange acts as a barrier, limiting transverse flow and the characteristic helical gear pumping effect.
  • Helical–5/25–Dir 2: Increasing j 1 to 5 mm allows more air to be drawn into the gear, slightly increasing losses—especially above 4000 rpm, where depression-induced pumping intensifies.
  • Helical–10/25–Dir 2: With j 1 = 10 mm, airflow into the gear increases further, and so do the losses. At 6000 rpm, this configuration shows the highest loss levels, confirming the strong influence of j1 on airflow and turbulence.
At j 1 = 10 mm, the flange has little influence on the flow and thus on aerodynamic losses, consistent with boundary layer studies by Daily and Nece [10].
These tests highlight how helical gear geometry, with its tangential flow components, leads to greater sensitivity to flange positioning compared to spur gears. The pumping effect caused by tooth helix angle amplifies air aspiration, explaining the more pronounced influence of j 1 . However, beyond 10 mm, the effect stabilizes, suggesting a practical threshold for flange influence in such configurations.
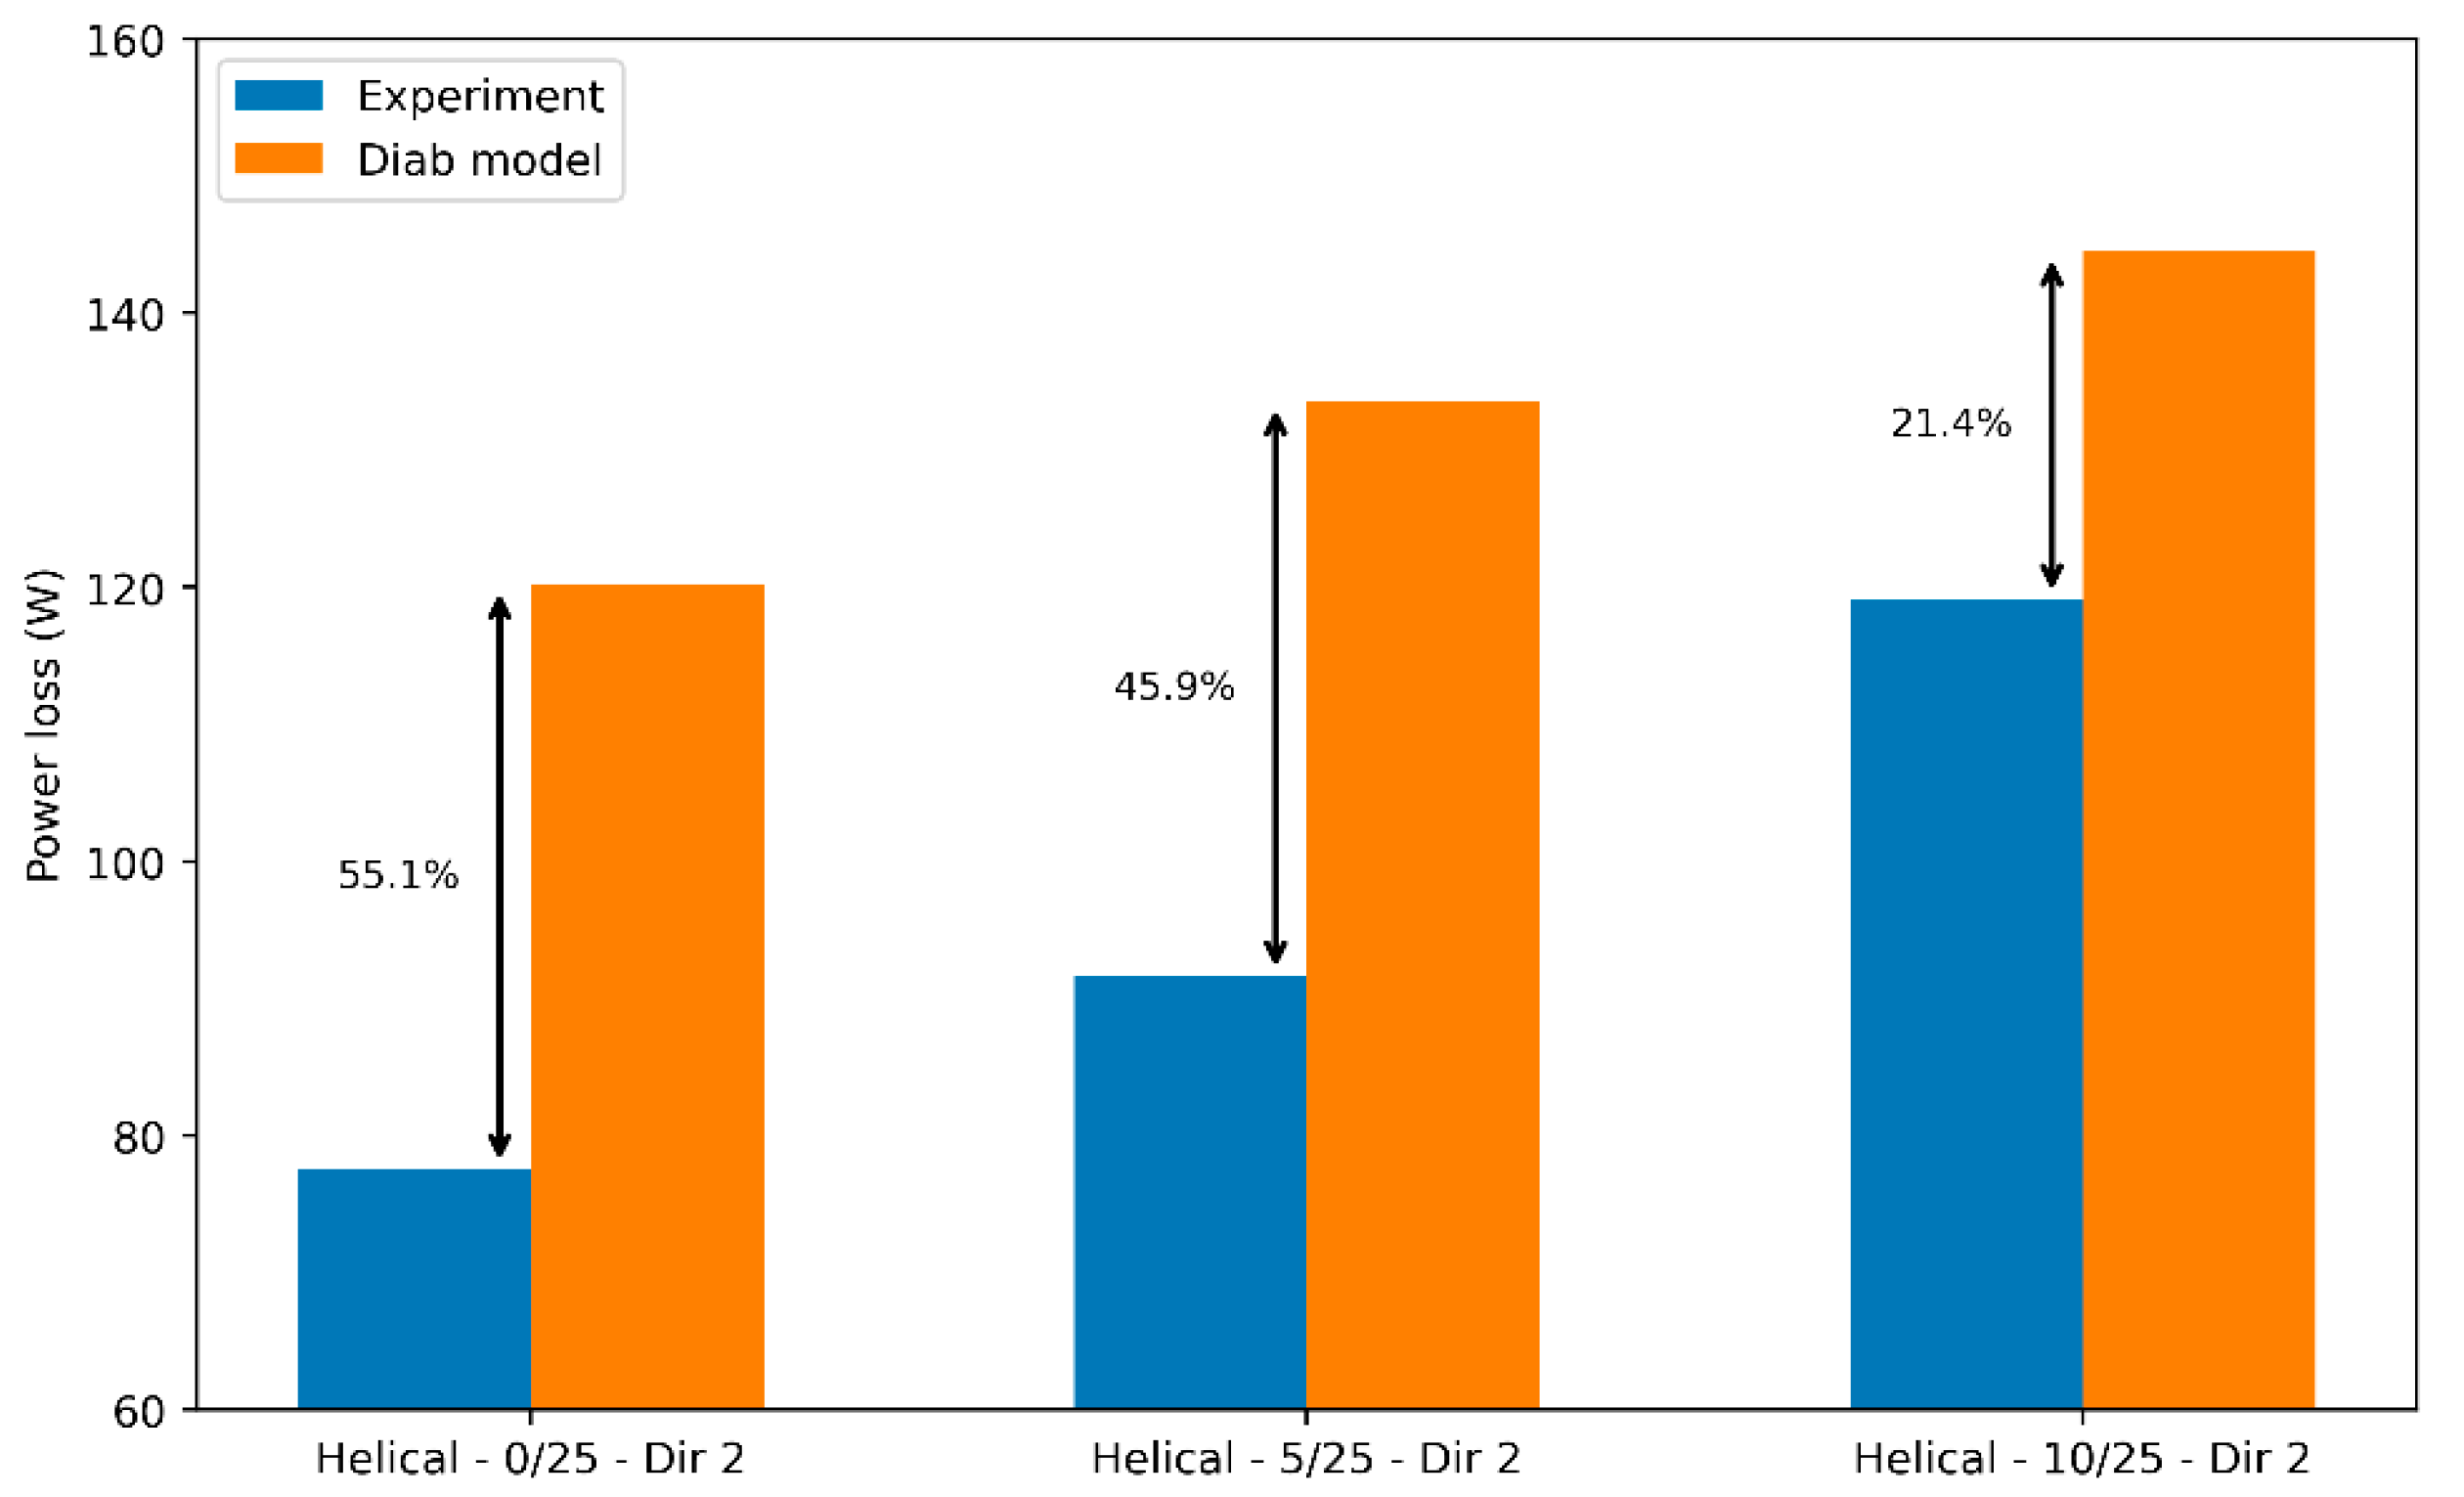
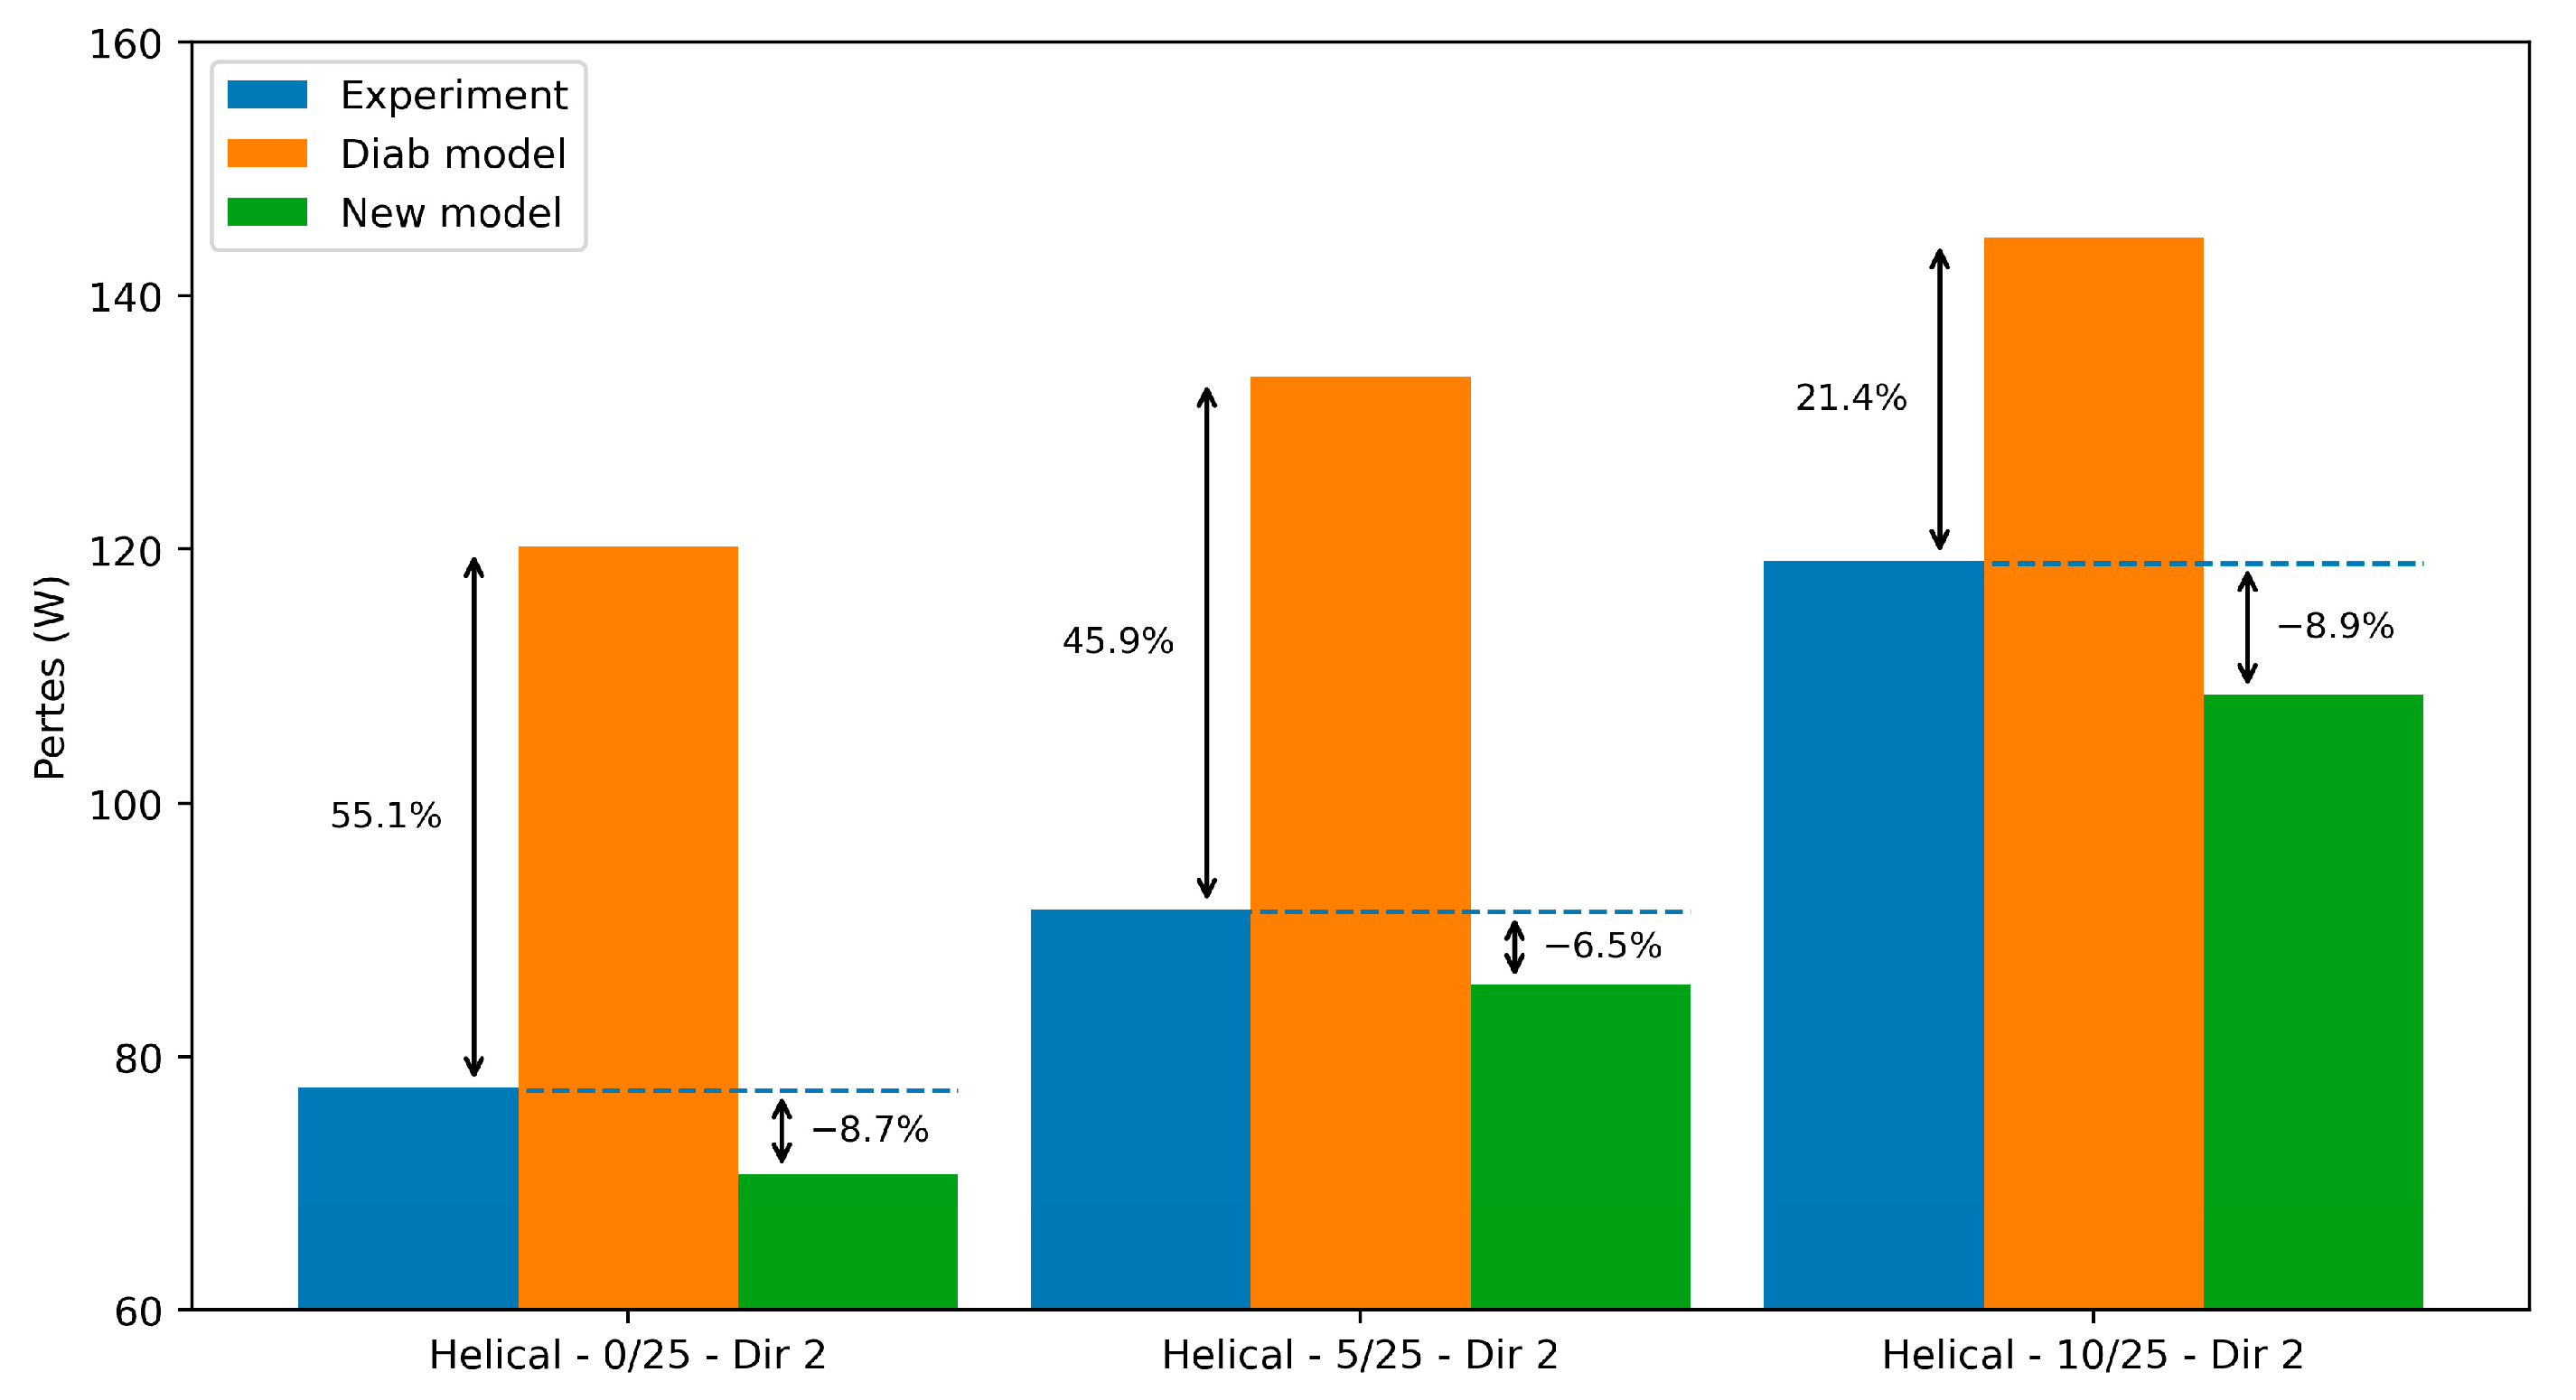
The model developed by Diab, applied here to helical gears, shows in Figure 15 a consistent trend with experimental observations: losses increase as the flange moves away from the gear. However, the discrepancy between experimental values and Diab’s model remains significant, ranging from 21.4% at a distance of 10 mm to 55.1% when the flange is positioned at 0 mm, at a rotational speed of 6000 rpm. This highlights the limitations of the original reduction factor in capturing all configurations.

2.3.3. Conclusion on the Diab Model

Experimental tests show a good correlation between Diab’s model and gears without obstacles close to the faces. The relative error between Diab’s model and the measurements is only 14% for the spur gear and 10.1% for the helical gear without a flange at 6000 RPM, validating the model’s ability to accurately predict windage losses in these configurations.
However, when close obstacles are introduced, such as flanges positioned near the gear, the gap between the model and the experiments becomes significant. For the spur gear with a flange at 10 mm, the error reaches 19.8%, while for the helical gear with an obstacle, it rises to 55.1% at 6000 RPM. These discrepancies show that although Diab’s model is detailed in accounting for laminar–turbulent transitions, it still needs improvement when factoring in the influence of nearby walls through a reduction factor ξ d , limiting its accuracy.

3. New Windage Power Loss Model

In order to improve the prediction of windage losses, the next step is to develop a physical model based on fluid mechanics, moving away from empirical approaches. The goal is to integrate, for both spur and helical gears, the influence of nearby walls by considering the modification of airflows induced by the presence of flanges or partial confinement.
The developed model distinguishes itself from existing approaches by its purely physical nature, based on the fundamental equations of compressible flows. Unlike current empirical models, it incorporates a density reduction factor directly derived from the energy balance of a flow assumed to be isentropic.
Thus, this new approach should provide a better correlation with experimental tests, particularly in cases where existing models show significant discrepancies in the presence of obstacles and complex configurations.

3.1. Density Correction Factor

3.1.1. Spur Gear

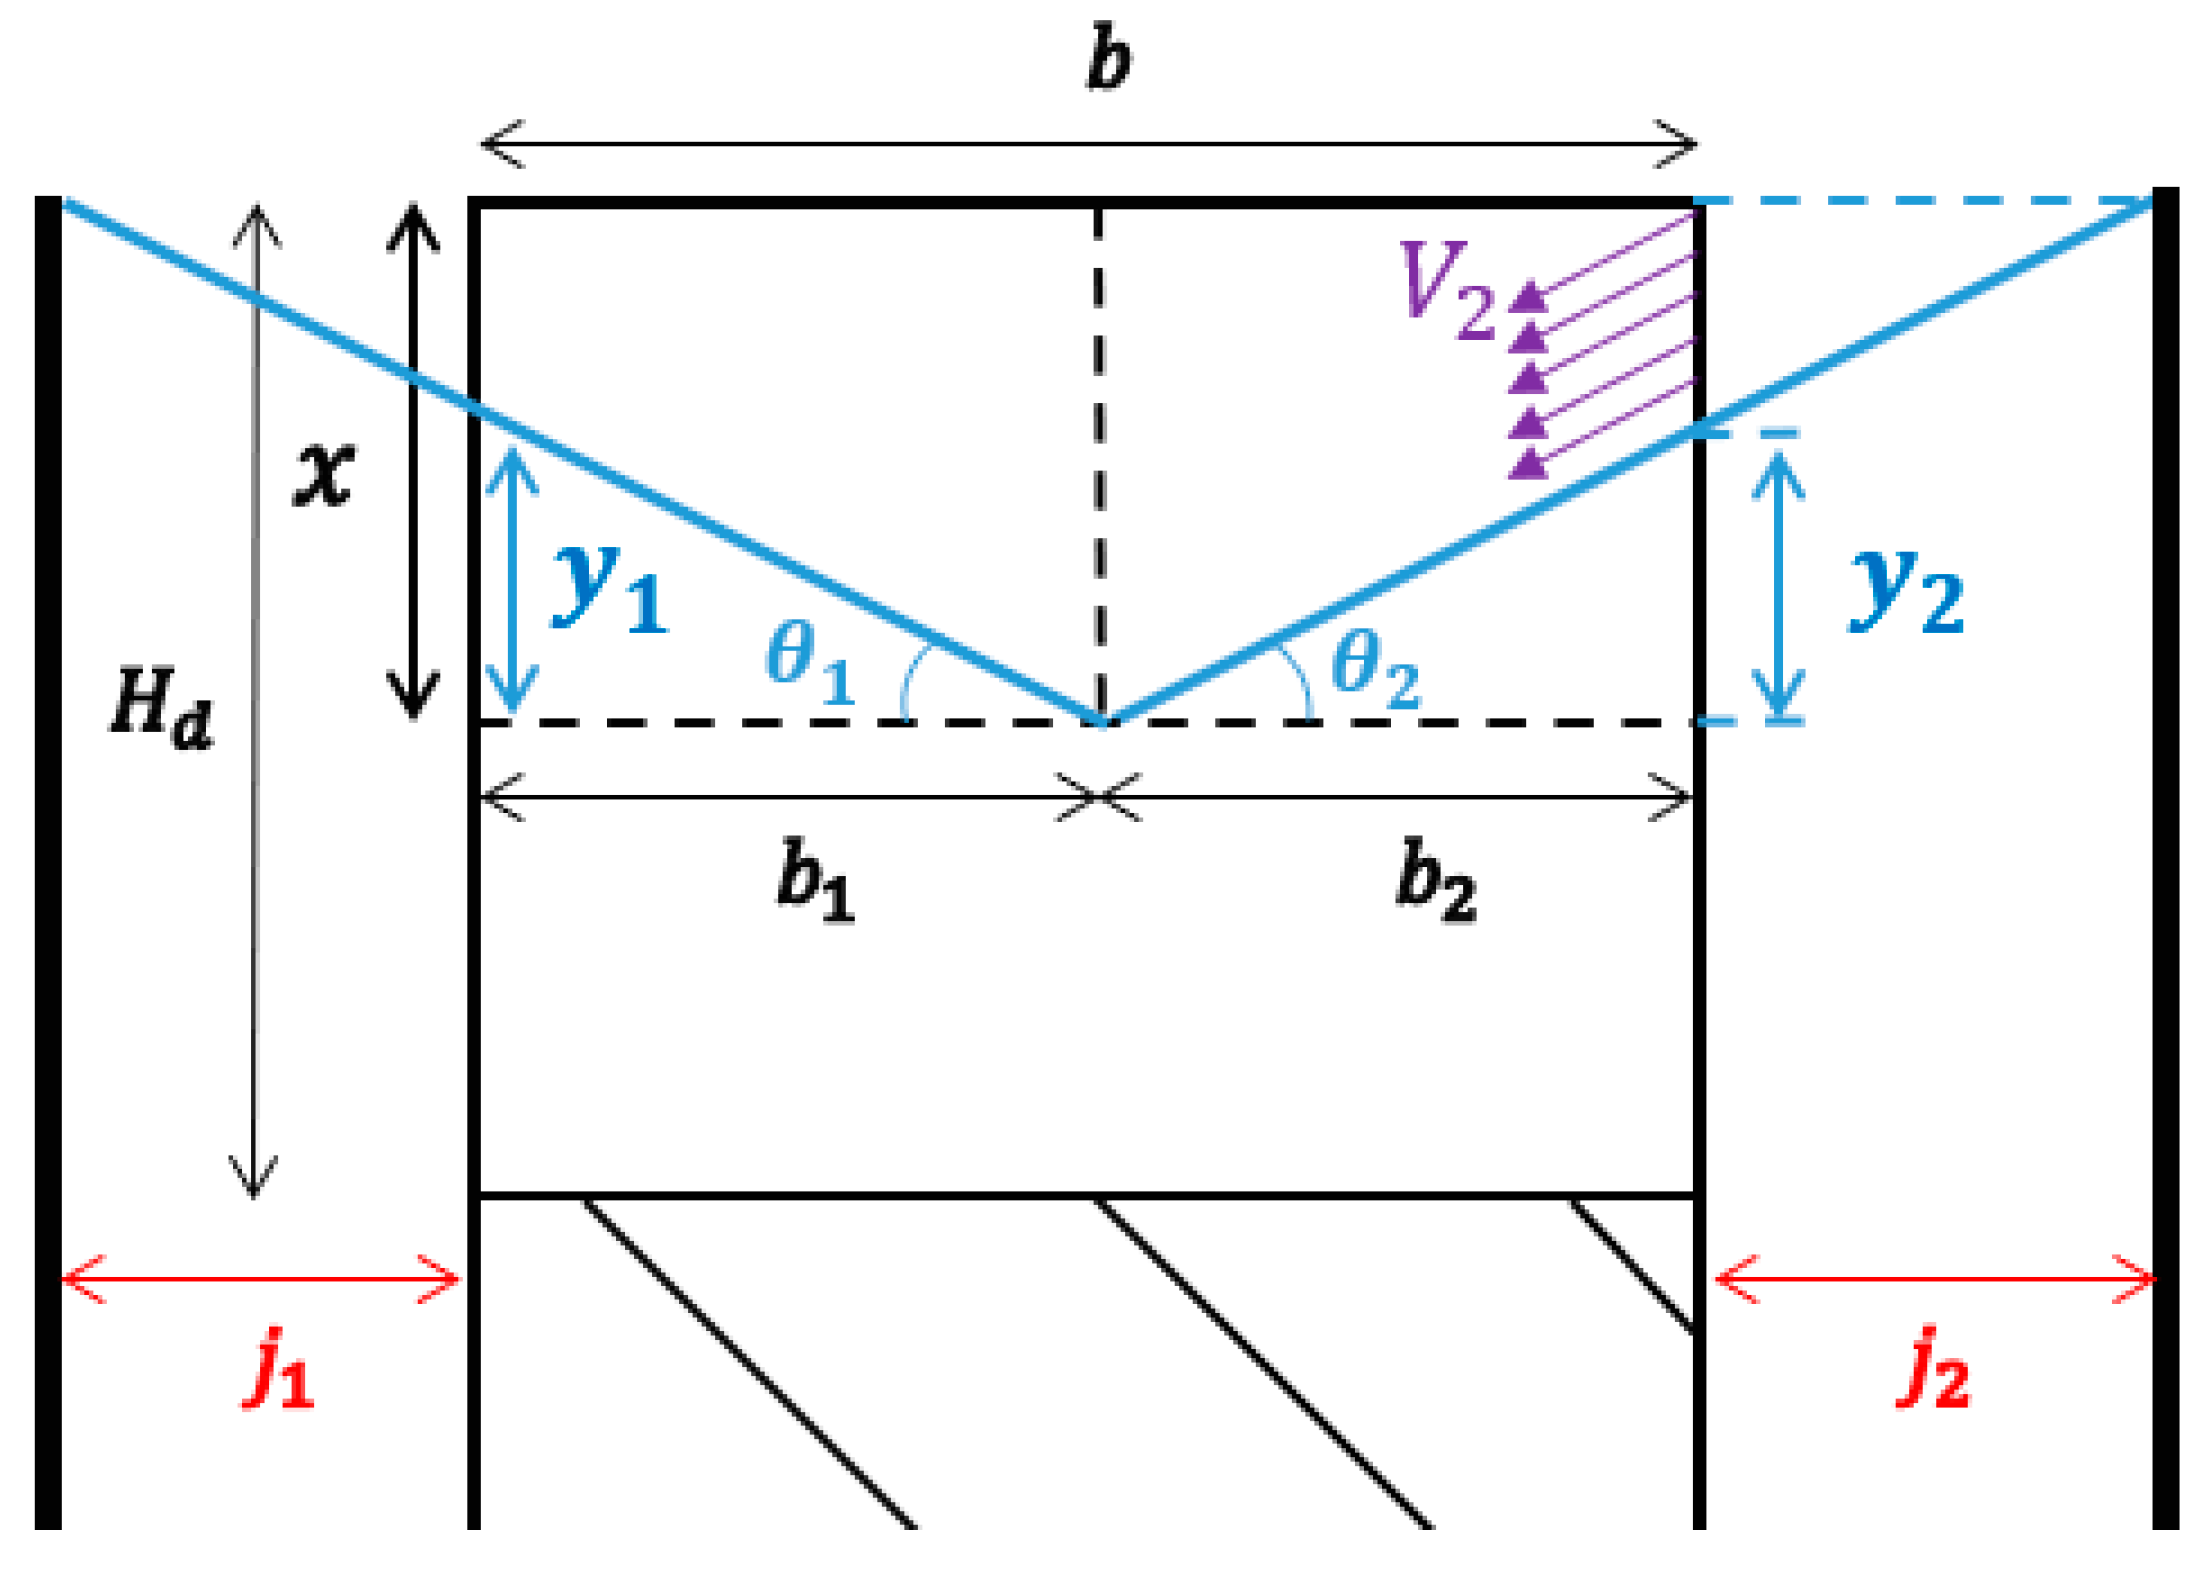
Air suction by the spur gear in the presence of flanges is influenced by their proximity, which alters the flow dynamics and windage losses. This air suction between the flange on side 2 and the gear is illustrated in Figure 16, with the suction velocity on side 2 denoted as V 2 .
A proximity ratio j r a t i o is defined to quantify the influence of flanges on each side of the gear, enabling the distribution of the active width and the calculation of the suction angles θ 1 and θ 2 of a streamline. The ratio j r a t i o is expressed based on the smallest distance j , which has the greatest impact on the density factor. It is, therefore, defined differently depending on the relationship between j 1 and j 2 :
  • If j 1 j 2 :
j r a t i o = j 2 j 1 + j 2
  • If j 1 < j 2 :
j r a t i o = j 1 j 1 + j 2
Once j r a t i o is calculated, the terms ( b 1 , b 2 ) associated with the total width of the spur gear b are determined:
  • If j 1 j 2 :
b 1 = b ( 1 j r a t i o )
and:
b 2 = b j r a t i o
  • If j 1 j 2 :
b 1 = b j r a t i o
and:
b 2 = b ( 1 j r a t i o )
These quantities then provide access to the angles formed between the height of the active zone of the tooth x as defined by Diab [12] and the length corresponding to the sum of the width portion of the gear and the distance between the gear flank and the flange, for both sides 1 and 2, with the following:
θ 1 = atan x b 1 + j 1
θ 2 = atan x b 2 + j 2
The angles, θ 1 and θ 2 , represent the air intake angle on each side of the gear tooth, with x :
x = r t 1 cos ϕ
The lengths y 1 and y 2 represent the height to be subtracted from the height defined by x , corresponding to a zone where no air is entrained.
y 1 = b 1 s i n ( θ 1 )
and:
y 2 = b 2 s i n ( θ 2 )
Based on these parameters, the total ejection flow rate and the fluid suction velocity are determined, ensuring the subsonic flow condition is met to maintain the isentropic flow assumptions.
The active flow ejection surface is taken from the work of Diab:
S e j e c t i o n = b x
The air ejection flow rate of a tooth as a function of the rotational speed and the active tooth length is given by the following:
Q t o o t h = ω r t x 2 S e j e c t i o n
This allows for determining the total air ejection flow rate across the gear:
Q e j e c t i o n = Z Q t o o t h
In addition to that, one can evaluate the thickness at the tooth tip associated with a tooth, taking into account its involute shape and pressure angles such as:
S t = r t S p r p + 2 i n v α p i n v α t
with,
  • r t : Tip radius [m].
  • r p : Pitch radius [m].
  • S p = π m 2 : Tooth thickness at the pitch circle [m].
  • i n v ( α p ) = t a n ( α p ) α p : Involute function of the pitch circle [-].
  • α p , α t : Pressure angle at the pitch circle and at the tooth tip, respectively [rad].
The suction areas S 1 and S 2 are then the following:
S 1,2 = π D t S t Z x y 1,2
with,
  • π D t : Circumference of the pitch diameter [m].
  • S t Z : Contribution of the teeth on the circumference [m].
  • x y 1,2 : Available length for the flow after subtracting the dead lengths ( y 1 , y 2 ) .
To determine the velocity of the aspirated fluid, the first step is to calculate the air aspiration speed perpendicular to the suction surface V 1,2 , using the continuity equations and maintaining the assumption of constant density across the entire width of the gear, with the following:
V 1,2 = Q e j e c t i o n S 1,2
An important condition to verify is V 1,2 < c . This means that the fluid velocity remains smaller than the speed of sound in air, which is crucial to avoid irreversibility, such as shock waves that would invalidate the assumption of an isentropic flow.
The calculation of the air density reduction factors ξ 1 and ξ 2 , for sides 1 and 2 of each gear, respectively, follows several steps (detailed here for ξ 1 ). The starting assumption is that air behaves as an ideal gas, in order to use the isentropic flow energy conservation equation.
Step 1—Isentropic Total Energy Equation
The conservation of energy for an isentropic flow is expressed as follows:
c p T + V 2 2 = c o n s t a n t
Applying this equation between ambient air and the suction point 1:
c p T a + V a 2 2 = c p T 1 + V 1 2 2
Assuming the air velocity far from the gear is negligible ( V a = 0 ), then,
c p T a = c p T 1 + V 1 2 2
Solving the air temperature T1 at the inlet of the inter tooth space:
T 1 = T a V 1 2 2 c p
Step 2—Isentropic Relation for Ideal Gases
For an isentropic transformation of an ideal gas, the density–temperature relation is as follows:
ρ 1 ρ a = T 1 T a 1 γ 1
Substituting T 1 into the equation:
ρ 1 ρ a = 1 V 1 2 2 c p T a 1 γ 1
Step 3—Definition of the Correction Factor  ξ 1
The correction factor ξ 1 is defined as the ratio of the local air density at the suction side to the ambient air density in the housing:
ξ 1,2 = 1 V 1,2 2 2 c p T a 1 γ 1
This factor allows for the adjustment of the air density based on the acceleration induced by the suction. The corrected density ρ 1,2 is then obtained by the following:
ρ 1,2 = ρ ξ 1,2
This corrected term ensures that the air rarefaction effects due to suction are properly accounted for in the modeling of windage losses, using the general expression for windage power loss derived from Diab’s model [12]:
P g e a r = C t e e t h + C f a c e s ω
where,
  • P g e a r : Windage losses of the gear in air [W].
  • ω : Angular rotational speed of the gear [rad/s].
and with the windage loss torque related to the gear teeth C t e e t h :
C t e e t h = 1 2 C d 1 ρ 1 + C d 2 ρ 2 ω 2 r p 5
where the dimensionless drag moment for the gearing C d 1,2 is detailed in the Appendix A.
The windage loss torque related to the gear flanks C f a c e s :
C f a c e s = 1 2 C f ρ 1 + ρ 2 ω 2 r p 5
with C f the dimensionless drag moment on gear faces, whose equation is detailed in the Appendix A.

3.1.2. Helical Gear

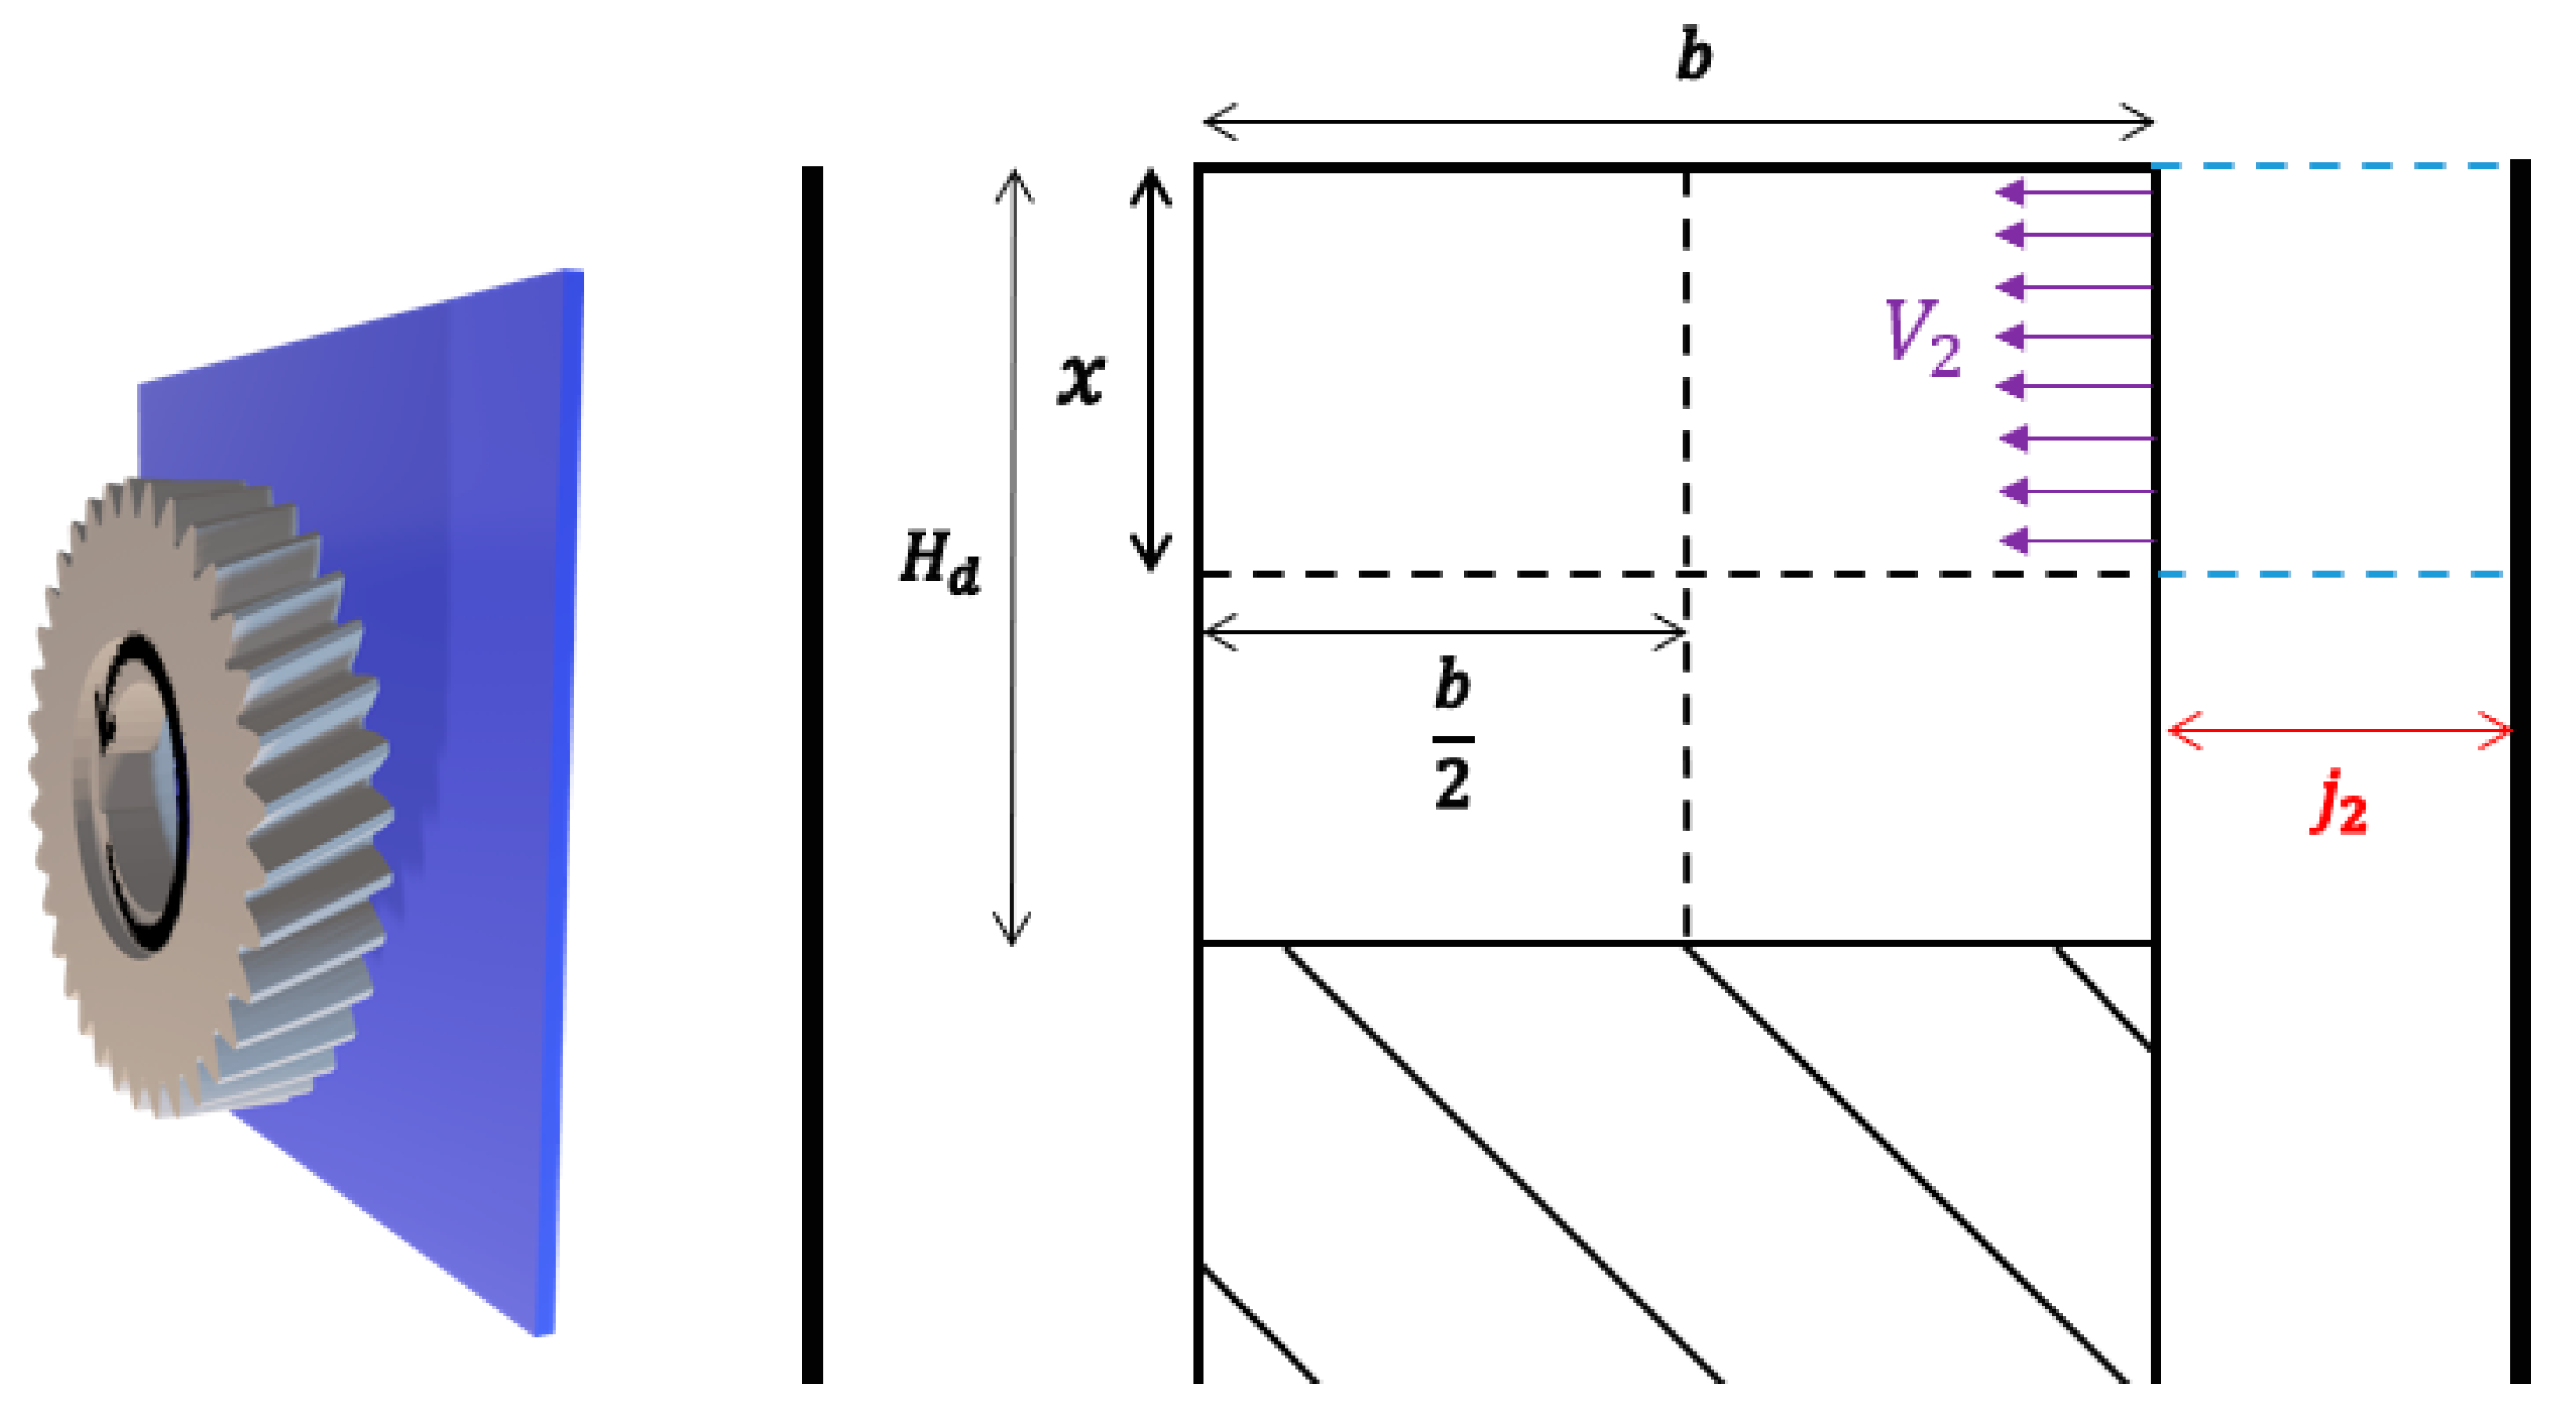
In the case of a helical gear, air aspiration is primarily influenced by the side in depression, in other words, the side where air is drawn associated with the rotation effect and the helix angle, as shown in Figure 9. The model considers a tooth thickness b = b c o s β , which accounts for this angle, thereby altering the flow dynamics compared to the spur gear, as shown in Figure 17.
The air ejection surface is defined by S e j e c t i o n = b x , which allows the evaluation of the air ejection flow rate of a tooth as a function of the rotational speed ω and the active tooth length x from Equation (9), as shown in Figure 18. The total flow rate over the entire gear is then obtained by multiplying this area by the number of teeth Z .
The aspiration side is characterized by the surface S 1 or S 2 , depending on the side of depression. This surface depends on the ratio between the active length x (from Equation (11)) and the proximity j 1,2 of the flange relative to the gear.
S 1,2 = x j 1,2 Z
From this surface, the velocity of the aspirated fluid is first calculated perpendicular to the aspiration surface using the continuity equation (a constant density across the entire width of the gear is assumed here again) and then adjusted according to the flow direction.
V 1,2 = Q e j e c t i o n S 1,2
This approach allows, for a helical gear, to characterize windage losses by accounting for the presence of a flange and correcting the density, as with spur gears, using the previous formulations (Step 1 to 3). These equations must be applied only in the direction of fluid aspiration that is, on side 1 if the ejection direction (Dir 2) is side 2, and on side 2 if the ejection direction (Dir 1) is side 1.
This factor ξ 1,2 allows for adjusting the air density based on the acceleration induced by the suction side. The corrected density ρ 1,2 is then obtained by the following:
ρ 1,2 = ρ ξ 1,2
and with the windage loss equation derived from Diab’s model:
P w i n d a g e = C t e e t h + C f a c e s ω
where,
  • P w i n d a g e : Windage losses of the gear in air [W].
  • ω : Angular rotational speed of the gear [rad/s].
and with the windage loss torque related to the gear tooth C t e e t h according to the air ejection direction of the gear:
  • If D i r 2, meaning the air ejection direction from the gear towards side 2, then,
C t e e t h = 1 2 C d ρ 1 ω 2 r p 5
  • If D i r 1, meaning the air ejection direction from the gear towards side 1, then,
C t e e t h = 1 2 C d ρ 2 ω 2 r p 5
and for the torque related to the face contribution:
C f a c e s = 1 2 C f ρ 1 + ρ 2 ω 2 r p 5
with the dimensionless drag moment for the gear teeth C d and the one associated with gear faces C f are detailed in the Appendix A.

3.2. Comparison with Experiments

3.2.1. Spur Gear

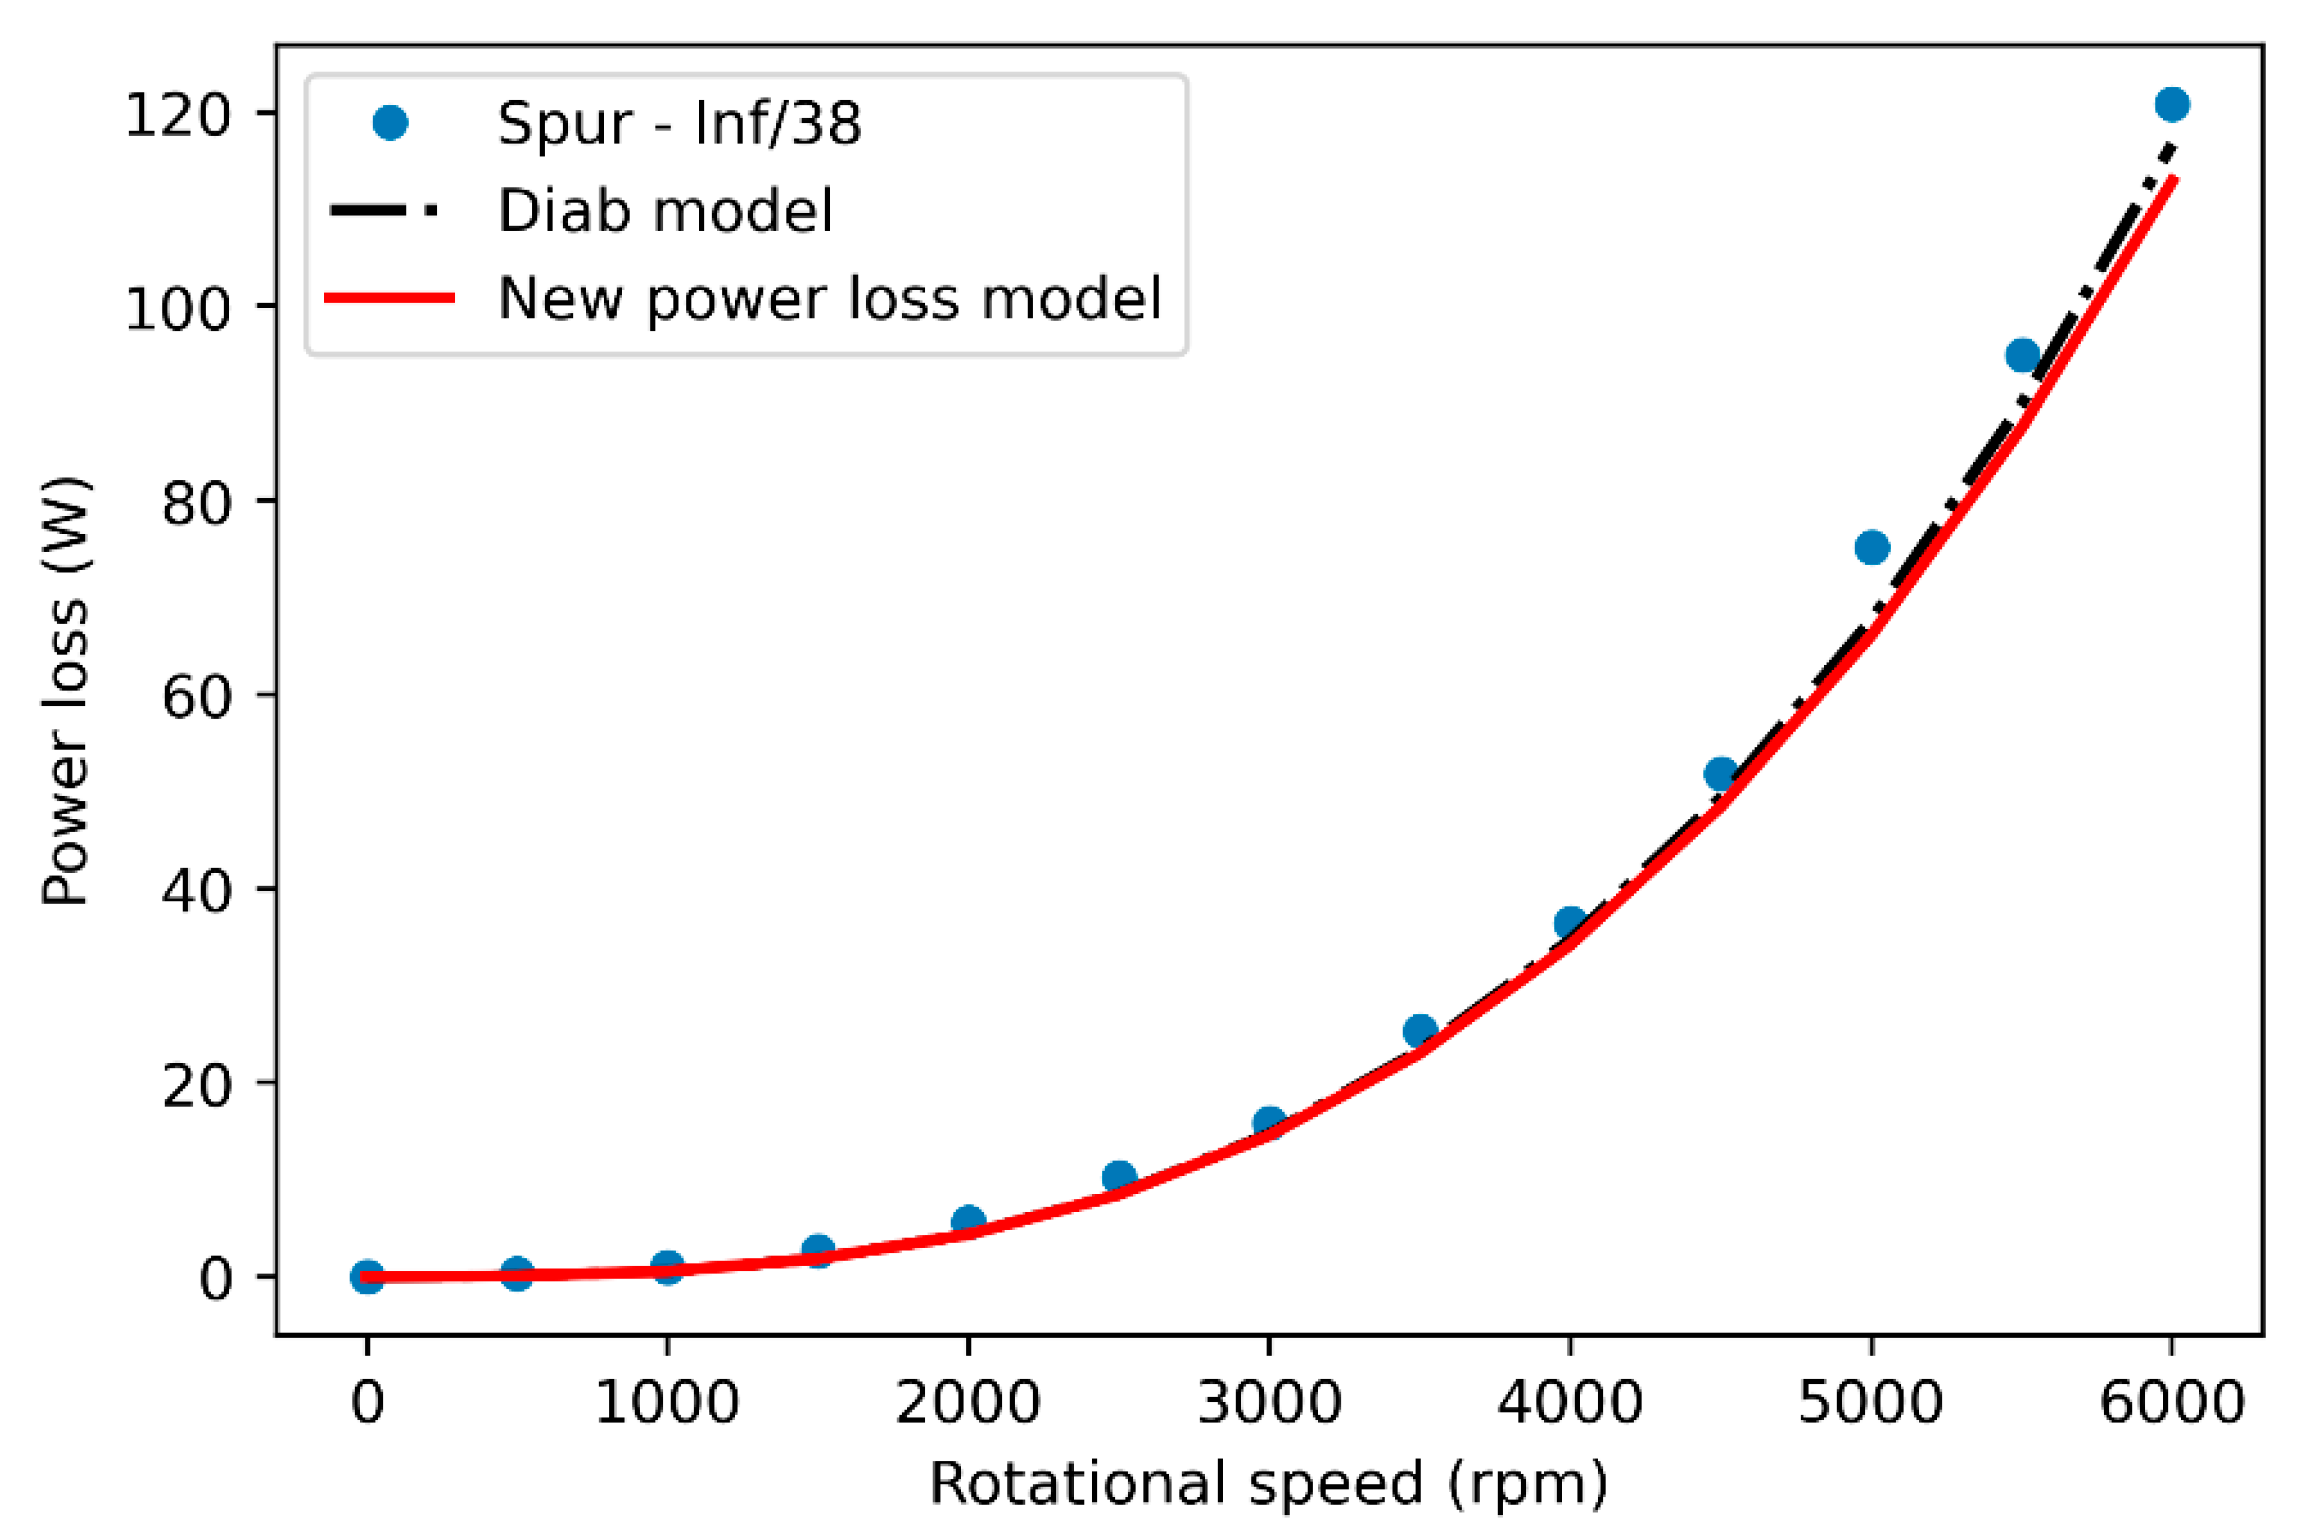
The test series without nearby flanges (Spur–Inf/38), shown in Figure 19, demonstrate a good correlation between the loss model and experimental measurements. The windage loss model using the density reduction factor reflects the quadratic trend of losses as a function of rotational speed. At low speeds, the windage loss model predicts losses that remain low compared to the losses of the shaft line. For speeds above 4000 rpm, both the experimental curve and models show a significant increase in losses, indicating that the windage effect becomes substantial and must be considered, as it is no longer negligible compared to other losses. At 6000 rpm, the discrepancy between the models and experiments remains minimal, showing that the model with the density reduction factor ξ aligns with original Diab’s model when no obstacles are near the gear faces.
The introduction of a flange and variation in the distance j 1 between the gear face and this flange highlight the sensitivity of windage losses to this parameter, visible in Figure 20 for two conditions. For small gaps ( j 1 = 0 mm), the flange restricts air intake, reducing losses; increasing j 1 raises losses due to greater air entrainment. Beyond j 1 = 15 mm, the losses plateau, becoming comparable to the no-flange configuration, indicating the flange’s effect becomes negligible. The proposed power loss model accurately captures these trends across all cases.
Figure 21 highlights the comparison between experiments, original Diab’s model, and the new windage loss model on spur gears with a side flange. The proposed power loss model reproduces the experimental values much more accurately in the case of spur gears with a nearby side flange, showing low relative deviations ranging from −1.5% to −4.6% across the four operating conditions (distance j 1 ) at 6000 rpm.

3.2.2. Helical Gear

The loss model accurately reproduces the experimental data, visible in Figure 22, confirming its ability to capture the windage behavior. Without a flange, airflow remains undisturbed with low air density. When a flange is introduced on the suction side, losses decrease for small gaps ( j 1 = 0 mm), increase, and become comparable to the no-flange case at j 1 = 10 mm, indicating diminished flange influence. Overall, the model effectively represents the impact of air entrainment, and the results show that the flange effect is only significant for j 1 < 10 mm.
This variation with respect to the test conditions (distance j 1 ) is well captured by the model, as shown in Figure 23, with a relative deviation significantly lower than the Diab model, ranging from −6.5% to −8.9% for the flange positioned 10 mm from the gear, at a rotational speed of 6000 rpm.

4. Conclusions

Experimental investigations on spur and helical gears enabled a detailed analysis of flange and wall effects on windage power losses. For both gear types, measurements showed strong sensitivity to flange proximity: a larger gap significantly increased aerodynamic losses, confirming the key role of confinement effects.
Comparison with Diab’s model [12] showed good agreement without obstacles (relative deviations < 5% for spur gear, < 8% for helical one), but large errors with flanges (up to 20% and 55%, respectively). This highlighted the need for a refined approach capturing aerodynamic interactions with surrounding structures.
A new windage loss model, based on isentropic compressible flow, explicitly accounts for flange and wall effects via a density correction on the aerodynamic torque. Validation showed improved accuracy, reducing maximum relative error to about 5% for spur and 9% for helical gears. This formulation provides a reliable tool for predicting windage losses in high-speed gear systems under confined conditions. Ongoing work focuses on extending the approach to the complete pinion–wheel pair and on combining it with oil–jet lubrication experiments to assess the interaction between air and oil.

Author Contributions

Investigation, T.T. (Thibaut Torres) and Y.D.; writing—original draft preparation, T.T. (Thibaut Torres); writing—review and editing, Y.D., T.T. (Thomas Touret) and B.G.; supervision, C.C. All authors have read and agreed to the published version of the manuscript.

Funding

The authors disclosed the receipt of the following financial support for the research, authorship, and/or publication of this article: This work was supported by the Direction Générale de l’Aviation Civile, (grant number 2022-42).

Data Availability Statement

The original contributions presented in this study are included in the article. Further inquiries can be directed to the corresponding author.

Acknowledgments

The authors would like to express their thanks to the Direction Générale de l’Aviation Civile (DGAC) for funding this research, grant number 2022-42.

Conflicts of Interest

The authors declared no potential conflicts of interest with respect to the research, authorship, and/or publication of this article.

Nomenclature

Tooth width[m]
b Apparent tooth width for helical gear[m]
b 1,2 Tooth width on side 1 and side 2[m]
C Shaft line and gearwheel assembly torque[Nm]
C d Dimensioned drag moment for gearing[-]
C d 1,2 Dimensioned drag moment for gearing on side 1 and side 2[-]
C f Dimensioned drag moment on gear faces[-]
C f a c e s Windage loss torque related to the gear face surfaces[Nm]
C g e a r Total scaled drag moment[-]
C t e e t h Windage loss torque related to the gear teeth[Nm]
c a Addendum coefficient[-]
c p Specific heat capacity[J/kgK]
D t Tooth tip diameter of the gear[m]
D i r e j e c t Direction of ejected air[-]
H d Tooth height[m]
H e Heaviside function[-]
j 1,2 Distance between gear faces and obstacles[m]
j r a t i o Distance ratio between the obstacles and the gear faces[m]
m 1,2 Coefficient for laminar and turbulent regime[-]
n 1,2 Coefficient for laminar and turbulent regime[-]
P g e a r Ventilation loss of the gear[W]
P s h a f t Power loss of the shaft line[W]
P t o t a l Power loss of the shaft and gear assembly[W]
Q e j e c t i o n Total air ejection flow over the gear teeth[m3/s]
Q t o o t h Tooth air ejection rate[m3/s]
R * Critical radius delimiting the zone in laminar regime from that in turbulent regime[m]
R d 1,2 Obstacle radius[m]
r p Gear pitch radius[m]
r t Gear tip radius[m]
R e Reynolds number [-]
R e * Critical Reynolds number[-]
S 1,2 Air suction surfaces on side 1 and side 2[m2]
S e j e c t i o n Active air ejection surface[m2]
S p Tooth thickness at the pitch circle[m]
S t Tooth tip thickness[m]
T a i r Air temperature inside the housing[K]
V 1,2 Air injection velocity on side 1 and side 2[m/s]
x Active tooth length[m]
x a Profile shift coefficient[-]
y 1,2 Dead tooth length[m]
Z Number of teeth[m]
α p Pressure angle at the pitch circle of the gear[rad]
α t Pressure angle at the tooth tip[rad]
β Helix angle[-]
γ Heat capacity ratio; γ = 1.4 for air[-]
θ 1,2 Air suction angle[rad]
ξ 1,2 Air density reduction factor on side 1 and side 2[-]
ξ d Reduction factor associated with an obstacle in Diab’s model[-]
ρ Fluid density[kg/m3]
ρ 1,2 Corrected fluid density on side 1 and side 2[kg/m3]
ϕ Tooth tip profile angle[°]
ω Gear angular speed[rad/s]

Appendix A. Diab Model

One approach is proposed by Diab [12] based on the flow rates ejected by the gearing, distinguishing two contributions: that of the faces and that of the gearing.
The general expression for windage loss is given:
P g e a r = 1 2 ρ r p 5 ω 3 C g e a r
with,
C g e a r = 2 C f + C d
where,
  • P g e a r : Windage losses of the gear in air [W].
  • ω : Gear angular speed [rad/s].
  • C g e a r : Total scaled drag moment [-].
  • C f : Dimensionless drag moment on gear faces [-].
  • C d : Dimensionless drag moment for gearing [-].
  • Face losses
The contribution of the gearwheel faces depends on the Reynolds number and the transition between the laminar and turbulent regime according to the following:
C f = 2 n 1 π 5 2 m 1 1 R e * m 1 R * r p 5 + 2 n 2 π 5 2 m 2 1 R e m 2 1 R e * m 2 R * r p 5
with,
  • R e * = 3 · 10 5 : Critical Reynolds number [-].
  • R * = μ R e * ρ ω : Critical radius delimiting the zone in laminar regime from that in turbulent regime [m].
  • n 1 = 1.293 ; m 1 = 0.5 : Laminar flow coefficients [-].
  • n 2 = 0.074; m 2 = 0.2 : Coefficients for the turbulent regime [-].
2.
Tooth losses
The formulation giving the dimensionless resistive torque for the gearing is as follows:
C d = ξ d Z 4 b r p 1 + 2 c a + x a Z 4 1 cos ϕ 1 + cos ϕ 3 1 sin 2 β
with,
  • ξ d : Reduction factor for deflectors ( ξ d = 1 if no obstacle) [-].
  • Z : Number of teeth [-].
  • b : Tooth width [m].
  • c a : Addendum coefficient [-].
  • x a : Offset coefficient [-].
  • β : Helix angle [°].
ϕ :
ϕ = π Z 2 i n v α p i n v α t
with α p , α t being, respectively, the pressure angle at the primitive and at the tip [°].

References

  1. Wu, J.; Wei, P.; Liu, G.; Chen, D.; Zhang, X.; Chen, T.; Liu, H. A comprehensive evaluation of DLC coating on gear bending fatigue, contact fatigue, and scuffing performance. Wear 2024, 536–537, 205177. [Google Scholar] [CrossRef]
  2. Wu, J.; Wei, P.; Zhu, C.; Zhang, P.; Liu, H. Development and application of high strength gears. Int. J. Adv. Manuf. Technol. 2024, 132, 3123–3148. [Google Scholar] [CrossRef]
  3. Michaelis, K.; Höhn, B.; Hinterstoißer, M. Influence factors on gearbox power loss. Ind. Lubr. Tribol. 2011, 63, 46–55. [Google Scholar] [CrossRef]
  4. Hildebrand, L.; Dangl, F.; Sedlmair, M.; Lohner, T.; Stahl, K. CFD analysis on the oil flow of a gear stage with guide plate. Forsch. Ingenieurwes 2022, 86, 395–408. [Google Scholar] [CrossRef]
  5. Mauz, W. Hydraulische Verluste von Stirnradgetriebe bei Umfangsgeschwindigkeit bis 60 m/s. Ph.D. Thesis, IMK University of Stuttgart, Stuttgart, Germany, 1987. [Google Scholar]
  6. Kármán, V.T. Über laminare und turbulente Reibung. ZAMM—J. Appl. Math. Mech./Z. Für Angew. Math. Mech. 1921, 1, 233–252. [Google Scholar] [CrossRef]
  7. Schlichting, H. Boundary Layer Theory, 7th ed.; McGraw-Hill: New York, NY, USA, 1979; p. 817. [Google Scholar]
  8. Daily, J.W.; Nece, R.E. Chamber Dimension Effects on Induced Flow and Frictional Resistance of En-closed Rotating Disks. J. Basic. Eng. 1960, 82, 217–230. [Google Scholar] [CrossRef]
  9. Mann, R.W.; Marston, C.H. Friction Drag on Bladed Disks in Housings as a Function of Reynolds Number, Axial and Radial Clearance, and Blade Aspect Ratio and Solidity. J. Basic. Eng. 1961, 83, 719–723. [Google Scholar] [CrossRef]
  10. Handschuh, R.F.; Kilmain, C.J. Preliminary Comparison of Experimental and Analytical Efficiency Results of High-Speed Helical Gear Trains. In 9th International Power Transmission and Gearing Conference, Parts A and B; American Society of Mechanical Engineers: New York, NY, USA, 2003; Volume 4, pp. 949–955. [Google Scholar] [CrossRef]
  11. Ferziger, J.H.; Perić, M.; Street, R.L. Computational Methods for Fluid Dynamics, 4th ed.; Springer: Berlin/Heidelberg, Germany, 2019; pp. 1–596. [Google Scholar]
  12. Diab, Y.; Ville, F.; Velex, P.; Changenet, C. Windage losses in high speed gears-preliminary experimental and theoretical results. J. Mech. Des. 2004, 126, 903–908. [Google Scholar] [CrossRef]
  13. Hill, M.J.; Kunz, R.F.; Noack, R.W.; Long, L.N.; Morris, P.J.; Handschuh, R.F. Application and Validation of Unstructured Overset CFD Technology for Rotorcraft Gearbox Windage Aerodynamics Simulation. In 64th Annual Forum of the American Helicopter Society; The Vertical Flight Society (VFS): Fairfax, VA, USA, 2008. [Google Scholar]
  14. Pallas, S.; Marchesse, Y.; Changenet, C.; Ville, F.; Velex, P. A windage power loss model based on CFD study about the volumetric flow rate expelled by spur gears. Mech. Ind. 2012, 13, 317–323. [Google Scholar] [CrossRef]
  15. Dai, Y.; Yang, C.; Zhu, X. Investigations of the Windage Losses of a High-Speed Shrouded Gear via the Lattice Boltzmann Method. Appl. Sci. 2024, 14, 9174. [Google Scholar] [CrossRef]
  16. Huang, B.; Zhang, H.; Ding, Y. CFD Modelling and Numerical Simulation of the Windage Characteristics of a High-Speed Gearbox Based on Negative Pressure Regulation. Processes 2023, 11, 804. [Google Scholar] [CrossRef]
  17. Winfree, D.D. Reducing Gear Windage Losses From High Speed Gears. In 8th International Power Transmission and Gearing Conference; American Society of Mechanical Engineers: New York, NY, USA, 2000; Volume 6, pp. 747–756. [Google Scholar] [CrossRef]
  18. Voeltzel, N.; Marchesse, Y.; Changenet, C.; Ville, F.; Velex, P. On the influence of helix angle and face width on gear windage losses. Proc. Inst. Mech. Eng. C J. Mech. Eng. Sci. 2016, 230, 1101–1112. [Google Scholar] [CrossRef]
  19. Goldstein, S. On the resistance to the rotation of a disc immersed in a fluid. Math. Proc. Camb. Philos. Soc. 1935, 31, 232–241. [Google Scholar] [CrossRef]
  20. Dawson, P.H. Windage Loss in Larger High-Speed Gears. Proc. Inst. Mech. Eng. Part A Power Process Eng. 1984, 198, 51–59. [Google Scholar] [CrossRef]
  21. Townsend, D. Dudley’s Gear Handbook—The Design, Manufacture, and Application of Gears, 2nd ed.; McGarw Hill Education: Columbus, OH, USA, 1992; pp. 1–847. [Google Scholar]
  22. Anderson, N.E.; Loewenthal, S.H. Effect of geometry and operating conditions on spur gear system power loss. J. Mech. Des. 1981, 103, 151–159. [Google Scholar] [CrossRef]
  23. Niel, D.; Changenet, C.; Ville, F.; Octrue, M. Thermomecanical study of high speed rolling element bearing: A simplified approach. Proc. Inst. Mech. Eng. Part. J J. Eng. Tribol. 2019, 233, 541–552. [Google Scholar] [CrossRef]
  24. Cann, P.M.E.; Lubrecht, A.A. Bearing performance limits with grease lubrication: The interaction of bearing design, operating conditions and grease properties. J. Phys. D Appl. Phys. 2007, 40, 5446–5451. [Google Scholar] [CrossRef]
  25. Shigley, J.E.; Mitchell, L.D.; Saunders, H. Mechanical Engineering Design (4th Ed.). J. Mech. Transm. Autom. Des. 1985, 107, 145. [Google Scholar] [CrossRef]
Figure 1. Airflow over a spur gear, based on Pallas et al. [14].
Dynamics 05 00033 g001
Figure 2. Highlighting of the suction and the ejection of airflow around a helical gear using injection of smoke.
Dynamics 05 00033 g002
Figure 3. Photography of a flange with helical gear.
Dynamics 05 00033 g003
Figure 4. Schematic diagram of the windage test bench.
Dynamics 05 00033 g004
Figure 5. Front view of windage bench.
Dynamics 05 00033 g005
Figure 6. Gear positioning on the windage test bench; dimensions in mm.
Dynamics 05 00033 g006
Figure 7. Example of torque during a test on the windage test bench.
Dynamics 05 00033 g007
Figure 8. Repeatability tests on spur gear.
Dynamics 05 00033 g008
Figure 9. Representation of the direction of air ejected by the helical gear in direction 2 at a distance j 2 .
Dynamics 05 00033 g009
Figure 10. Windage losses on spur and helical gears.
Dynamics 05 00033 g010
Figure 11. Photograph of the flanges with j1 and j2 equal to 0 mm on the spur gear.
Dynamics 05 00033 g011
Figure 12. Test series for the study of flange Influence on the j 1 for spur gear.
Dynamics 05 00033 g012
Figure 13. Comparison between experiments and Diab’s model on spur gears with flanges at 6000 rpm.
Dynamics 05 00033 g013
Figure 14. Test series for the study of flange Influence on the j 1 for helical gear.
Dynamics 05 00033 g014
Figure 15. Comparison between experiments and Diab’s model on helical gears with flanges at 6000 rpm.
Dynamics 05 00033 g015
Figure 16. Diagram of air suction on a spur gear with flanges.
Dynamics 05 00033 g016
Figure 17. Diagram of the helix angle with the apparent tooth length b .
Dynamics 05 00033 g017
Figure 18. Diagram of air aspiration on a helical gear with flanges.
Dynamics 05 00033 g018
Figure 19. Comparison between the models and the test series on spur gear.
Dynamics 05 00033 g019
Figure 20. Comparison between the new model and the test series on the spur gear with flange.
Dynamics 05 00033 g020
Figure 21. Comparison between experiments, Diab’s model, and the new windage loss model on spur gears with a side flange.
Dynamics 05 00033 g021
Figure 22. Comparison between the new model and the test series on the helical gear with flange.
Dynamics 05 00033 g022
Figure 23. Comparison between experiments, Diab’s model, and the new windage loss model on helical gears with a side flange.
Dynamics 05 00033 g023
Table 1. Gear geometries.
Gear TypeSpurHelical
Module (mm)54
Width (mm)2430
Tooth height (mm)11.259
Pressure angle (°)2025
Helix angle (°)020.5
Number of teeth3035
Table 2. Test conditions for the study of the flange on the j 1 side of the spur gear.
Test Series:Spur–0/25 Spur–5/25Spur–10/25 Spur–15/25
j 1 051015
j 2 25252525
Rotational speed0–6000
Table 3. Test conditions for the study of flange influence on the j 1 .
Test Series:Helical–0/25–Dir 2Helical–5/25–Dir 2Helical–10/25–Dir 2
j 1 0510
j 2 252525
D i r e j e c t 222
Rotational speed0–6000
Disclaimer/Publisher’s Note: The statements, opinions and data contained in all publications are solely those of the individual author(s) and contributor(s) and not of MDPI and/or the editor(s). MDPI and/or the editor(s) disclaim responsibility for any injury to people or property resulting from any ideas, methods, instructions or products referred to in the content.