Abstract
This research explores how RC columns respond to blast-induced dynamic effects, with a novel focus on partially submerged scenarios, bridging a gap between air blast and underwater explosion (UNDEX) research. Using advanced finite element modeling in LS-DYNA, the study captures the unique behavior of RC columns under mixed-media conditions, where shockwaves propagate through water and air interfaces. Comprehensive parametric analyses explore the influence of charge size, blast stand-off, and depth of water, revealing distinct dampening mechanisms and structural responses. Key findings include a measurable reduction in peak displacement of partially submerged explosions compared to fully submerged explosions, attributed to the moderating effects of the water–air interface. A total of 60 simulation cases were conducted to systematically analyze partially submerged scenarios, providing robust insights into energy transmission and damage mechanisms. The numerical models, validated against published experimental data by others, demonstrate the accuracy of computational modeling in simulating damage profiles, displacement histories, and energy dissipation trends. This research offers practical implications for designing resilient RC structures in coastal and maritime environments. The results contribute significantly to the field of blast mechanics, advancing our understanding of mixed-media shockwave dynamics and their impact on critical infrastructure.
1. Introduction
Reinforced concrete (RC) columns are critical load-carrying structural components widely used in civil engineering, including bridges, buildings, marine structures, and high-piled wharves. Their structural integrity is of utmost importance, as they are subjected to various loading conditions, ranging from static loads to dynamic events, such as air blasts and underwater explosions (UNDEX). Such extreme loadings, caused either by accidental incidents or deliberate attacks, pose significant risks to infrastructure. Consequently, understanding the behavior and failure mechanisms of RC columns under such dynamic loads has been a subject of intensive research for a few decades.
1.1. Behavior of RC Columns Under Air Blast
The dynamic response of RC columns to air blasts involves short-duration, high-intensity shockwaves, which generate compressive stresses and induce rapid structural deformation. The blast wave’s magnitude and impact depend on the stand-off distance, charge weight, and column geometry.
Yuan et al. [1] investigated RC bridge columns subjected to contact explosions and demonstrated that near-surface explosions induce significant local damage, including spalling, shear cracks, and plastic deformation. Their study further indicated that strain rate effects play a critical role in the behavior of reinforced concrete, where material strength increases with the rate of loading. Similarly, Bruneau et al. [2,3] experimentally explored blast responses of concrete-filled steel tube (CFST) columns, which exhibit superior energy absorption due to their confining effects and ductility [4].
Complementing experimental work, numerical methods have advanced the understanding of blast effects on RC columns. The Arbitrary Lagrangian–Eulerian (ALE) method and finite element analysis (FEA) have been extensively used to simulate blast-induced pressures and corresponding damage mechanisms. Do et al. [5] applied ALE methods to predict stress wave propagation and observe that column reinforcement ratios and cross-section geometries significantly influence the extent of structural damage. Yi et al. [6] confirmed through numerical models that columns with circular cross-sections outperform square and rectangular columns under blast loads due to the reduction in stress concentrations.
The findings from these studies highlight the need for robust designs incorporating optimized column geometry, improved material properties, and advanced reinforcement detailing to mitigate the impact of air blasts.
1.2. Behavior of RC Columns Under UNDEX
Unlike air blasts, underwater explosions propagate shockwaves more rapidly due to water’s higher density, leading to higher pressures and longer durations. UNDEX generates two distinct dynamic loads on submerged structures: (1) an initial shockwave, which propagates rapidly and causes an instantaneous pressure surge, and (2) a secondary bubble pulsation pressure, which oscillates and exerts cyclic loading on the structure. This combination of loading makes the behavior of RC columns under UNDEX more complex than under air blasts.
The experimental study by Zhuang et al. [7] examined how circular RC columns behave when exposed to underwater blast loading scenarios. They identified three key failure modes: bending failure, bending-shear failure, and punching failure. They showed the severity of damage depends on factors such as explosive charge size, stand-off distance, and column geometry. Notably, they observed that the bending-shear failure was more prominent near the column’s base, where the structural constraints amplify shear stresses.
Yang et al. [8] explored the influence of cross-sectional shapes on RC column behavior under UNDEX conditions. Their findings revealed that circular columns offer superior blast resistance compared to square and rectangular columns due to their reduced wave reflection and uniform pressure distribution. Circular columns minimize stress concentrations and allow for a more even transfer of shockwave energy, resulting in lower damage levels.
Moreover, numerical simulations have been pivotal in capturing the complex interaction between underwater shockwaves and RC structures. Wang et al. [9] employed coupled Lagrangian–Eulerian methods to simulate the dynamic responses of submerged RC columns. Their results demonstrated that bubble pulsation significantly affects structural integrity, particularly when the detonation depth is shallow. Numerical findings also emphasized that increasing the reinforcement ratio and employing advanced materials, such as high-performance concrete, could improve the blast resistance of RC columns.
1.3. Material Models for Concrete
Concrete’s response to high strain rates and pressures under blast loading requires sophisticated material models that account for its brittle behavior, strain-rate sensitivity, and damage evolution. The Johnson–Holmquist (JH) [10] model is widely used to represent concrete behavior under dynamic conditions, such as air blasts and underwater explosions. This model incorporates three primary aspects: (1) strength enhancement due to pressure, (2) damage accumulation, and (3) strain rate effects.
The JH model has been validated in numerous studies for its ability to predict concrete failure under extreme loading. For instance, Li et al. [11] applied the JH model to simulate concrete slabs subjected to blast loads and successfully captured spalling, cratering, and shear cracking observed in experimental tests. The model’s versatility in predicting damage under both compressive and tensile stresses makes it suitable for simulating RC columns under dynamic loads.
The Riedel–Hiermaier–Thoma (RHT) [12,13] model enhances the original Johnson–Holmquist formulation by including three distinct failure surfaces: elastic limit, failure boundary, and post-failure strength. This allows the RHT model to capture the gradual loss of strength and stiffness in concrete as damage evolves [12,13]. Numerical simulations using the RHT model have demonstrated improved accuracy in predicting concrete failure under combined shockwave and bubble pulsation pressures, as observed in UNDEX scenarios.
Owing to its computational benefits, the Karagozian & Case Concrete (KCC) material formulation is frequently adopted for simulating reinforced concrete components. It has been proven capable of replicating most of concrete’s key behaviors including softening, rate effects, shear dilatancy and facture [14].
In LS-DYNA, a variety of constitutive models are implemented to simulate the mechanical behavior of concrete. To accurately simulate the mechanical behavior of concrete and steel under blast loading, appropriate constitutive material models are applied. This study employs the K&C-based MAT_72_REL3 material model *MAT_CONCRETE_DAMAGE_REL3 to replicate concrete’s high strain-rate behavior in LS-DYNA. This model incorporates strain-rate effects, damage softening, and plasticity, enabling realistic simulations of concrete under high-pressure, short-duration loads.
1.4. Material Models for Reinforcing Steel
Reinforcing steel in concrete columns plays a crucial role in resisting tensile stresses and providing ductility under dynamic loads. Under blast loading, steel undergoes significant strain hardening, thermal softening, and rate-dependent yielding. The dynamic response of reinforcing steel is often modeled using the Johnson–Cook formulation [15,16], which incorporates strain-rate effects, thermal influences, and plastic flow characteristics.
Huang et al. [17] applied the Johnson–Cook model to simulate reinforcing steel behavior in RC columns subjected to air blasts. Their results highlighted that steel reinforcement effectively mitigates tensile cracking and delays structural failure when combined with high-strength concrete. Additionally, numerical findings demonstrated that increasing the reinforcement ratio enhances column ductility and energy absorption capacity under extreme loads.
In LS-DYNA simulations, reinforcing steel behavior under extreme dynamic loads is typically modeled using the MAT_PIECEWISE_LINEAR_PLASTICITY model (MAT_024), particularly blast scenarios. Based on the von Mises yield criterion and elastic–plastic material theory, it captures the effective stress–strain response with high fidelity. A key feature is its ability to model strain-rate sensitivity through user-defined stress–strain curves at various strain rates. The model also supports elastoplastic and bilinear hardening, isotropic hardening, and failure criteria, enabling accurate prediction of steel behavior under severe loading conditions [18,19].
In the present model, the steel reinforcement was simulated using the MAT_PIECEWISE_LINEAR_PLASTICITY material in LS-DYNA. While the model supports defining stress–strain relationships at multiple strain rates, we opted for a bilinear approach where only the Young’s modulus and tangent modulus were defined, following the precedent in Yuan et al. [1]. To incorporate strain-rate sensitivity, we applied a dynamic increase factor (DIF) based on the empirical relation proposed by [20,21]:
where is the strain rate and a is an empirically determined exponent that varies for yield and ultimate strengths. This approach provided a computationally efficient and physically meaningful representation of reinforcement behavior under dynamic blast conditions.
1.5. Focus of This Paper
While prior studies have explored the response of RC columns to air blasts and underwater detonations, critical gaps in understanding still persist. A key area of limited understanding is the dynamic response of RC columns subjected to partially submerged explosive loading. This mixed-media scenario, which combines the complexities of air and underwater blasts, introduces unique interactions at the water–air interface. These interactions result in distinctive shockwave propagation patterns and structural responses that differ markedly from those observed in air blasts or fully submerged conditions. This study addresses these gaps through parametric investigation into the dynamic response of RC columns under partially submerged explosive scenarios.
In addition, this research validates advanced finite element models by comparing them with published experimental data by [1,7], demonstrating their effectiveness in accurately capturing damage profiles, displacement–time histories, and energy dissipation mechanisms. These findings not only bridge the knowledge gap between air blast and UNDEX studies but also provide valuable insights for designing blast-resistant RC structures, particularly in coastal and maritime environments where partially submerged conditions are often encountered. The outcomes of this work establish a solid foundation for future experimental validations and extend the applicability of existing modeling techniques to this previously uncharted area of study.
2. Air Blast Studies
Advanced numerical simulations are utilized to examine how RC columns respond to air blast effects. This section describes the development and validation of the numerical model using LS-DYNA R14 software, a widely recognized tool for simulating dynamic and high-impact loading conditions. The numerical model was validated using the experimental work by Yuan et al. [1] to ensure the model’s accuracy in predicting the damage mechanisms, deformation behaviors, and dynamic responses of RC columns under air blast loading.
2.1. Numerical Model Development
Geometry and Meshing
The RC column setup is based on the experimental design by Yuan et al. [1], featuring a 3700 mm tall circular section with a 400 mm diameter. It includes 12 mm longitudinal bars and 8 mm stirrups spaced at 100 mm intervals to withstand blast-induced axial and dynamic forces. A square foundation with dimensions of 1000 mm × 1000 mm × 500 mm is included to simulate realistic boundary constraints and load transfer mechanisms.
To accurately model localized damage, a multi-resolution mesh strategy is employed: Near the TNT and column surface, 8 mm fine meshes are used, while 20 mm vertical mesh spacing is applied to regions away from the primary impact area. A mesh density of 25 mm was used for the column foundation, whereas a 50 mm coarser mesh was assigned to the surrounding ground domain. This meshing strategy ensures computational efficiency while maintaining high accuracy. Figure 1a–c illustrate the geometry and meshing of the air blast model, including the ground surface, TNT, and the air domain used for the simulations. The internal reinforcement layout is depicted in Figure 1c,d showing the arrangement of longitudinal bars and lateral stirrups embedded within the concrete matrix.
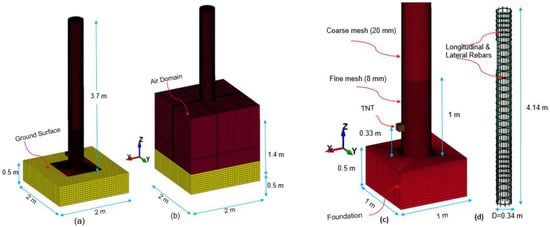
Figure 1.
Meshing configuration for the air blast setup: (a) the ground region (b) the surrounding air domain, (c) column foundation, TNT, fine, and course meshes, (d) longitudinal, and lateral reinforcements.
Note that in Figure 1c the 1 m dimension refers to the fine mesh zone of the concrete column, not the explosive zone. The explosive is located 0.33 m above ground within an air domain that extends to a total height of 1.4 m.
Note that to ensure consistency with referenced experimental studies (e.g., Yuan et al. [1], Zhuang et al. [7]), multiple unit systems including meters (m), centimeters (cm), and millimeters (mm) are selectively adopted throughout the article.
The meshing strategy allows realistic simulation of reinforcement-concrete interaction under blast loads. The CONSTRAINED_BEAM_IN_SOLID keyword was employed to define the coupling between the embedded reinforcement (beam elements) and the surrounding concrete (solid elements), enforcing a perfect bond condition. This approach ensured consistent displacement transfer between concrete and steel during dynamic loading. For the air blast analysis, 1,677,589 finite elements were generated. Table 1 outlines the associated geometry, mesh sizes, and element types used.

Table 1.
Specifications of dimensions and meshing used for air blast modeling.
Material Models
This study employs MAT_72_REL3 as the concrete model, with material properties defined by a uniaxial compressive strength of 38.5 MPa and a density of 2400 kg/m3.
The MAT_024 material model, representing piecewise linear plasticity, is used to simulate reinforcing steel response. The longitudinal bars have a yield strength of 400 MPa, while stirrups exhibit a yield strength of 300 MPa.
TNT explosives are modeled using the Jones–Wilkins–Lee (JWL) equation of state and represented in LS-DYNA by the *MAT_HIGH_EXPLOSIVE_BURN formulation to simulate detonation behavior. Figure 2 presents the ALE solid meshing used for the air domain and TNT explosive elements.
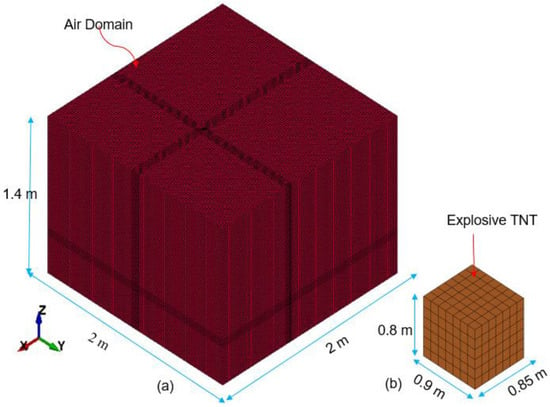
Figure 2.
(a) ALE solid air elements air (774, 163 elements), (b) ALE solid TNT (294 elements).
The JWL EOS establishes a relationship between pressure (), relative volume (), and energy density (), enabling the simulation of explosive behavior. Equation (1) formalizes this model to describe detonation physics as cited in [1,22].
In this formulation, denotes the hydrostatic pressure, is the relative expansion ratio, and represents the initial energy per unit volume. Parameters , , , , and are material-specific constants. Table 2 lists the TNT-specific values applied in this study as referenced in [1,9].

Table 2.
Input parameters for TNT material model.
Air behavior is represented as an ideal gas using the *MAT_NULL model with a linear polynomial EOS based on energy density (). Equation (2) provides the mathematical expression for pressure response, reflecting the thermodynamic behavior of air [22].
The constants through define polynomial terms in the EOS, with μ = ρ/ρ0 − 1 expressing the density ratio. In this model, , , , , and are zero, while , , and ( − 1) are set to 0.4 as used in Equation (3) to model ideal gas response.
In this analysis, the specific heat ratio γ, air density of 1.29 kg/m3, and internal energy density of 0.25 MPa are defined to characterize the thermodynamic state of air.
Equation (2) represents the general polynomial equation of state applicable to compressible materials, while Equation (3) is a simplified version used for ideal gases such as air. Specifically, by setting all parameters in Equation (2) to zero except for and , and applying ideal gas assumptions, Equation (3) is derived to describe the pressure–energy relationship in air.
2.2. Boundary Conditions and ALE for Air Blast Simulation
Boundary Conditions
The boundary conditions replicate the constraints in the experimental setup reported in Yuan et al. [1]. The column’s foundation is fully constrained using BOUNDARY_SPC_SET to fix all translational and rotational degrees of freedom. The RC column’s top and bottom nodes are constrained with fixed boundary conditions in this simulation. Figure 3a illustrates the top and bottom fixed boundary conditions applied to the model, which ensure structural stability under air blast loading.
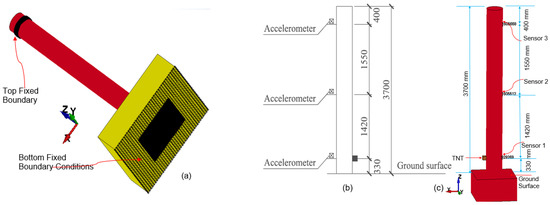
Figure 3.
(a) Top and bottom fixed boundary conditions, (b) schematic representation of accelerometer layout used in the experimental setup (used with permission [1]), (c) representation of numerical sensors in LS-DYNA (this study).
ALE Method
When simulating fluid-like behavior, Lagrangian methods, where mesh deformation mirrors material deformation, can become inaccurate due to large distortions. Such distortions can lead to progressively smaller explicit time steps, eventually causing numerical instability [23].
The Arbitrary Lagrangian–Eulerian (ALE) technique serves as a more suitable and effective strategy for modeling fluid and fluid-like behaviors. This method allows material to move or be advected through a computational mesh that can remain fixed (Eulerian) or be adaptively moved based on user-defined parameters (ALE formulation). By decoupling mesh motion from material deformation, the ALE approach enhances numerical stability and provides a more accurate representation of complex fluid–structure interactions encountered in high-deformation environments [24].
The LS-DYNA framework allows the integration of both Lagrangian and Eulerian/ALE methods within a single model, facilitating the simulation of fluid–structure interaction through a coupling algorithm. Structural components, such as metallic or RC elements, which undergo moderate deformation, can be modeled using Lagrangian elements. Meanwhile, fluids such as air, water, and explosives like TNT are better represented using Eulerian/ALE elements. This hybrid approach offers a comprehensive solution for simulating the complex interactions between fluids and structures within LS-DYNA [25].
In this study, the air blast loading is simulated using the ALE method, which allows for fluid–structure interaction (FSI). ALE coupling ensures that the blast wave generated by the TNT explosion propagates through the air domain and interacts realistically with the RC column. The TNT charge, weighing 1.0 kg, is positioned 330 mm away from the column’s front surface (Figure 1c), consistent with the experimental configuration [1].
The modeled air domain spans 2000 mm × 2000 mm × 1400 mm, featuring a refined mesh density of 20 mm away from the explosive and 12 mm in the region near the TNT charge. The detonation of TNT initiates a spherical shockwave, which propagates radially, impacting the column surface and inducing compressive stresses, spalling, and cracking.
2.3. Validation of Numerical Model
Damage Profiles
Following the accelerometer configuration from [1], three sensor nodes were embedded in the numerical model (Figure 3b) and labeled as Sensor 1, Sensor 2, and Sensor 3 (Figure 3c). These sensors captured vital response parameters, such as acceleration and deflection, during the simulated detonation of 1 kg of TNT.
The numerical model is validated by comparing the damage profiles with the experimental results reported by [1,26]. A damage profile represents the extent of material damage, commonly used in numerical models to predict material failure under various loading conditions. Figure 4i presents experimental results from [1] for circular columns exposed to a 1 kg contact detonation. The observed failure pattern included pronounced surface-level compressive damage, with the affected region spreading about 60 cm along the specimen. Extensive damage was also recorded along the side faces, as shown in Figure 4(iia–iic).
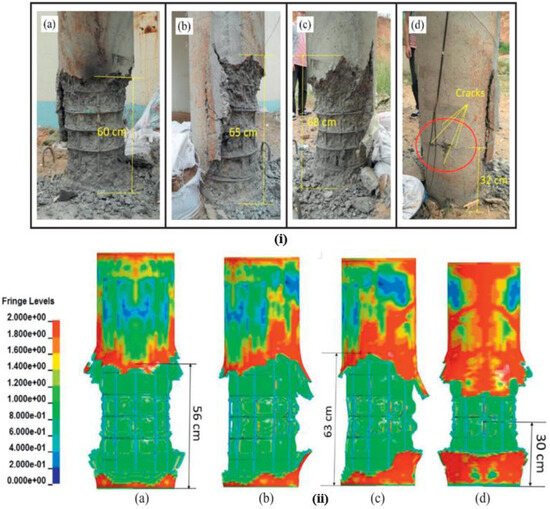
Figure 4.
(i) Photographs of the tested RC column from multiple views, front (a), left (b), right (c), and back (d), (used with permission [1]), and (ii) simulated ALE results (used with permission [1]), including front (a), diagonal (b), side (c), and back (d) views. Plastic strain contours are depicted.
The simulation results replicate these findings with reasonable accuracy. Figure 4ii shows [1] simulation results while Figure 5i presents the numerical results from this study, demonstrating reasonable similar damage distributions. As shown in Figure 5(ia), the front face of the specimen exhibits two distinct failure zones extending vertically. These zones measure 64 cm and 58 cm in height, averaging 61 cm, which closely aligns with the 60 cm experimental damage zone.
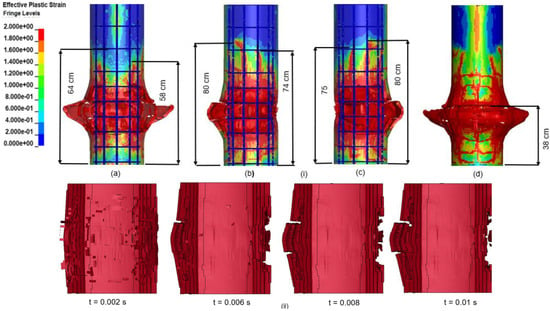
Figure 5.
(i) Simulated ALE-based results from this study, including front (a), left (b), right (c), and back (d) views with plastic strain contours. (ii) illustrates time-dependent propagation of cross-sectional deformation (this study).
The numerical model used in this study shows strong correlation with the experimental damage profiles presented in [1,27]. This agreement supports the model’s reliability and serves as a validation metric.
Cross-Sectional Deformation and Plastic Strain Propagation
Figure 5ii captures the evolving deformation of the RC column at 2, 6, 8, and 10 ms, indicating crack development and localized damage. The blast-induced compressive wave reflects off the free surface, converting into a tensile wave that contributes to failure.
Figure 6 shows the spread of effective plastic strain waves, visualized as scalar fields representing varying deformation intensities. Zero indicates no plastic strain, while larger values reflect greater plastic deformation. The peak plastic strain reached in this simulation is 2.0 (200%).
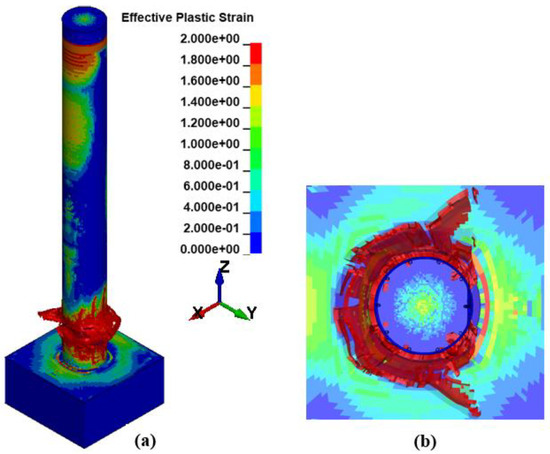
Figure 6.
Illustrates the propagation of effective plastic strain waves, shown through (a) an isometric view and (b) a top-down perspective (this study).
The cross-sectional deformation and effective plastic strain wave propagation described above further illustrate the alignment between the numerical simulation results of this study and the experimental findings from Yuan et al. [1].
Dynamic Response and Energy Dissipation
Figure 7a shows the acceleration–time histories reported by Yuan et al. [1], while Figure 7b presents the numerical results from this study. Both sets of results exhibit consistent trends and closely match peak accelerations, with a variation of only 4.4%.
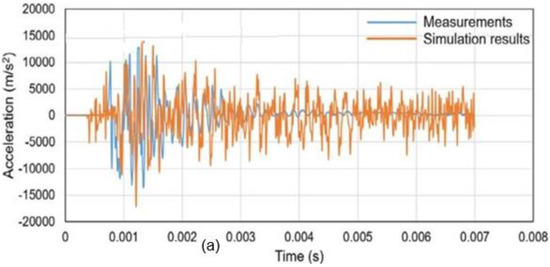
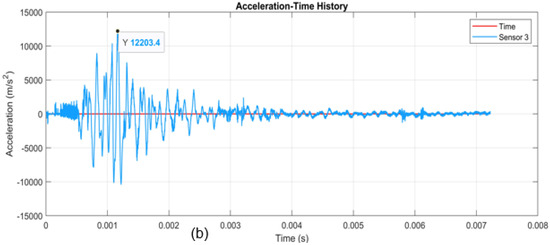
Figure 7.
(a) measured and simulation acceleration–time histories for circular column (used with permission [1]); (b) simulation results of acceleration–time history (Sensor 3, this study).
The column’s acceleration response from the numerical model was compared with experimental data for further validation. The time history of lateral accelerations provides insights into the intensity and duration of lateral forces, enabling analysis of the initiation, peak, and decay phases of the structural response. The initiation phase marks the immediate impact of lateral forces, the peak phase highlights maximum accelerations which are critical for assessing structural integrity, and the decay phase reflects the dissipation of forces and damping of vibrations.
To compare with the experimental setup, numerical Sensor 1 (330 mm), Sensor 2 (1750 mm), and Sensor 3 (3300 mm) were selected, as shown in Figure 3b,c. Data from these sensors served as reliable metrics for evaluating the model’s ability to capture the dynamic behavior of the column under a contact explosion.
Figure 7a compares Yuan et al.’s [1] experimental acceleration time history with their numerical results, while Figure 7b presents the results from this study. The simulated and experimental acceleration results show strong agreement in peak values and overall response patterns. Yuan et al. [1] observed peaks of 12,769 m/s2 (experiment) and 13,788 m/s2 (simulation) in Figure 7a, while this study’s Sensor 3 measurement yielded a peak of 12,203 m/s2 (Figure 7b). The 4.4% deviation is likely due to differences in experimental setups, materials, and modeling assumptions.
The agreement between the experimental and numerical results demonstrates the model’s effectiveness in replicating peak accelerations and capturing overall trends. These observations validate the predictive strength of the numerical model and highlight its applicability in assessing structural dynamics triggered by near-field detonation scenarios.
This model also evaluates energy dissipation during the blast loading phase, as shown in Figure 8, which illustrates the variations in kinetic and internal energy over time. A rapid transfer of kinetic energy into internal energy occurs as the column absorbs the blast impact.
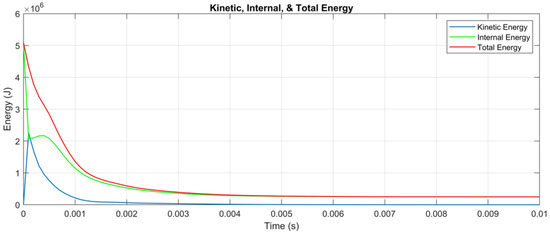
Figure 8.
Energy dissipation results, including kinetic, internal, and total energy trends for blast wave propagation (this study).
With increasing distance from the blast center, the shockwave pressure diminishes swiftly in proportion to the cube of the radius, largely due to wavefront divergence and thermal energy losses in the surrounding air. The pressures decay exponentially over time, with a lifespan typically measured in ms [28]. According to [29], the destructive intensity of a blast wave at a given range is governed by the energy released during the early detonation phase, which drives the displacement of gaseous products and neighboring materials.
In Figure 8, the blue curve represents kinetic energy, which rises sharply during the initial phase as the wave propagates and transfers energy to the surrounding material. After the peak, kinetic energy dissipates rapidly due to resistance from the medium, structural damping, and conversion into internal energy and heat. This sharp rise and decay align with theoretical shockwave behavior, where energy is quickly imparted and then dissipated.
The green curve represents internal energy, which initially increases as the column absorbs blast energy. This corresponds to material deformation, heat generation, and processes like crack propagation. Internal energy decays more gradually than kinetic energy, reflecting the slow dissipation of energy through material damage, plastic deformation, and internal friction, consistent with typical material responses under shock loads.
The red curve represents total energy, which remains nearly constant in the early stages as it includes both kinetic and internal energy. Over time, total energy decreases slightly, reflecting dissipation through heat transfer, radiation, and other mechanisms. This conservation of energy aligns with theoretical expectations for shockwave behavior.
The graph shown in Figure 8 effectively captures the expected behavior of kinetic, internal, and total energy during shockwave propagation. The observed trends in the numerical results align closely with the general principles of shockwave theory, confirming the reliability of this numerical model in simulating the energy dynamics of TNT contact explosions on RC columns.
3. Underwater Explosion (UNDEX) Studies
This section provides the modeling and validation of UNDEX responses for RC columns. The process utilizes LS-DYNA’s ALE method for numerical simulations, calibrated against the experimental work of Zhuang et al. [7]. The unique characteristics of UNDEX, such as shockwave propagation through water, bubble pulsation effects, and fluid–structure interactions, are emphasized [30]. Key aspects of the UNDEX model, including geometry, meshing, boundary conditions, and ALE coupling, are discussed, highlighting the distinctions from air blast modeling.
3.1. Numerical Model Development
Geometry and Meshing
The geometry developed here follows the experimental setup reported in Zhuang et al. [7] to ensure direct comparison. The RC column is 2.7 m high with a diameter of 0.1 m and has enlarged end sections measuring 0.3 m in diameter. The longitudinal reinforcement consists of 8 HRB335 ribbed bars with diameters of 6 mm, while stirrups are spaced at 100 mm intervals.
Figure 9 illustrates the geometry and meshing details for the concrete column, longitudinal rebars, stirrups, ALE water, and air meshing. A multi-scale mesh strategy is employed, with finer elements near the TNT charge and water–column interface to capture localized damage, while coarser elements are used elsewhere to optimize computational efficiency.
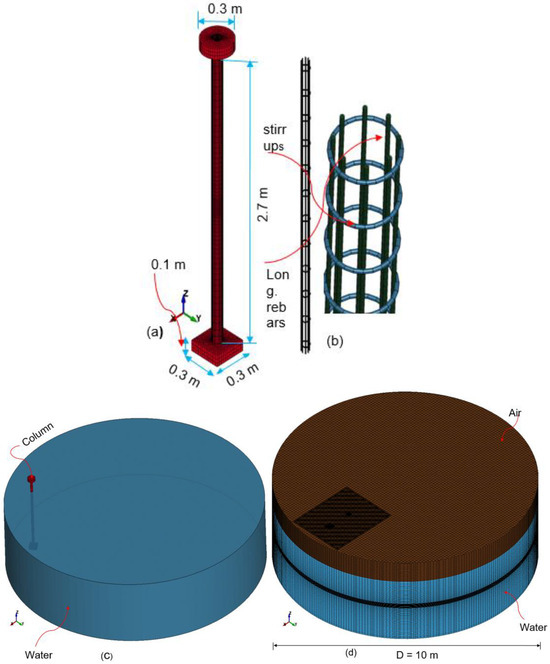
Figure 9.
Geometry and meshing configuration for the UNDEX setup: (a) concrete column; (b) long rebars and stirrups; column and water; (c, d) ALE solid water and air meshing [7].
The water domain consists of a cylindrical containment volume, measuring 10 m in diameter and 2.25 m in depth. A buffer layer of sand is incorporated at the base to attenuate wave energy and reflect experimental test conditions. Figure 9c shows the water model and the RC column submerged within the water domain and seen above the free water surface. Figure 9d illustrates the meshing of the water and air in the ALE framework.
To provide a clearer understanding of the model’s configuration, Figure 10b presents a cross-sectional view, highlighting the relative positions of the column, water, and air, while Figure 10a illustrates the water tank utilized in the LS DYNA UNDEX modeling.
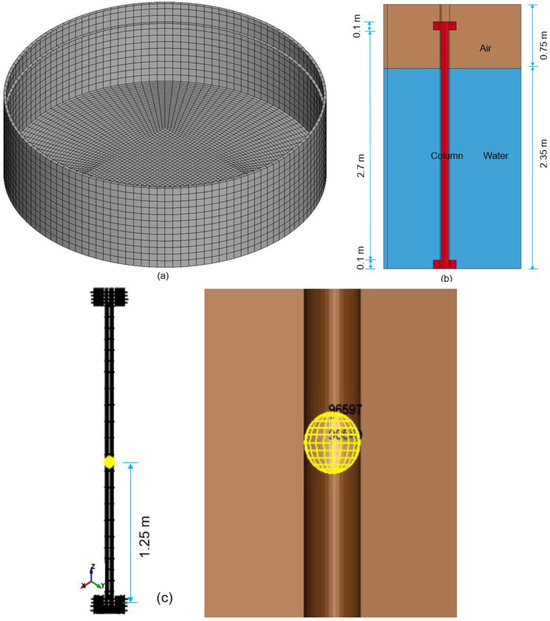
Figure 10.
(a) Schematic of the water tank, (b) section view illustrating column, water, and air layers, (c) TNT placement along the column and within the water medium, with a horizontal stand-off distance of X = 1.0 m and a vertical depth of Z = 1.25 m (equivalent to H = 1.0 m from the water surface) [7].
To maintain consistency with validation data and to minimize unwanted boundary effects, the detonation depth was fixed at 1.25 m from the tank bottom (mid-column height) in all simulation scenarios.
The geometry and meshing of various components are generated similarly to the air blast study and are summarized in Table 3.

Table 3.
Details of dimensions and meshing employed for UNDEX modeling.
Material Models
The MAT_72_REL3 concrete model is used in the UNDEX analysis, incorporating a compressive strength of 52 MPa, tensile strength of 4.68 MPa, material density of 2300 kg/m3, and a Poisson’s ratio of 0.2, consistent with experimental results by Zhuang et al. [7].
These parameters are calibrated to represent conventional concrete with a compressive strength of 52 MPa and are derived based on guidance from the LS-DYNA Keyword User Manual and calibration procedures by [21,31]. The parameters include strength surface coefficients, damage scaling factors, failure cutoffs, and localization width, and reflect a systematic approach for generating meridian plane surfaces and rate-dependent behaviors typical of reinforced concrete. Although Xu and Wille’s procedure was originally designed for UHPC, it is adapted here for normal-strength concrete.
Reinforcement bars and stirrups in RC elements are modeled using *MAT_024, accounting for strain rate effects in dynamic loading.
The numerical model represents both water and air using *MAT_NULL (MAT_009) in conjunction with a linear polynomial form of the Equation of State (EOS). The EOS_GRUNEISEN model is used for water, with parameters including a sound speed c = 1480 m/s, Gruneisen coefficient γ0 = 0.4934, and other material-specific constants a, S1, S2, S3 as listed in Table 4.

Table 4.
EOS_GRUNEISEN Model (Seetamsetti, 2012 [32]).
The water material uses a mass density of 1000 kg/m3 and a viscosity coefficient (MU) of 8.900 × 10⁻⁴. For the EOS of air, the model applies an initial internal energy of 2.5 × 10⁵ J/kg. The TNT charge weighs 0.80 kg and uses a mass density (R0) of 1630 kg/m3 and a detonation velocity (D) of 6930 m/s. It is modeled with MAT_HIGH_EXPLOSIVE_BURN, employing the JWL EOS to define the relationship between pressure, relative volume, and energy during detonation.
To enhance reproducibility and clarity of the material model used for the structural concrete, the complete set of input parameters applied in the Karagozian & Case Concrete Model (MAT_72R3) is provided in Table 5.

Table 5.
Material Parameters for the Karagozian & Case Concrete (KCC) Model.
In this study, the water domain is modeled as fresh water with a density of 1000 kg/m3, consistent with the experimental setup reported by Zhuang et al. [7], which serves as the validation benchmark for the numerical simulations. While this assumption aligns with the controlled laboratory conditions of the reference experiment, the authors acknowledge that real-world offshore or marine structures are typically exposed to seawater, which has a higher density and different acoustic properties. Future modeling efforts may consider seawater domains to better represent such marine applications.
3.2. Boundary Conditions
To replicate the experimental setup, the column is constrained at both ends using *BOUNDARY_SPC_SET. Additionally, the tank bottom is restricted against translation in the x, y, and z directions, while allowing unrestricted rotation about all axes. For the tank wall, the boundary conditions restrict translation in the local x and y directions, allowing free rotation in all directions. Figure 11 illustrates these boundary conditions.
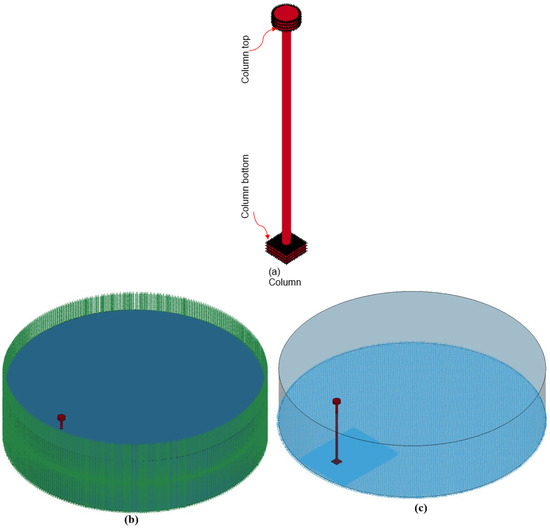
Figure 11.
Boundary conditions in UNDEX modeling. (a) Column bottom and top fixed (shown in red); (b) tank wall restricts translation (x, y) with free rotation (shown in green); (c) tank bottom constrained in translation (shown in blue) (x, y, z) with free rotation.
3.3. TNT Placement and ALE Coupling
In the experimental setup by [7], the TNT explosive charge is positioned at specific detonation depths below the water surface using a suspension device designed for this purpose. This study examines different experimental setups by varying explosive mass (W), stand-off distance (R), and detonation depth (H) to evaluate how each parameter affects the test outcomes.
In this numerical study, the TNT explosive charge is modeled using the JWL Equation of State (EOS) to accurately represent its detonation properties. Specifically, the TNT is defined in LS-DYNA using the *INITIAL_VOLUME_FRACTION_GEOMETRY keyword, which ensures correct placement and distribution of TNT material within the water mesh.
The TNT data includes a sphere radius of 0.0489333 m and a density of 1630 kg/m3. The charge remains suspended in the water domain at x = 1.0 m and z = 1.25 m from the column base (or 1.0 m below the water surface), as shown in Figure 10c and based on Zhuang et al. [7].
The ALE coupling is a critical component of the UNDEX model, enabling realistic fluid–structure interactions. In this model, water, air, and TNT are treated as ALE materials, while the RC column and reinforcements are modeled as Lagrangian elements. The interaction across these domains uses the CONSTRAINED_LAGRANGE_IN_SOLID keyword.
The coupling involves two main techniques: the penalty-based method, which penalizes any violation of interaction constraints, and the constraint-based method, which enforces velocity continuity at coupling points. The penalty method is applied for ALE and Lagrangian coupling, while the constraint-based method is used for rebar–concrete interactions. This dual approach ensures that the simulation accurately captures the shockwave propagation, material deformation, and fluid–structure interaction effects [33].
3.4. Model Validation
Displacement–Time Histories
This study verifies and validates the UNDEX model using the same approach as the air blast case, comparing numerical outputs to experimental data from [7].
This study models the UNDEX scenario using a charge weight of W = 0.80 kg, a stand-off distance of R = 1.0 m, and a water depth of H = 1.0 m. The resulting numerical simulation produces a displacement–time response with a peak value of 52.33 mm, as shown in Figure 12. This peak displacement is compared with the experimental result from Zhuang et al. [7], which reports a maximum displacement of 52.92 mm. The close proximity of these values yields a deviation of only 1.11%, demonstrating strong agreement between the numerical and experimental outcomes.
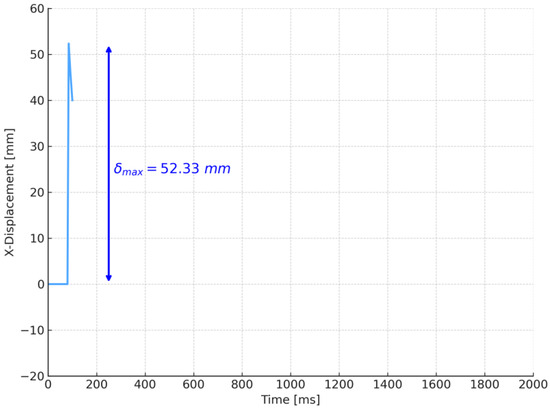
Figure 12.
Peak displacement–time history obtained from the numerical UNDEX model developed in this study for a charge weight of W = 0.8 kg.
To enhance computational efficiency, the simulation run time in this study was limited to 100 ms, as shown in Figure 12, whereas Zhuang et al.’s [7] experiments extended the recording period beyond the peak displacement to approximately 2000 ms.
The numerical model is shown to be reliable in simulating the dynamic response of RC columns under UNDEX scenarios.
4. Partially Submerged Explosion Studies
This parametric study investigates the response of reinforced concrete (RC) columns subjected to explosive loading under unique scenarios of partially submerged explosions, a relatively unexplored area in the existing literature. The simulation uses LS-DYNA to analyze how stand-off distance, charge size, and water depth affect the structural response of RC columns. Unlike fully submerged (UNDEX) or air blast scenarios, partially submerged explosions introduce complex interactions between water, air, and the explosive charge. These interactions result in distinct shockwave propagation patterns and damage mechanisms, offering new insights into the behavior of RC columns under such conditions.
To guide the investigation, this study employs a systematic parametric sampling strategy designed to comprehensively examine the influence of three critical parameters, stand-off distance (R), water depth (Z), and TNT charge weight (W), on the structural response of RC columns subjected to both contact and non-contact underwater explosions. The research design ensures balanced and physically meaningful coverage across a spectrum of blast scenarios, bridging fully submerged and near-surface detonation regimes. Particular emphasis is placed on partially submerged configurations, which represent a transitional and underexplored regime in the existing literature and exhibit hybrid blast behaviors distinct from traditional UNDEX or air blast conditions.
4.1. Validated Models for Parametric Study
This study adapts the validated UNDEX model from Section 3 and examines 60 simulation cases using charge weights of 0.40, 0.80, and 1.20 kg, stand-off distances of 0, 0.50, 1.0, and 1.5 m, and water depths of 2.25, 1.75, 1.24, 0.75, and 0.25 m.
To enhance computational efficiency, the original water tank with a 10 m diameter and 3.1 m height is downsized to a compact cubic model measuring 3 m × 3 m × 3 m, as illustrated in Figure 13. This reduction preserves simulation accuracy while minimizing computational demands. This reduced model maintains simulation accuracy while minimizing computational demand. The 60 simulation cases presented in Table 6 systematically vary explosive weight, stand-off distance, and water depth to analyze their effects on RC column behavior.
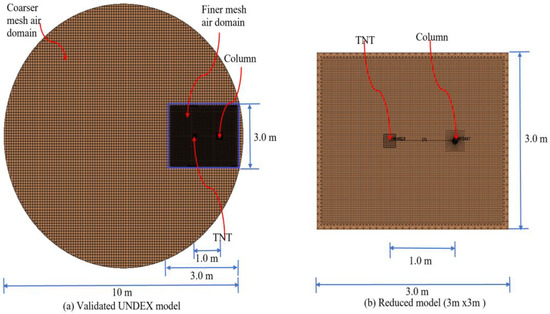
Figure 13.
Validated and reduced models for parametric study. (a) The validated UNDEX model with the finer air domain shown in blue-black color; (b) the reduced model (shown in brown color).

Table 6.
Input parameters and configuration of 60 parametric simulation scenarios.
Figure 14 illustrates a representative case in which the height of the water surface varies, while the stand-off distance (R = 1.0 m), detonation depth (Z = 1.25 m), and TNT charge-weight (W = 0.40 kg) remain fixed. Specifically, in case 08 where Z = 1.25 m, the water surface aligns exactly with the RC column’s midpoint.
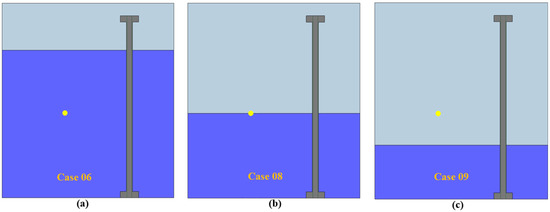
Figure 14.
Variation in height of water surface at constant, (stand-off) R = 1.0 m, (depth of detonation) H =1.25 m, and (weight of TNT) W =0.40 kg. (a) Water surface = 2.25 m (underwater explosion (UNDEX)); (b) water surface = 1.25 m (partially submerged explosion); (c) water surface = 0.75 m (air explosion).
In the partially submerged scenario, the TNT explosive remains half in the air and half in the water. For this setup, the *INITIAL_VOLUME_FRACTION keyword cannot define the TNT sphere for both fluids. Instead, the entire domain is defined as air to represent the explosive, and the *SET_SEGMENT keyword is used to model the water surface. In all other scenarios, the TNT is either fully submerged below or entirely positioned above the waterline.
The parametric analysis considers three explosive cases: underwater (UNDEX), partially submerged, and air detonation, as depicted in Figure 14. For each case, both contact and non-contact explosive conditions are included to examine a wide range of interactions.
4.2. Effects of Explosive Weight
The first parameter examined is the weight of the explosive charge. TNT weights of 0.40 kg, 0.80 kg, and 1.20 kg are analyzed while maintaining a constant stand-off distance and water depth. Figure 15 illustrates the relationship between maximum displacement and explosive weight, revealing an exponential increase in column displacement as the TNT weight increases. For instance, a 1.20 kg contact explosion produces a peak displacement of 175 mm, compared to only 82 mm for a 0.40 kg charge.
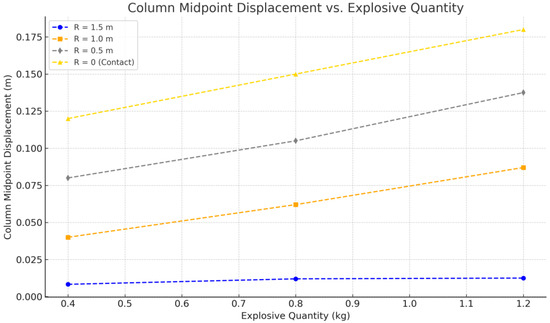
Figure 15.
The plot shows how maximum displacement at the column midpoint varies with explosive charge weight.
These findings align with expectations, as greater TNT weights generate higher energy, leading to more significant structural responses. The data also trends exponentially, confirming that the relationship between explosive weight and displacement is nonlinear. This behavior is attributed to the amplified energy transmission at higher explosive weights, resulting in more extensive damage to the RC column.
4.3. Effects of Stand-Off Distance
The study evaluates how stand-off distance (R), ranging from 0 m for contact explosions to 1.5 m for non-contact blasts, influences the column’s structural response. Figure 16 demonstrates a significant reduction in displacement as stand-off distance increases [34]. Note that the lines in Figure 16 represent exponential regression curves fit to discrete simulation data points (markers) to reflect the nonlinear relationship between stand-off distance and column displacement. Small deviations between markers and lines are expected due to curve fitting and do not indicate inconsistencies in the simulation results.
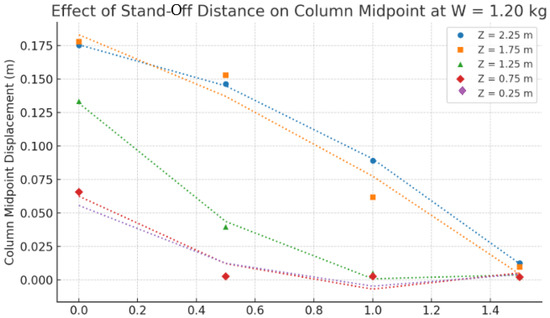
Figure 16.
Effects of Stand-Off distance.
This trend, also shown in Figure 17, is consistent with established principles of blast mechanics, where increasing the stand-off distance reduces the intensity of shockwave impact on the structure. However, an interesting observation emerges for partially submerged explosions (Z = 1.25 m), where the reduction in displacement is more pronounced. As shown in Figure 16, the midpoint displacement decreases by approximately 80% when the stand-off distance increases from 0.5 m to 1.5 m. This behavior highlights the dampening effect of the water–air interface, which attenuates the shockwave as it propagates through mixed media.
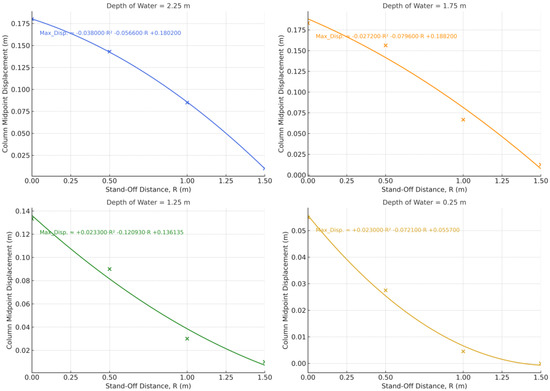
Figure 17.
Trend in column midpoint response as a function of stand-off distance for an explosive charge of W = 1.20 kg. Note that each color represents a specific water depth, and ‘x’ markers denote the coordinate points used for polynomial fitting.
Note that the coefficients of determination (R2) for the nonlinear curve fits confirm the exponential nature of the blast response attenuation trendlines across different water depths. Note also that the R2 value for the case Z = 0.25 m appears low due to the minimal variation in the displacement response, which results in a flat trend curve. However, this reflects the physical damping behavior in shallow water conditions and does not undermine the consistency of the observed trend.
4.4. Effects of Depth of Water
The water depth (Z) varied from 0.25 m (shallow water) to 2.25 m (deep water) to examine its influence on column displacement. Figure 18 shows that increasing water depth leads to higher peak displacements for both contact and non-contact explosions [34]. For instance, at R = 0 (contact explosion), the displacement increases by approximately 37% as the water depth rises from 1.25 m to 2.25 m.
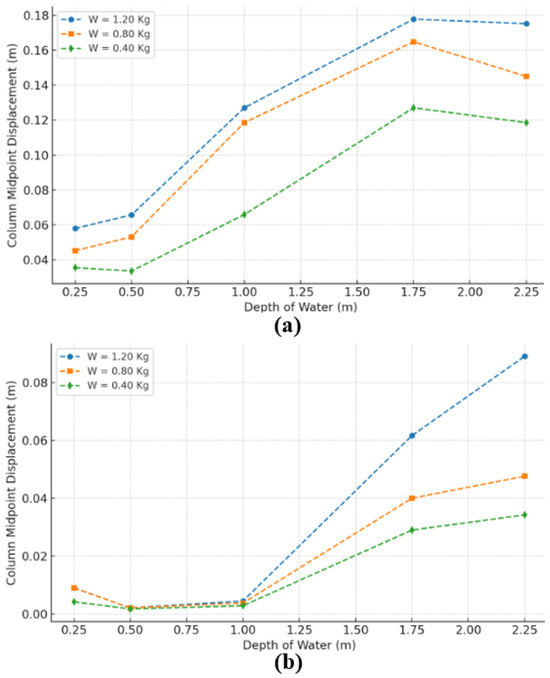
Figure 18.
Column midpoint displacement under varying water depths: (a) R = 0 m (contact explosion); (b) R = 1.0 m (non-contact explosion).
This trend can be explained by the hydrodynamic effects of water. In deeper water, the density and incompressibility of the medium enhance energy transmission, resulting in more significant structural responses. Conversely, shallow water explosions exhibit reduced displacements due to energy dissipation at the water–air interface. The unique behavior of partially submerged explosions (Z = 1.25 m) is particularly noteworthy, as the mixed media introduces complex shockwave reflection and transmission phenomena, reducing peak displacements compared to fully submerged cases.
Figure 18 illustrates the comparison of contact vs. non-contact explosions. Contact explosions (R = 0) involve direct interaction between the explosive force and the target structure, resulting in significantly higher energy transfer and concentrated structural loading. This direct contact maximizes the impulse delivered to the RC column, leading to greater displacements at the column midpoint.
Conversely, in non-contact explosions (R > 0), the energy dissipates as the shockwave travels through the water, reducing its intensity by the time it reaches the column. This dissipation occurs due to the shockwave’s geometric divergence and energy absorption by the surrounding water medium. As a result, non-contact explosions produce lower peak displacements compared to contact explosions. For instance, at a water depth of 2.25 m, the midpoint displacement of the column for a non-contact explosion is approximately 49% lower compared to the contact explosion at the same depth.
The reduction in peak displacements for non-contact explosions is particularly influenced by the stand-off distance and the water’s density and incompressibility. These factors diminish the impulse delivered to the column, demonstrating the attenuating effect of the medium and distance on structural responses.
4.5. Comparison of Partially Submerged Explosions with UNDEX and Air Blast
In a surface explosion, taking place at or near the surface of a medium such as water or soil, the gas bubble vents directly into the atmosphere, preventing the formation of bubble oscillation pressure pulses. Energy transfer primarily occurs through the shockwave, with limited reflection from the free surface. Compared to fully submerged explosions, surface explosions receive less research attention [35].
A recent study by [36] builds upon advancements in underwater explosion simulation using refined interface modeling techniques, with a particular focus on the underexplored regime between surface and submerged detonations. By addressing partially submerged configurations, the current study bridges a critical gap between air blast and fully submerged UNDEX events, contributing to the pioneering characterization of hybrid explosion dynamics.
Unlike a surface explosion, a partially submerged explosion occurs when the explosive charge is positioned at the boundary of water and air, resulting in interactions between two distinct media. In surface explosions, the shockwave mainly propagates through the air, with only a small amount of energy transferring into the water, limiting energy delivery. In contrast, partially submerged explosions involve simultaneous shockwave propagation through both air and water, splitting the energy between the two media and creating distinct reflection and refraction patterns at the water–air interface.
Partially submerged explosions offer a unique and underexplored perspective compared to traditional UNDEX and air explosions. The distinct behavior of partially submerged explosions stems from their dual-medium interaction at the water–air interface, resulting in shockwave dynamics and structural responses that differ significantly from traditional cases. Figure 19 and Figure 20 illustrate these phenomena in non-contact and contact scenarios, highlighting the novel characteristics of partially submerged explosions.
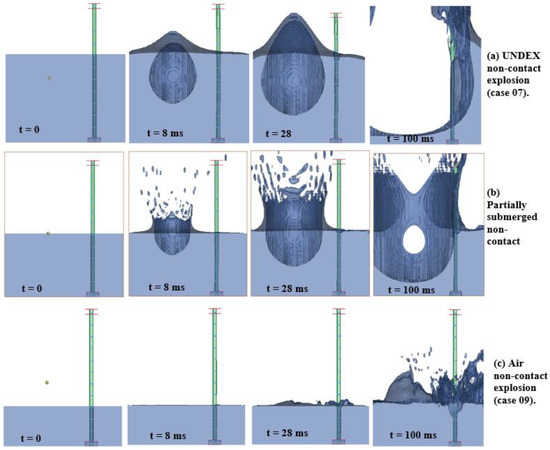
Figure 19.
Non-contact explosion simulation results for (a) UNDEX, (b) partially submerged, (c) air explosions at specified time (t) intervals.
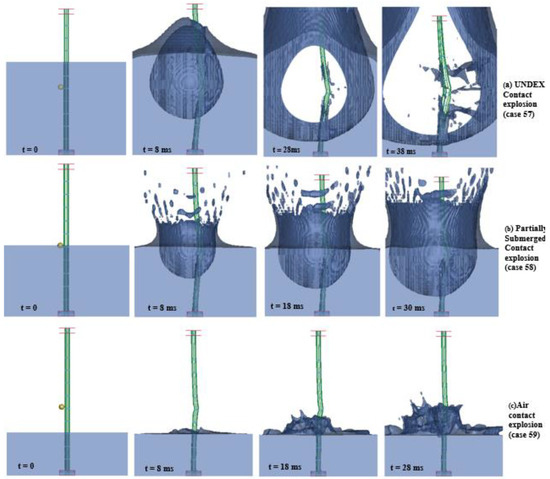
Figure 20.
Contact explosion simulation results for (a) UNDEX, (b) partially submerged, (c) air explosions at specified time (t) intervals.
In partially submerged non-contact explosions, the shockwave splits at the water–air interface, partially reflecting back into the air and partially transmitting it into the water. This dual propagation mechanism sets them apart from UNDEX explosions, where the shockwave fully propagates through water, and air explosions, where propagation is confined to air. The energy division between the two media leads to attenuation compared to UNDEX scenarios. This attenuation results in peak displacements that are lower than those in fully submerged explosions but higher than air explosions, as shown in Figure 19b.
The interface’s dampening effect plays a significant role in reducing the energy transmitted to submerged structures. Additionally, the shockwave at the interface undergoes complex reflection and refraction dynamics, leading to interactions not observed in traditional UNDEX or air explosions. These dynamics contribute to distinct structural responses, including reduced displacements compared to UNDEX explosions. In partially submerged contact explosions, the gas bubble vents rapidly into the atmosphere due to its position at the water–air interface. This rapid dissipation eliminates the oscillatory bubble pulsations characteristic of fully submerged explosions, reducing secondary pressure pulses and associated structural damage.
The water–air interface redistributes explosion energy, unlike fully submerged explosions that amplify shockwave effects within water. Partially submerged explosions divide energy between air and water, reducing shockwave intensity and limiting structural damage. Surface-reflected rarefaction waves, unique to these explosions, further attenuate the shockwave, leading to reduced peak displacements compared to fully submerged cases, as shown in Figure 20.
Partially submerged explosions bridge the gap between traditional UNDEX and air explosions, featuring distinct dual-medium interactions, unique shockwave dynamics, and energy distribution.
4.6. Shockwave Propagation
The propagation of shockwaves in partially submerged explosions is depicted in Figure 21, which shows the interaction between ALE materials (TNT, water, air). As the shockwave reaches the water–air interface, it splits into two components: a compressive wave traveling through water and a reflected rarefaction wave propagating back into the air. This dual behavior influences the overall energy distribution and structural response, resulting in reduced peak displacements compared to fully submerged explosions.

Figure 21.
Pressure shockwave propagation and ALE material interactions (TNT, water, air) with UNDEX simulation results at specified time (t) intervals.
5. Conclusions
This study advances understanding of RC column behavior under dynamic loading, particularly focusing on the unique investigation of partially submerged explosions. Using advanced numerical modeling, validation, and parametric analyses, it bridges key gaps in blast-loading research for RC structures.
This study validates numerical models for air blasts and UNDEX, demonstrating accuracy in replicating critical damage mechanisms observed in experimental tests, such as tensile spalling, fragmentation, and radial cracking in RC columns. The UNDEX model effectively captures the amplified shockwave transmission of water as a high-density medium, with less than 1.2% deviation in maximum displacement values.
By analyzing stand-off distance, water depth, and explosive weight, it identifies distinct RC column behaviors bridging air blast and UNDEX scenarios. The results reveal a 30–80% peak displacement reduction due to the water–air interface’s dampening effects, highlighting the significance of mixed-media environments in moderating shockwave intensity and structural damage.
Through its parametric study, this research reveals a clear exponential relationship between stand-off distance and column displacement for partially submerged explosions. The alignment of these findings with theoretical predictions reinforces the robustness of the models. Additionally, the results emphasize the potential for mitigating damage to critical infrastructure, such as offshore RC bridge columns and maritime transport systems, particularly in the context of emerging security challenges like maritime terrorism.
Author Contributions
All authors contributed to the study’s conception and design. G.A. and G.U. conceptualization, investigation, methodology. G.A. and A.T., formal analysis, numerical modeling, linear and nonlinear simulations and post-processing results. G.A., material preparation, writing—original draft. G.U., review, editing, checking the results, interpreting, and supervision. All authors have read and agreed to the published version of the manuscript.
Funding
This research received no external funding.
Data Availability Statement
The original contributions presented in this study are included in the article. Further inquiries can be directed to the corresponding author.
Conflicts of Interest
The authors declare that they have no conflict of interest.
References
- Yuan, S.; Hao, H.; Zong, Z.; Li, J. A Study of RC Bridge Columns under Contact Explosion. Int. J. Impact Eng. 2017, 105, 133–146. Available online: https://www.sciencedirect.com/science/article/abs/pii/S0734743X17306243 (accessed on 15 April 2021). [CrossRef]
- Bruneau, M.; Shuichi Fujikura, S.; Lopez-Garcia, D. Experimental Investigation of Blast Performance of Seismically Resistant Concrete-Filled Steel Tube Bridge Piers; Technical Report MCEER-07-0005; Multidisciplinary Center for Earthquake Engineering Research: Buffalo, NY, USA, 2007. Available online: https://nehrpsearch.nist.gov/static/files/NSF/PB2008105143.pdf (accessed on 21 January 2022).
- Li, M.; Zong, Z.; Hao, H.; Zhang, X.; Lin, J.; Liao, Y. Post-blast performance and residual capacity of CFDST columns subjected to contact explosions. J. Constr. Steel Res. 2020, 167, 105960. Available online: https://www.sciencedirect.com/science/article/abs/pii/S0143974X19313306 (accessed on 21 May 2025). [CrossRef]
- Li, M.; Zong, Z.; Liu, L.; Lou, F. Experimental and numerical study on damage mechanism of CFDST bridge columns subjected to contact explosion. Eng. Struct. 2018, 159, 265–276. Available online: https://www.sciencedirect.com/science/article/abs/pii/S014102961733198X (accessed on 18 May 2025). [CrossRef]
- Do, T.; Pham, T.; Hao, H. Stress Wave Propagation and Structural Response of Precast Concrete Segmental Columns under Simulated Blast Loads. Int. J. Impact Eng. 2020, 143, 103595. Available online: https://www.sciencedirect.com/science/article/abs/pii/S0734743X19305810 (accessed on 15 March 2022). [CrossRef]
- Yi, Z.; Agrawal, A.; Ettouney, M.; Alampalli, S. Blast load effects on highway bridges. I: Modeling and blast load effects. J. Bridge Eng. 2014, 19, 04013023. Available online: https://ascelibrary.com/doi/10.1061/%28ASCE%29BE.1943-5592.0000547 (accessed on 11 January 2023). [CrossRef]
- Zhuang, T.; Wang, M.; Wu, J.; Yang, C.; Zhang, T.; Gao, C. Experimental Investigation on Dynamic Response and Damage Models of Circular RC Columns Subjected to Underwater Explosions. Def. Technol. 2020, 16, 856–875. [Google Scholar] [CrossRef]
- Yang, G.; Wang, G.; Lu, W.; Zhao, X.; Yan, P.; Chen, M. Cross-Section Shape Effects on Anti-Knock Performance of RC Columns Subjected to Air and Underwater Explosions. Ocean Eng. 2019, 181, 252–266. Available online: https://www.sciencedirect.com/science/article/abs/pii/S0029801818318961 (accessed on 11 May 2021). [CrossRef]
- Wang, Z.; Lu, Y.; Hao, H.; Chong, K. A full coupled numerical analysis approach for buried structures subjected to subsurface blast. Comput. Struct. 2005, 83, 339–356. Available online: https://www.sciencedirect.com/science/article/abs/pii/S0045794904003839 (accessed on 29 March 2022). [CrossRef]
- Holmquist, T.J.; Johnson, G.R.; Cook, W.H. A Computational Constitutive Model for Concrete Subjected to Large Strains, High Strain Rates, and High Pressures. 14th Int. Symp. Ballist. 1993, 2, 591–600. Available online: https://www.tib.eu/en/search/id/BLCP%3ACN008959584/A-Computational-Constitutive-Model-for-Concrete (accessed on 19 September 2022).
- Li, J.; Wu, C.; Hao, H. Investigation of ultra-high performance concrete slab and normal strength concrete slab under contact explosion. Eng. Struct. 2015, 102, 395–408. Available online: https://www.sciencedirect.com/science/article/abs/pii/S0141029615005313 (accessed on 24 February 2023). [CrossRef]
- Borrvall, T. The RHT concrete model in LS-DYNA. In Proceedings of the 8th European LS-DYNA Conference, Strasbourg, France, 23–24 May 2011; Available online: https://www.researchgate.net/publication/263467071_The_RHT_concrete_model_in_LS-DYNA (accessed on 2 April 2022).
- Song, S.; Xu, X.; Ren, W.; Liu, S.; Jiang, J. Determination and application of the RHT constitutive model parameters for ultra-high-performance concrete. Structures 2024, 69, 107488. Available online: https://www.sciencedirect.com/science/article/abs/pii/S2352012424016400 (accessed on 17 March 2025). [CrossRef]
- Wu, C.; Mahmoud, M.M.; Hou, C.C.; Topa, A. Study on the impact performance of RC fences strengthened with high strength strain-hardening cementitious composites. Structures 2022, 41, 349–364. Available online: https://www.sciencedirect.com/science/article/abs/pii/S2352012422004003 (accessed on 11 May 2023). [CrossRef]
- Sirigiri, V.; Gudiga, V.; Gattu, U.; Suneesh, G.; Buddaraju, K. A review on Johnson Cook material model. Mater. Today Proc. 2022, 62, 3450–3456. Available online: https://www.sciencedirect.com/science/article/abs/pii/S2214785322024191 (accessed on 18 May 2023). [CrossRef]
- Lin, Y.; Chen, X.; Liu, G. A modified Johnson–Cook model for tensile behaviors of typical high-strength alloy steel. Mater. Sci. Eng. 2010, 527, 6980–6986. Available online: https://www.sciencedirect.com/science/article/abs/pii/S0921509310007999 (accessed on 27 June 2023). [CrossRef]
- Huang, Z.; Gao, L.; Wang, Y.; Wang, F. Determination of the Johnson-Cook Constitutive Model Parameters of Materials by Cluster Global Optimization Algorithm. J. Mater. Eng. Perform. 2016, 25, 4099–4107. [Google Scholar] [CrossRef]
- Kolling, S.; Haufe, A.; Feucht, M.; Du Bois, P.A. SAMP-1: A Semi-Analytical Model for the Simulation of Polymers; LS-DYNA Anwenderforum: Bamberg, Germany, 2005; Available online: https://www.dynamore.de/de/download/papers/forum05/samp-1-a-semi-analytical-model-for-the-simulation"\l":~:text=From%20a%20practical%20point%20of,focus%20of%20the%20present%20contribution (accessed on 20 July 2022).
- Raman, S.N.; Ngo, T.; Mendis, P.; Pham, T. Elastomeric Polymers for Retrofitting of Reinforced Concrete Structures against the Explosive Effects of Blast. Adv. Mater. Sci. Eng. 2012, 2012, 1–8. Available online: https://onlinelibrary.wiley.com/doi/full/10.1155/2012/754142 (accessed on 18 November 2022). [CrossRef]
- Malvar, L.J.; Crawford, J.E. Dynamic increase factors for steel reinforcing bars. In Proceedings of the 28th DDESB Seminar, Orlando, FL, USA, 18–20 August 1998; pp. 5–6. Available online: https://scholar.google.com/scholar_lookup?title=Dynamic%20increase%20factors%20for%20steel%20reinforcing%20bars&author=L.J.%20Malvar&publication_year=1998&pages=5-6 (accessed on 2 October 2022).
- Livermore Software Technology Corporation. LS-DYNA Keyword User’s Manual (Volume I & II), version 971; Livermore Software Technology Corporation: Livermore, CA, USA, 2007; Available online: https://ftp.lstc.com/anonymous/outgoing/jday/manuals/ls-dyna_971_manual_k_rev1.pdf (accessed on 16 January 2023).
- Tabatabaei, Z.; Volz, J. A Comparison between Three Different Blast Methods in LS-DYNA: LBE, MM-ALE, Coupling of LBE and MM-ALE. In Proceedings of the 12th International LS-DYNA Users Conference Blast/Impact (3), Detroit, MI, USA, 3–5 June 2012; Available online: https://www.dynalook.com/conferences/12th-international-ls-dyna-conference/blast-impact20-d.pdf (accessed on 23 March 2023).
- Nazem, M.; Carter, J.; Airey, D. Arbitrary Lagrangian–Eulerian method for dynamic analysis of geotechnical problems. Comput. Geotech. 2009, 36, 549–557. Available online: https://www.newcastle.edu.au/__data/assets/pdf_file/0015/22272/Arbitrary-Lagrangian-Eulerian-method-for-dynamic-analysis-of-geotechnical-problems.pdf (accessed on 29 August 2022). [CrossRef]
- Cai, Z.; Topa, A.; Djukic, L.P.; Herath, M.T.; Pearce, G.M. Evaluation of rigid body force in liquid sloshing problems of a partially filled tank: Traditional CFD/SPH/ALE comparative study. Ocean Eng. 2021, 236, 109556. Available online: https://www.sciencedirect.com/science/article/abs/pii/S0029801821009458 (accessed on 23 January 2023). [CrossRef]
- Aerospace Working Group. LS-DYNA Aerospace Working Group Modeling Guidelines, version 21-1; Aerospace Working Group: El Segundo, CA, USA, 2021; Available online: https://www.predictiveengineering.com/sites/default/files/MGD_v21-1.pdf (accessed on 17 July 2022).
- Zhao, X.; Wang, G.; Lu, W.; Yan, P.; Chen, M.; Zhou, C. Damage features of RC slabs subjected to air and underwater contact explosions. Ocean Eng. 2018, 147, 531–545. Available online: https://www.sciencedirect.com/science/article/abs/pii/S0029801817306741?via%3Dihub (accessed on 3 February 2022). [CrossRef]
- Xiao, Y.; Zhu, W.; Wu, W.; Guo, P.; Xia, L. Damage modes and mechanism of RC arch slab under contact explosion at different locations. Int. J. Impact Eng. 2022, 170, 104360. Available online: https://www.sciencedirect.com/science/article/abs/pii/S0734743X22002032 (accessed on 19 April 2023). [CrossRef]
- FEMA. Chapter 4 Explosive Blast. In FEMA 426, Reference Manual to Mitigate Potential Terrorist Attacks Against Buildings; The Federal Emergency Management Agency: Washington, DC, USA, 1989. Available online: https://www.fema.gov/pdf/plan/prevent/rms/428/fema428_ch4.pdf (accessed on 13 May 2023).
- Cole, R.H. Underwater Explosions; Princeton University Press: Princeton, NJ, USA, 1948; Available online: https://pubs.aip.org/physicstoday/article-abstract/1/6/35/938876/Underwater-Explosions?redirectedFrom=fulltext (accessed on 13 June 2022).
- Sanders, J.; Urgessa, G.; Löhner, R. Literature Review on the Response of Concrete Structures Subjected to Underwater Explosions. CivilEng 2021, 2, 895–908. Available online: https://www.mdpi.com/2673-4109/2/4/48 (accessed on 15 March 2023). [CrossRef]
- Xu, M.; Wille, K. Calibration of K&C Concrete Model for UHPC in LS-DYNA. Adv. Mater. Res. 2014, 1081, 254–260. [Google Scholar] [CrossRef]
- Seetamsetti, A.S. Comparison of Finite Element Analysis of Impact on Water and Soil Using Lagrangian, ALE, and SPH Approaches and Airframe Impact Applications. Master’s Thesis, Wichita State University, Wichita, KS, USA, 2012. Available online: https://www.semanticscholar.org/paper/Comparison-of-finite-element-analysis-of-impact-on-Seetamsetti/57cb416fdf0cb1fd0ce1fdb349263c082c5d415d (accessed on 7 June 2025).
- Hosseinzadeh, S.; Topa, A.; Tabri, K. A Numerical Sensitivity Analysis of Fluid-Structure Interaction Simulations on Slamming Loads and Responses. In IOP Conference Series: Materials Science and Engineering, Proceedings of the 12th International Workshop on Ship and Marine Hydrodynamics (Iwsh-2023), Espoo, Finland, 28 Augst–1 September 2023; IOP Publishing: Bristol, UK, 2023; Volume 1288, p. 012017. Available online: https://iopscience.iop.org/article/10.1088/1757-899X/1288/1/012017/meta (accessed on 11 June 2023).
- Abyu, G. Finite Element Modeling of Reinforced Concrete Columns Subjected to Air and Underwater Explosions. MS Thesis, George Mason University, Fairfax, VA, USA, 2023. [Google Scholar]
- Sulfredge, C.; Morris, R.; Sanders, R. Calculating the Effect of Surface or Underwater Explosions on Submerged Equipment and Structures; Oak Ridge National Laboratory: Oak Ridge, TN, USA, 2005; Available online: https://www.researchgate.net/publication/266606168_Calculating_the_Effect_of_Surface_or_Underwater_Explosions_on_Submerged_Equipment_and_Structures (accessed on 19 June 2023).
- Jiang, L.; Ge, H.; Feng, C.L.; Chen, D.R. Numerical simulation of underwater explosion bubble with a refined interface treatment. Sci. China Phys. Mech. Astron. 2014, 57, 1–10. Available online: https://link.springer.com/article/10.1007/s11433-014-5616-9 (accessed on 8 June 2025). [CrossRef]
Disclaimer/Publisher’s Note: The statements, opinions and data contained in all publications are solely those of the individual author(s) and contributor(s) and not of MDPI and/or the editor(s). MDPI and/or the editor(s) disclaim responsibility for any injury to people or property resulting from any ideas, methods, instructions or products referred to in the content. |
© 2025 by the authors. Licensee MDPI, Basel, Switzerland. This article is an open access article distributed under the terms and conditions of the Creative Commons Attribution (CC BY) license (https://creativecommons.org/licenses/by/4.0/).