1. Introduction
Air brakes installed on trains are designed to apply braking forces when a pressure reduction is generated in the brake pipe (BP) that connects all the vehicles along the train [
1]. A distributor valve, one on each vehicle of the train, then lets the compressed air flow from a reservoir into the brake cylinders. The pressure reduction in the BP can be generated by the driver’s action or by an accidental event, e.g., in case of leakages or failures of the BP, leading to the automatic application of braking.
Under certain circumstances, this braking system may fail and braking forces may be partially or totally unapplied, mainly due to disconnected BP, failures of the distributor valve, leakages of brake cylinders or wrong application of parking brakes [
2]. Inadequate deceleration may also occur in low-adhesion conditions (contamination of rails, such as the presence of leaves or lubricants) causing SPADs (Signal Passing At Danger) and station overruns [
3]. In the worst cases, collisions with other trains or end-of-platform structures may occur. Railway history is dotted with accidents in which trains, even at relatively low speeds, overran the buffer stops entering terminal stations as insufficiently braked [
4]. SPADs are still one of the main precursors to accidents after track buckling and broken rails [
5].
Buffer stops are installed to prevent insufficiently braked trains from passing a certain point on the line. Typical buffer stop locations are in terminal stations, railway yards, depots and on passing sidings to protect the main line from improper movements of rolling stock. They may intervene in the following cases:
Due to a driver error, a train does not stop where prescribed while the train is already in a braking state. In this case, the collision speed is normally limited. Modern ATP (Automatic Train Protection) systems prevent the problem, or, in any case, they force the train to slow down to walking speed.
Due to a shunting error, a column of vehicles hits the buffer stop. ATP systems are normally switched off during shunting but, in any case, the speed is low.
Due to a parking error (failure to use hand brakes and/or scotch blocks on sloping tracks or in case of strong winds), rolling stock may move unduly. ATP systems are not activated in this case and the runaway train may reach very high speeds if the gradient is relevant and/or the slope is long.
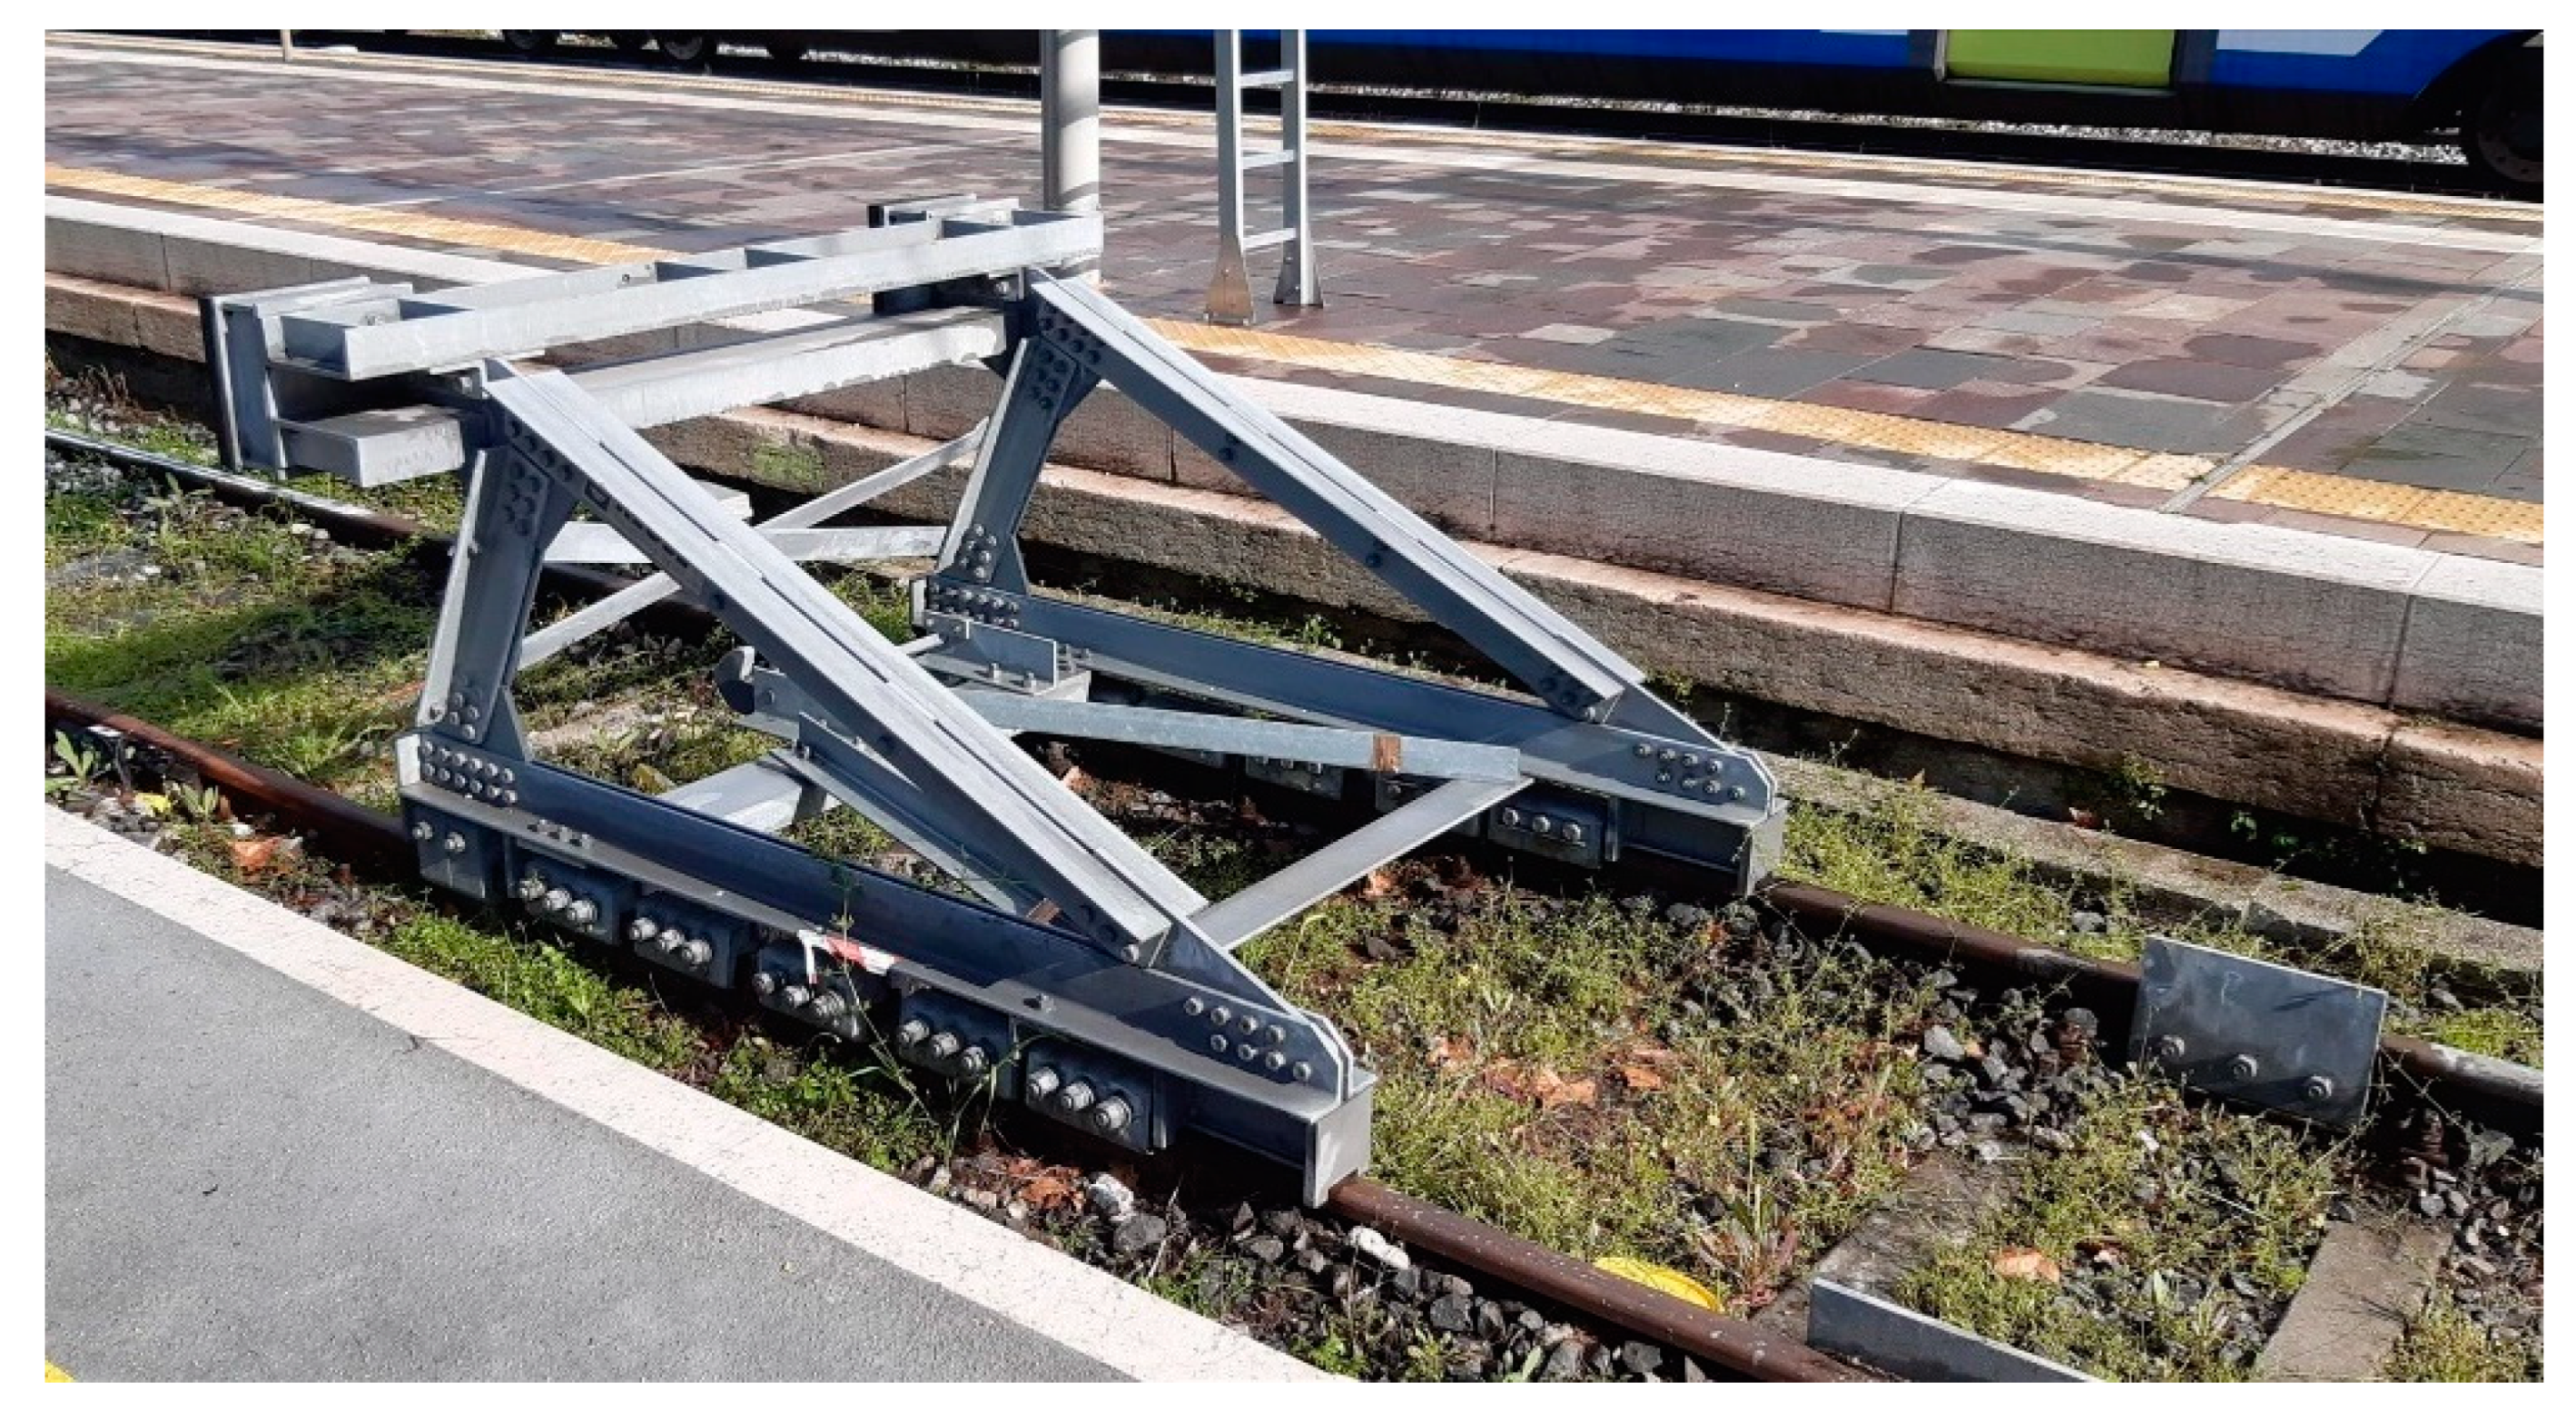
Compared to fixed buffer stops, Energy Absorbing Buffers Stops (EABS) are designed to stop an insufficiently braked train within a safe distance, dissipating hydraulically and/or mechanically (by friction) its kinetic energy. Up to a certain speed (about 20 km/h), EABS are effective, considerably reducing the consequences of overruns, while at higher speed EABS may prove insufficient and the only possibility to limit the consequences of the inevitable crash is to re-route the train onto a side track. An example of a friction EABS is shown in
Figure 1.
EABS cannot replace ATP systems, which are essential to avoid catastrophic events, for example at terminus stations [
6,
7]. However, some ATP systems are active only above a certain speed and EABS are a useful measure to mitigate the residual risk. As an example, a collision at 12 km/h of a passenger train with a fixed buffer stop [
8] resulted in the destruction of the buffer stop and in major damages to the driver’s cab. While a driver error was recognized as the main cause of the accident, the brakes were not applied because the approaching speed at the station was below the ATP trigger value of 22 km/h. The investigators highlighted the importance of using EABS instead of fixed buffer stops, reporting how the collision of another passenger train with an EABS at a similar speed led to damages neither to the train nor to the EABS.
The structural strength requirements for rolling stock are defined by the European standard EN 12663-1 [
9]. The strength of the vehicle body is proven considering a longitudinal load of 2000 kN, while the bogie-to-body connection withstands a longitudinal acceleration of ±3 g for locomotives and ±5 g for wagons and coaches.
Crashworthiness for locomotives and passenger trains colliding with deformable obstacles (an identical vehicle, a different rail vehicle or a road vehicle) is requested by EN 15227 [
10], in which the permissible mean deceleration is 5 g considering a moving average of 0.120 s from the start to the end of the collision.
Fixed buffer stops are usually rigid structures, and the collision with a train can generate very high impact decelerations. The risk of passenger injuries or important damages to the vehicle structure can therefore be avoided using EABS.
After a brief description of the currently available types of EABS and the related design specifications, this paper compares two EABS simulation strategies and the influence of different train compositions on EABS braking capacity and on the rolling stock structural integrity.
2. Design and Calculation Criteria for EABS
The scope of EABS is to stop a train at a “reasonable” speed in a “reasonable” space after a collision. Kinetic energy absorption is obtained through two different principles:
Hydraulic EABS include special buffers, longer than normal vehicle’s buffers and including a spongy cartridge, which are basically hydraulic dampers modified to obtain a specific braking curve. The buffer stop structure is fixed and the kinetic energy is transformed into oil heat, while the cartridge provides a static stiffness. In some cases, gas–hydraulic double chamber dampers are used [
11]. As the stroke of these devices is typically 0.5~2 m, impact speeds cannot be too high, as this would result in unacceptable decelerations.
Friction EABS are made of a steel frame clamped to the rails and the entire structure is allowed to slide in the running direction. The amount of energy that can be dissipated depends on total braking force, i.e., on the number of installed clamps. The stopping distance is a design parameter, typically up to 10–15 m.
The two principles may be advantageously combined by designing EABS that guarantee controlled deceleration with hydraulic elements during the said collision and then leave friction to dissipate the largest part of the kinetic energy.
Kinetic energy is the fundamental parameter for the design of any EABS, while the specification of the maximum deceleration during braking is not straightforward. Hydraulic EABS show a predictable response while friction EABS are subjected to static friction uncertainty and possibly to stick-slip phenomena, which generate transients difficult to predict. Sharp forces and accelerations are to be expected at the beginning of the slide.
Available EABS specifications consider the train in terms of its mass and speed only. The effects of train length, mass distribution and buffer types appear nevertheless to be important, affecting both EABS performance and internal train dynamics.
To evaluate the influence of these parameters on a friction EABS, as well as on the Longitudinal Train Dynamics (LTD), a distributed lumped parameter modelling of the train (performed with a dedicated version of the TrainDy code) is described in the following. Results are compared to a simpler Finite Element Method (FEM) approach, in which the train is considered as a single moving mass.
LTD analysis is extensively used for research and optimization of the longitudinal motion of a train along the track and to analyse the behaviour of each wagon within a train. Traction and braking behaviour of the whole train as well as in-train forces can be evaluated. Cole et al. [
12] published a review of applications of LTD modelling and simulations. Train crash scenarios are also described with the aim of evaluating the maximum longitudinal forces during the impact and to check whether vehicle design, or crashworthiness, is sufficient to avoid structural damages.
To the authors’ knowledge, the only existing application of LTD simulations of train colliding with buffer stop is the paper by Grabner et al. [
13], in which a multi-body analysis was performed to study the collision of different train lengths with a fixed buffer stop. The authors showed that the maximum in-train force generated by the collision is always reached between the 4th and 5th vehicle independently of the train composition. Kowalczyk [
14] applied explicit FEM simulation to evaluate the collision of a mass (the total train mass) with a fixed buffer stop. Guziur [
15] studied the main parameters of friction EABS applying the common kinematic rules.
No papers were found on the application of FEM or LTD to collision with an EABS.
3. Simulation of Train and EABS Dynamics After a Collision
Supposing that braking force and the resulting deceleration are constant after the collision, then the impact speed and the stopping distance define the maximum acceleration by applying kinematics rules. Currently available specifications, for example the one used in Italy [
16], define EABS performances in terms of the train mass to be stopped, the collision speed, the maximum stopping distance (10 m) and the maximum deceleration (≤2 m/s
2).
However, to evaluate the structural strength of the whole system (the buffer stop and the portion of track to which it is applied) or the detailed dynamics of the vehicles involved in the collision, different simulation methods should be used. In the following sections, FEM and LTD approaches are described.
3.1. Simulation of Collision Dynamics with the Finite Element Method
Megna et al. [
17] recently developed a 3D FE model to simulate a new type of friction EABS. The model includes
the complete structure of the buffer stop;
the preloaded clamps, placed behind the buffer stop, exerting the braking force modelled as an isotropic Coulomb friction law and a friction coefficient f = 0.2;
24 m of track section with discrete non-linear elastic supports to represent the mono-lateral ballast constraint (downwards);
a single point mass hitting the buffer stop;
a single point mass representing the first wheel of the train to simulate the vertical static load closest to the buffer that counteracts rail lifting when braking force is applied by the clamps.
Transient dynamic simulations were performed with the aim of assessing the EABS structural behaviour (displacements and stresses in the buffer stop and rails), train dynamics performance (accelerations and stopping distances) and maximum track uplift.
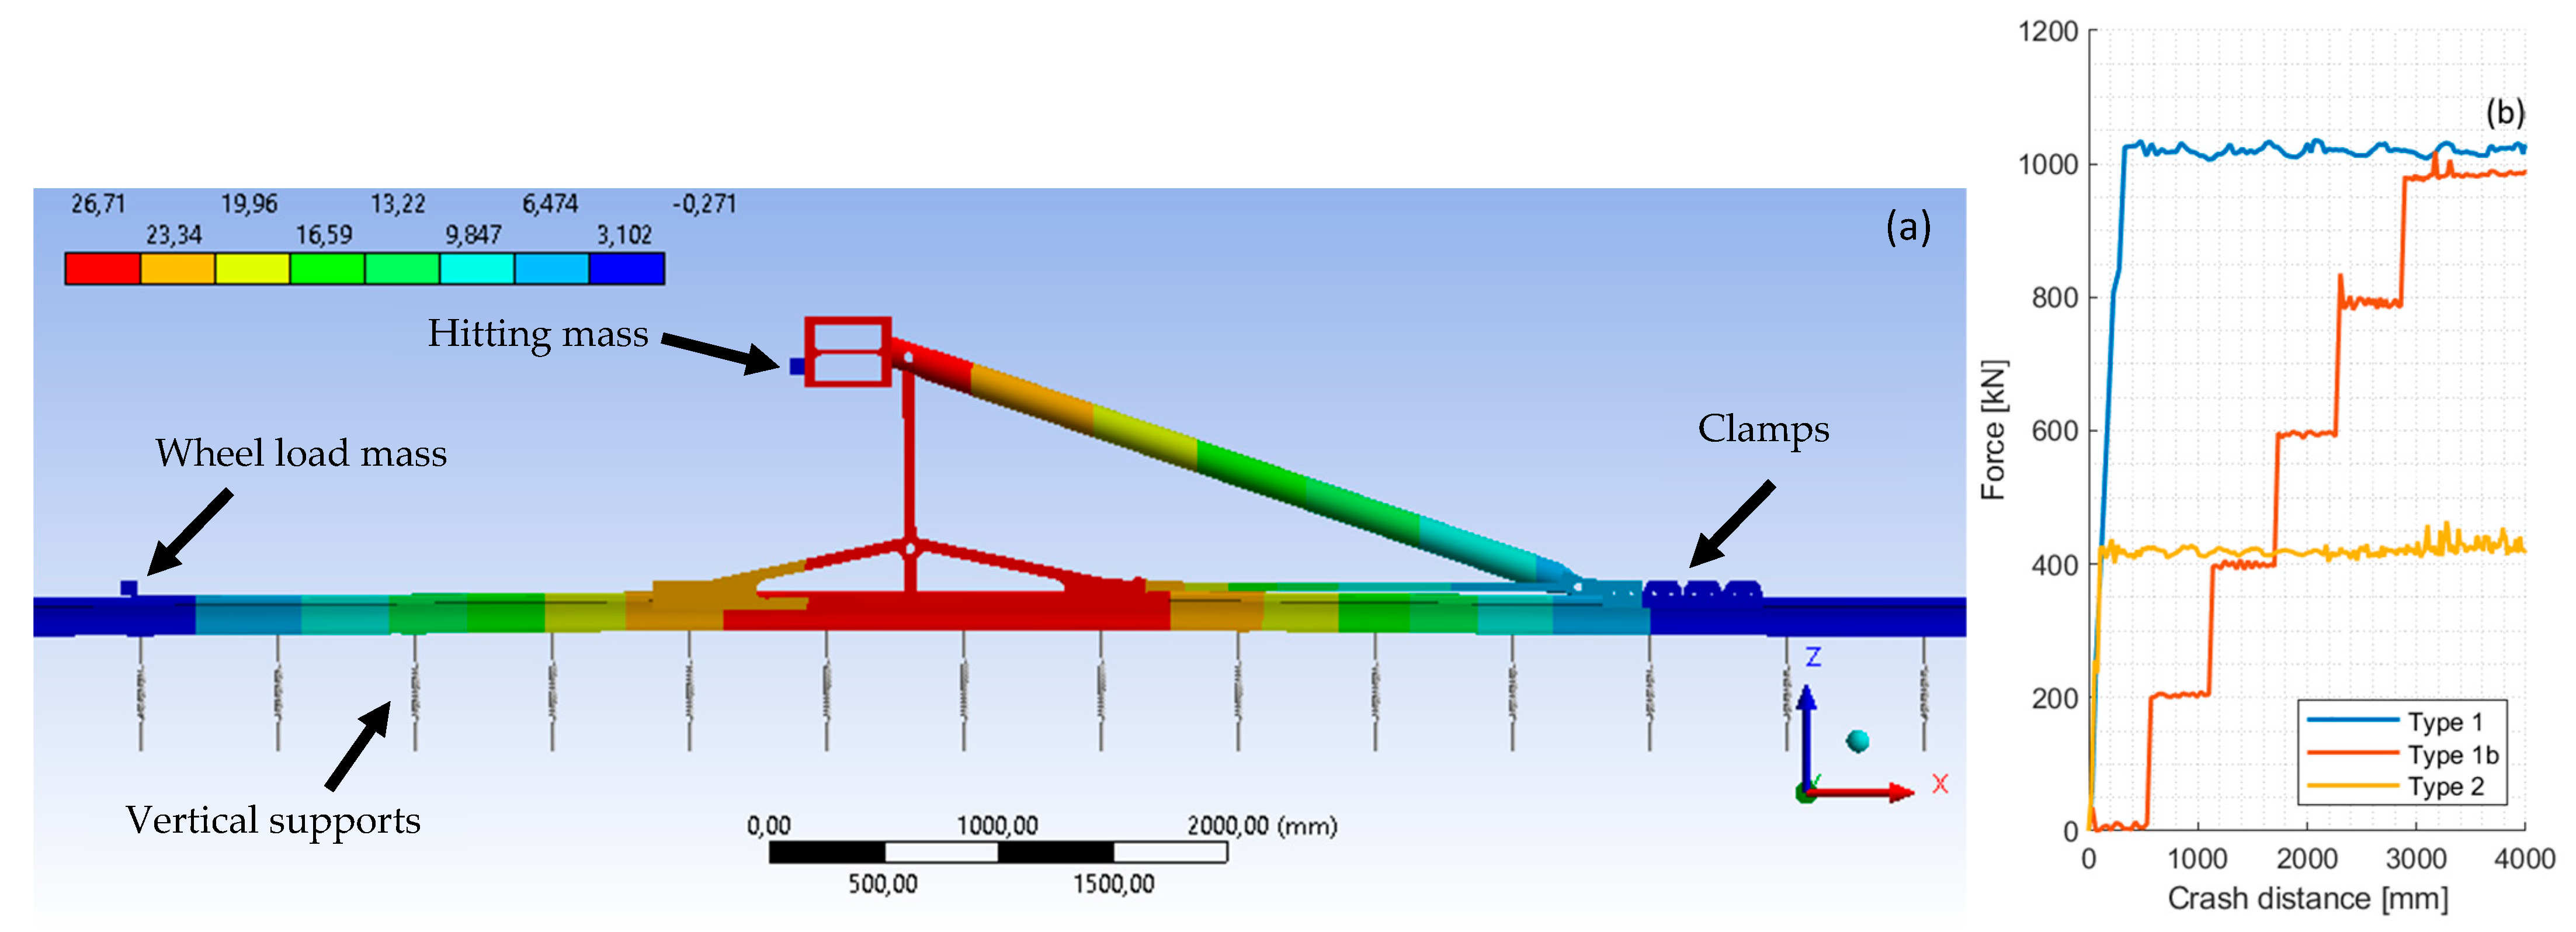
Figure 2a shows a side view of the 3D model during the FE simulation of the hitting point mass and the resulting vertical displacement of the system. Several scenarios were simulated considering two load cases (#1 with a mass of 650 t moving at 15 km/h resulting in 5700 kJ and #2 with 500 t moving at 10 km/h resulting in 2000 kJ). Different quantities (2 to 5) and initial positions of clamps influencing the braking force are simulated.
Figure 2b shows three different EABS braking characteristics resulting from the FE model in the following configurations:
EABS Type 1: 10 clamps (5 per rail) spaced by 50 mm resulting in a nearly instantaneous braking force application;
EABS Type 1b: as above but with clamps spaced by 500 mm resulting in a progressive braking force application (i.e., the full braking force is applied after 3000 mm);
EABS Type 2: as EABS Type 1 but with only 4 clamps (2 per rail).
This FE model did not consider the behaviour of a real train with the influence of the interaction between vehicles. While a train can be modelled with FEM codes by using a lumped parameter approach as a set of rigid masses connected to each other by elastic elements (draw gear and screw coupling for traction and buffers for compression), also offering a certain degree of damping, it was decided to use TrainDy instead as an acknowledged faster and more efficient tool.
3.2. Simulation of Collision Dynamics with the TrainDy Software
LTD simulator
TrainDy [
18,
19] was developed by the Tor Vergata University of Rome. It was officially recognised and approved by the UIC (Union Internationale des Chemins de Fer) in 2009 as state-of-the-art software for LTD simulations and later recommended by the International Railway Solution IRS 40421 [
20].
For this work, the last official version of TrainDy (1.4.6) was modified to simulate the collision between the leading vehicle and an EABS. It can calculate the equivalent force–displacement curve combining the characteristic of the locomotive front buffers and the characteristic of the EABS, i.e., the braking force for the aforementioned scenarios.
The procedure is similar to that used to calculate the equivalent curves of coupled buffers and draw gears of consecutive vehicles along the train. At this end, to properly consider nonlinearities, the force of the equivalent curve goes from zero to the minimum force of the coupled elements, then this interval is piecewise linearized (depending on the number of points of the two curves) and, for each force value, the corresponding displacement of the two coupled elements is calculated. The sum of these two displacements is the displacement associated with the equivalent force.
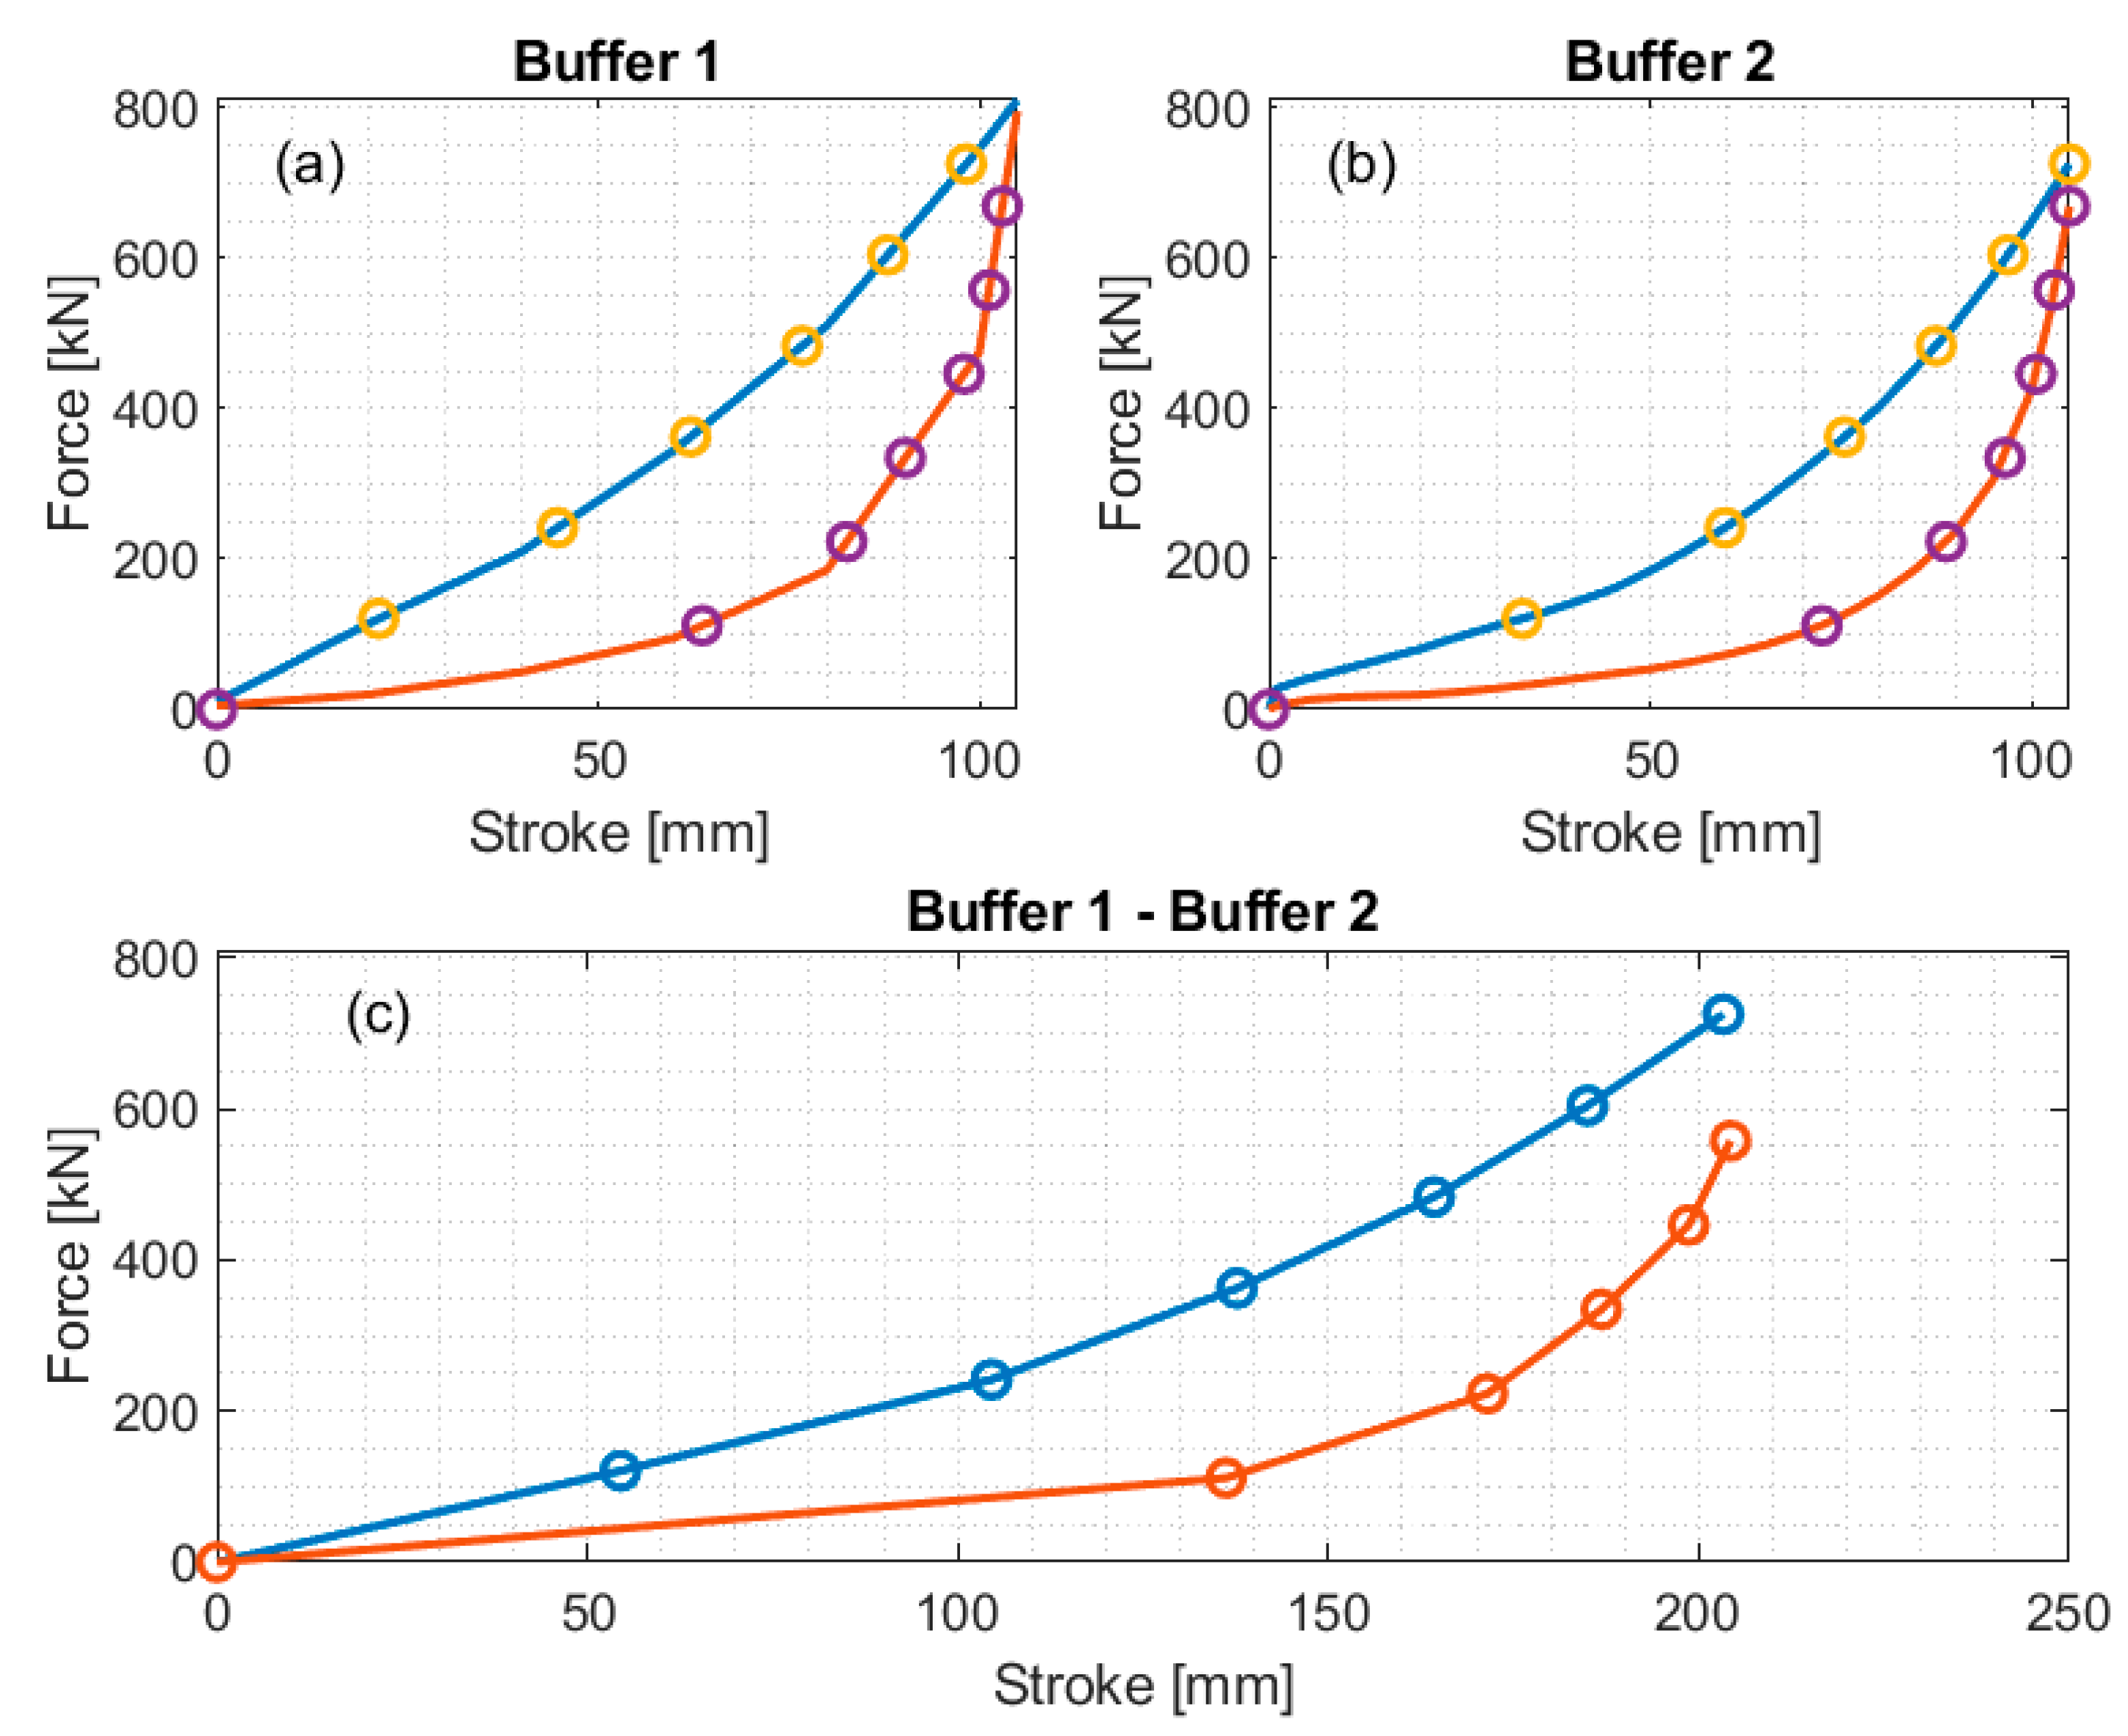
Figure 3a,b shows the force–displacement characteristics of two generic buffers named Buffer 1 and 2, respectively.
Figure 3c shows the “equivalent buffer”, whose displacement is the sum of the displacements in (a) and (b) for a given force.
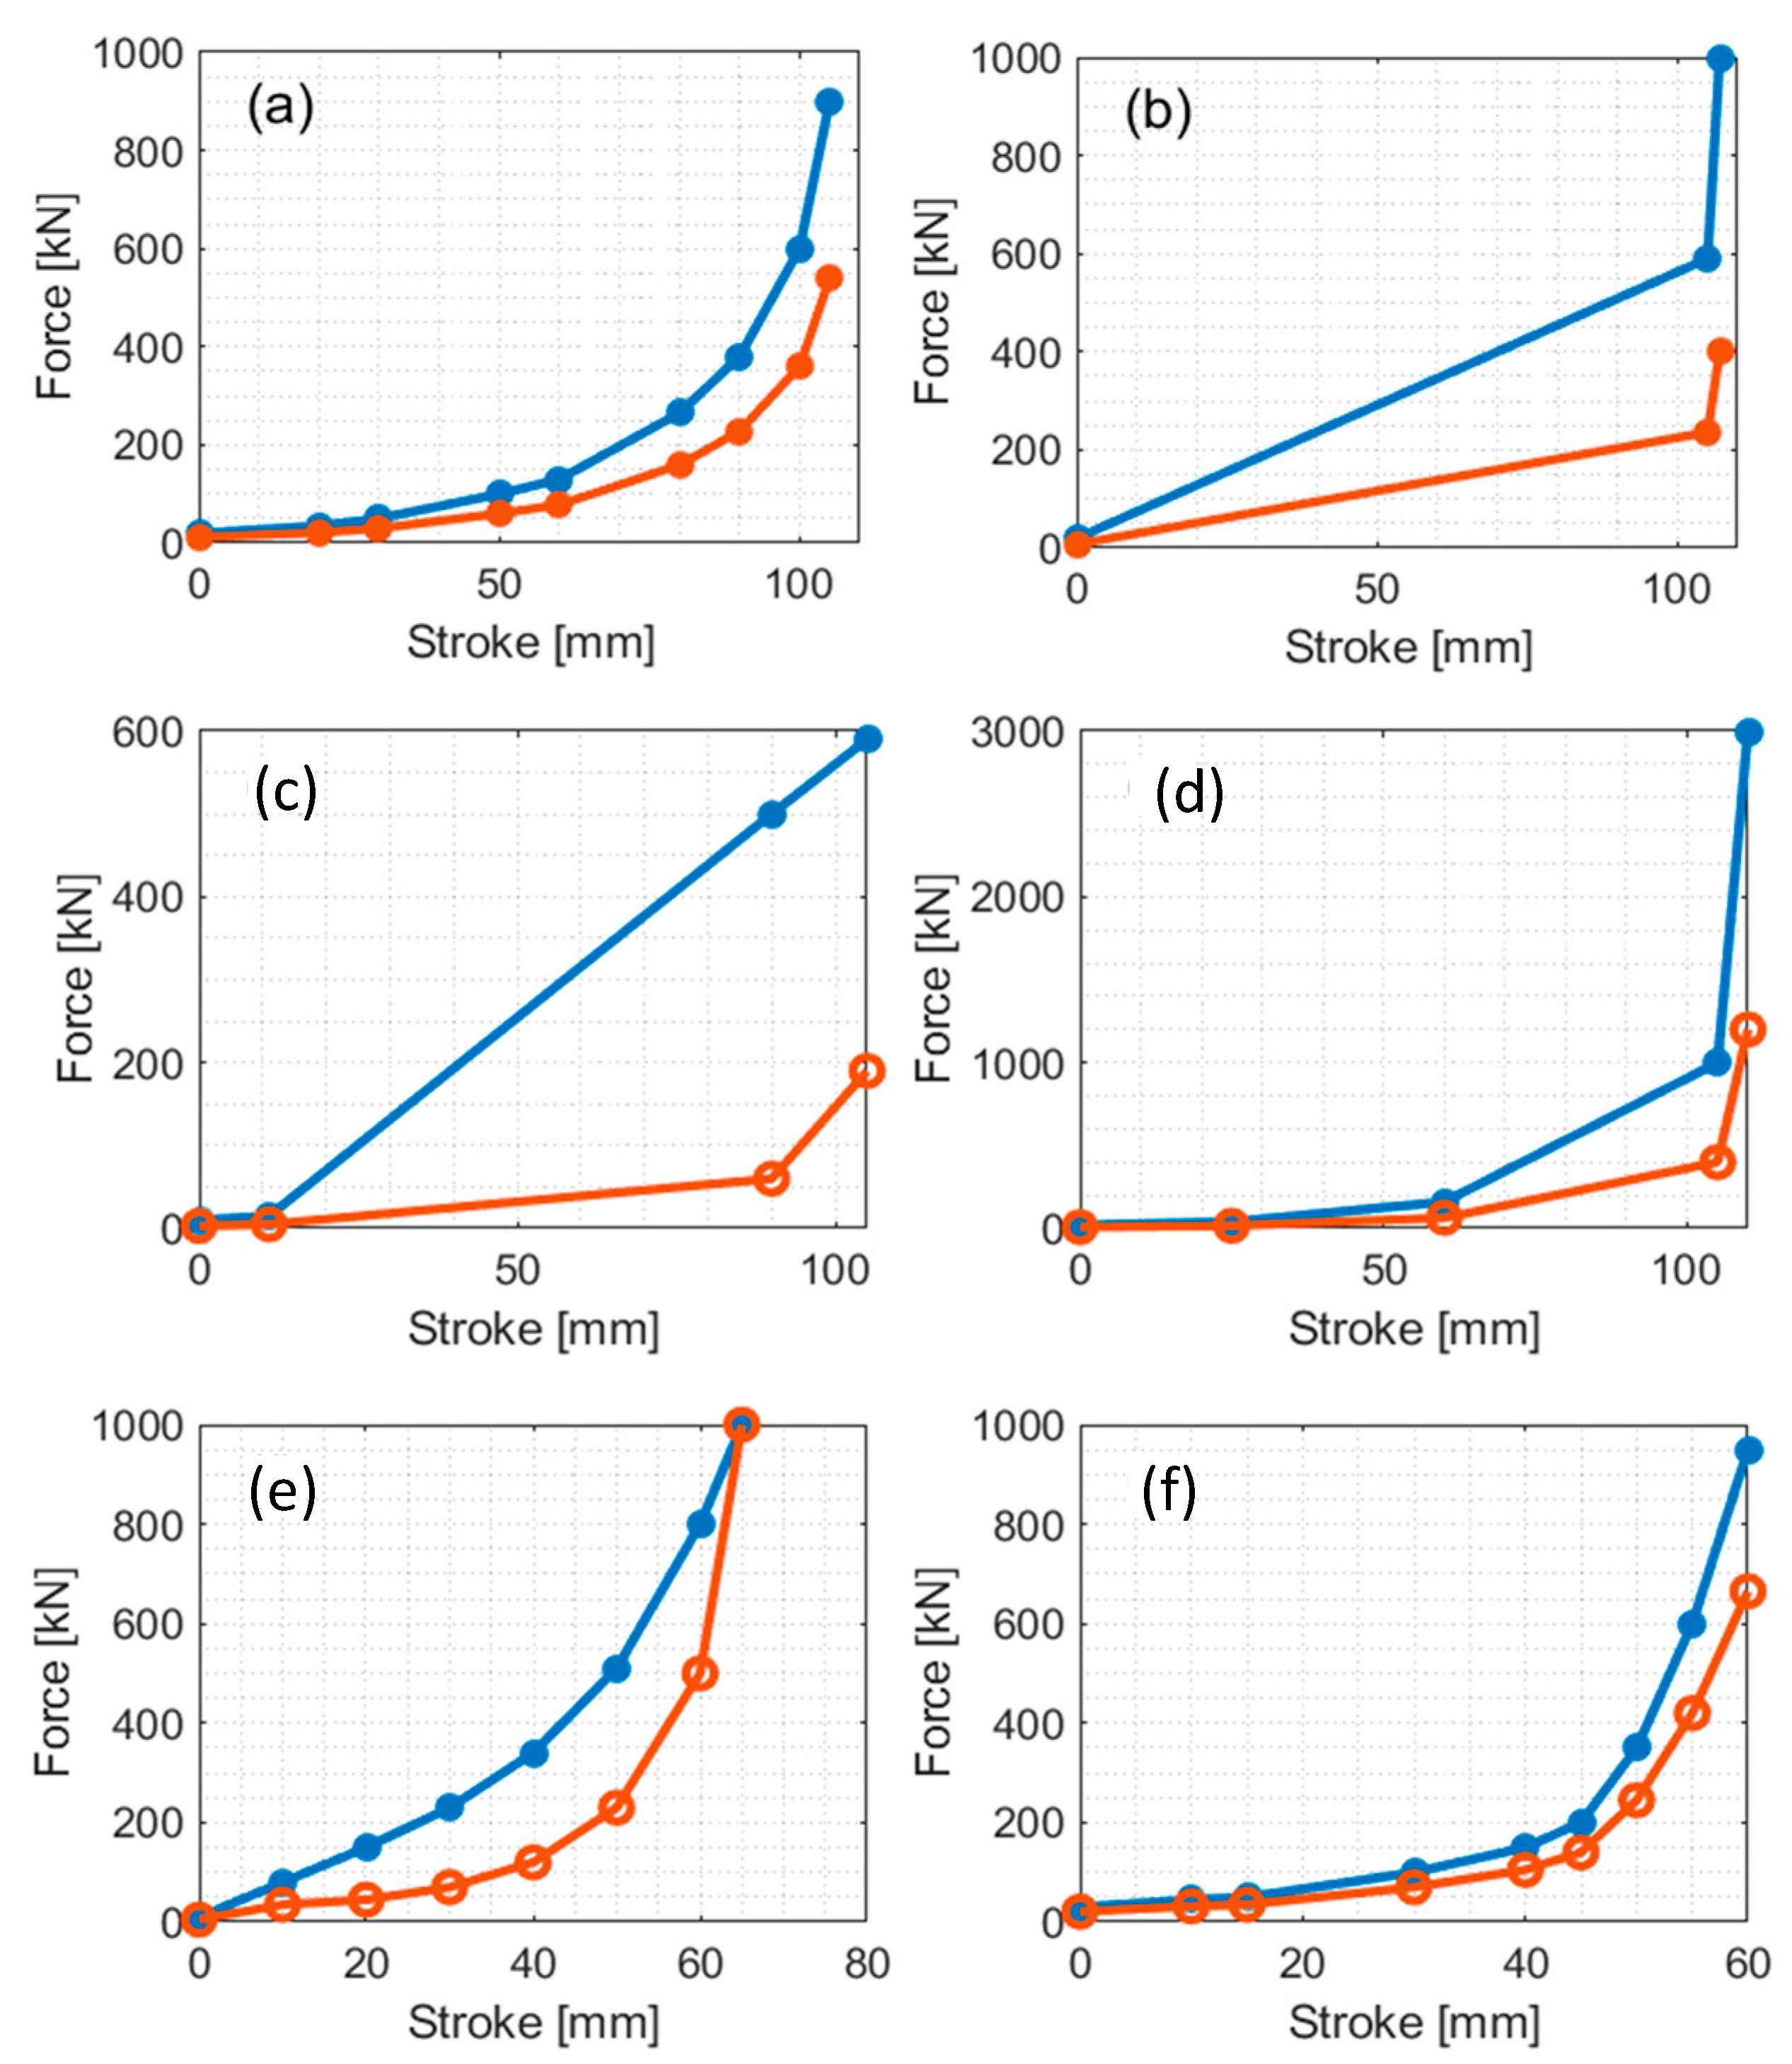
Figure 4a,b shows two different front buffers for the locomotive, taken from the
TrainDy database and representing buffers commonly used in freight traction units. As the simulations stop when the speed of the locomotive is zero, there is no need to consider the unloading curve of the front buffers when they are coupled with the EABS, while unloading curves are relevant for the LTD. The force–stroke characteristics of the vehicle couplings (buffers and draw gears) used in this paper are shown in
Figure 4c–f assuming that, before the impact, all the buffers are in contact with no preload.
3.3. Definition of the Scenarios Simulated with TrainDy
Both freight and passenger trains involving different sets of empty/laden wagons (25 t/90 t) and empty/laden coaches (50 t/67 t) were simulated to generate different train compositions. A locomotive (83 t for freight trains and 72 t for passenger trains) is always added at the head of the train. These scenarios (
Table 1) represent common train compositions in Italy. Different combinations of mass and speed (
v ≤ 15 km/h) were chosen to simulate a wide range of kinetic energy.
All scenarios were simulated within
TrainDy, using as braking input the three EABS braking characteristics shown in
Figure 2b. Scenarios A and D for freight trains and F and H for passenger trains were included to allow a comparison with the two load cases (#1 with 5700 kJ and #2 with 2000 kJ) simulated with the FE model.
In the following, each simulated case is described by the combination of the scenario (A to H) and the EABS characteristic (Type 1, 1b or 2), e.g., simulation D2 refers to scenario D with braking forces from EABS Type 2.
4. Results and Discussion
The results of the scenarios simulated with the LTD approach are first discussed in
Section 4.1 considering an instantaneous braking application (EABS Type 1 and Type 2). The effect of the progressive braking application (EABS Type 1b) is then shown in
Section 4.2. The LTD approach is then compared to FEM results in
Section 4.3. Further considerations of the structural strength of vehicles are given in
Section 4.4.
4.1. General Discussion of LTD Approach for EABS Type 1 and Type 2
The results obtained with EABS Type 1 and Type 2 are shown in
Table 2 for all freight (A to E) and passenger (F to H) trains in terms of stopping distance, locomotive deceleration (first vehicle of the train), maximum acceleration of the hauled vehicle (wagon or coach) within the train and mean deceleration of the whole train.
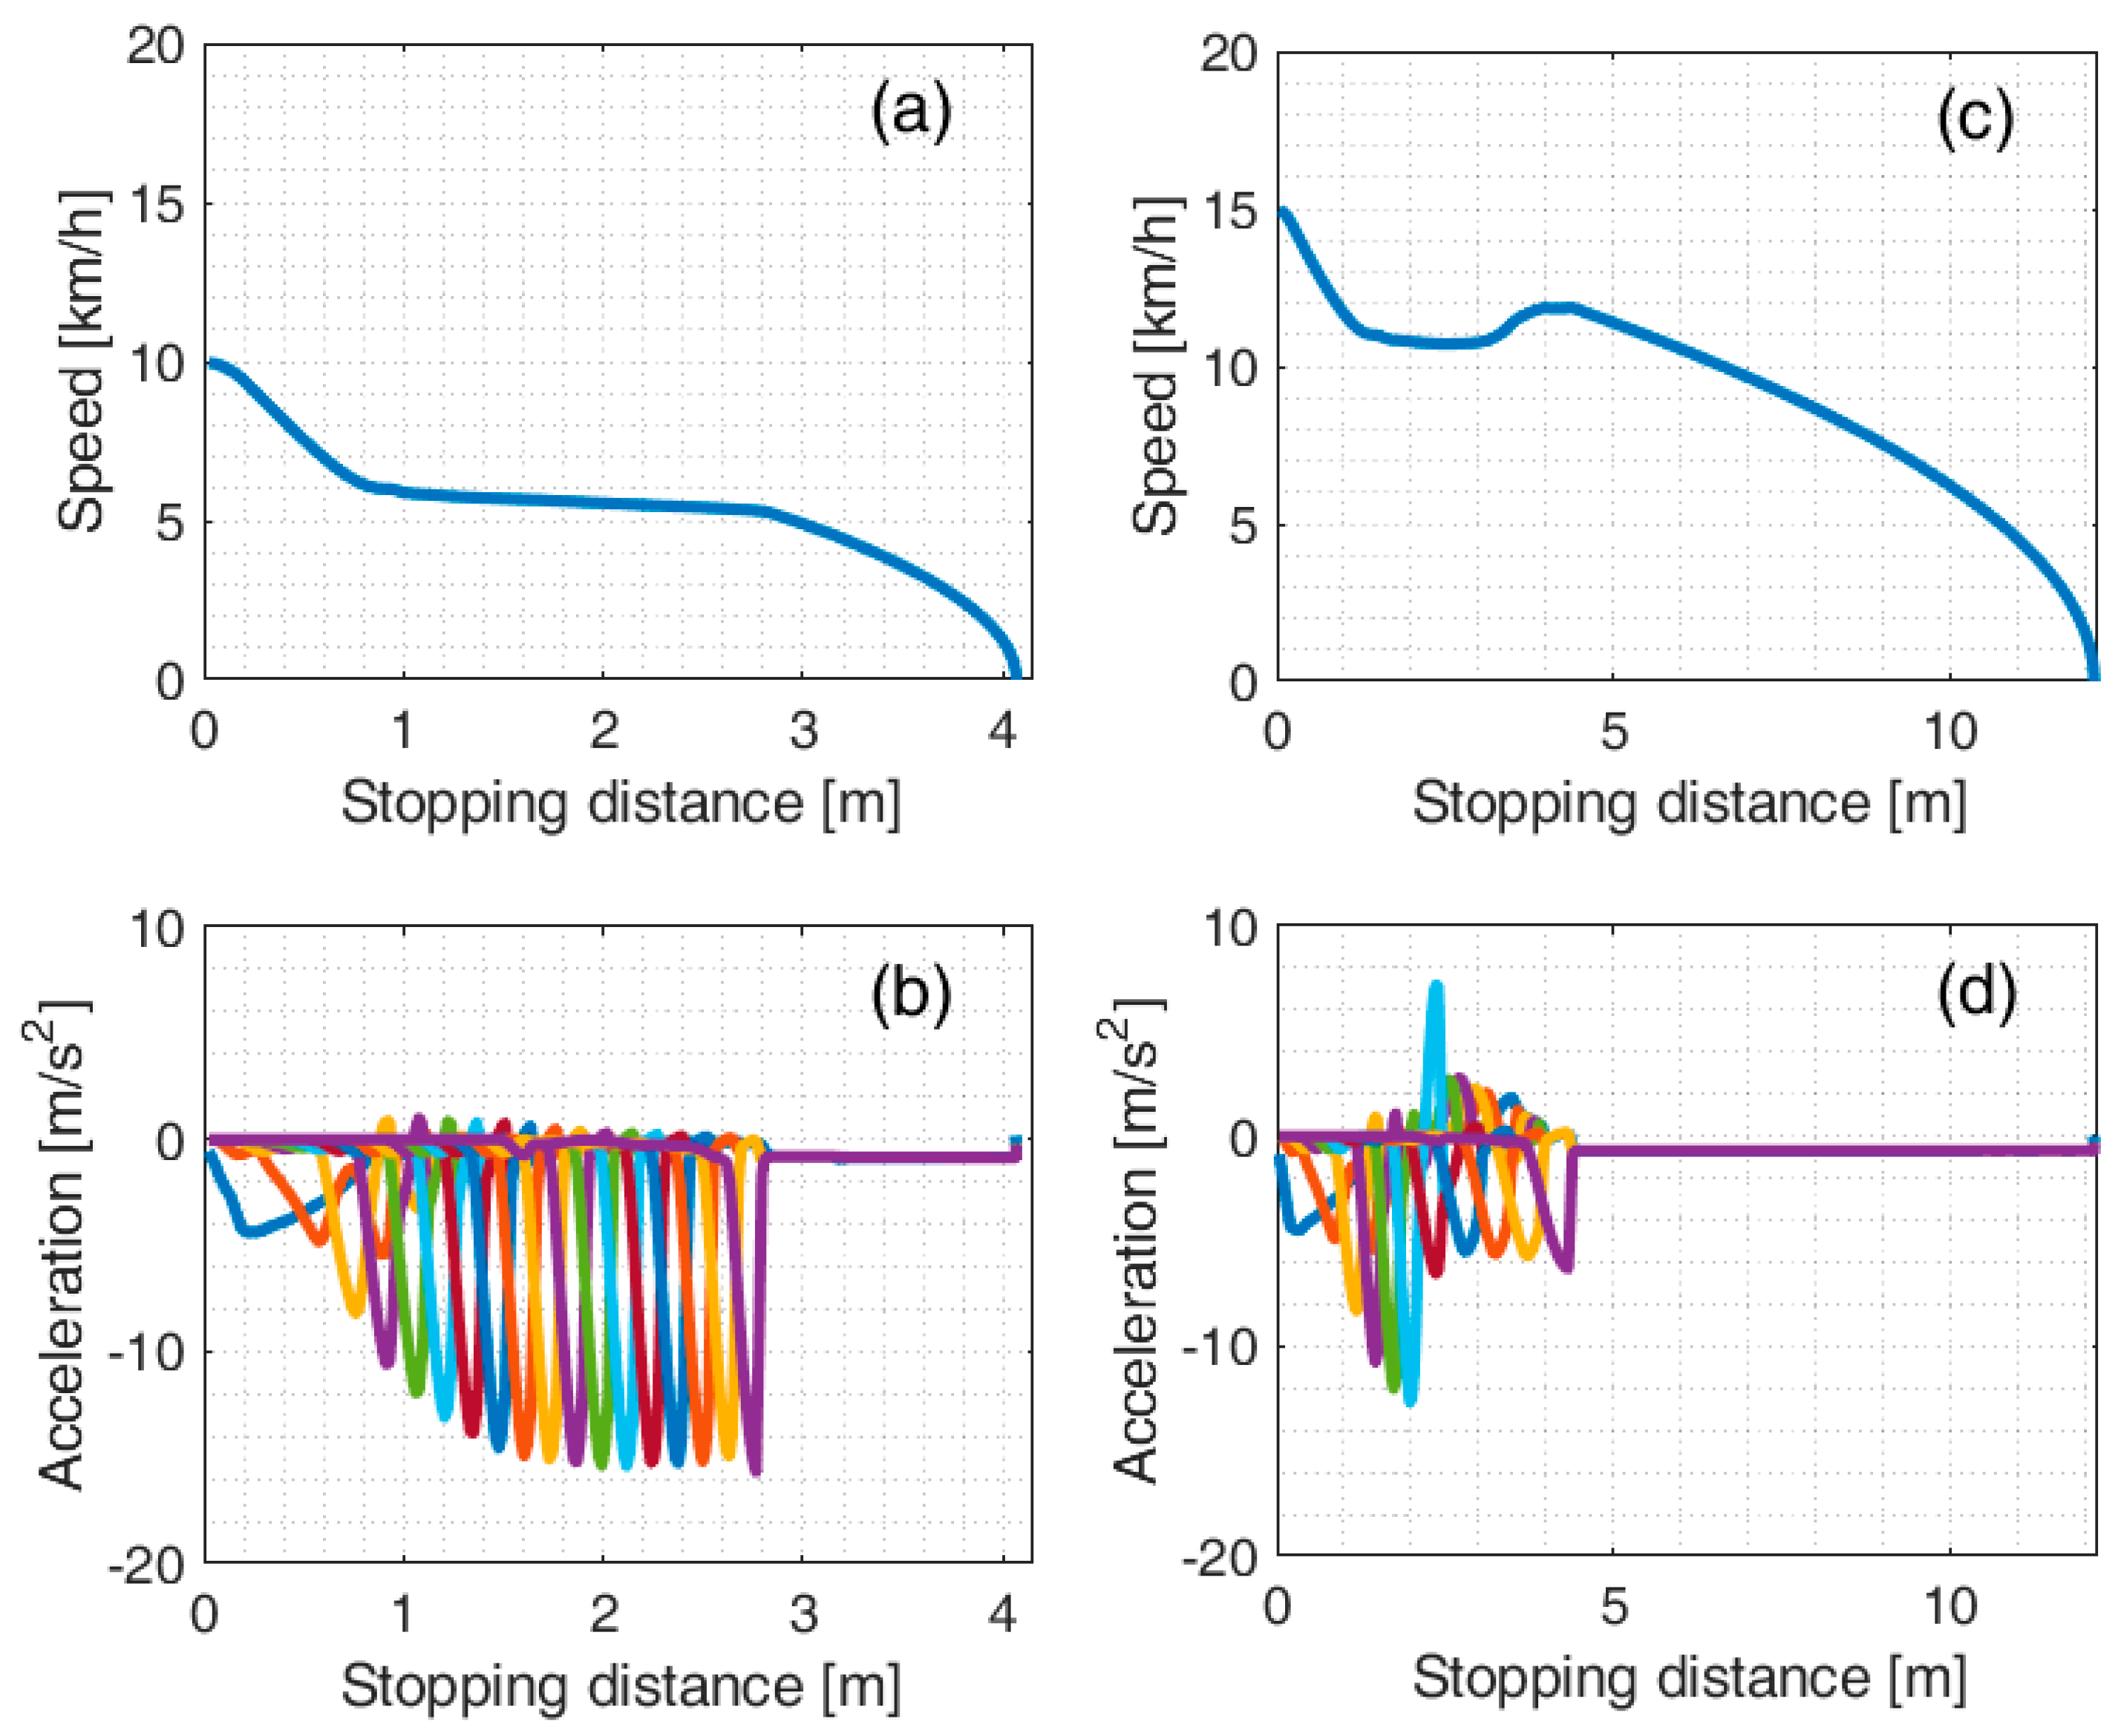
Vehicles speed and acceleration for the sample scenarios B2 (
Figure 5a,b) and D2 (
Figure 5c,d) show that the longitudinal dynamics may be divided into three phases:
Phase I—involving only the deceleration of the locomotive;
Phase II—in which the buffers between vehicles begin to compress, reducing their length;
Phase III—in which the buffers find their balance length and the train behaves as a single body.
The following can be concluded:
During Phase I, the deceleration of the locomotive is not affected by the rest of the train, and it depends mainly on the EABS braking force.
Table 2 shows that the locomotive deceleration is about 10 m/s
2 for EABS Type 1 and about 4.5 m/s
2 for EABS Type 2 (see also the first peak of
Figure 5b,d). Slightly higher values are obtained in the case of passenger trains because of the lower mass of the locomotive.
During Phase II, the speed of the locomotive is nearly constant, and a speed increase (positive acceleration) was observed at the end of this phase if the rear end of the train is heavier (
Figure 5c). Phase II is also the most relevant for the analysis of the dynamic response of the train. As shown in
Figure 5b,d, high peak deceleration values were found for the wagons (15.7 m/s
2 in
Figure 5b and 12.7 m/s
2 in
Figure 5d). The 2 m/s
2 upper limit from [
16] is therefore respected only considering the average value over the simulation time (last row of
Table 2). The lighter the wagons, the higher the deceleration peak, and a relevant amplification factor was found for trains made only of empty freight wagons. This behaviour is also present for short sections of empty wagons within trains made of both empty and laden wagons, as shown in
Figure 5d.
Table 2 shows that values up to 35 m/s
2 are reached for simulation B1 (freight train made of 17 empty wagons in the case of braking with EABS Type 1).
In Phase III the buffers have found their balance length, and the trains moves as a single body.
Figure 6 shows the ratio between the actual buffer stroke and the maximum stroke (=210 mm for two face-to-face buffers) for all scenarios involving freight trains and EABS Type 1. It can be observed that, in the simulations involving empty wagons (B and C), the buffers are not completely compressed, varying from 80% to 90% while, for simulation involving laden wagons, the maximum compression is reached or exceeded (A = 96.1%, D = 109.1%, E = 112.2%). The maximum compression can be slightly above 100% because the end of stroke is not modelled for the freight buffer shown in
Figure 4d. Train length and composition do not significantly influence the buffer final deformation but, while for simulations A, B, D, E the maximum deformation is found at the second pair of buffers, for simulation C involving 30 wagons the maximum buffer deformation is found between the 24th and 25th wagon (C = 91.8%). Results for passenger trains, not shown for brevity, show that buffer compression is lower, while for EABS Type 2 the compression in almost halved compared to EABS Type 1.
To investigate the influence of the distribution of empty and laden vehicles within a freight train, a sensitivity analysis for scenario D1 (5 empty + 5 laden) was performed, considering 100 permutations of the wagon’s positions. Results show a low scatter (±5%) of the stopping distance (average 4.9 m), therefore differences in the distribution of empty and loaded vehicles within a freight train seem to be negligible.
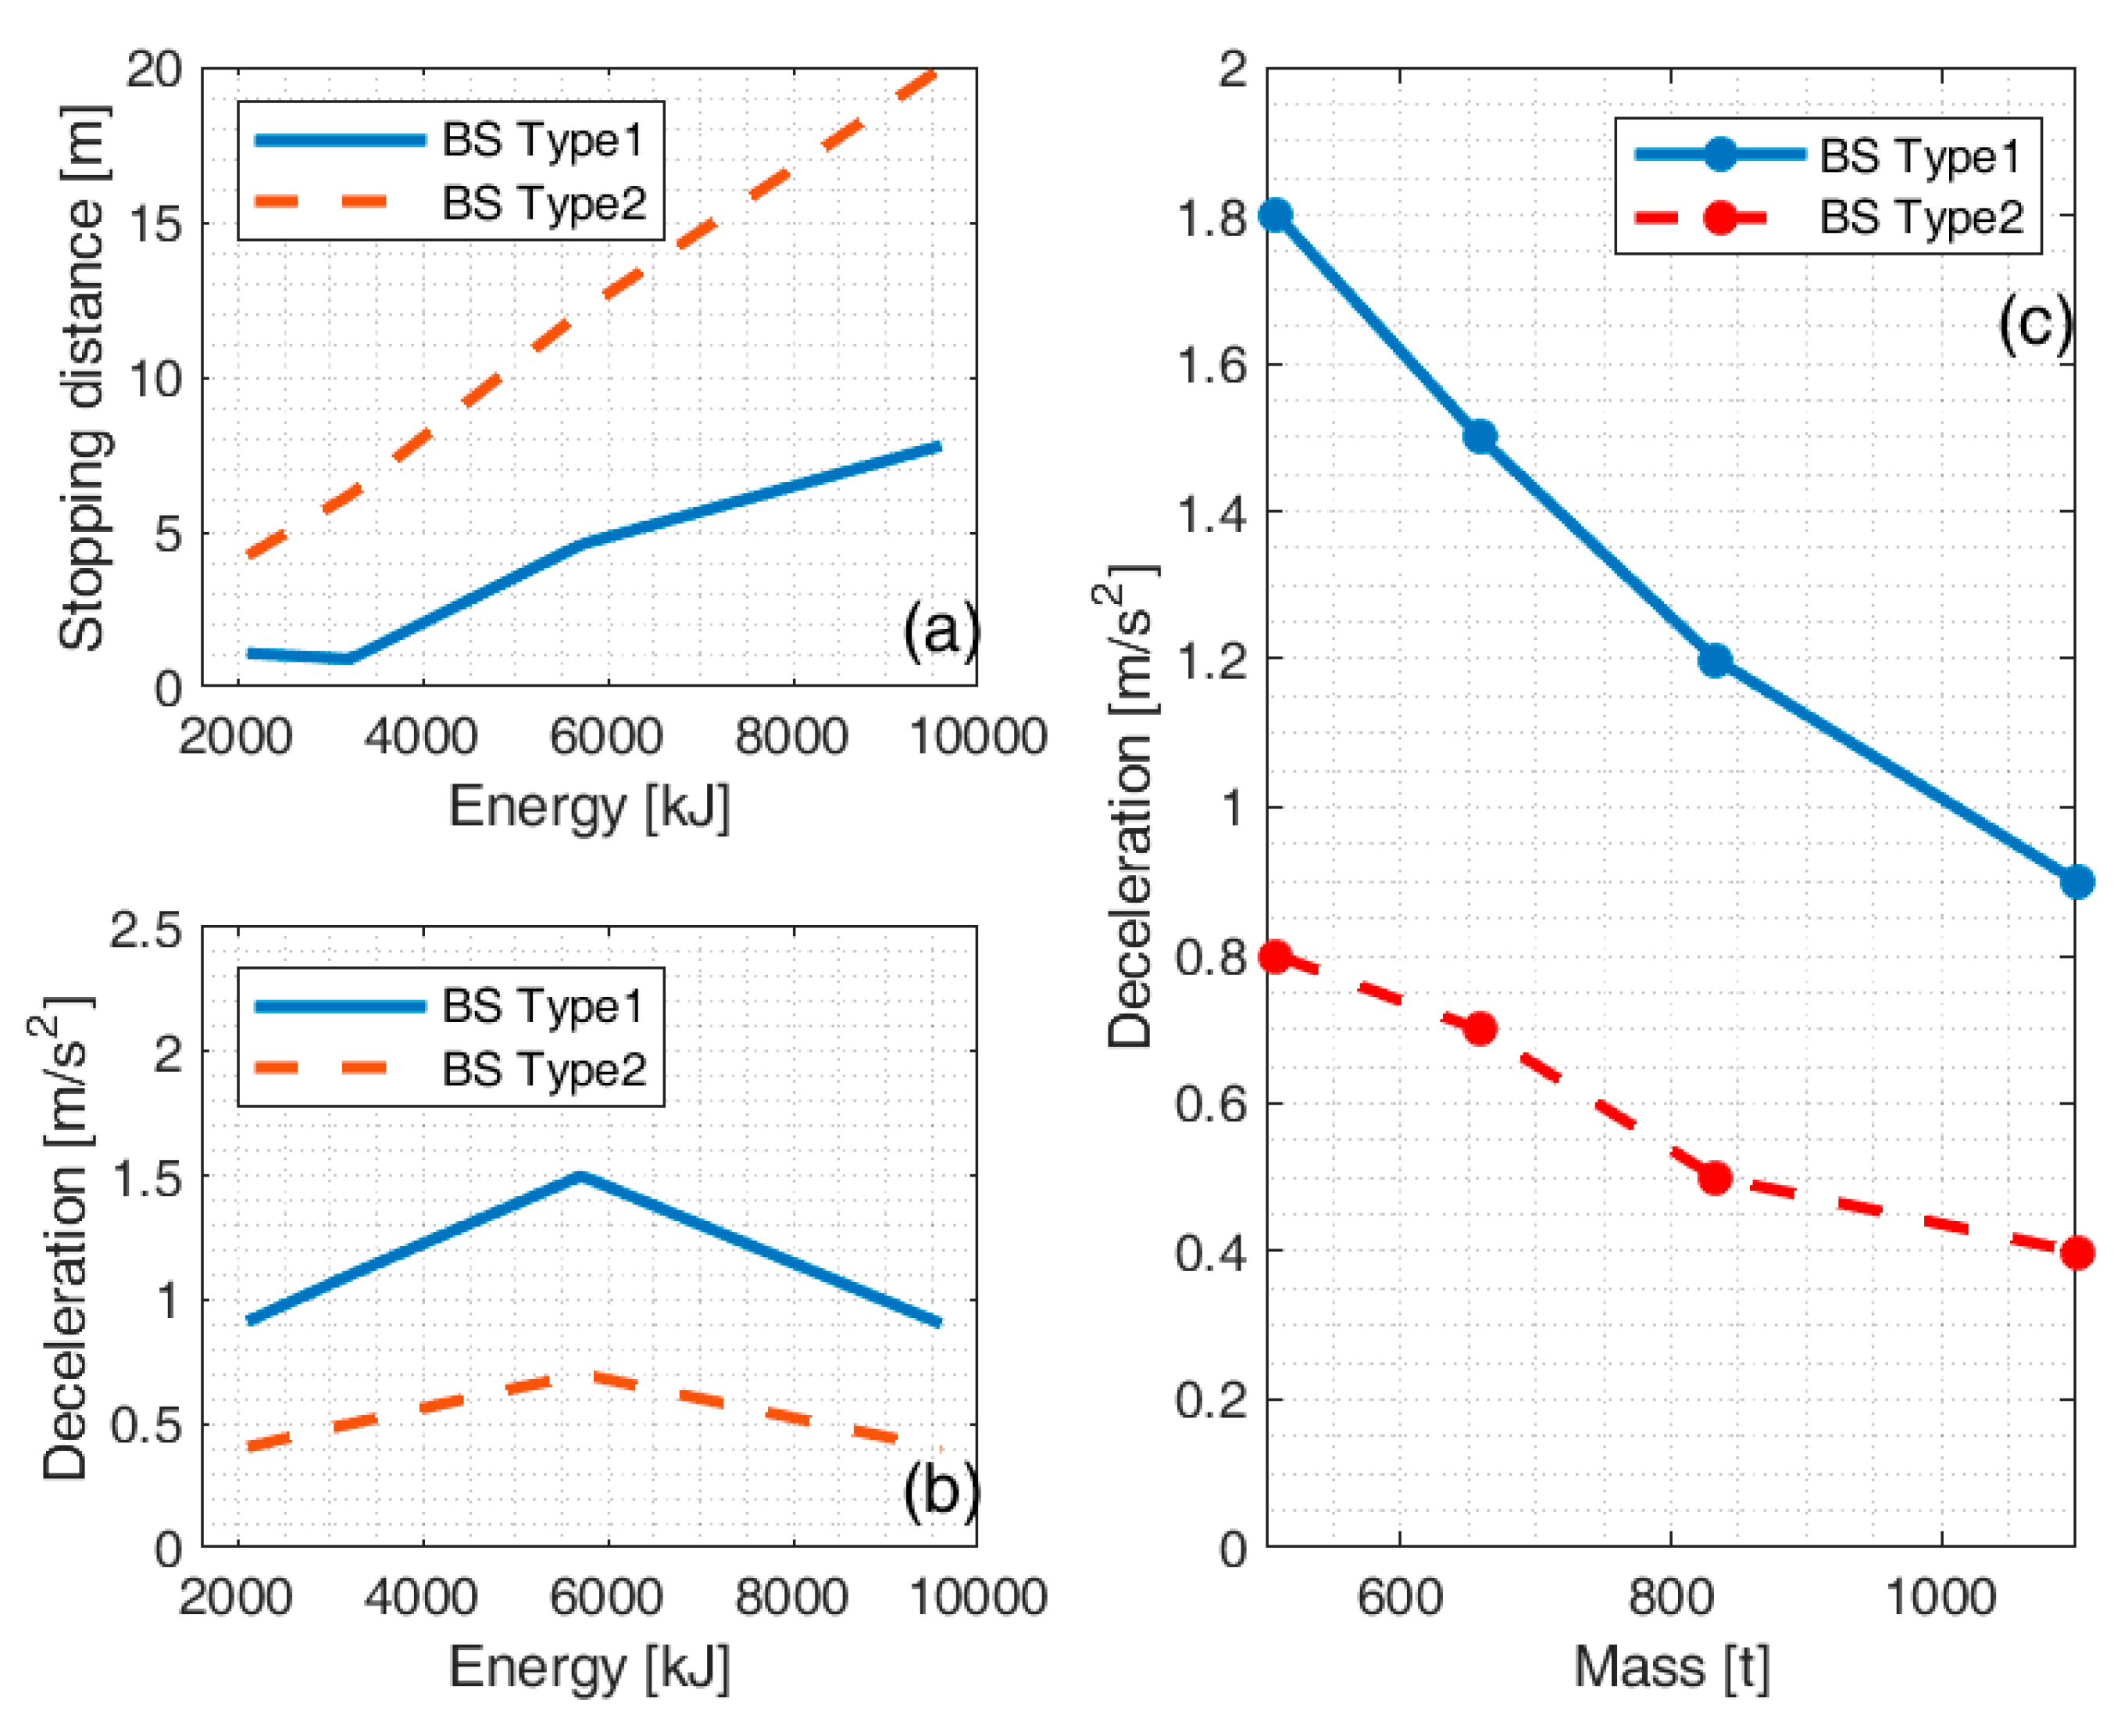
Stopping distances and mean decelerations for simulations A, C, D, E (freight trains) are shown in
Figure 7a,b. These results are given as a function of the braking force, i.e., the EABS type, and the total energy to be dissipated. While the stopping distance is nearly linear with the energy, the mean deceleration is not. The relationship between average deceleration value and train mass is shown in
Figure 7c considering both EABS Type 1 and Type 2 for all freight simulations. The highest mean deceleration (2.1 m/s
2) was found for the lightest passenger train (simulation G1, 474 t).
4.2. Effect of Clamps Spacing (EABS Type 1b)
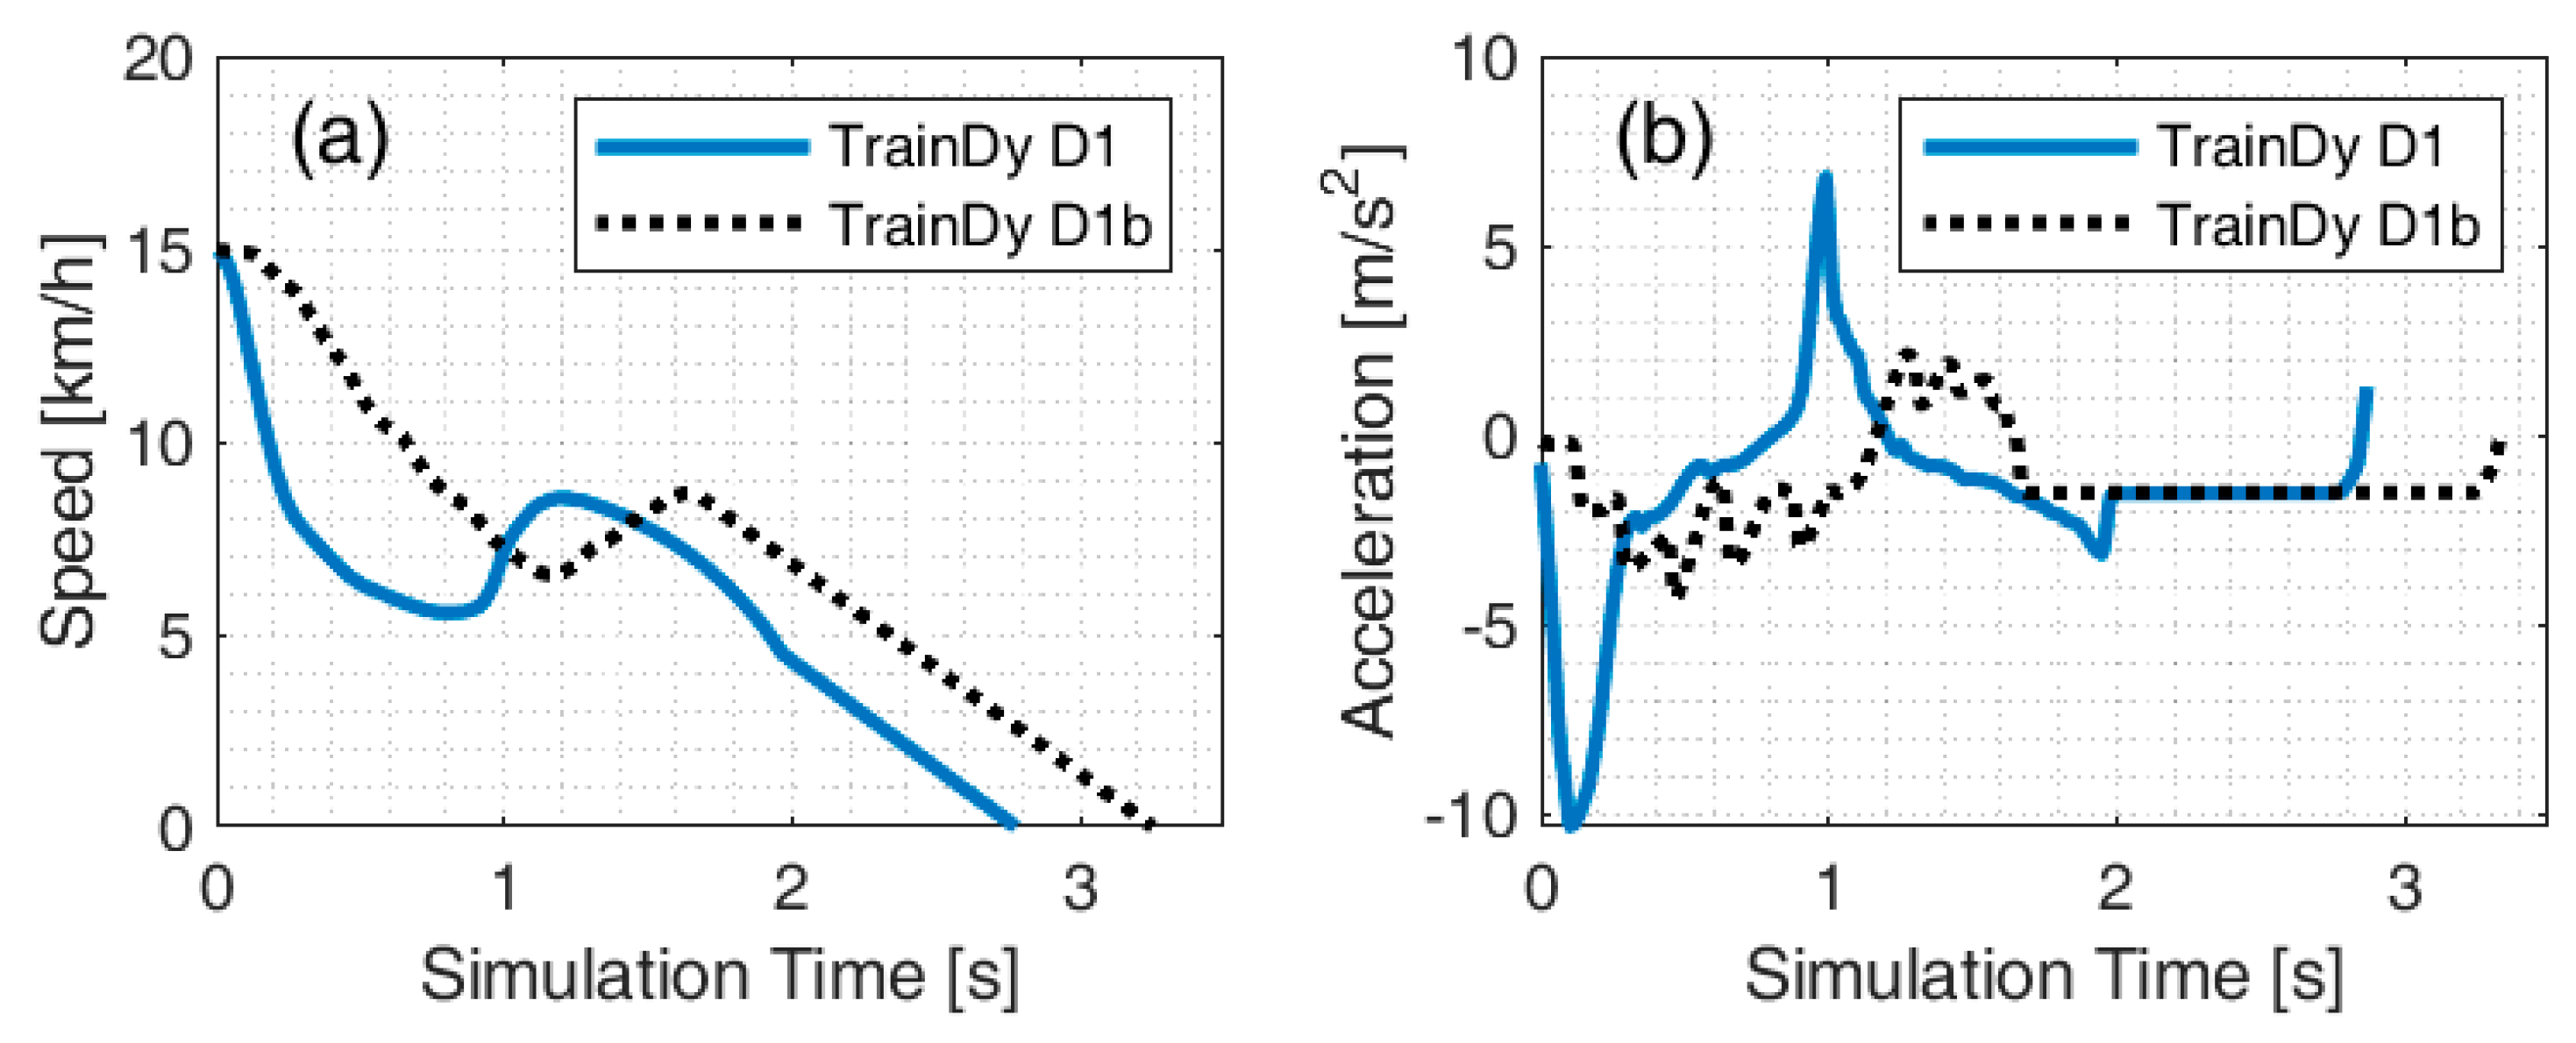
The more progressive application of the braking force obtained by increasing clamps spacing in EABS Type 1b compared to EABS Type 1 has a relevant effect in reducing the maximum values of deceleration, as shown in
Table 3. Compared to the corresponding scenarios with EABS type 1 (C1, D1, E1), braking distance increases by less than 2 m (6.5 m instead of 4.6 m), while deceleration maximum values are reduced by roughly 50% for the locomotive and the wagons of freight trains. The reduction is much lower (−11%) for the coaches (scenario H) because of the lower energy dissipated by the buffers used for passenger vehicles. Locomotive speed and acceleration for simulations D1 and D1b are shown in
Figure 8a,b.
4.3. Comparison of TrainDy Outputs with FE Model
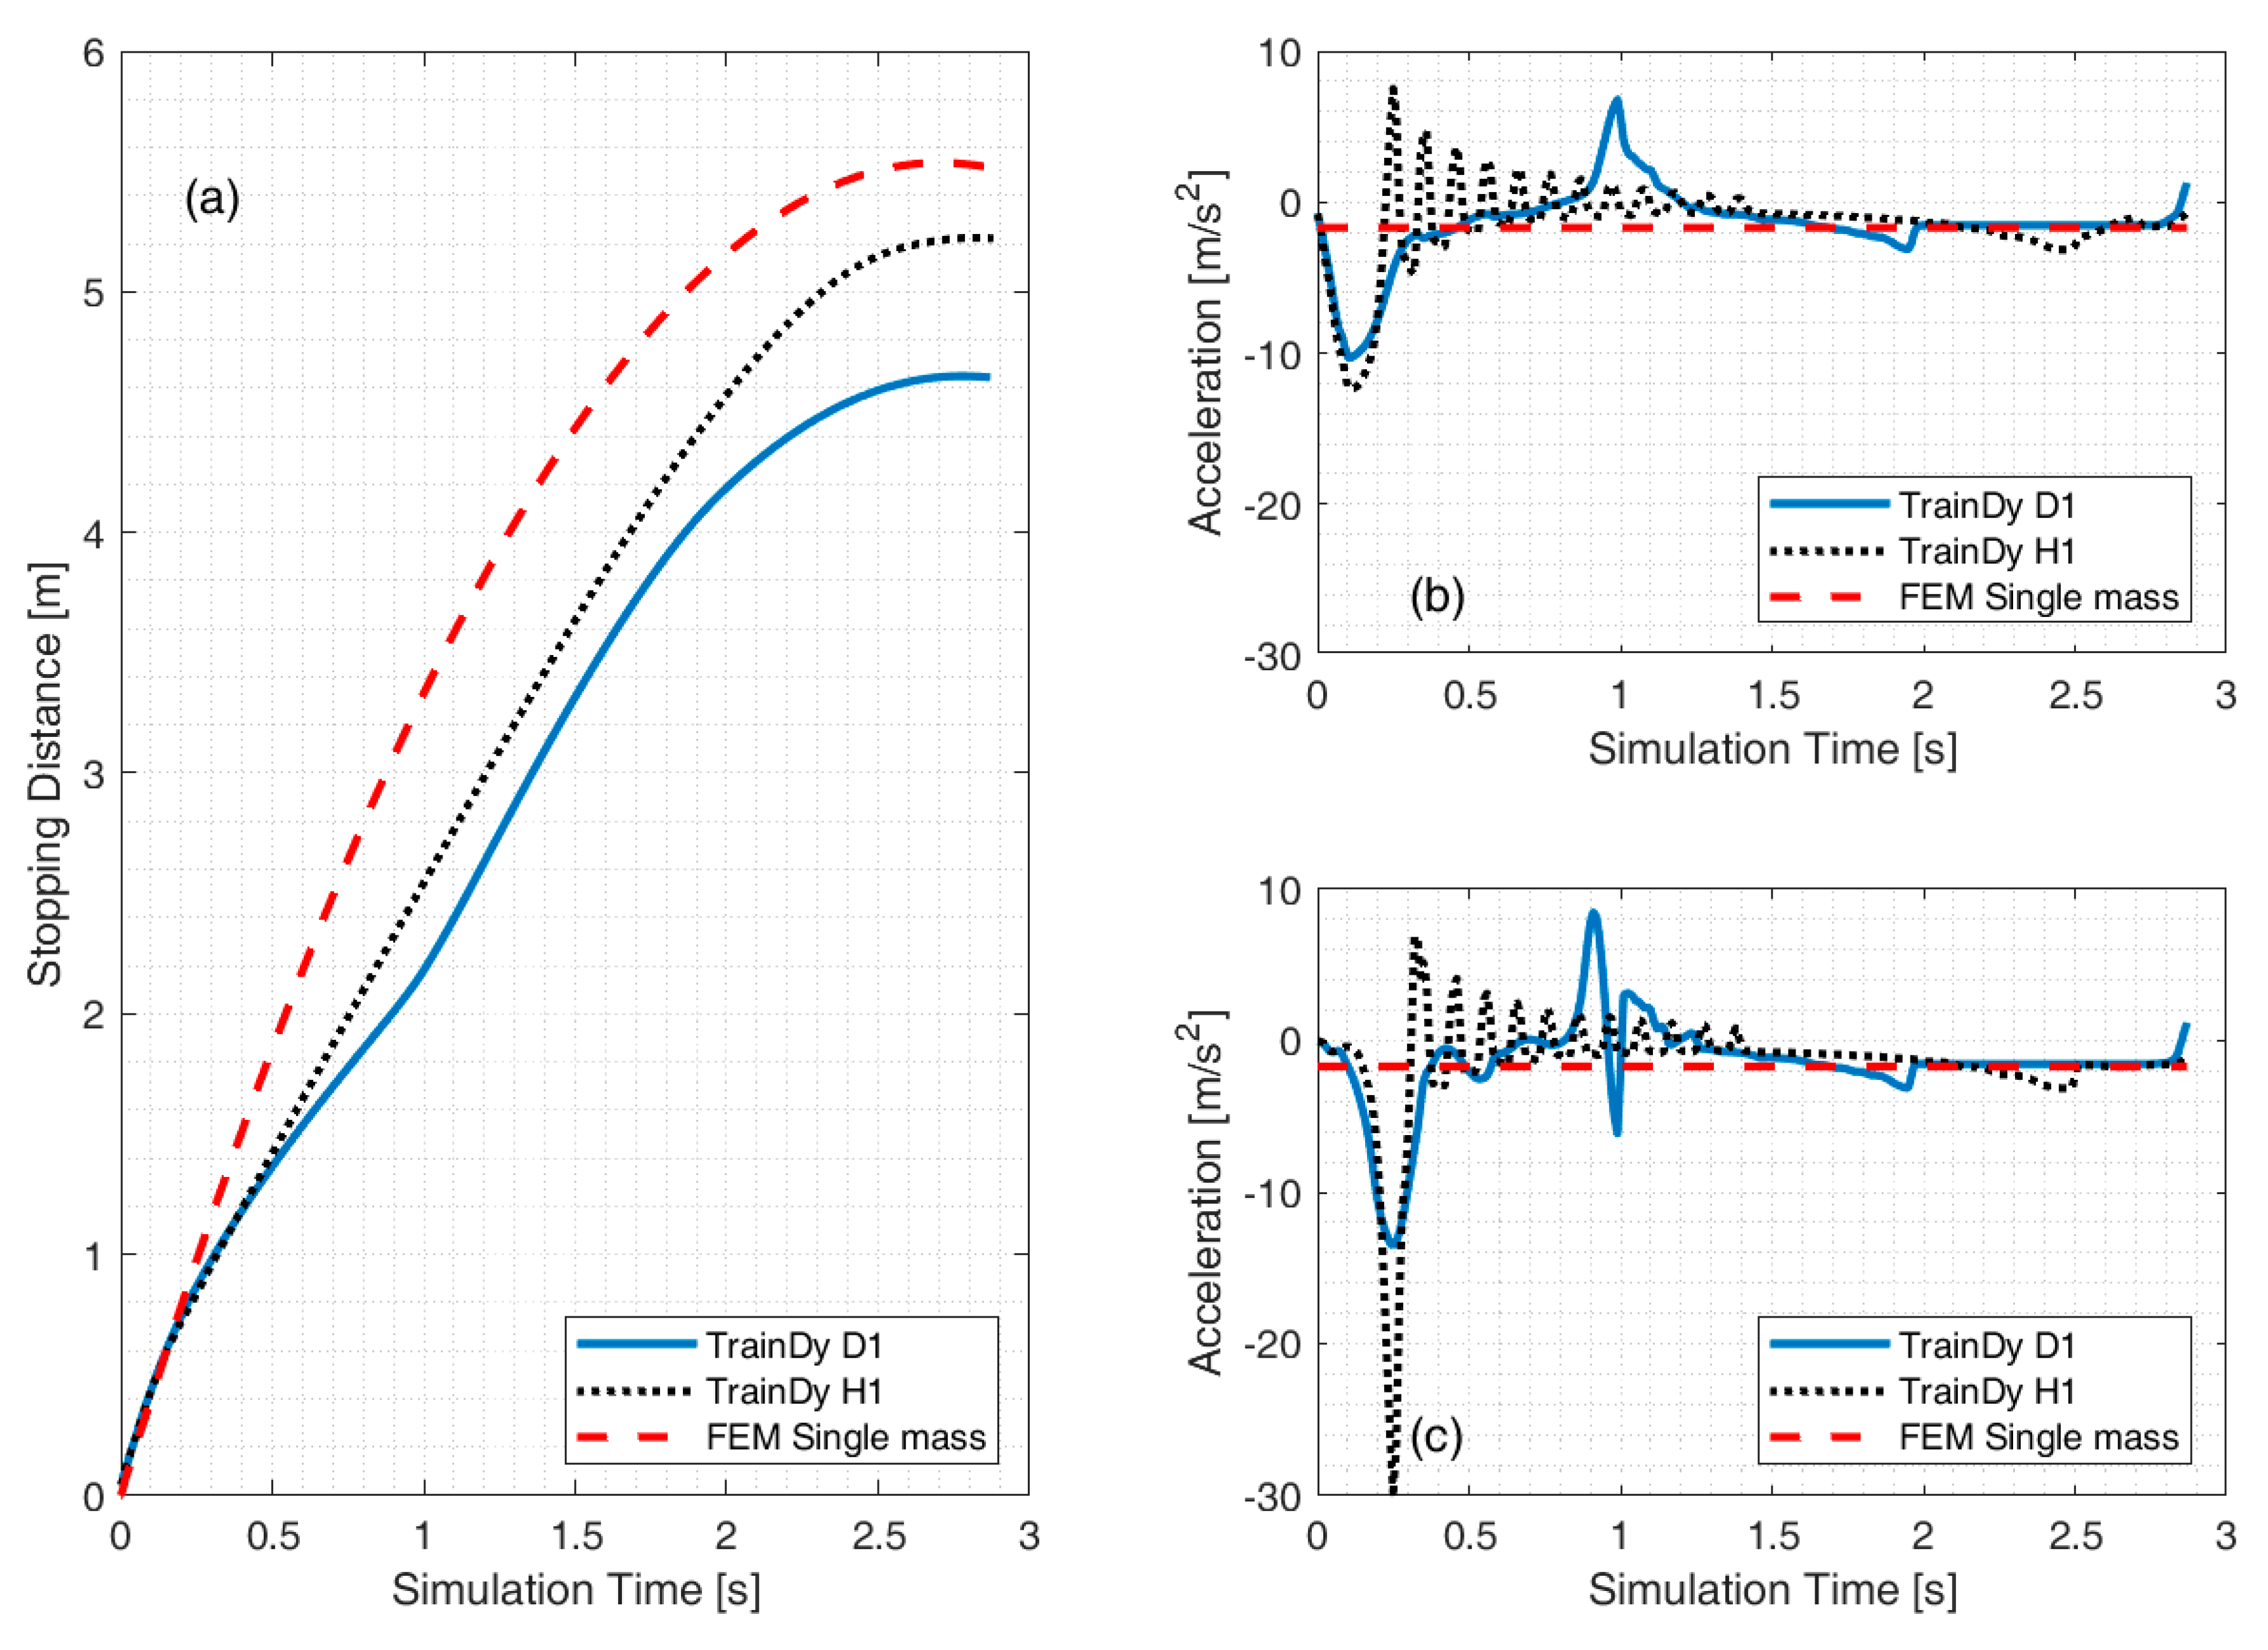
Three different EABS Type 1 scenarios at 15 km/h for trains with approximately the same mass (650 t for single mass FE, 658 t for D1 and 672 t for H1) and therefore nearly the same energy (5700 kJ for single mass, 5712 kJ for D1 and 5833 kJ for H1) are compared in
Figure 9a.
TrainDy stopping distances result are shorter (0.3 m for scenario H1 and 0.9 m for scenario D1) than those estimated by the FE model, while practically identical values are obtained (1.5 m/s
2) for both D1 and H1 scenarios.
The differences between the passenger train H1 and the freight train D1 can be explained considering the different characteristics of the vehicle buffers and the different train composition. The freight train is made of one locomotive (83 t) and 10 wagons (5 empty, 25 t each, and 5 laden, 90 t each), while the passenger train is made of one locomotive (72 t) and 12 empty coaches (50 t each). Even when empty wagons are included in the composition, the higher energy dissipation of freight buffers is clearly visible in
Figure 9b, in which the deceleration on the locomotives is compared, and
Figure 9c, showing the deceleration of the first vehicle.
While the peak locomotive deceleration is only slightly different due to the lower mass of the passenger locomotive, the dynamic effect of the 12 pushing coaches is clearly visible resulting in low damped oscillatory motion of the train. This low damped motion is not present in the freight train and the single vehicles have lower deceleration peak. The higher deceleration generated by the 5 laden wagons is visible between t = 1 s and t = 2 s.
4.4. Considerations of Structural Integrity of Collided Vehicles
While the single-mass FE approach does not give any insight into the structural behaviour of the vehicles involved in the collision,
TrainDy provides local accelerations that can be directly compared to proof load cases for both bogie-to-body connection and for equipment loads. For both, Table 13 of EN 12663-1 [
9] applies.
Passenger coaches (category P-I) and freight wagons (category F-I) are tested to withstand ±5 g longitudinal accelerations, and locomotives (category L) to withstand ±3 g longitudinal accelerations. It can be seen from
Table 2 above that these limits are never reached and that safety margins against major structural damages are still relatively high. On the other hand,
Figure 6 shows that, in some simulated scenarios (D1 and E1), the buffer stroke between vehicles can be completely recovered and the maximum force of the buffer can be exceeded. Therefore, buffers will need to be checked after a collision.
5. Conclusions
Energy Absorbing Buffer Stops (EABS) are designed to safely stop a train, limiting the consequences of dangerous overruns without damaging both the EABS and the vehicles. EABS requirements are based on a compromise between the stopping distance (linked to the installation length) and the maximum deceleration acting on the train.
This paper analysed the effect of Longitudinal Train Dynamics (LTD) on both friction EABS performances stop and vehicle behaviour using the TrainDy software, since simulations previously conducted with FE models on simplified scenarios, considering the colliding train as a single moving mass, were unable to accurately evaluate the influence of different train compositions.
Both passenger and freight trains were simulated including different vehicles and EABS braking characteristics. The following conclusions were reached:
- (1)
LTD has a relevant influence on peak decelerations during collision, especially if light wagons or coaches are considered, while the train behaves as a single body only when a braking steady state is reached, and buffers have found their balance length. Peak deceleration values up to 35 m/s2 were found, and the maximum deceleration values currently prescribed for EABS assessment (e.g., 2 m/s2 requested by Italian specifications) are respected only considering the average deceleration of the whole train.
- (2)
The number of vehicles, the mass of each vehicle and the type of couplers may considerably affect the peak deceleration and each specific application of EABS should be studied considering the details of the colliding train. Alternatively, the maximum acceleration value could be prescribed on the front plate/buffers of the EABS only.
- (3)
Deceleration peaks may be reduced by applying the braking force progressively, e.g., by increasing clamp spacing but, on the other hand, this increases the braking distance and therefore the EABS installation length. Simulations with five pairs of clamps spaced 500 mm apart have shown a 50% reduction in peak deceleration and an increase in braking distance of about 35% on average.
- (4)
Average acceleration and stopping distance computed with a FE model are not significantly modified by the introduction of LTD. Only minor differences were found in the stopping distance, which is lower when LTD is considered due to the energy dissipated by vehicle buffers. Single-mass simulations are then conservative and can be safely considered for EABS design.
- (5)
LTD allows the evaluation of maximum vehicle decelerations that influence the strength of both the bogie-to-body and equipment attachment connections with the values prescribed by, e.g., European Standards (±3 g for locomotives and ±5 g of longitudinal acceleration for wagons and coaches). All simulations performed with the introduction of LTD show that these limits are never exceeded, so the structural integrity of vehicles is preserved by EABS except for buffers, whose maximum applicable force is exceeded in some cases.
Author Contributions
Conceptualization, G.M., A.B.; methodology, G.M., L.C. and A.B.; software, G.M., L.C.; writing—original draft preparation, G.M.; writing—review and editing, G.M., L.C. and A.B. All authors have read and agreed to the published version of the manuscript.
Funding
The authors received no financial support for the research, authorship, and/or publication of this article.
Data Availability Statement
The raw data supporting the conclusions of this article will be made available by the authors on request.
Conflicts of Interest
The authors declared no potential conflicts of interest with respect to the research, authorship, and/or publication of this article.
References
- EN 14198:2016+A2:2021; Railway Applications—Braking—Requirements for the Brake System of Trains Hauled by Locomotives. CEN: Bruxelles, Brussels, 2021.
- Pfaff, R.; Enning, M.; Sutter, S. A risk-based approach to automatic brake tests for rail freight service: Incident analysis and realisation concept. SN Appl. Sci. 2022, 4, 115. [Google Scholar] [CrossRef]
- White, B.; Watson, M.; Lewis, R. A year-round analysis of railway station overruns due to low adhesion conditions. Proc. Inst. Mech. Eng. Part F J. Rail Rapid Transit 2023, 237, 458–469. [Google Scholar] [CrossRef]
- Available online: https://en.wikipedia.org/wiki/Buffer_stop (accessed on 24 April 2025).
- European Union Agency for Railways. Report on Railway Safety and Interoperability in the EU. 2024. Available online: https://www.era.europa.eu/system/files/2024-06/Report%20on%20Railway%20Safety%20and%20Interoperability%20in%20the%20EU%202024.pdf?t=1743600281 (accessed on 24 April 2025).
- Zhang, Z.; Liu, X.; Hu, H. Passenger rail station safety improvement and analysis of end-of-track collisions based on systems-theoretic accident modeling and processes (STAMP). Smart Resilient Transp. 2021, 3, 94–117. [Google Scholar] [CrossRef]
- Moturu, S.; Utterback, J. Safe Approach of Trains Into Terminal Stations. In American Society of Mechanical Engineers Digital Collection; American Society of Mechanical Engineers: New York City, NY, USA, 2018. [Google Scholar] [CrossRef]
- Buffer Stop Collision at Enfield Town Station. Report 13/2022. Available online: https://www.gov.uk/raib-reports/report-13-slash-2022-buffer-stop-collision-at-enfield-town-station (accessed on 24 April 2025).
- EN 12663-1:2010+A1:2014; Railway Applications—Structural Requirements of Railway Vehicle Bodies—Part 1: Locomotives and Passenger Rolling Stock (and Alternative Method For Freight Wagons). CEN: Bruxelles, Brussels, 2014.
- EN 15227-1:2020; Railway Applications—Crashworthiness Requirements for Rail Vehicles. CEN: Bruxelles, Brussels, 2020.
- Oleo Hydraulic Principle. Available online: https://www.oleo.co.uk/hydraulic-principle (accessed on 24 April 2025).
- Cole, C.; Spiryagin, M.; Wu, Q.; Sun, Y.Q. Modelling, simulation and applications of longitudinal train dynamics. Veh. Syst. Dyn. 2017, 55, 1498–1571. [Google Scholar] [CrossRef]
- Grabner, G.; Kecskeméthy, A. Dynamic Simulation of Colliding Trains for Buffer Stop Dimensioning. PAMM 2003, 3, 156–157. [Google Scholar] [CrossRef]
- Kowalczyk, D. Railway Buffer Stops, Railway Reports—Issue 202 (December 2024), ISSN 0552-2145 (print) ISSN 2544-9451 (on-line). Available online: https://problemykolejnictwa.pl/images/PDF/202_4E.pdf (accessed on 24 April 2025).
- Guziur, P. Friction Buffer Stop Design. Acta Polytech. CTU Proc. 2017, 11, 12–15. [Google Scholar] [CrossRef]
- Rete Ferroviaria Italiana. Specifica Tecnica di Fornitura RFI DTCSI SF AR 01 001 1 A—Paraurti ad azione frenante, 09.06.2021, RFI SpA. Available online: https://epodweb.rfi.it/ePod.WebClients.Docs.Blazor/documentCard/detail/1180626 (accessed on 24 April 2025).
- Megna, G.; Bracciali, A. Structural and dynamic assessment of a friction buffer stop. IOP Conf. Ser. Mater. Sci. Eng. 2024, 1306, 012022. [Google Scholar] [CrossRef]
- Cantone, L. TrainDy: The new Union Internationale des Chemins de Fer software for freight train interoperability. Proc. IMechE Part F J. Rail and Rapid Transit 2011, 225, 57–70. [Google Scholar] [CrossRef]
- Cantone, L.; Durand, T.; Ottati, A.; Russo, G.; Tione, R. The Digital Automatic Coupler (DAC): An Effective Way to Sustainably Increase the Efficiency of Freight Transport in Europe. Sustainability 2022, 14, 15671. [Google Scholar] [CrossRef]
- IRS 40421; Rules for the Consist and Braking of International Freight Trains, 1st ed. UIC: Paris, France, 2021.
Figure 1.
Example of a friction energy-absorbing buffer stop installed on a blind track in a station. (Photo by one of the authors).
Figure 1.
Example of a friction energy-absorbing buffer stop installed on a blind track in a station. (Photo by one of the authors).
Figure 2.
(
a) vertical displacements [mm] for the EABS described in [
17] calculated resulting from the FE model considering a hitting mass of 650 t moving at 15 km/h. (
b) braking forces exerted by the clamps for EABS Type 1, EABS Type 1b and EABS Type 2 resulting from FE model.
Figure 2.
(
a) vertical displacements [mm] for the EABS described in [
17] calculated resulting from the FE model considering a hitting mass of 650 t moving at 15 km/h. (
b) braking forces exerted by the clamps for EABS Type 1, EABS Type 1b and EABS Type 2 resulting from FE model.
Figure 3.
(a,b) force–displacement characteristics of two different generic buffers (Buffer 1 and Buffer 2); (c) resulting force–displacement characteristic from the coupling of the previous buffers (upper curves: loading, lower curves: unloading).
Figure 3.
(a,b) force–displacement characteristics of two different generic buffers (Buffer 1 and Buffer 2); (c) resulting force–displacement characteristic from the coupling of the previous buffers (upper curves: loading, lower curves: unloading).
Figure 4.
(a) Piecewise-linear and (b) bilinear buffer of the locomotive from the TrainDy database; (c) Freight buffer; (d) Passenger buffer; (e) Freight draw gear; (f) Passenger draw gear (upper curves: loading, lower curves: unloading).
Figure 4.
(a) Piecewise-linear and (b) bilinear buffer of the locomotive from the TrainDy database; (c) Freight buffer; (d) Passenger buffer; (e) Freight draw gear; (f) Passenger draw gear (upper curves: loading, lower curves: unloading).
Figure 5.
Locomotive speed in scenarios B2 (a) and D2 (c). Acceleration of all vehicles (each coloured line represents a vehicle from the first one, i.e., the locomotive, to the last) in scenarios B2 (b) and D2 (d).
Figure 5.
Locomotive speed in scenarios B2 (a) and D2 (c). Acceleration of all vehicles (each coloured line represents a vehicle from the first one, i.e., the locomotive, to the last) in scenarios B2 (b) and D2 (d).
Figure 6.
Relative buffer compression percentage during Phase III with reference to the nominal length of 105 mm each, for freight train simulations (A to E) and EABS type 1. Position 0 represents the locomotive hitting the buffer stop. The upper colour bar indicates the percentage of buffer compression from 80% (deep blue) to 112% (deep red).
Figure 7.
Stopping distances (a) and mean decelerations (b) for scenarios A, C, D, E as a function of energy and braking force, i.e., EABS Type 1 and Type 2. Mean deceleration values (c) as a function of the train mass for freight simulations and EABS type 1 (solid line) and EABS type 2 (dashed line). BS = EABS type.
Figure 8.
Effect of clamp spacing (D1 = 50 mm, D2 = 500 mm) on locomotive speed (a) and locomotive acceleration (b).
Figure 8.
Effect of clamp spacing (D1 = 50 mm, D2 = 500 mm) on locomotive speed (a) and locomotive acceleration (b).
Figure 9.
Comparison of FE and LTD approach for three different simulations involving 5700 kJ braked with EABS Type 1 in terms of stopping distance (a), locomotive deceleration (b) and first hauled vehicle deceleration (c).
Figure 9.
Comparison of FE and LTD approach for three different simulations involving 5700 kJ braked with EABS Type 1 in terms of stopping distance (a), locomotive deceleration (b) and first hauled vehicle deceleration (c).
Table 1.
Summary of simulated train compositions and impact energy.
Table 1.
Summary of simulated train compositions and impact energy.
| Simulations with Freight Trains |
|---|
| Scenario | Number of Empty
Wagons | Number of Laden
Wagons | Length
[m] | Mass
[t] | Speed
[km/h] | Energy
[kJ] |
|---|
| A | 0 | 11 | 228 | 1073 | 7 | 2028 |
| B | 17 | 0 | 343 | 508 | 10 | 1960 |
| C | 30 | 0 | 590 | 833 | 10 | 3214 |
| D | 5 | 5 | 209 | 658 | 15 | 5712 |
| E | 5 | 10 | 305 | 1108 | 15 | 9618 |
| Simulations with Passenger Trains |
| Scenario | Number of empty
coaches | Number of laden
coaches | Length
[m] | Mass
[t] | Speed
[km/h] | Energy
[kJ] |
| F | 2 | 5 | 198 | 507 | 10 | 1956 |
| G | 0 | 6 | 172 | 474 | 15 | 4115 |
| H | 12 | 0 | 328 | 672 | 15 | 5833 |
Table 2.
Results for freight and passenger train simulations with Type 1 and Type 2 EABS (values in brackets for Type 2).
Table 2.
Results for freight and passenger train simulations with Type 1 and Type 2 EABS (values in brackets for Type 2).
| Simulations with Freight Trains |
|---|
| Scenario | A1 (A2) | B1 (B2) | C1 (C2) | D1 (D2) | E1 (E2) |
|---|
| Energy [kJ] | 2028 | 1960 | 3214 | 5712 | 9618 |
| Stopping distance [m] | 1.1 (4.1) | 0.9 (4.1) | 0.9 (6.2) | 4.6 (12.1) | 7.8 (20.0) |
| Locomotive dec [m/s2] | −7.6 (−4.3) | −9.7 (−4.4) | −9.7 (−4.4) | −10.3 (−4.5) | −10.3 (−4.5) |
| Max wagon dec [m/s2] | −10.9 (−5.0) | −34.3 (−15.7) | −35.4 (−15.8) | −22.4 (−12.7) | −22.4 (−12.7) |
| Mean deceleration [m/s2] | −0.9 (−0.4) | −1.8 (−0.8) | −1.1 (−0.5) | −1.5 (−0.7) | −0.9 (−0.4) |
| Simulations with Passenger Trains |
| | F1 (F2) | G1 (G2) | H1 (H2) |
| Energy [kJ] | 1956 | 4115 | 5833 |
| Stopping distance [m] | 1.7 (4.2) | 3.9 (9.0) | 5.2 (12.5) |
| Locomotive dec [m/s2] | −11.6 (−5.0) | −12.4 (−5.0) | −12.4 (−5.0) |
| Max coach dec [m/s2] | −27.3 (−11.7) | −27.8 (−11.9) | −32.8 (−15.4) |
| Mean dec [m/s2] | −1.9 (−0.9) | −2.1 (−0.9) | −1.5 (−0.7) |
Table 3.
Results for freight scenarios with EABS Type 1b compared to scenarios with EABS Type 1.
Table 3.
Results for freight scenarios with EABS Type 1b compared to scenarios with EABS Type 1.
| | D1b | Change
from D1 | E1b | Change
from E1 | H1b | Change
from H1 |
|---|
| Energy [kJ] | 5712 | - | 9618 | - | 5833 | - |
| Stopping distance [m] | 6.5 | +41% | 9.7 | +25% | 7.1 | +36% |
| Max loco dec [m/s2] | −4.3 | −58% | −4.3 | −58% | −4.3 | −65% |
| Max vehicle dec [m/s2] | −11.9 | −47% | −11.9 | −47% | −29.1 | −11% |
| Mean dec [m/s2] | −1.3 | −15% | −0.8 | −9% | −1.3 | −17% |
| Disclaimer/Publisher’s Note: The statements, opinions and data contained in all publications are solely those of the individual author(s) and contributor(s) and not of MDPI and/or the editor(s). MDPI and/or the editor(s) disclaim responsibility for any injury to people or property resulting from any ideas, methods, instructions or products referred to in the content. |
© 2025 by the authors. Licensee MDPI, Basel, Switzerland. This article is an open access article distributed under the terms and conditions of the Creative Commons Attribution (CC BY) license (https://creativecommons.org/licenses/by/4.0/).


