Article

Study on the Aerodynamic Wind Pressure Behavior Characteristics of High-Speed Railway Sound Barriers

1
Jinan-Qingdao High Speed Railway Co., Ltd., Jinan 250108, China
2
School of Qilu Transportation, Shandong University, Jinan 250061, China
3
School of Civil Engineering, Shandong University, Jinan 250061, China
*
Author to whom correspondence should be addressed.
Dynamics 2025, 5(2), 14; https://doi.org/10.3390/dynamics5020014
Submission received: 17 February 2025 / Revised: 18 March 2025 / Accepted: 27 March 2025 / Published: 2 April 2025

Abstract

:
As high-speed train operations increase, the aerodynamic pressure generated by these trains can jeopardize the structural integrity of sound barriers, potentially compromising train safety and the stability of nearby facilities. This paper investigates the unique aerodynamic pressures and load distribution of various types of sound barriers. We analyze the aerodynamic pressure distribution on sound barriers in relation to high-speed trains by utilizing Computational Fluid Dynamics (CFDs) analysis. We explore the theoretical foundations, design of the computational domain, and settings for boundary conditions. The findings indicate that high-speed trains generate both overpressure from compression waves and under pressure from expansion waves. As the barriers become more open, peak aerodynamic pressure and fluctuations decrease. Notably, the highest pressure occurs at the entrance of the barriers. The accuracy of the model is validated with data from a CRH series train traveling at 350 km/h. This paper offers valuable insights to enhance our understanding and improve sound barrier design for a quieter future.

1. Introduction

High-speed railways are widely considered one of the most efficient forms of transportation because of their benefits in safety, comfort, and reliability. However, as high-speed railway networks rapidly develop, the noise generated by trains significantly increases with operating speeds, presenting a serious environmental challenge to areas adjacent to the railway lines. Installing sound barriers along high-speed railways has proven to be an effective solution for controlling train-induced noise and has been widely implemented in practical engineering projects [1,2,3,4].
Substantial advancements have been achieved in sound barrier research. Numerous researchers have corroborated the noise reduction efficacy of various structural types of sound barriers within the acoustics domain, indicating that the body of research in this field is fairly developed. For instance, Luo et al. [5,6,7] conducted a comprehensive comparison of different sound-absorbing barriers’ noise reduction performance through theoretical calculations and statistical energy analysis. Li et al. [8,9] examined the noise reduction differences between semi-enclosed and fully enclosed barriers by integrating finite element simulations with experimental models. Wen et al. [10] assessed the noise reduction abilities of fully enclosed barriers constructed from varied materials via full-scale testing. Additionally, Xin et al. [11] utilized highly realistic simulation techniques to anticipate the noise reduction capabilities of fully enclosed barriers. Meanwhile, the detrimental impact of fluctuating wind pressure on railway infrastructure and vehicles continues to pose a considerable technical obstacle in the railway sector [12,13].
Research indicates that the strong airflow disturbances created by high-speed trains can produce intense and unstable transient aerodynamic pressures on the surfaces of sound barrier panels, see Figure 1. These aerodynamic impacts may cause structural deformation, panel breakage, component detachment, the loosening of fasteners, and the deterioration of structural plates [14,15]. If such conditions persist, continuous exposure to fluctuating wind pressure can lead to fatigue-induced structural failure. For example, sound barriers on German railways suffered damage due to the pulsating wind pressure from passing trains, resulting in significant structural failures and considerable financial losses [16]. As a result, the aerodynamic impacts and the structural integrity of sound barriers have emerged as key areas of research.
Researchers globally utilize CFD software to model the airflow around high-speed trains. For instance, Belloli et al. [17] examined fluid–structure interactions as high-speed trains approach vertical sound barriers. He et al. [18,19] investigated the aerodynamic pressure distribution on fully enclosed sound barriers via Fluent software. Long et al. [20] demonstrated the characteristics of pulsating wind pressure on sound barriers through numerical simulations. Han et al. [21] employed three-dimensional numerical models to study wall pressure distribution on semi-enclosed sound barriers in the context of 350 km/h high-speed trains. Jing et al. [22] utilized a crosswind–moving train wind tunnel test system to explore wind pressure distribution on sound barriers considering both crosswind and train-induced airflow effects.
Previous studies have mainly concentrated on the noise reduction performance of sound barriers, while research on transient aerodynamic pressure has been relatively limited. Additionally, the sound barrier structures examined in these studies were often simplified and primarily restricted to vertical sound barriers. There is also a scarcity of simulations analyzing the dynamic performance of sound barrier structures influenced by pulsating aerodynamic pressure caused by high-speed trains. In particular, systematic studies comparing the pressure characteristics of various types of sound barriers are still lacking.
This study performs a thorough simulation analysis of vertical, semi-enclosed, and fully enclosed sound barriers to address the aforementioned gaps. By comparing the aerodynamic pressure distribution characteristics of the three types of sound barriers, the study examines the effect of aerodynamic pressure from high-speed trains on these structures. Furthermore, it offers recommendations for the suitable application conditions of different sound barriers, providing theoretical support for optimizing sound barrier designs and assessing their performance.

2. Numerical Analysis Theory and Model

2.1. Computational Method

In this paper, the accurate, efficient, and highly applicable Realizable k-ε turbulence model is utilized for the numerical simulation of the flow field and aerodynamic wind pressure loads. The equations of the Realizable k-ε model are as follows [22,23]:
ρ k t + ρ u j ¯ k x j = x j μ + μ t σ k k x j + P k ρ ε
ρ ε t + ρ u j ¯ ε x j = x j μ + μ t σ ε ε x j + ρ C 1 S ¯ ε ρ C 2 ε 2 k + ν ε 1 2
where   u j ¯ is the velocity of the flow field around the train, ρ is the air density, k is the turbulent kinetic energy, ε is the turbulent dissipation rate, μ is the air pressure viscosity, μt is the eddy viscosity coefficient, t is time, σk and σε are the Prandtl numbers corresponding to the turbulent kinetic energy and dissipation rate, respectively, 1.0 and 1.2 [22,23], Pk is the production term of turbulent kinetic energy caused by the mean velocity gradient, and C2 is a constant, taken as 1.9 [24], C 1 = m a x 0.43 , η η + 5 , η = k / ε S ¯ , S ¯ = 2 S ¯ i j S ¯ i j 1 2 , S ¯ i j = 1 2 u i ¯ / x j ¯ + u j ¯ / x i ¯ .

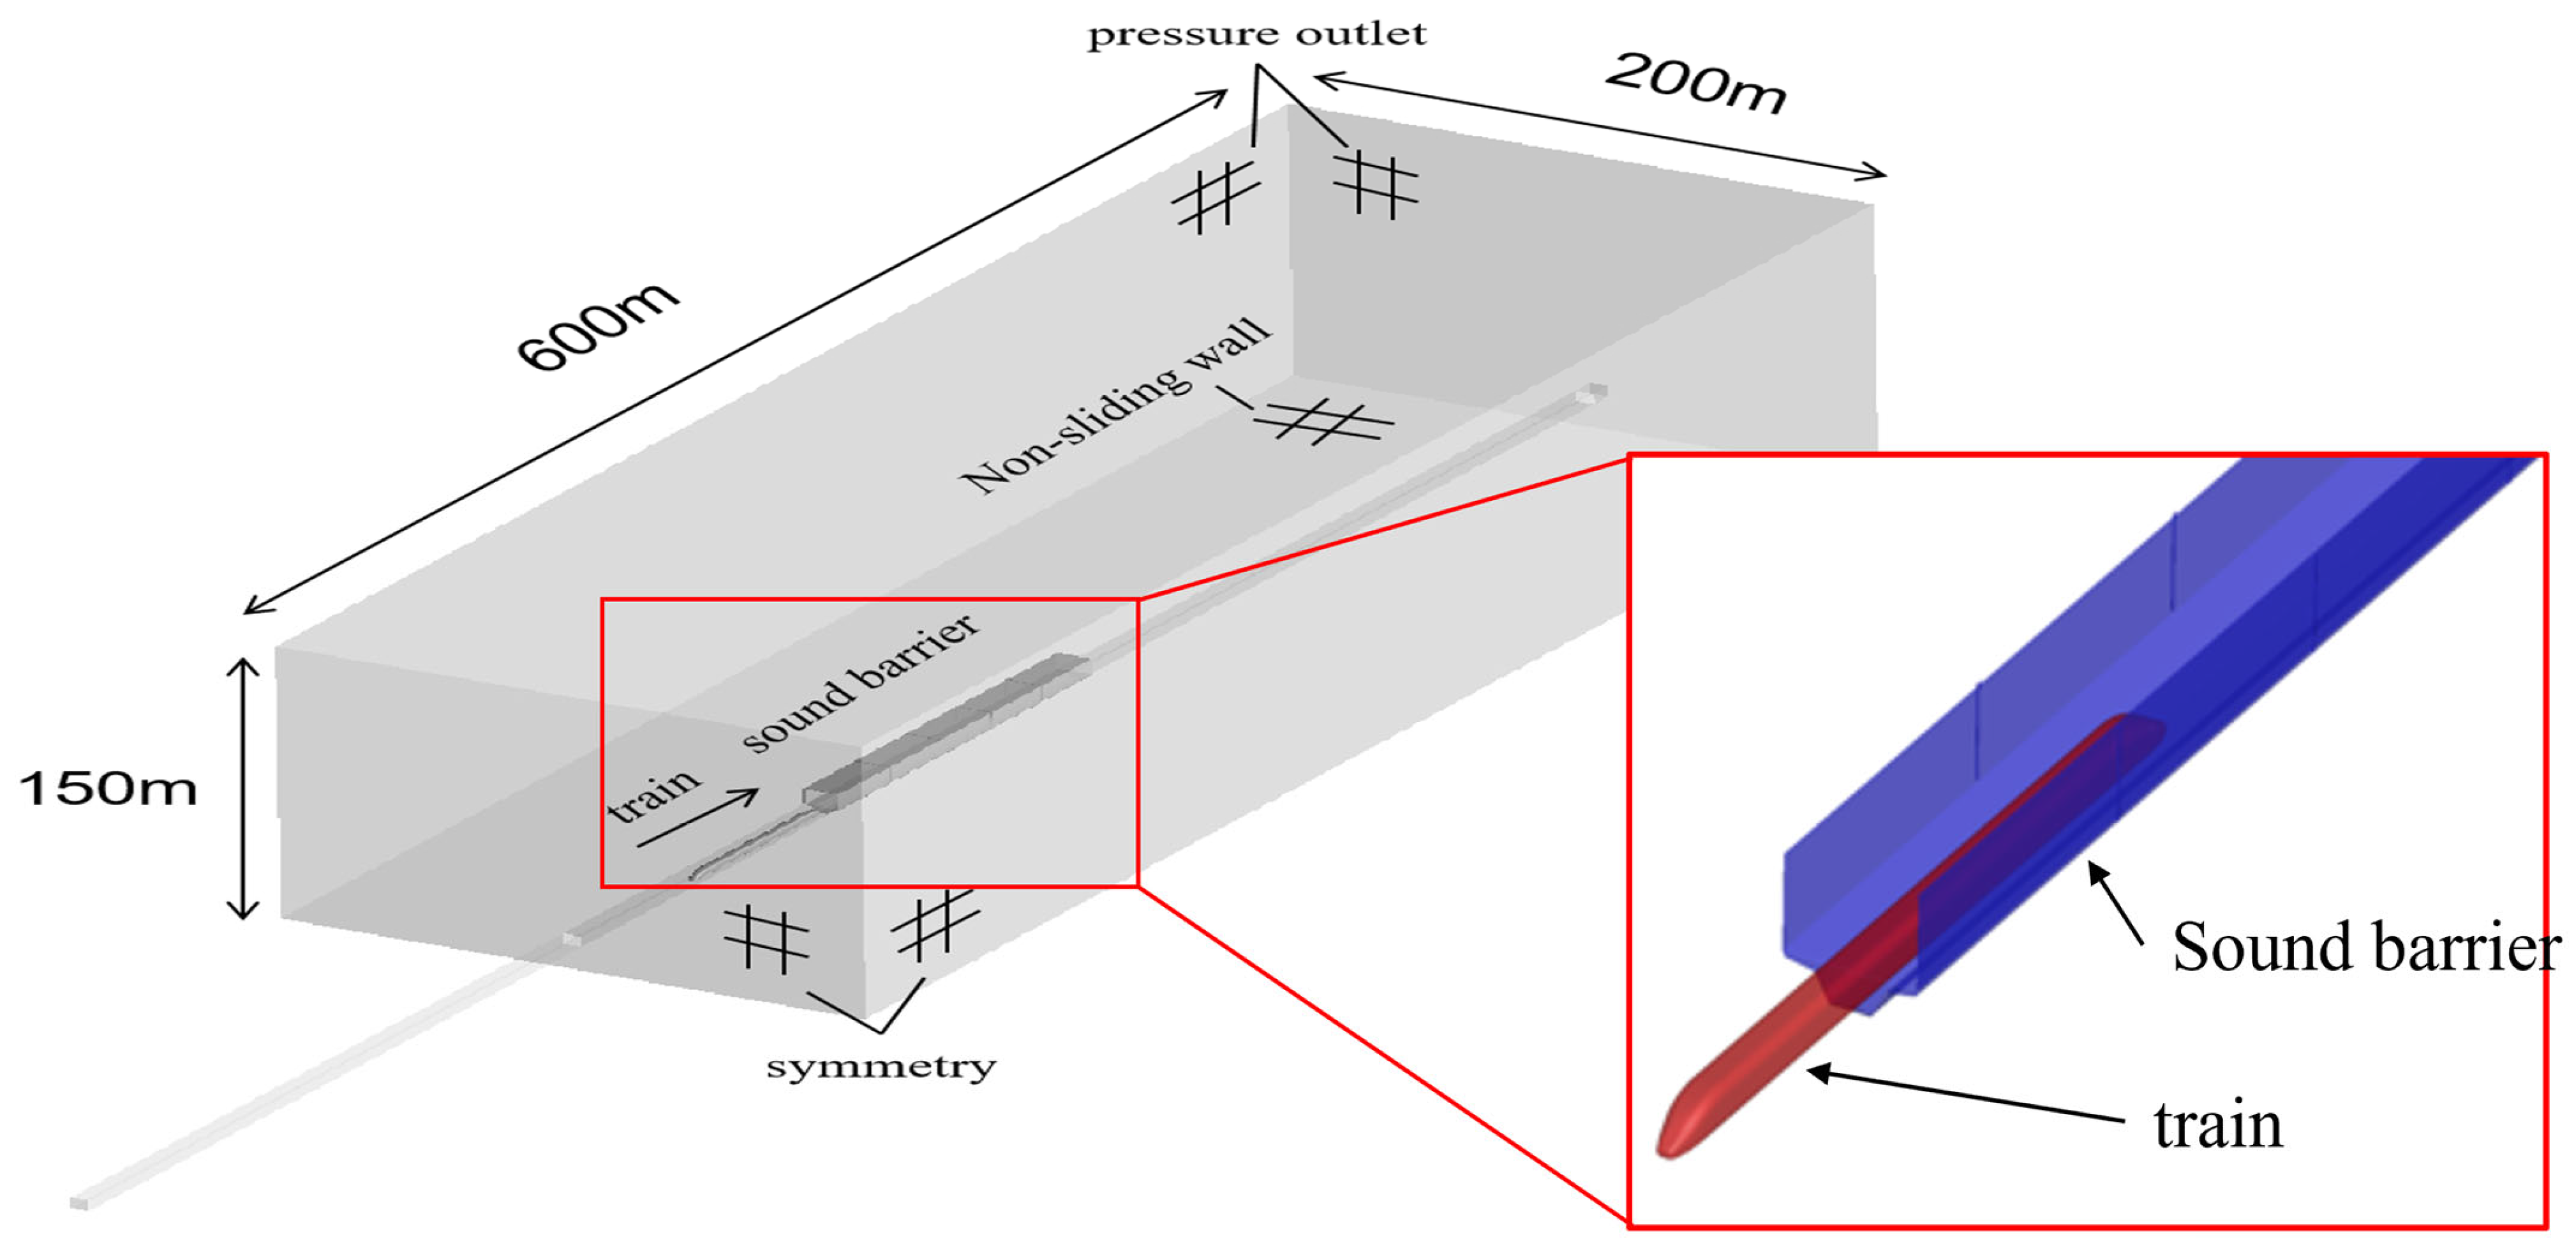
2.2. Computational Domain and Boundary Conditions

For high-speed trains in open air, it is typically advisable to utilize scaled models to effectively capture the airflow surrounding the train. Nonetheless, model scale effects may notably affect the aerodynamic features resulting from a train moving past sound barriers [23]. To remedy this, we created a full-scale computational domain for a single train passing through sound barriers, illustrated in Figure 2. The train’s starting position was designated at 60 m from the entrance of the sound barrier, ensuring that the flow field was fully developed and reduced the impact of boundary conditions on the flow structures around the train. The size of the computational domain in this research surpasses the criteria outlined in the CEN European Standards [24].
The sliding mesh technique was employed to simulate the relative motion between a high-speed train traveling at 350 km/h and sound barriers. The computational domain was divided into stationary and moving regions. The stationary region, which includes the sound barrier located at its center, measures 600 m × 200 m × 150 m (length × width × height), while the moving region, which contains the train, has a length of 400 m, see Figure 2. Wall boundary conditions (no-slip) were applied to the bottom surface, the sound barrier, and the surfaces of the train using Fluent’s “wall” setting. The inlet, outlet, and side surfaces of the computational domain were defined as pressure outlet boundaries with a reference pressure of 0 Pa. Additionally, an interface was established between the stationary and moving regions to enable data exchange during the simulation [25].

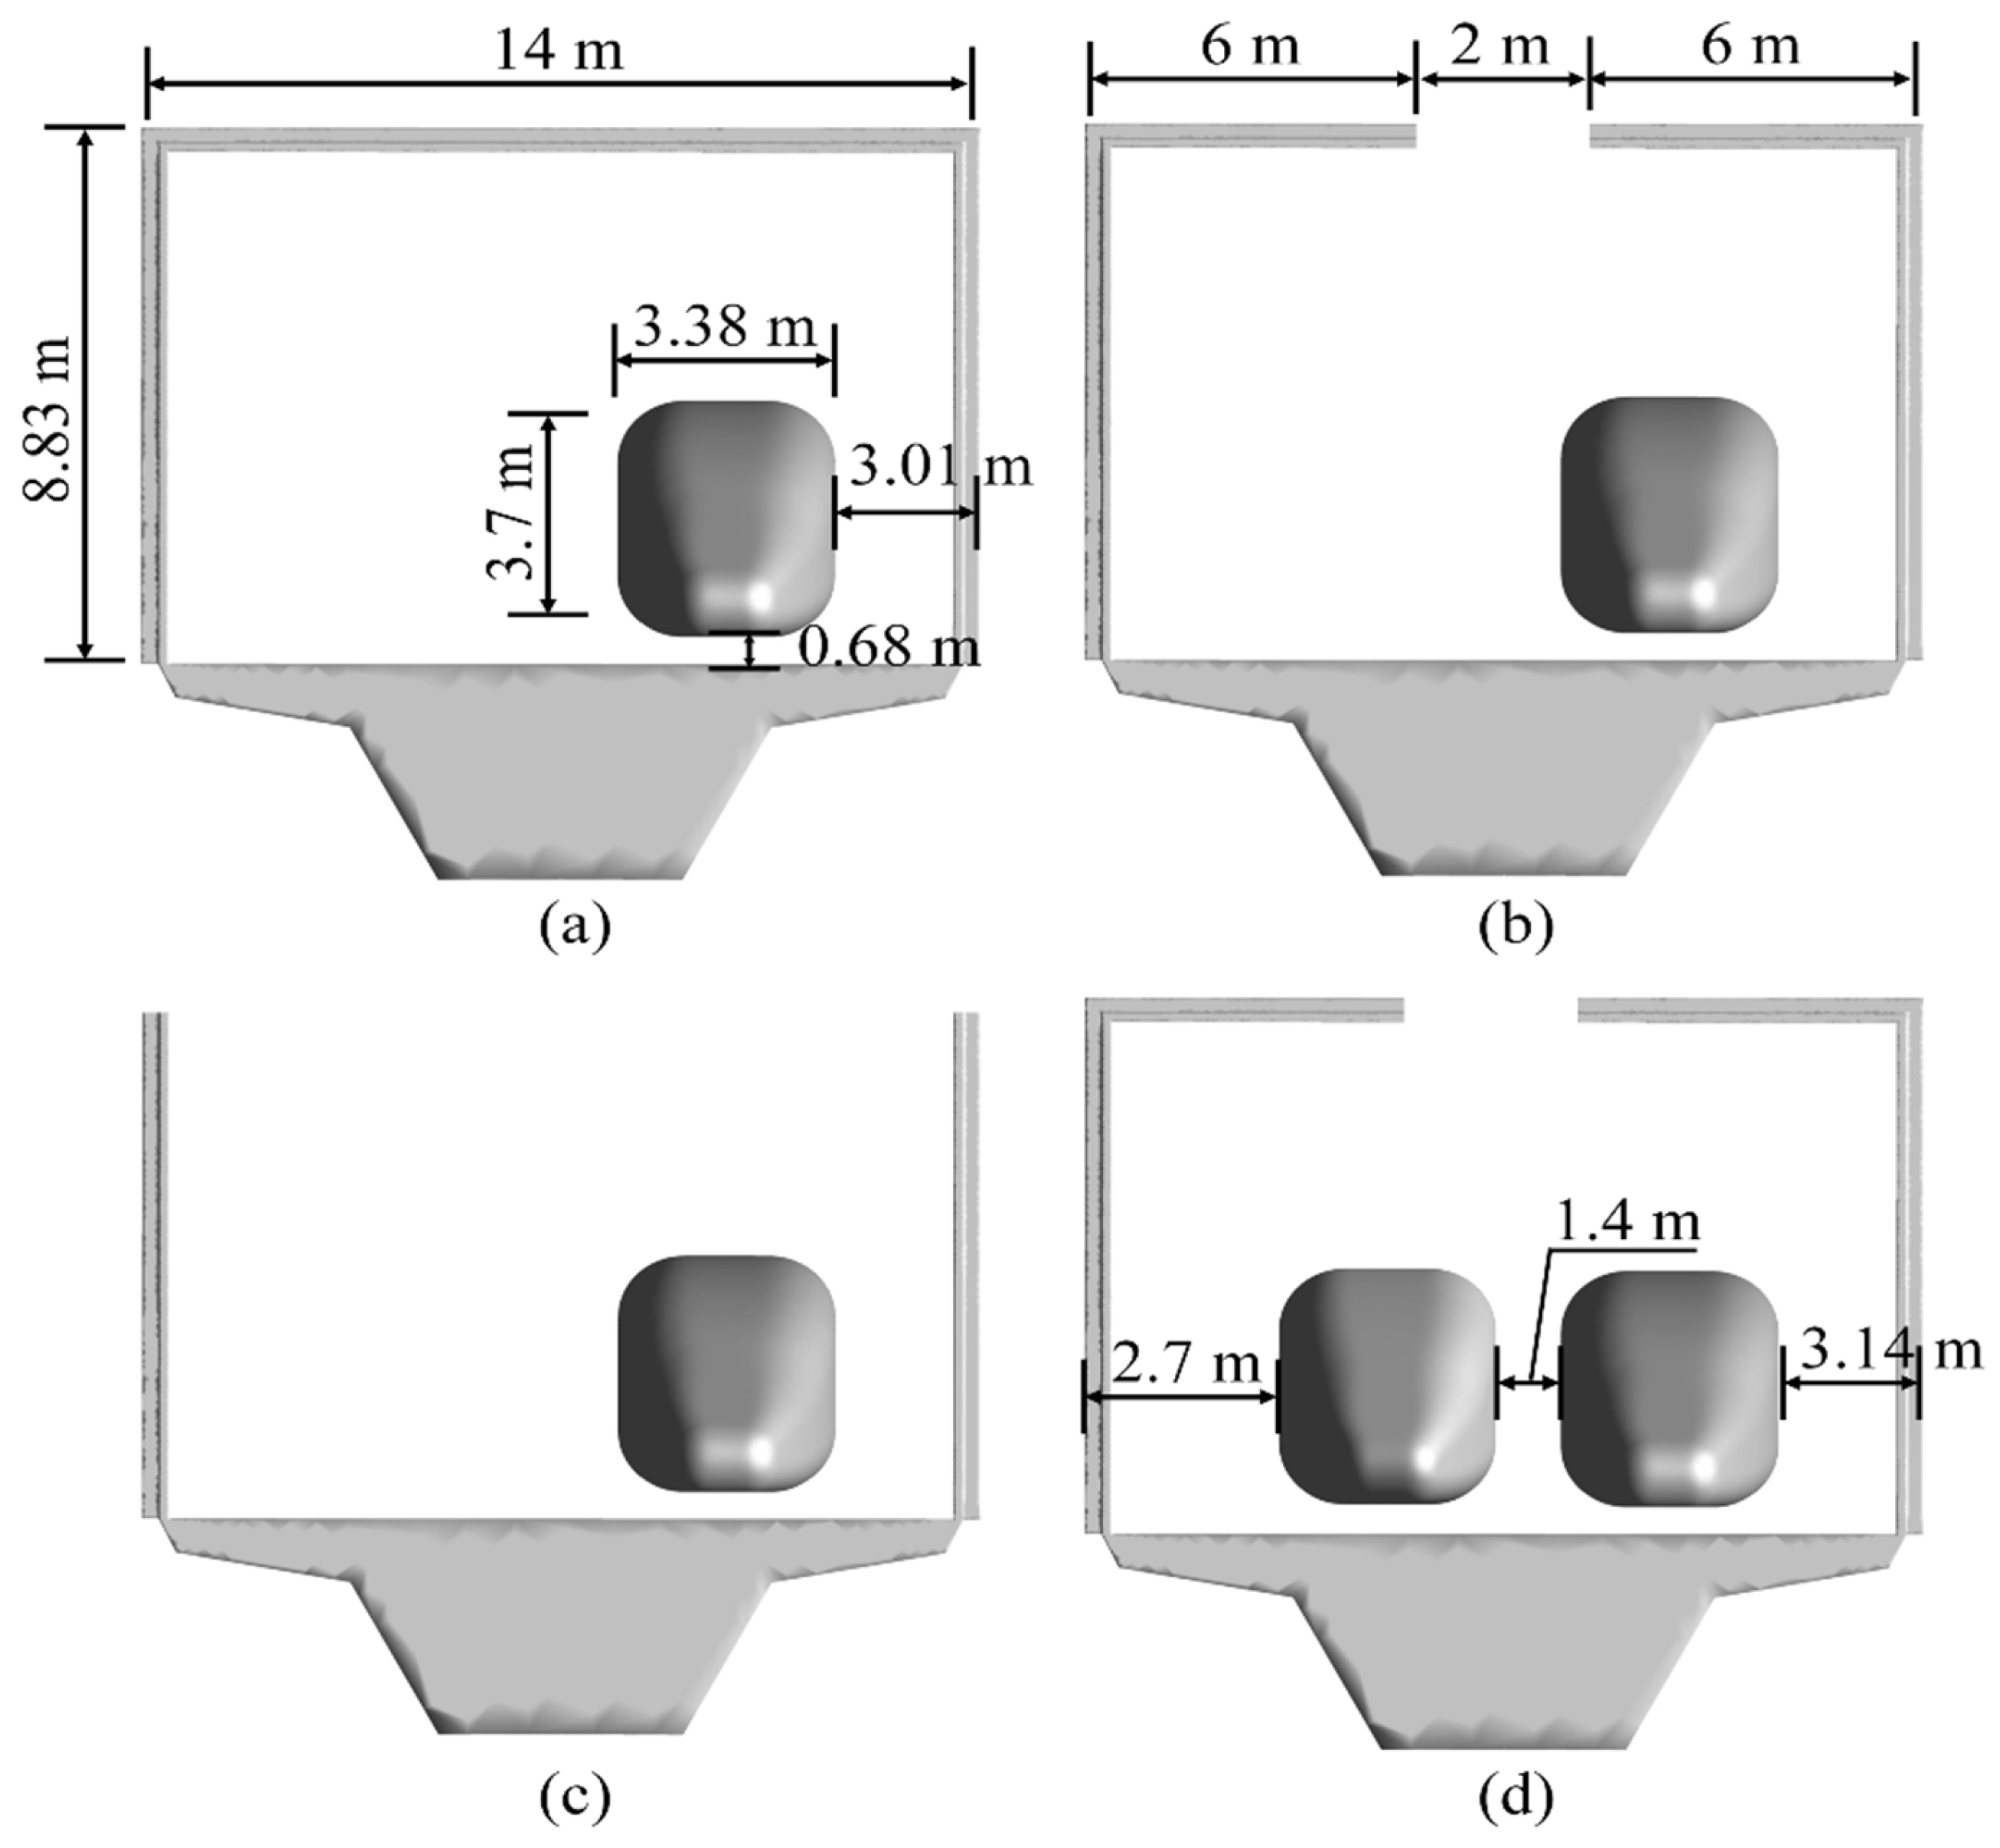
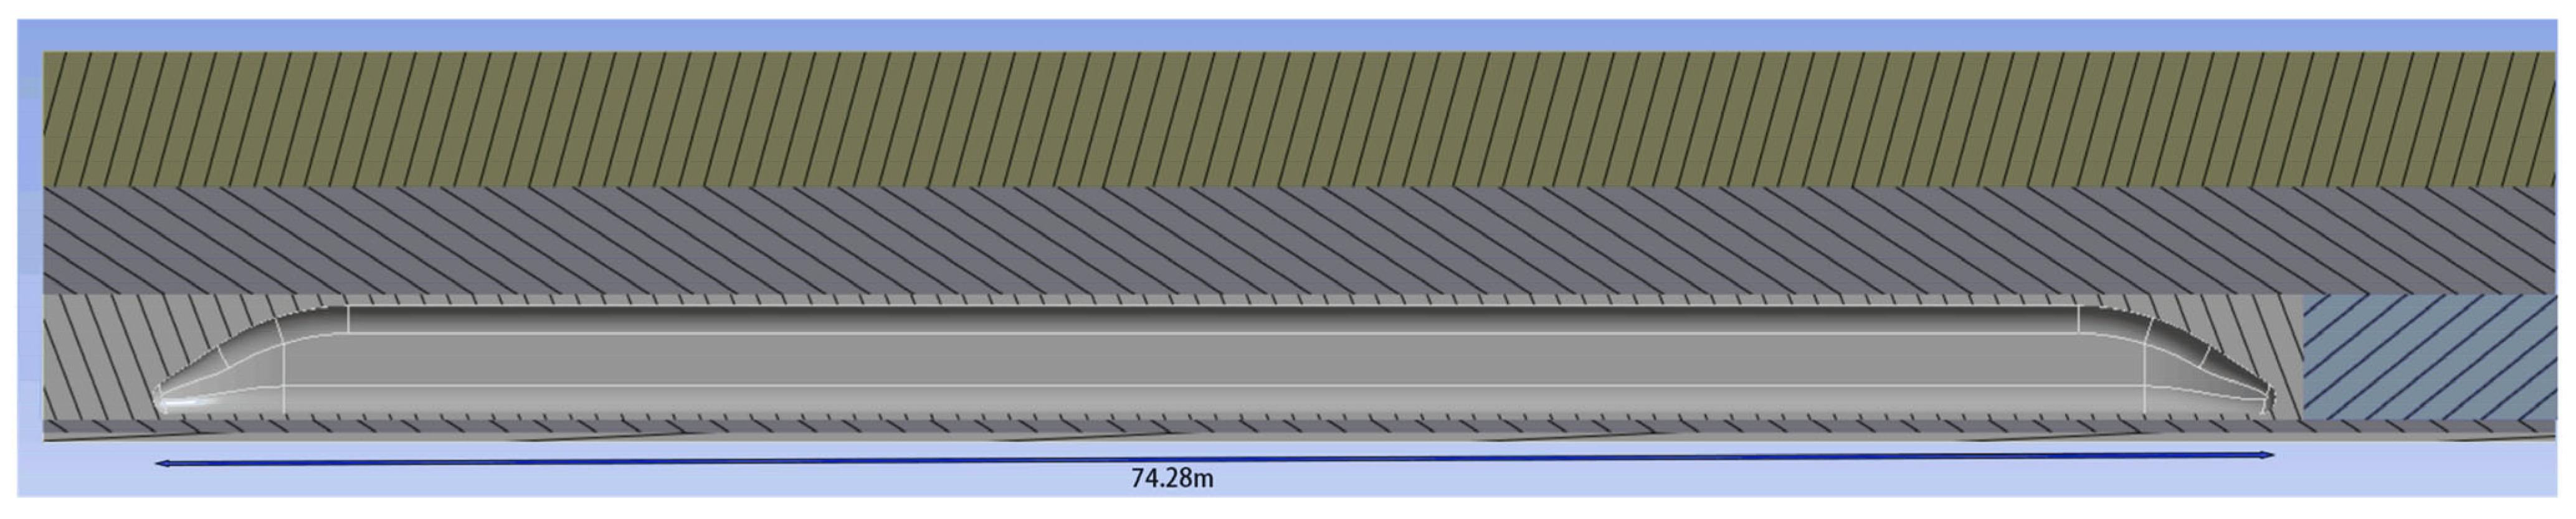
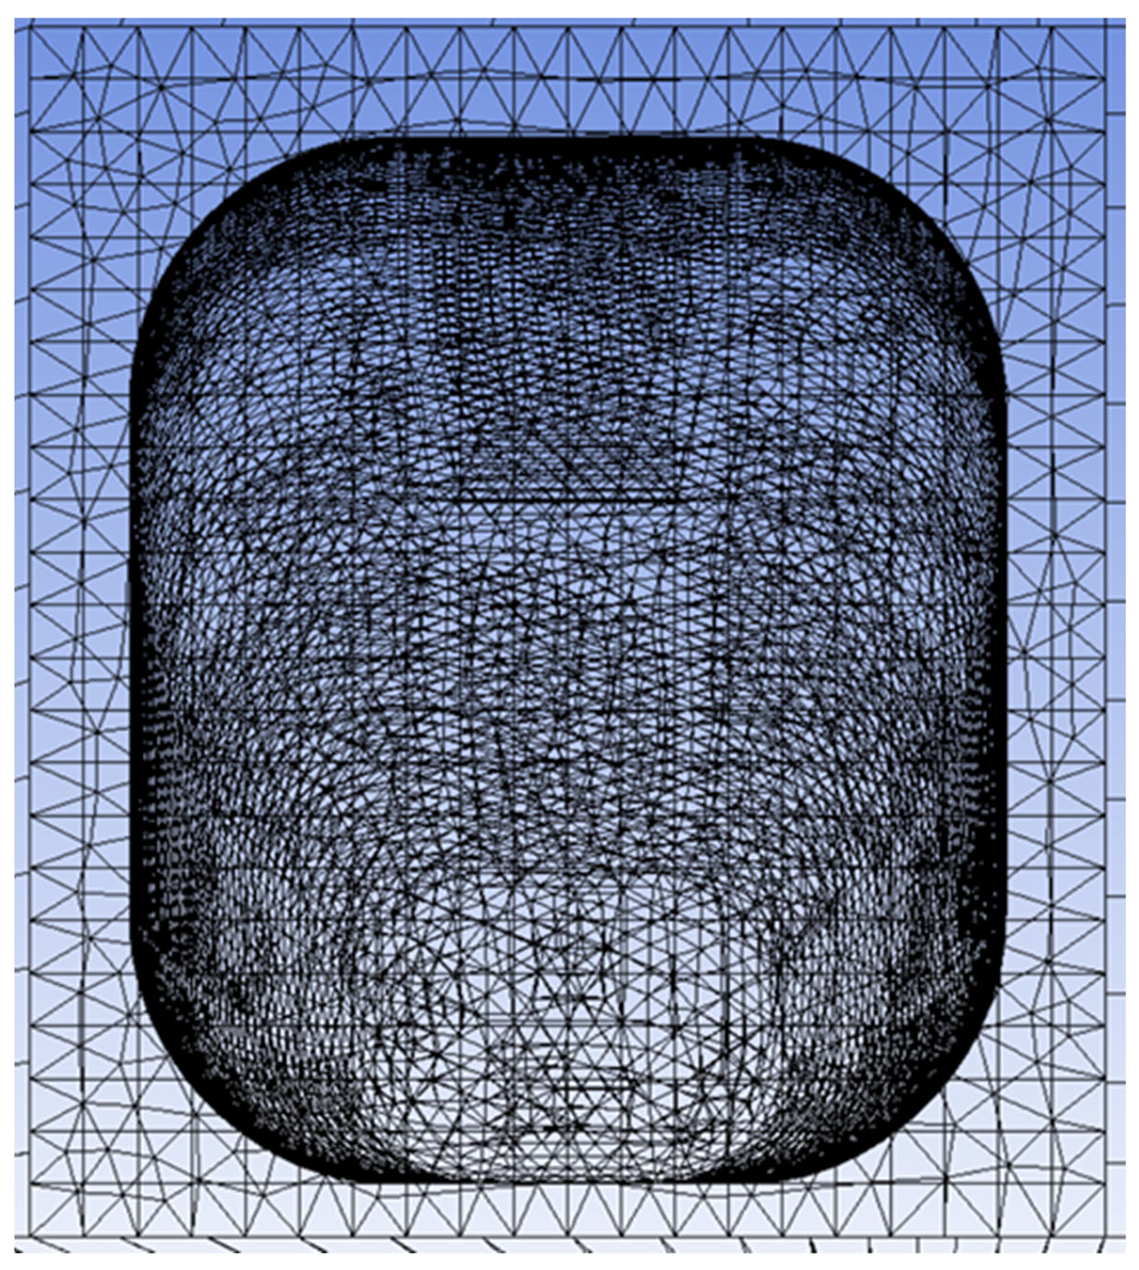
2.3. Geometry Model and Mesh

To enhance computational efficiency in the CFD numerical simulation, we simplified the high-speed train and sound barrier structures as follows. The high-speed train’s surface was treated as perfectly smooth, ignoring structural details like windows, doors, and bogies. We streamlined the inter-carriage connections while preserving the representative aerodynamic shape. The sound barrier’s surface was assumed to be flat, overlooking the impact of intricate sound-absorbing designs. Furthermore, we simplified the entire track layout by omitting elements such as rails and track slabs. The segment of the track adjacent to the sound barrier was considered a straight section, disregarding any track gradients. The train model was developed based on surface parameters from CRH380A, a Chinese high-speed train currently in service, with dimensions set at 3.38 m in width, 3.70 m in height, and a total length of 74.28 m, see Figure 3 and Figure 4. The sound barrier spans 150 m, and its dimensions, along with the distance from the barrier to the train, are illustrated in Figure 3.
This study utilizes the sliding mesh technique to model the interaction between a high-speed train and a sound barrier. To ensure a balance between computational efficiency and accuracy, the computational domain is segmented into a stationary zone and a sliding zone, with dimensions carefully specified. The stationary zone measures 150 m × 200 m × 600 m, while the sliding zone is defined as 4 m × 4.5 m × 400 m. For mesh generation, unstructured meshes that offer greater adaptability are implemented using Fluent Meshing. Due to the complex flow variations around the train at high speed, grid refinement is applied to the train surface, the sound barrier, and the surrounding fluid regions for improved detail accuracy. Specifically, the mesh sizes are set to 0.1 m for the train surface and 0.2 m for the sound barrier. A smooth transition is ensured between the grids of the train, the sound barrier, and the external flow field, maintaining grid quality and computational stability. The total grid count remains reasonable, meeting accuracy demands while boosting computational efficiency.

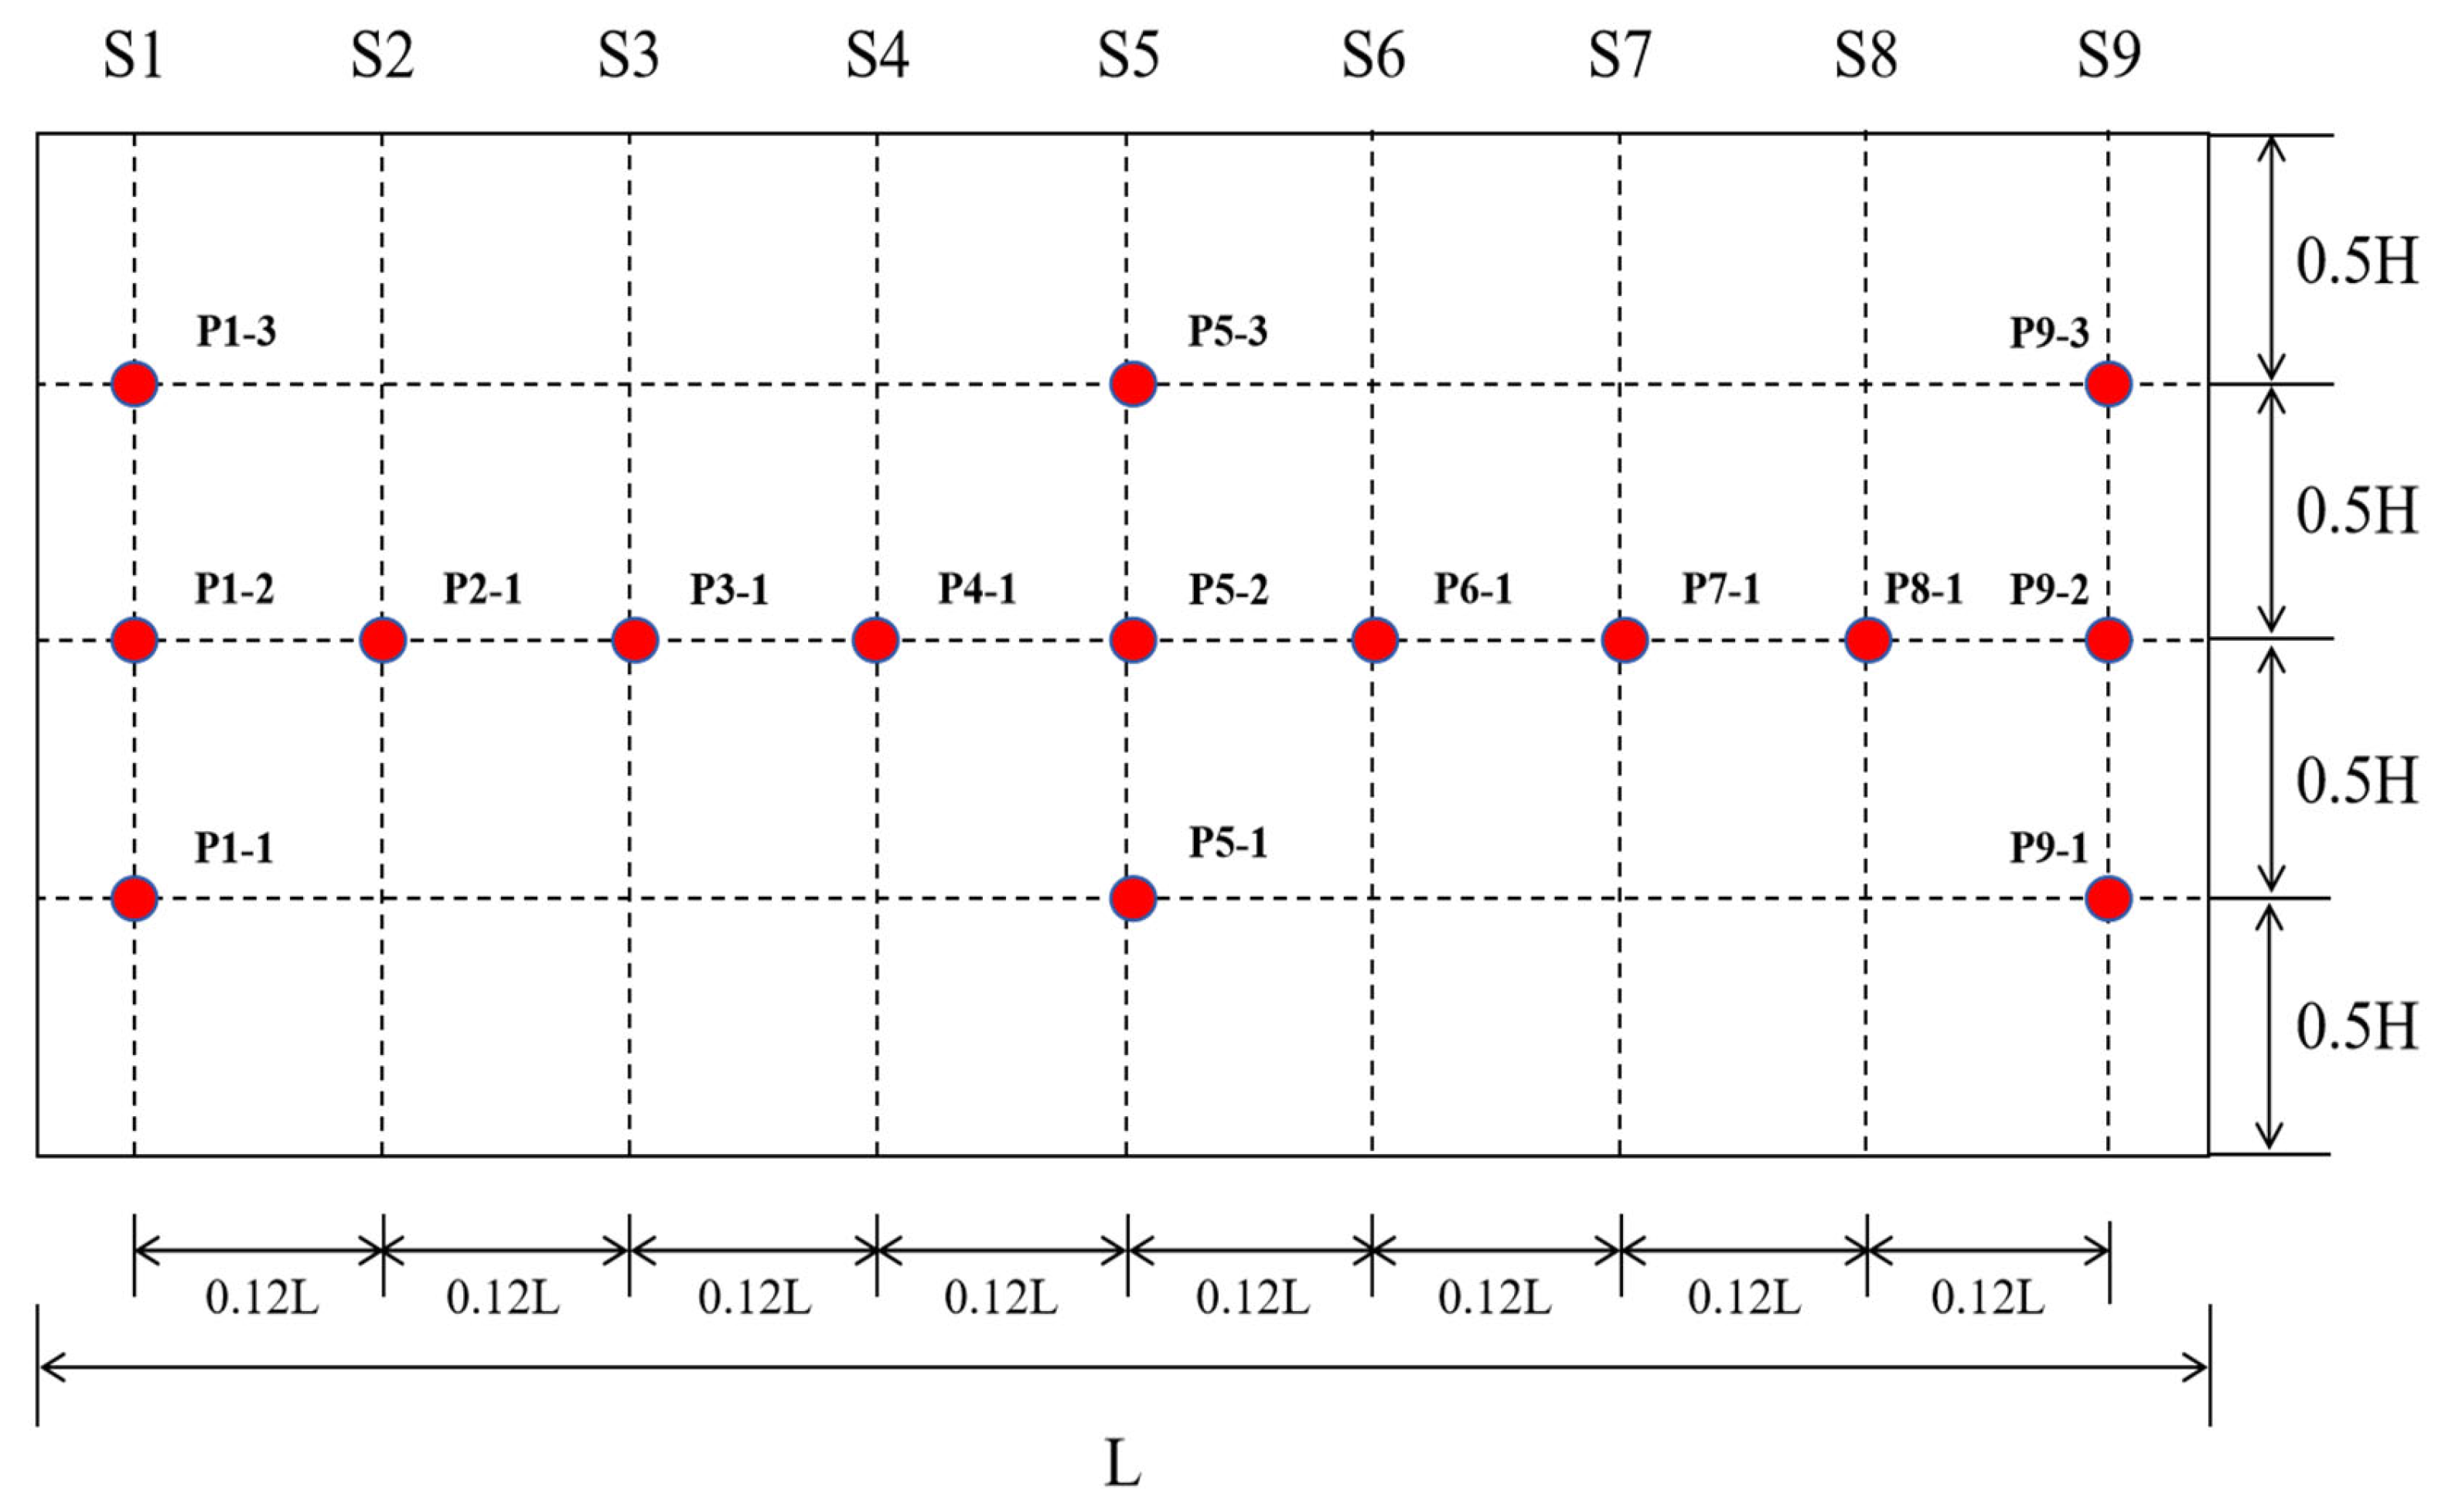
2.4. Arrangement of Measurement Points

The measurement points in Fluent were strategically arranged based on a sound barrier, which has an assumed total length (L) and a height of (2H). Along this barrier, nine cross-sections (S1 to S9) were defined. Measurement points were set at the mid-height of the barrier for each cross-section to assess the aerodynamic wind pressure along its length. Furthermore, three monitoring points were installed at various heights at the entrance (S1), mid-length (S5), and exit (S9) cross-sections, as illustrated in Figure 5. This setup facilitates a comprehensive analysis of aerodynamic wind pressure variations both vertically and across the barrier’s length.

3. Numerical Validations

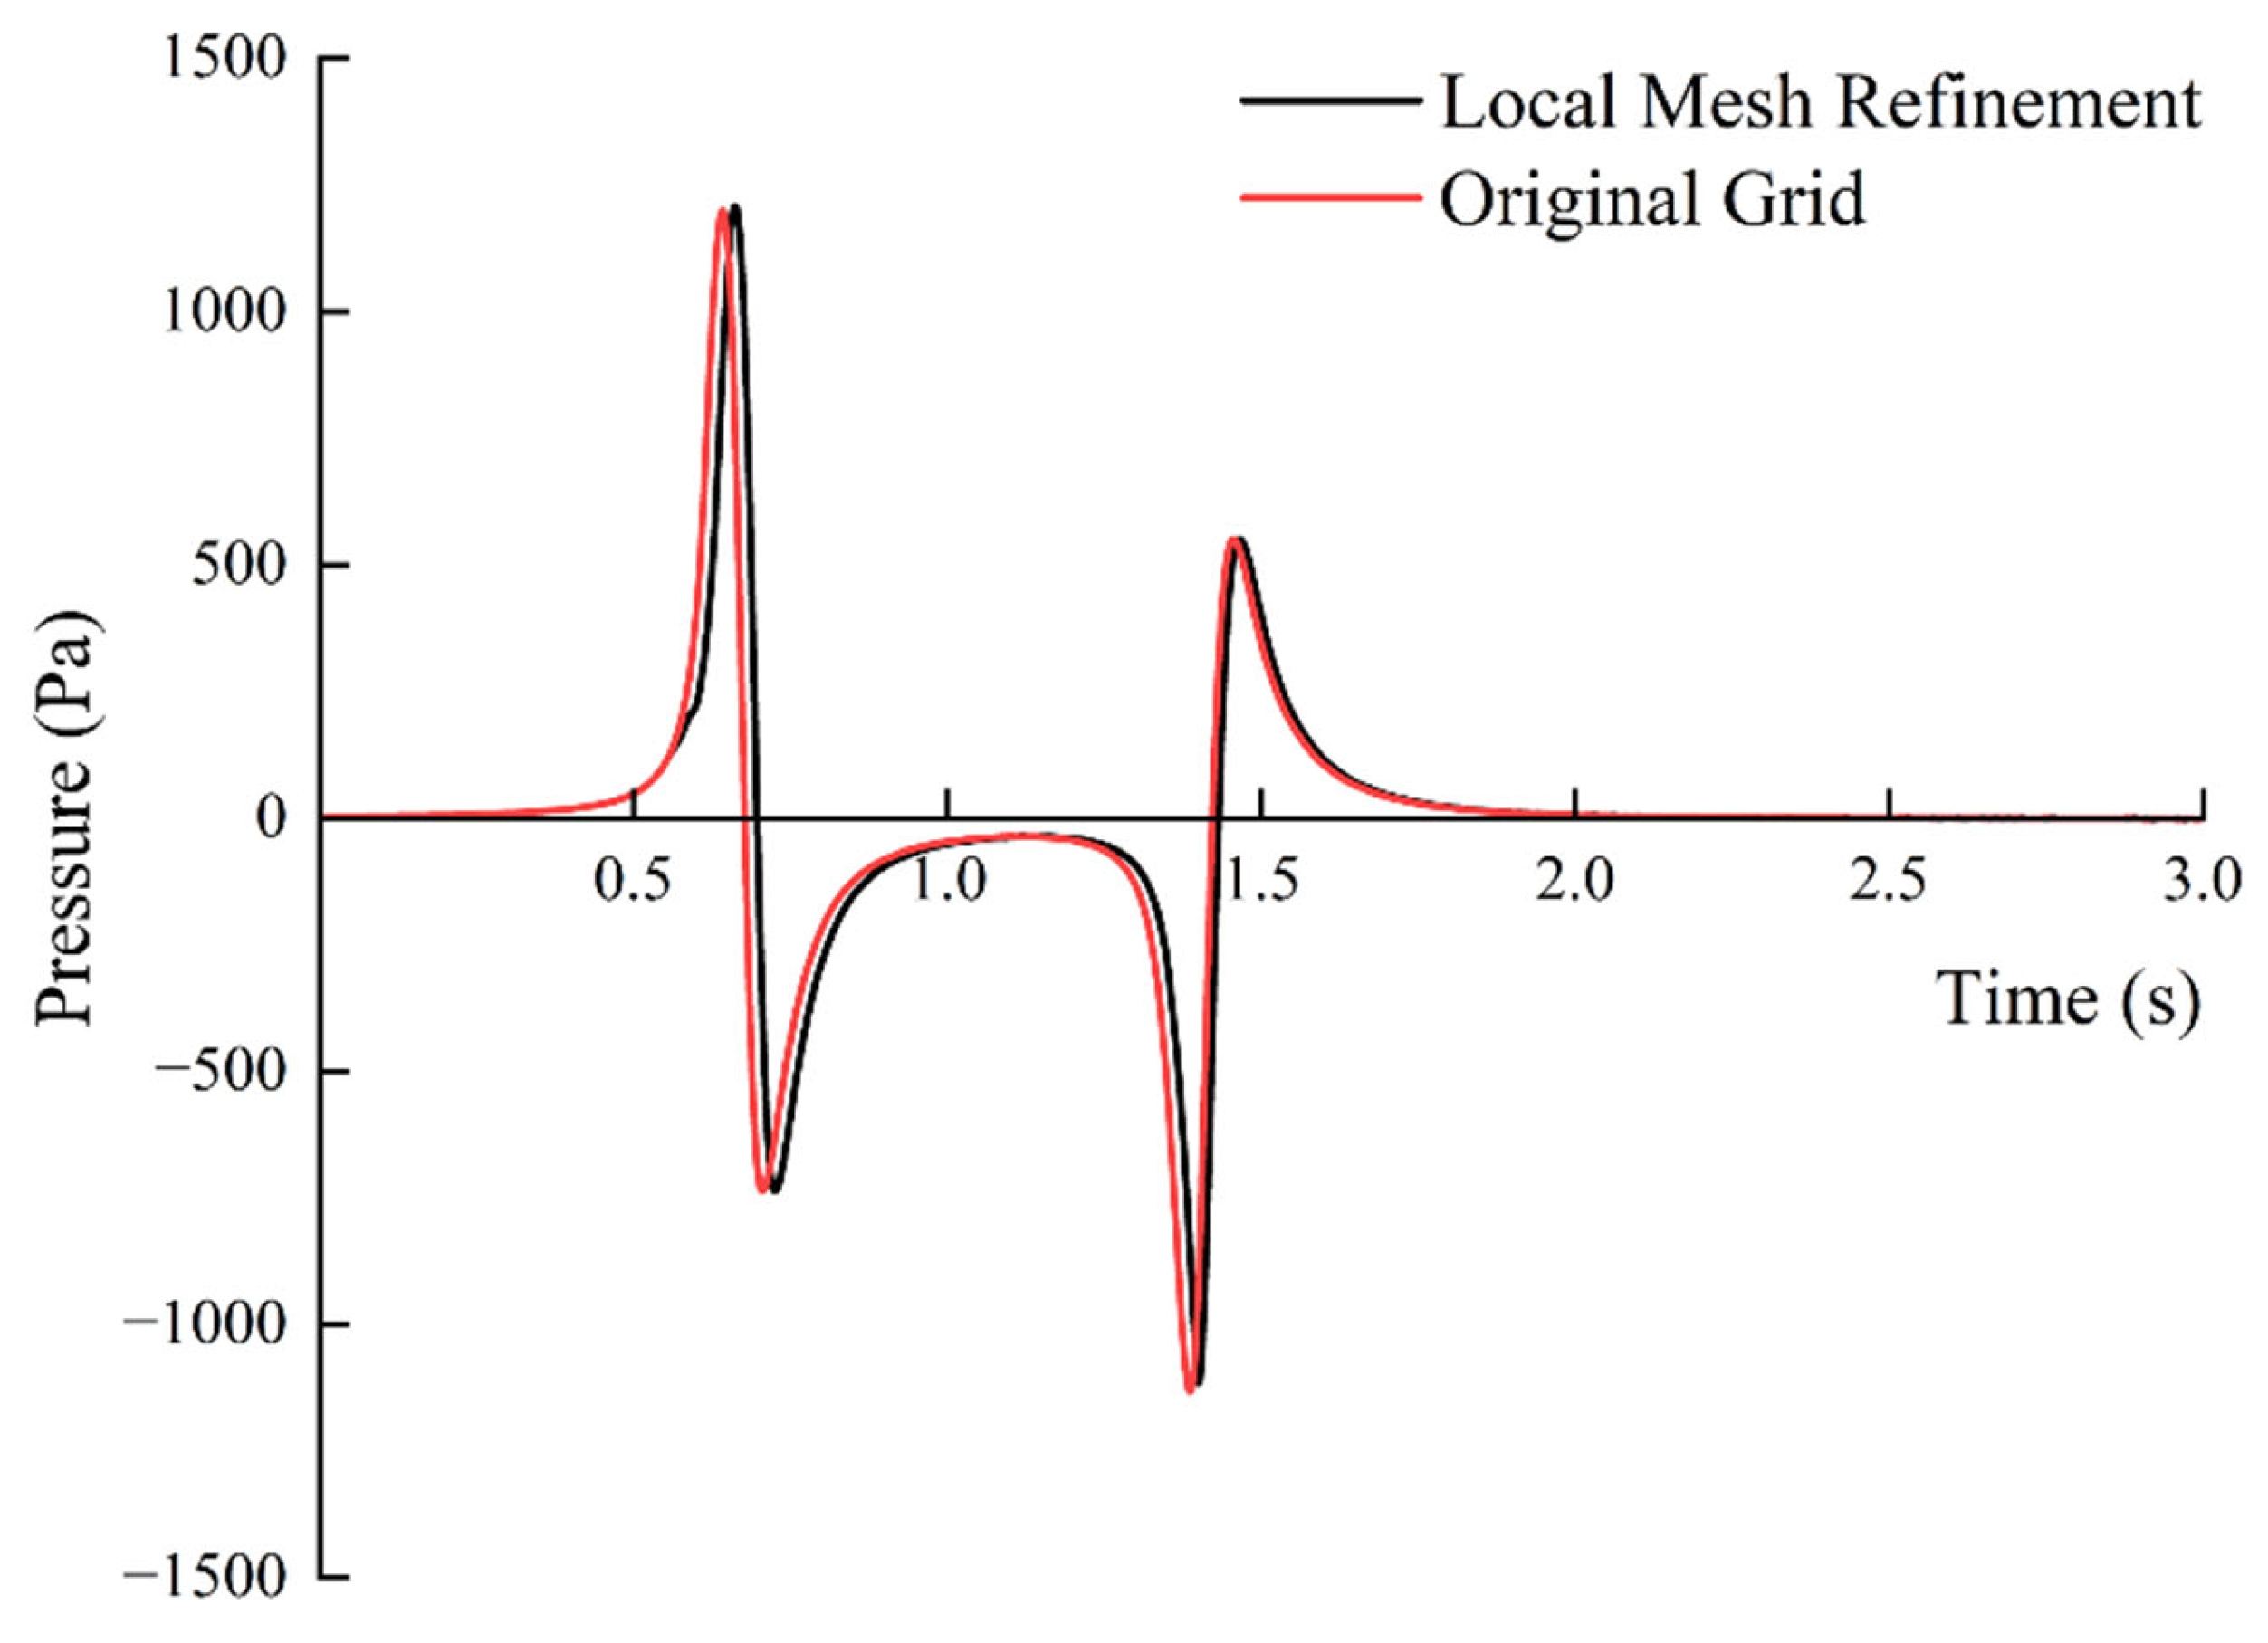
3.1. Grid Independence Verification

To reduce the impact of mesh on simulation accuracy, a mesh independence test was carried out by varying local mesh sizes. This study utilized a vertical sound barrier–train model, enhancing the mesh sizes for both the sliding region and the train surface. Specifically, the minimum mesh size in the sliding region was established at 0.2 m, while on the train surface, it was lowered to 0.05 m. As a result of these adjustments, the total number of mesh elements reached 14.73 million, reflecting a 30% increase over the original mesh. The results of the mesh refinement are shown in Figure 6.
An independence validation was conducted by comparing simulation results at monitoring point P1-1 for a single high-speed train traveling at 350 km/h. The difference in fluctuating wind pressure (ΔPH) between the locally refined mesh and the original mesh was 2.3%, indicating that the variation in mesh density had a negligible influence on the fluctuating wind pressure, see Figure 7. This observation aligns well with the conclusions drawn by Li and Chen, further confirming the reliability of the selected mesh configuration [26].

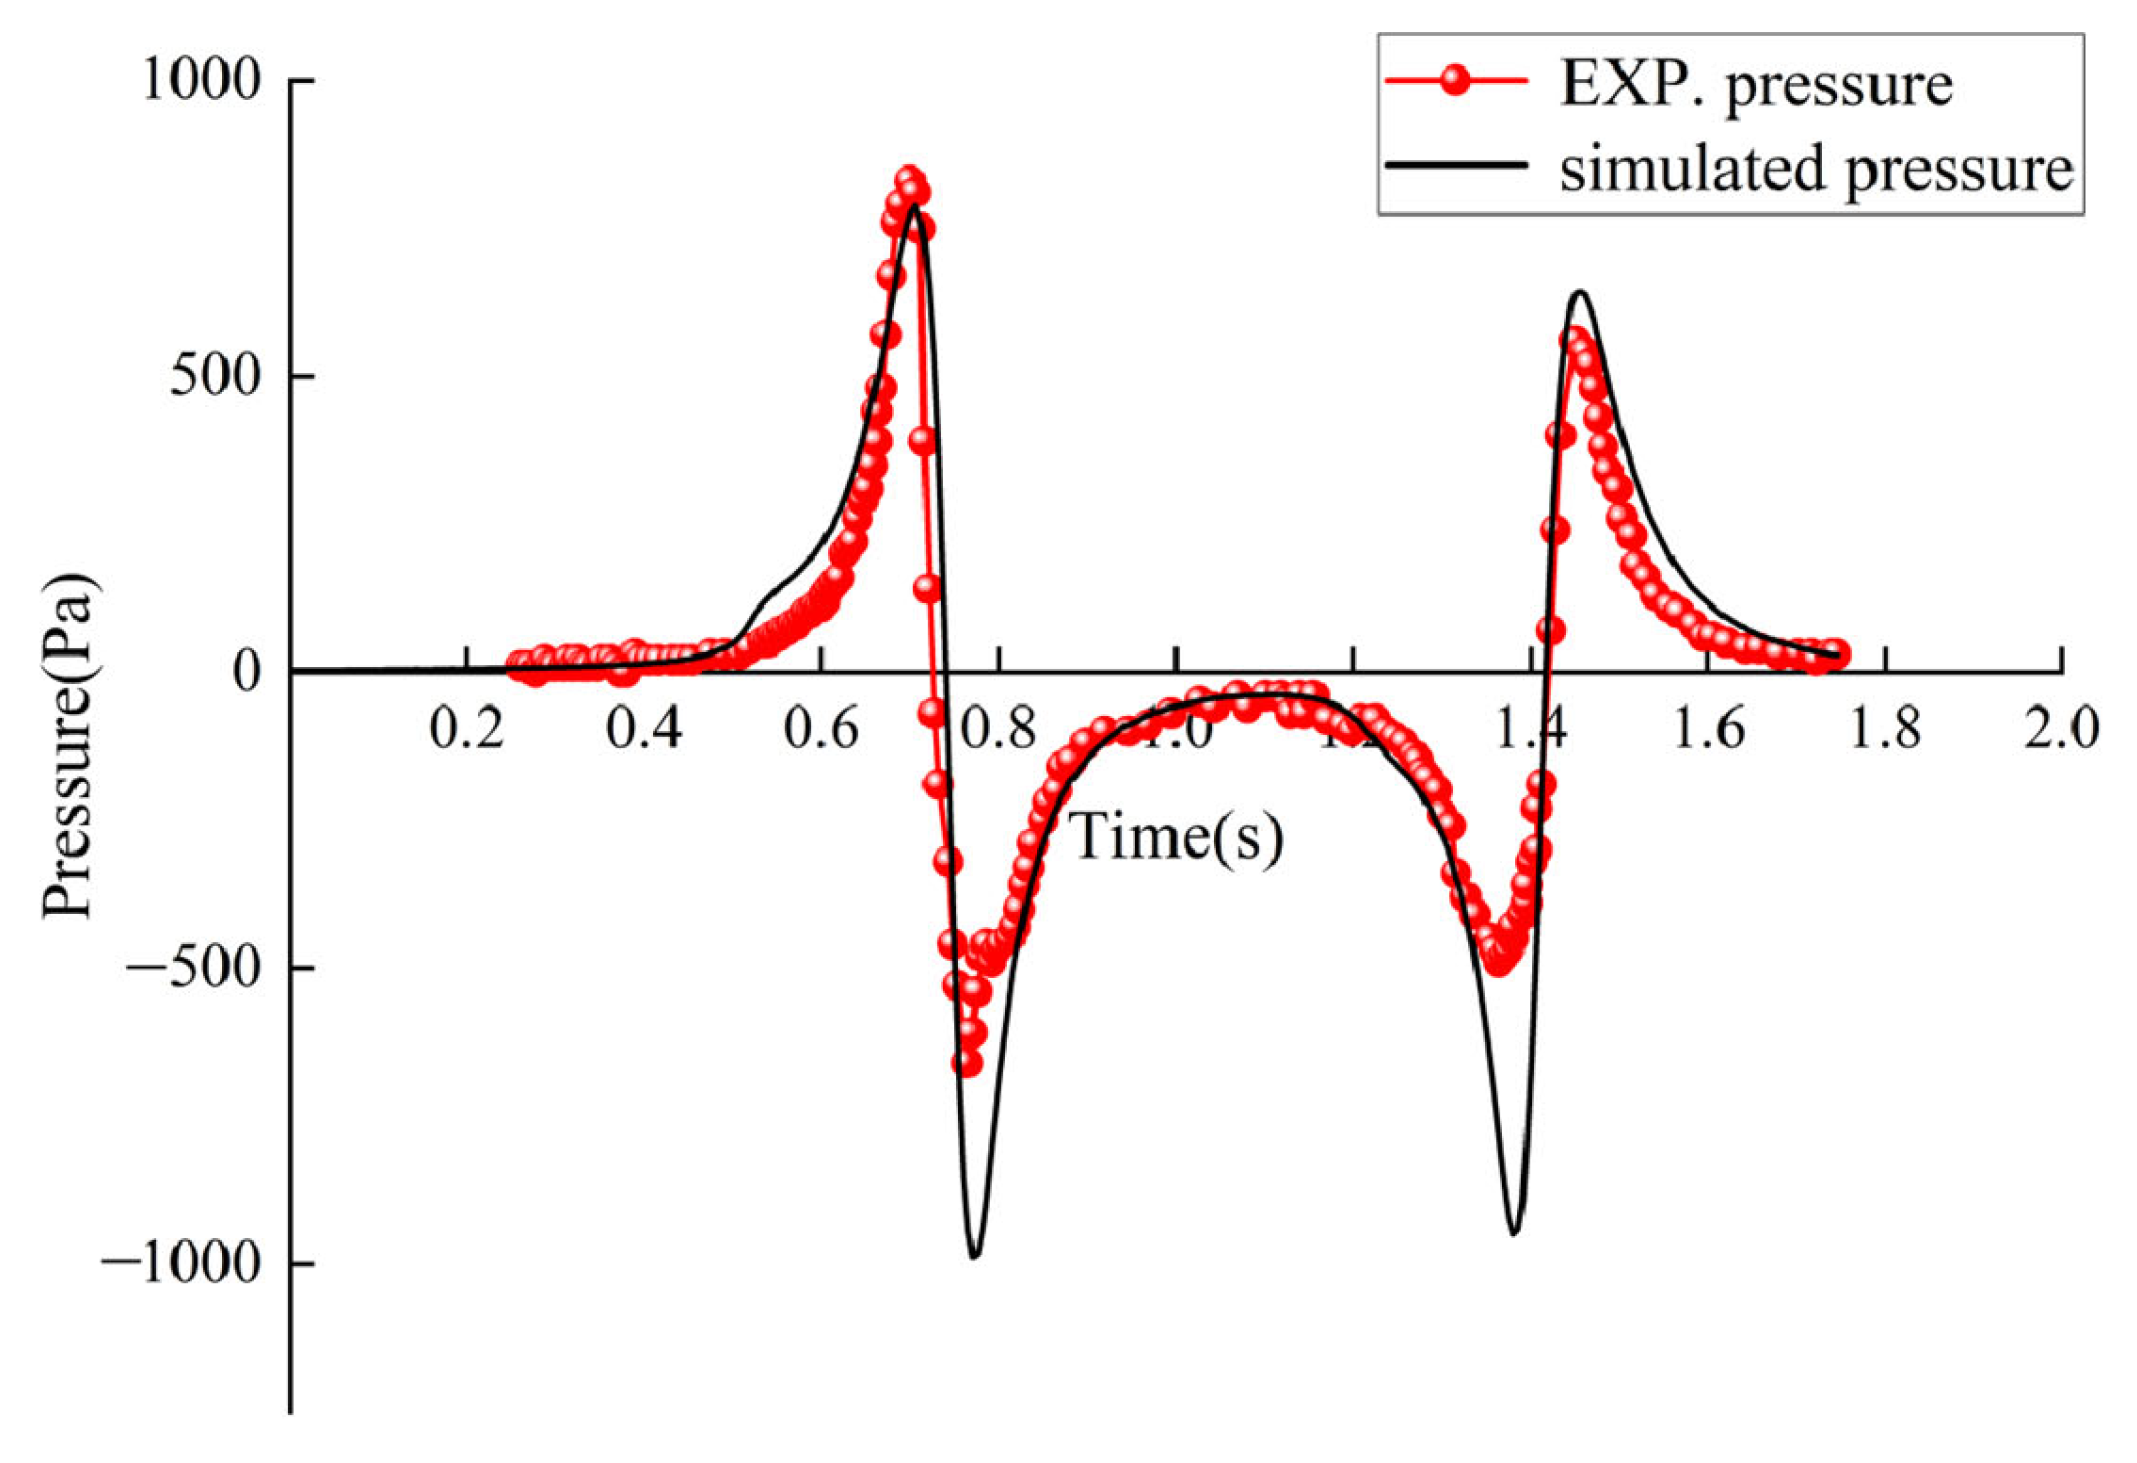
3.2. Comparison of Simulated and Measured Data

This study employs a CRH-series train model traveling at 380 km/h to verify the accuracy of the CFD numerical simulation. As illustrated in Figure 8, we compared the simulation results with actual measured data. The test train was a CRH380A series model, operating at the same speed of 380 km/h [27]. The test points for both experimental and simulated data are P2-1 in Figure 5. The results demonstrate a strong consistency between the numerical simulation and the measured data regarding waveform characteristics. At the peak of positive pressure, the simulated results differ from the measured results by 7.6%, indicating consistency. The simulated negative pressure peak value increased by 49% compared to the measured value, which may be attributed to the elastic sealing strips present at the junction of the sound barrier in the measured scenario. The calculation model established in Fluent simplified the connection between the sound barrier and the ground, as well as some of the assembly structures, in order to balance calculation accuracy and efficiency. This decision may lead the simulation model to overestimate the negative pressure generated by airflow impact.
Despite the simulation model simplifying some aspects of the sound barrier and being limited by mesh generation precision, a thorough analysis of both datasets reveals that the pressure waveforms display typical characteristics. Notably, the trends of both the head and tail waves are strikingly consistent. Thus, the numerical model exhibits high accuracy and reliability in computations, successfully capturing the interaction between the high-speed train and the sound barrier. It serves as a solid foundation for future analysis and research.

4. Numerical Results and Discussions

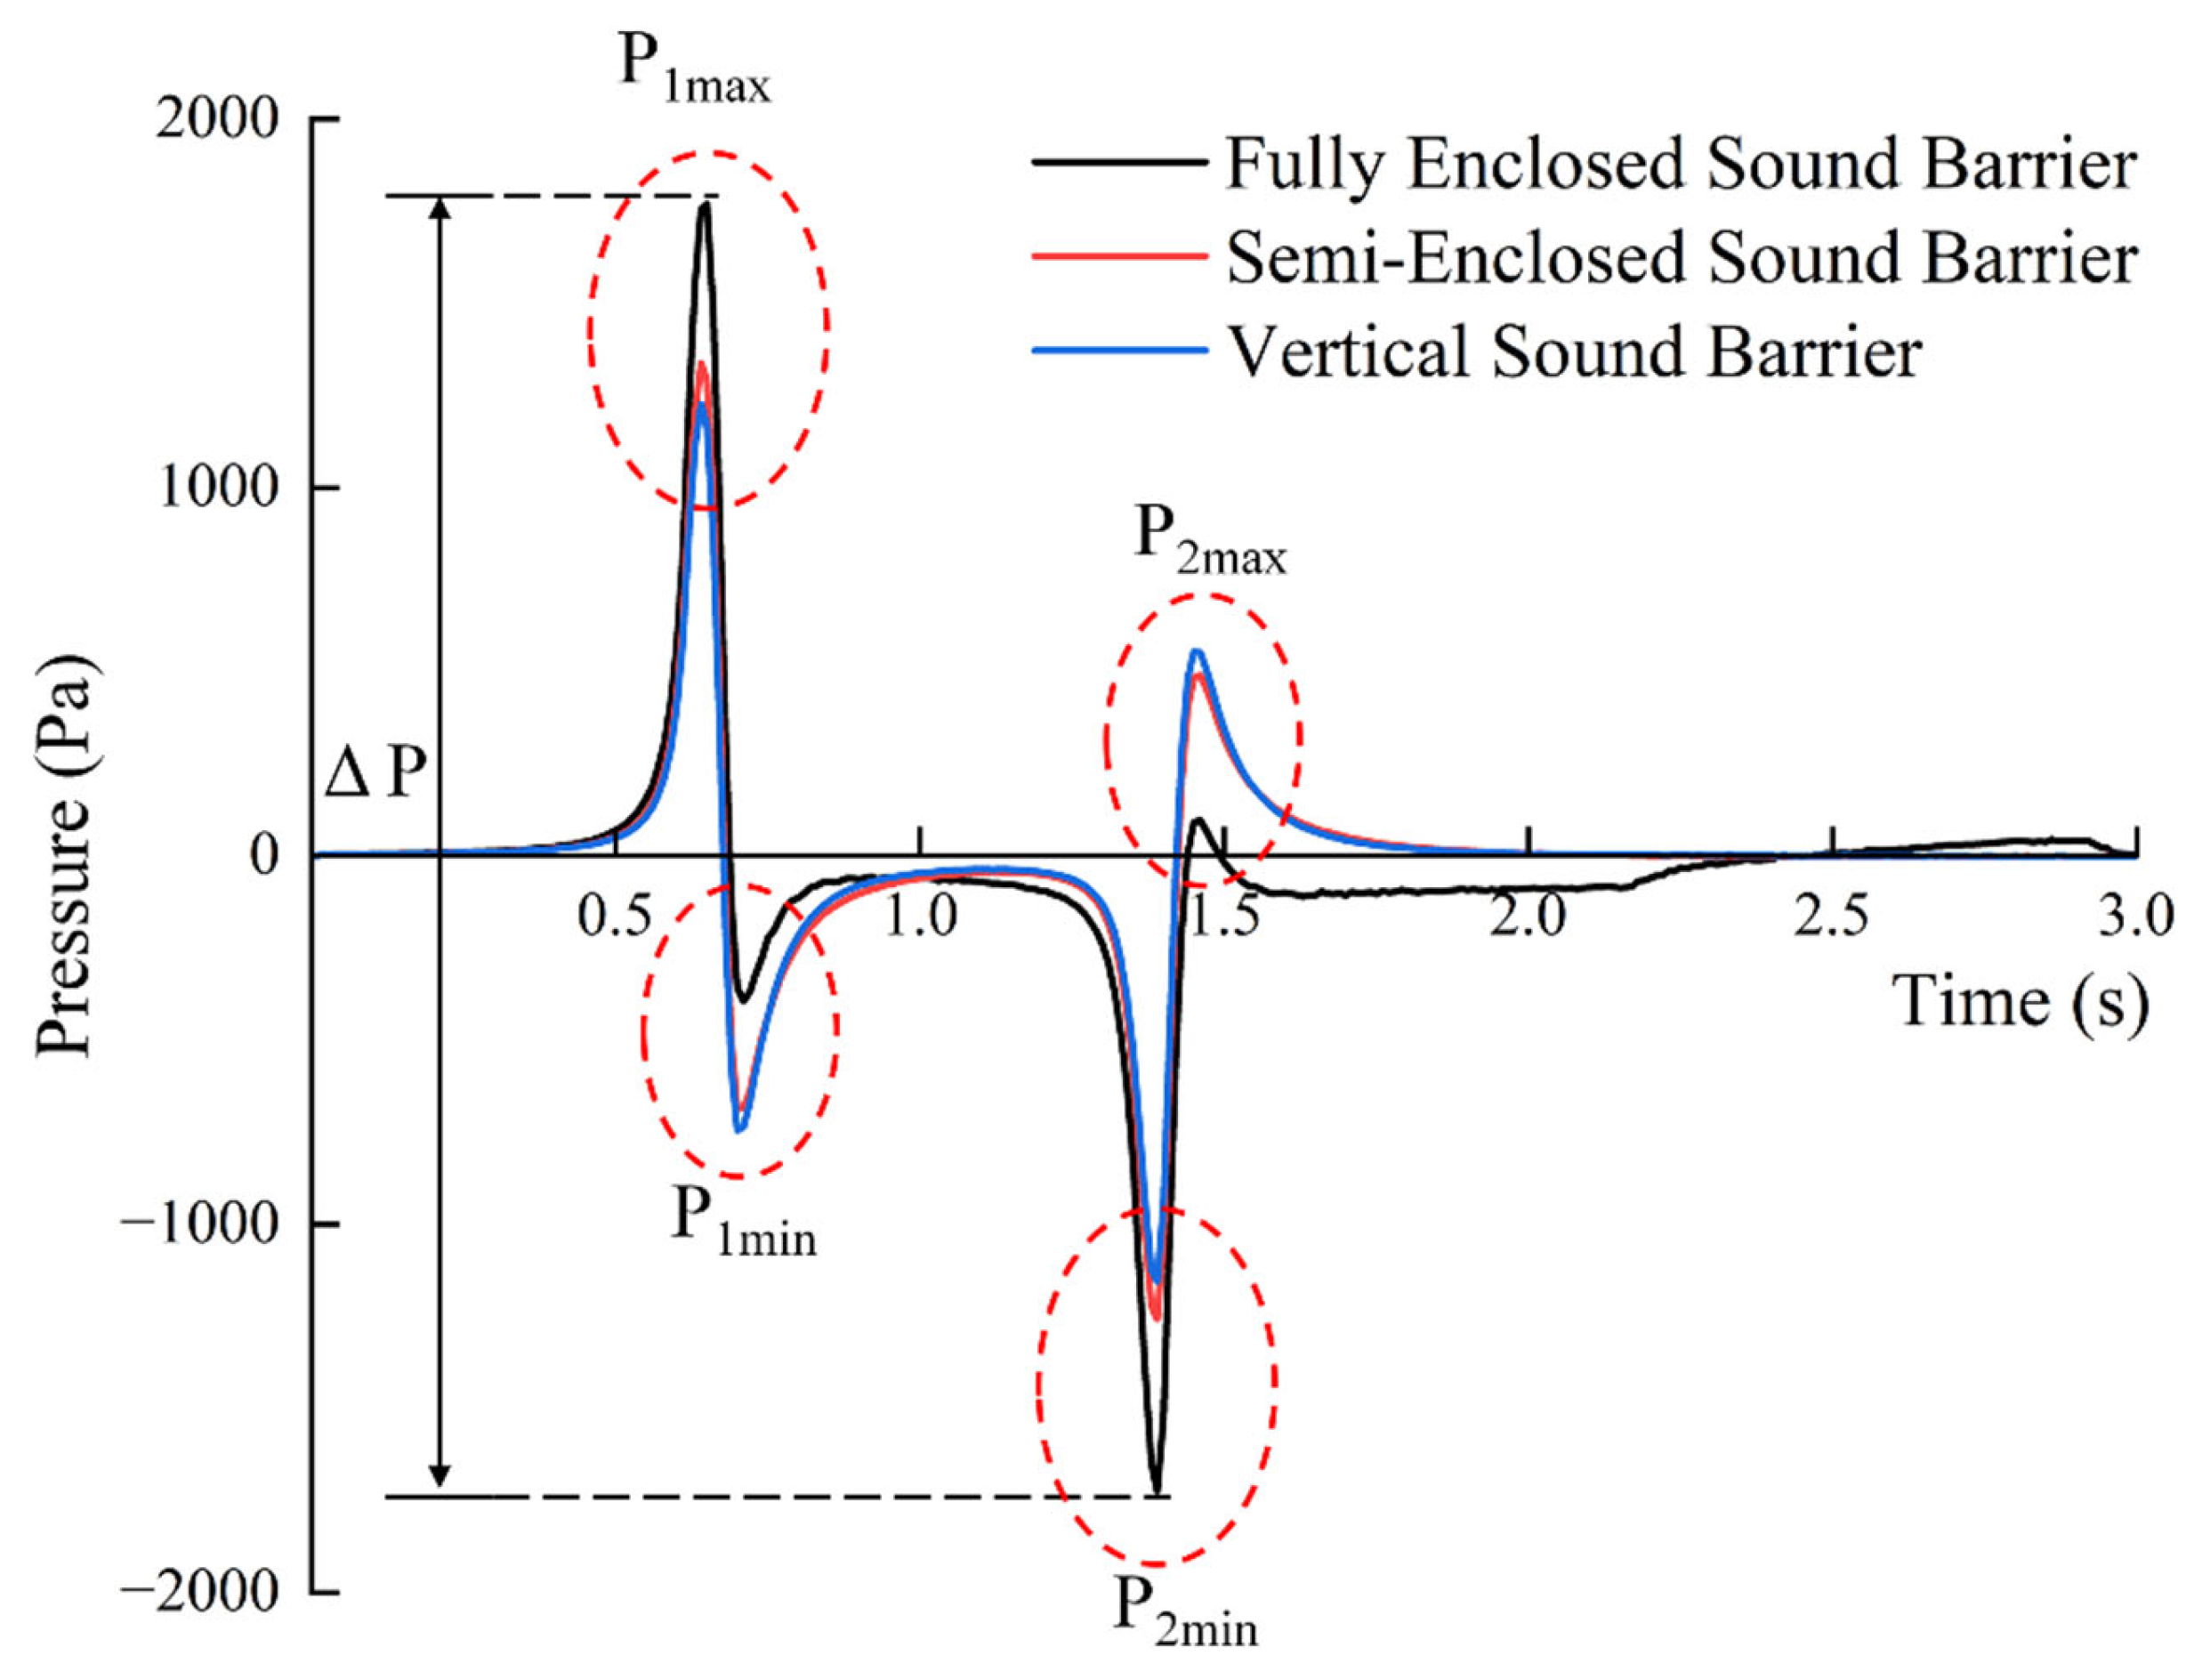
4.1. Fluctuating Wind Pressure on the Sound Barrier

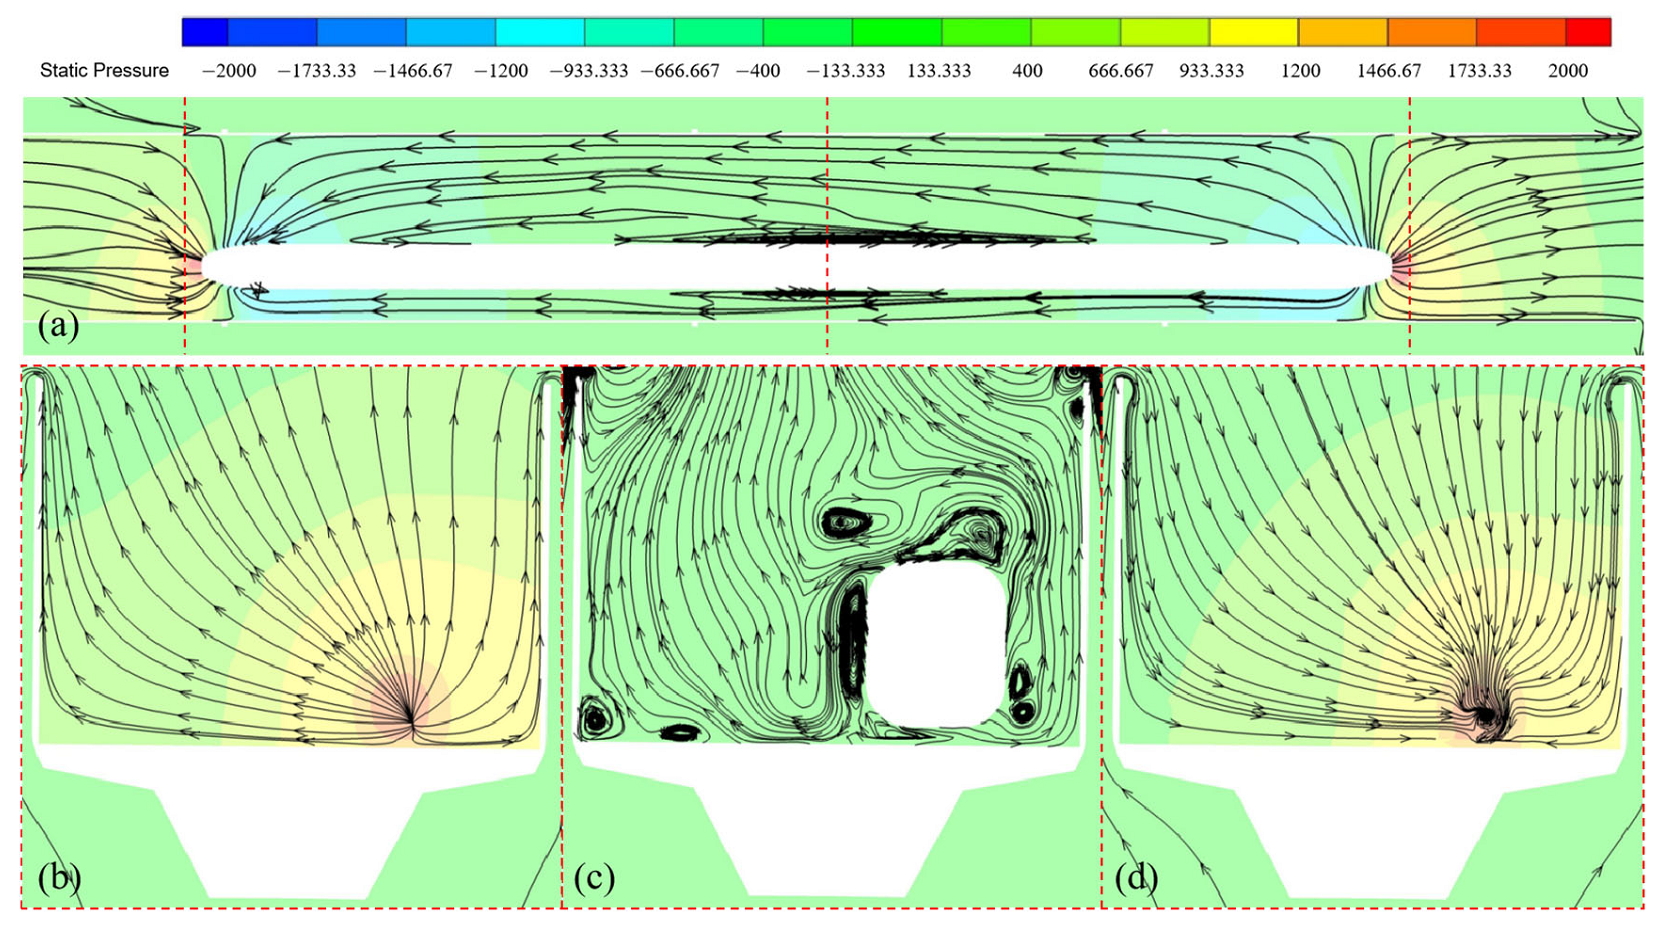
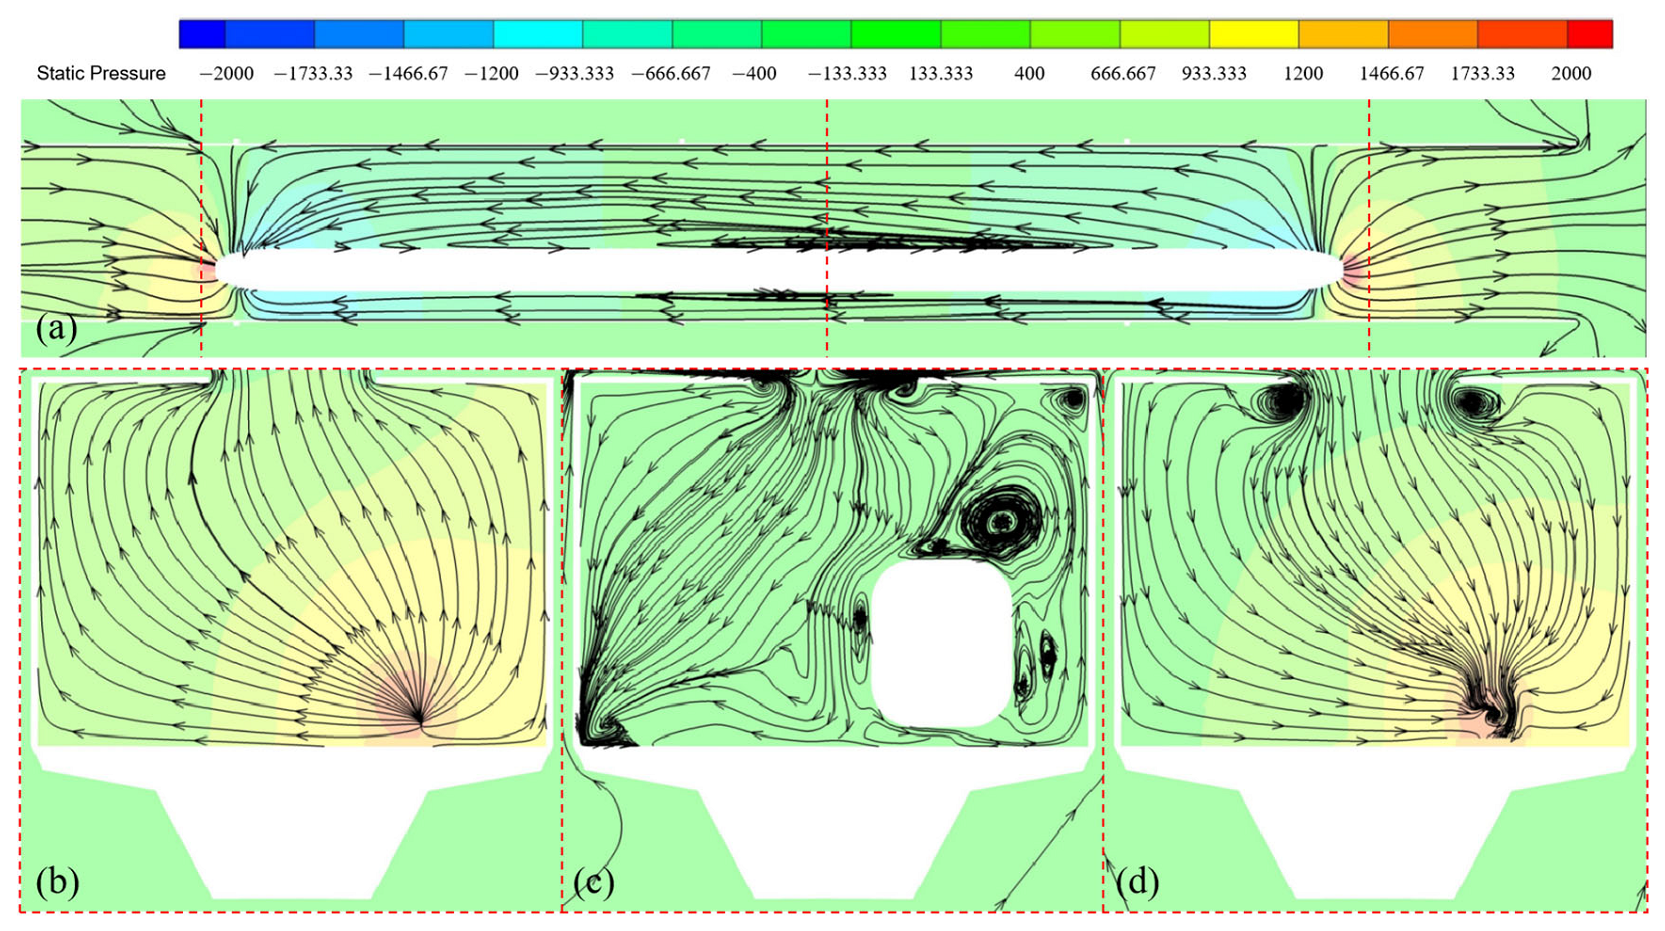
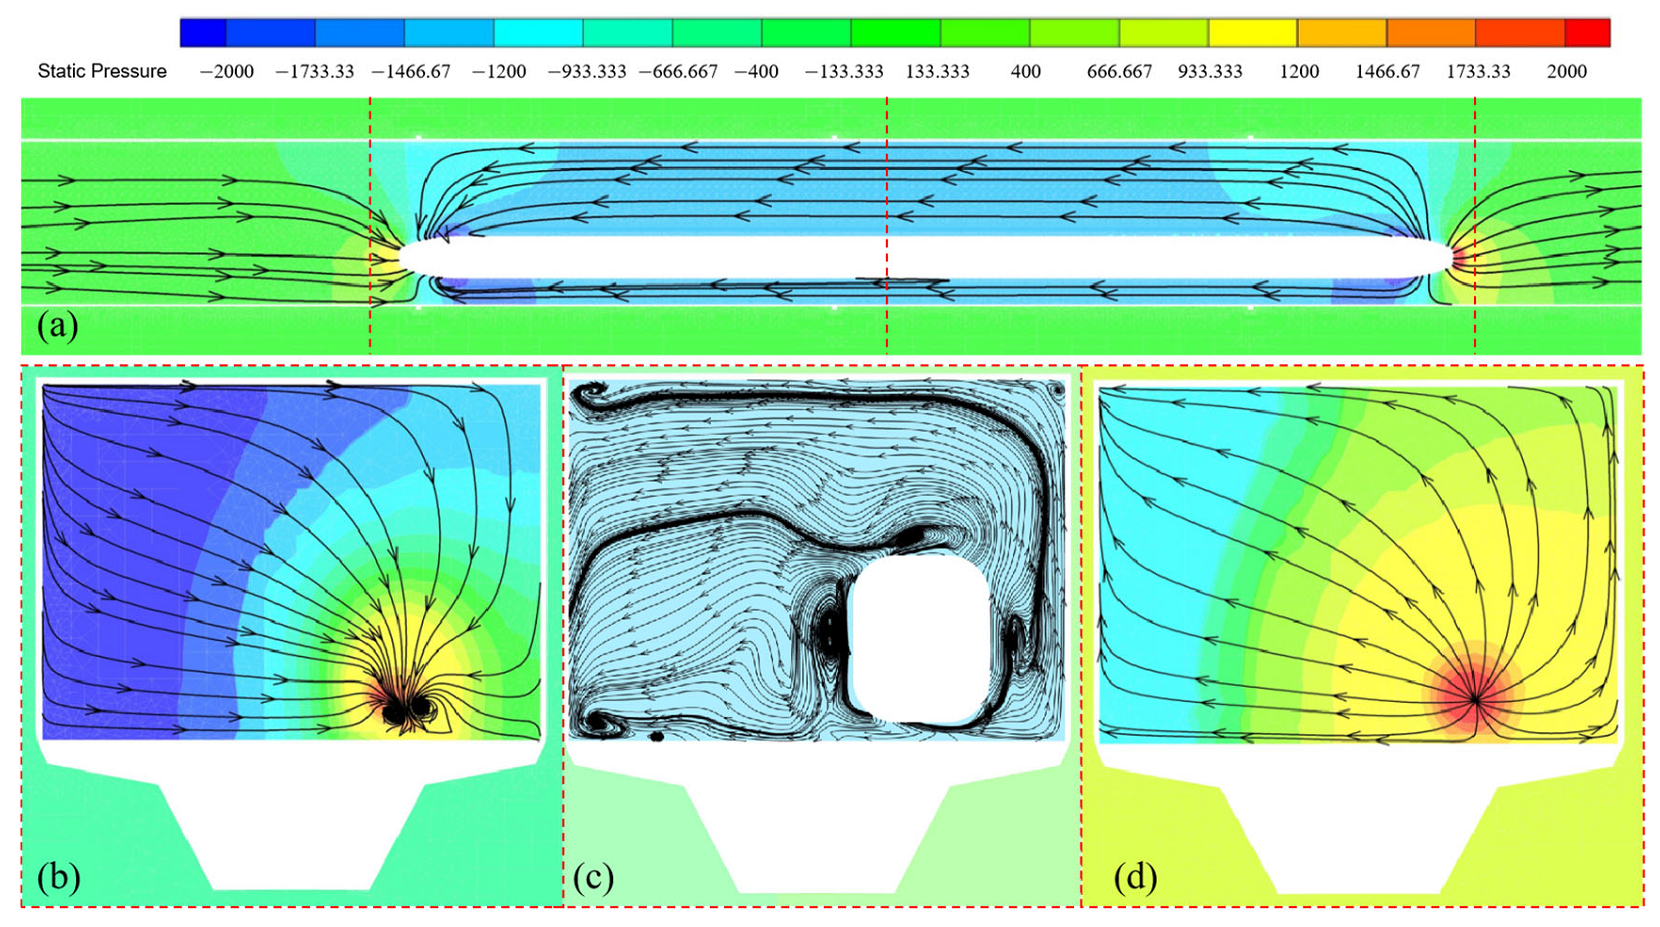
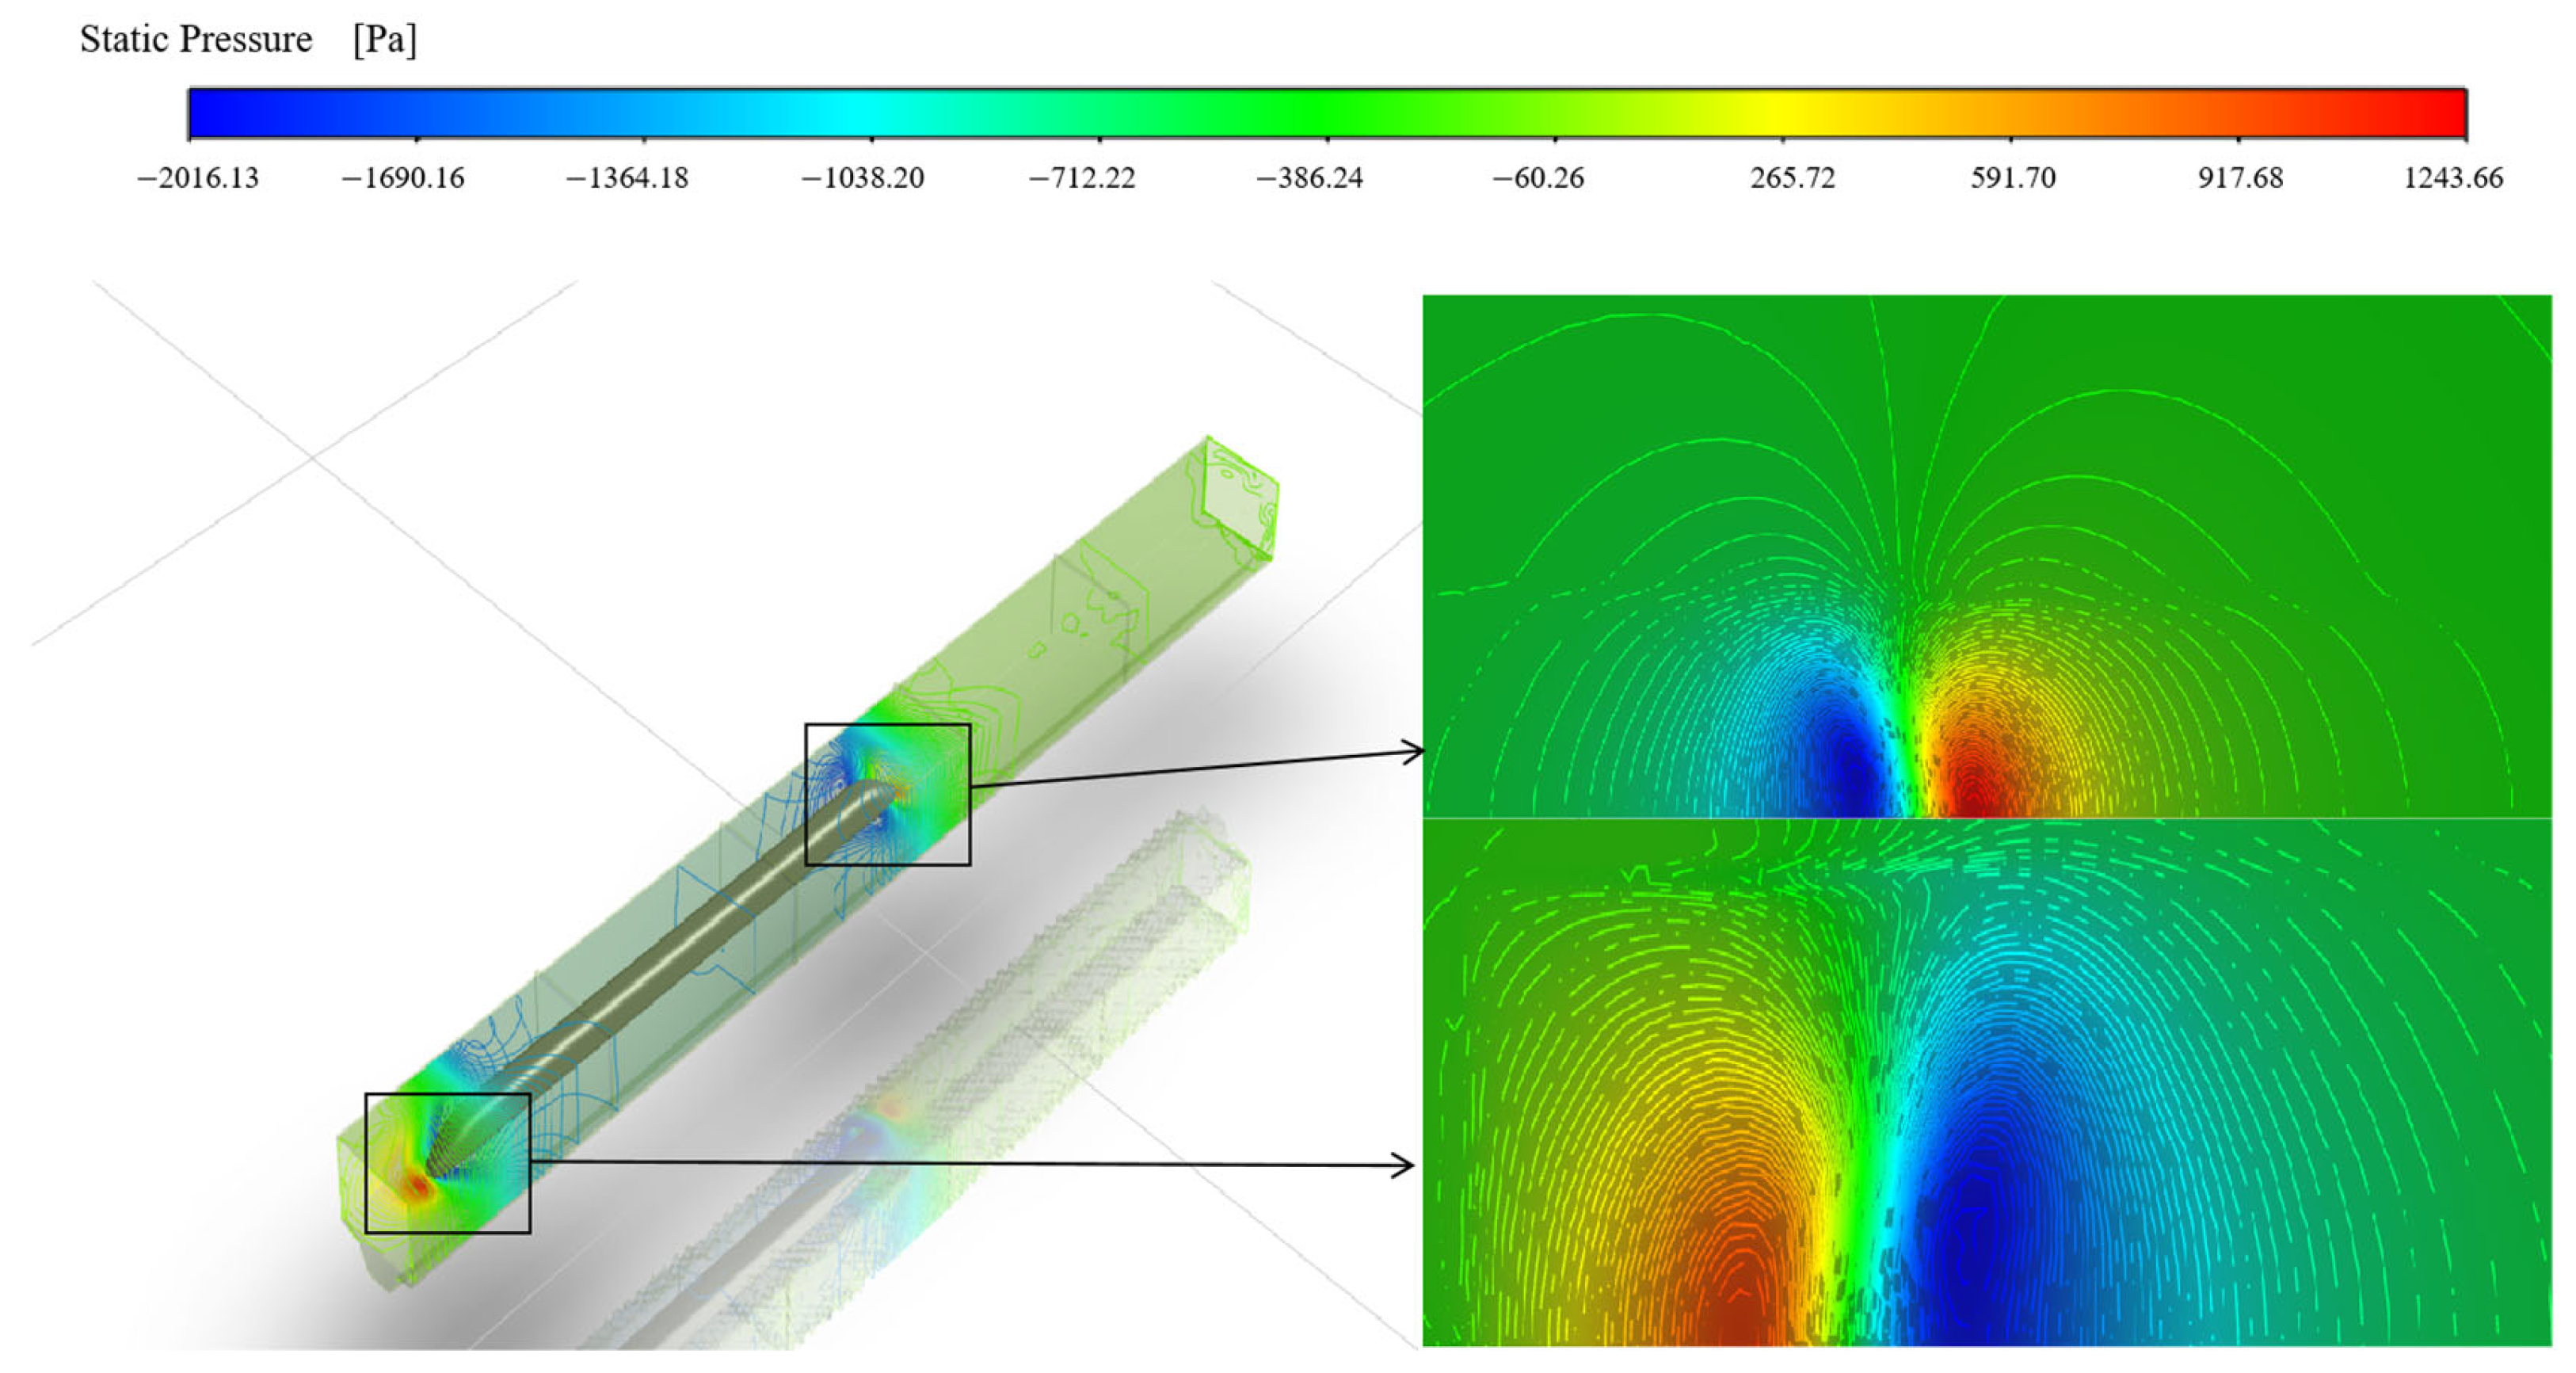
4.1.1. Global Distribution of the Pressure Induced by a Single Train

When a high-speed train moves through a sound barrier, the pressure waves from the train’s front and back create a complex pressure field on the surface of the barrier. Various structural designs of sound barriers, including vertical, semi-enclosed, and fully enclosed types, show considerable differences in pressure peaks, distribution patterns, and their effects on the barrier’s integrity. For vertical sound barriers, the open design means that pressure waves mainly focus on one side, causing relatively minor fluctuations overall. In semi-enclosed barriers, a top cover is added, which partially limits airflow dissipation and results in a marked increase in pressure peaks. Conversely, fully enclosed sound barriers restrict pressure wave diffusion entirely due to their sealed design, leading to the highest pressure peaks and the most intricate flow field characteristics.
In terms of pressure field characteristics, the vertical sound barrier shows relatively minor pressure fluctuations. As the train’s head moves through, the compression wave causes the pressure to rise quickly to its positive peak, followed by a swift drop to a negative peak due to the expansion wave near the train’s tail. However, the open structure allows air to flow freely, so the propagation of the pressure wave is less restricted, resulting in relatively uniform pressure extremes with shorter durations.
Figure 9 illustrates that the pressure characteristics of the vertical sound barrier exhibit milder pressure fluctuations and rapid dissipation of pressure waves. In contrast, with its partially closed top, the semi-enclosed sound barrier restricts airflow and increases the localized intensity of pressure waves. As a result, the peaks of both compression and expansion wave pressures exceed those seen in the vertical barrier, especially at the entrance where the pressure extremes reveal greater differences. However, even with the semi-enclosed structure’s notable amplification of pressure waves, the overall duration of pressure fluctuations remains brief. Its fluctuation characteristics are intermediate between those of the vertical and fully enclosed sound barriers, striking a balance between openness and airflow restriction.
Figure 10 shows that the semi-enclosed sound barrier’s pressure field demonstrates increased pressure peaks at the train’s head and gradual wave attenuation. The fully enclosed sound barrier’s sealed structure limits pressure wave propagation, creating distinct pressure characteristics. As Figure 9 illustrates, a train traveling at 350 km/h within a fully enclosed barrier compresses air around its nose, generating a wave that diffuses air and forms airflow distribution centered on the train’s nose. Some airflow moves forward, while another flows backward, nearly parallel to the train’s body. As the train moves, the pressure inside drops sharply, drawing air toward its tail and generating an expansion wave. Airflow streamlines align with the train’s movement.
Figure 11 illustrates this dynamic, showing the limited spread of the compression wave and the severe restriction of the expansion wave in the fully enclosed structure. Fully enclosed sound barriers notably enhance the pressure peaks of both compression and expansion waves, resulting in a more intricate pressure distribution within the barrier. When compared to vertical and semi-enclosed sound barriers, the fully enclosed design demonstrates the highest effectiveness in managing pressure wave propagation.
In terms of flow field characteristics, the three types of noise barriers show significant differences, mainly in airflow paths, vortex scales, and the complexity of flow structures. The open structure of the vertical noise barrier permits relatively free airflow, creating a simple flow field. Airflow mainly concentrates on the train’s running side, stabilizing quickly after bypassing the structure. Only small-scale vortices develop at the rear, characterized by limited intensity and range.
In contrast, the semi-enclosed noise barrier features a partially confined structure at the top, which imposes certain constraints on airflow, thus increasing the complexity of the flow field. Noticeable vortex structures arise in both the top and side regions, with intensified vortices present in the upper area. Additionally, the vortex range at the rear expands, resulting in a higher degree of overall disturbance in the flow field. Due to its entirely sealed structure, the fully enclosed noise barrier significantly compresses airflow paths, leading to highly concentrated airflow in the train’s direction. Large-scale vortices develop around both sides and the top of the train, with a broader vortex range compared to other structures. This vortex behavior is particularly prominent in the fully enclosed configuration, having the strongest impact on the aerodynamic environment within the barrier. Therefore, the fully enclosed noise barrier generates the most intense flow field disturbances, underscoring the necessity for careful design considerations regarding aerodynamic effects.

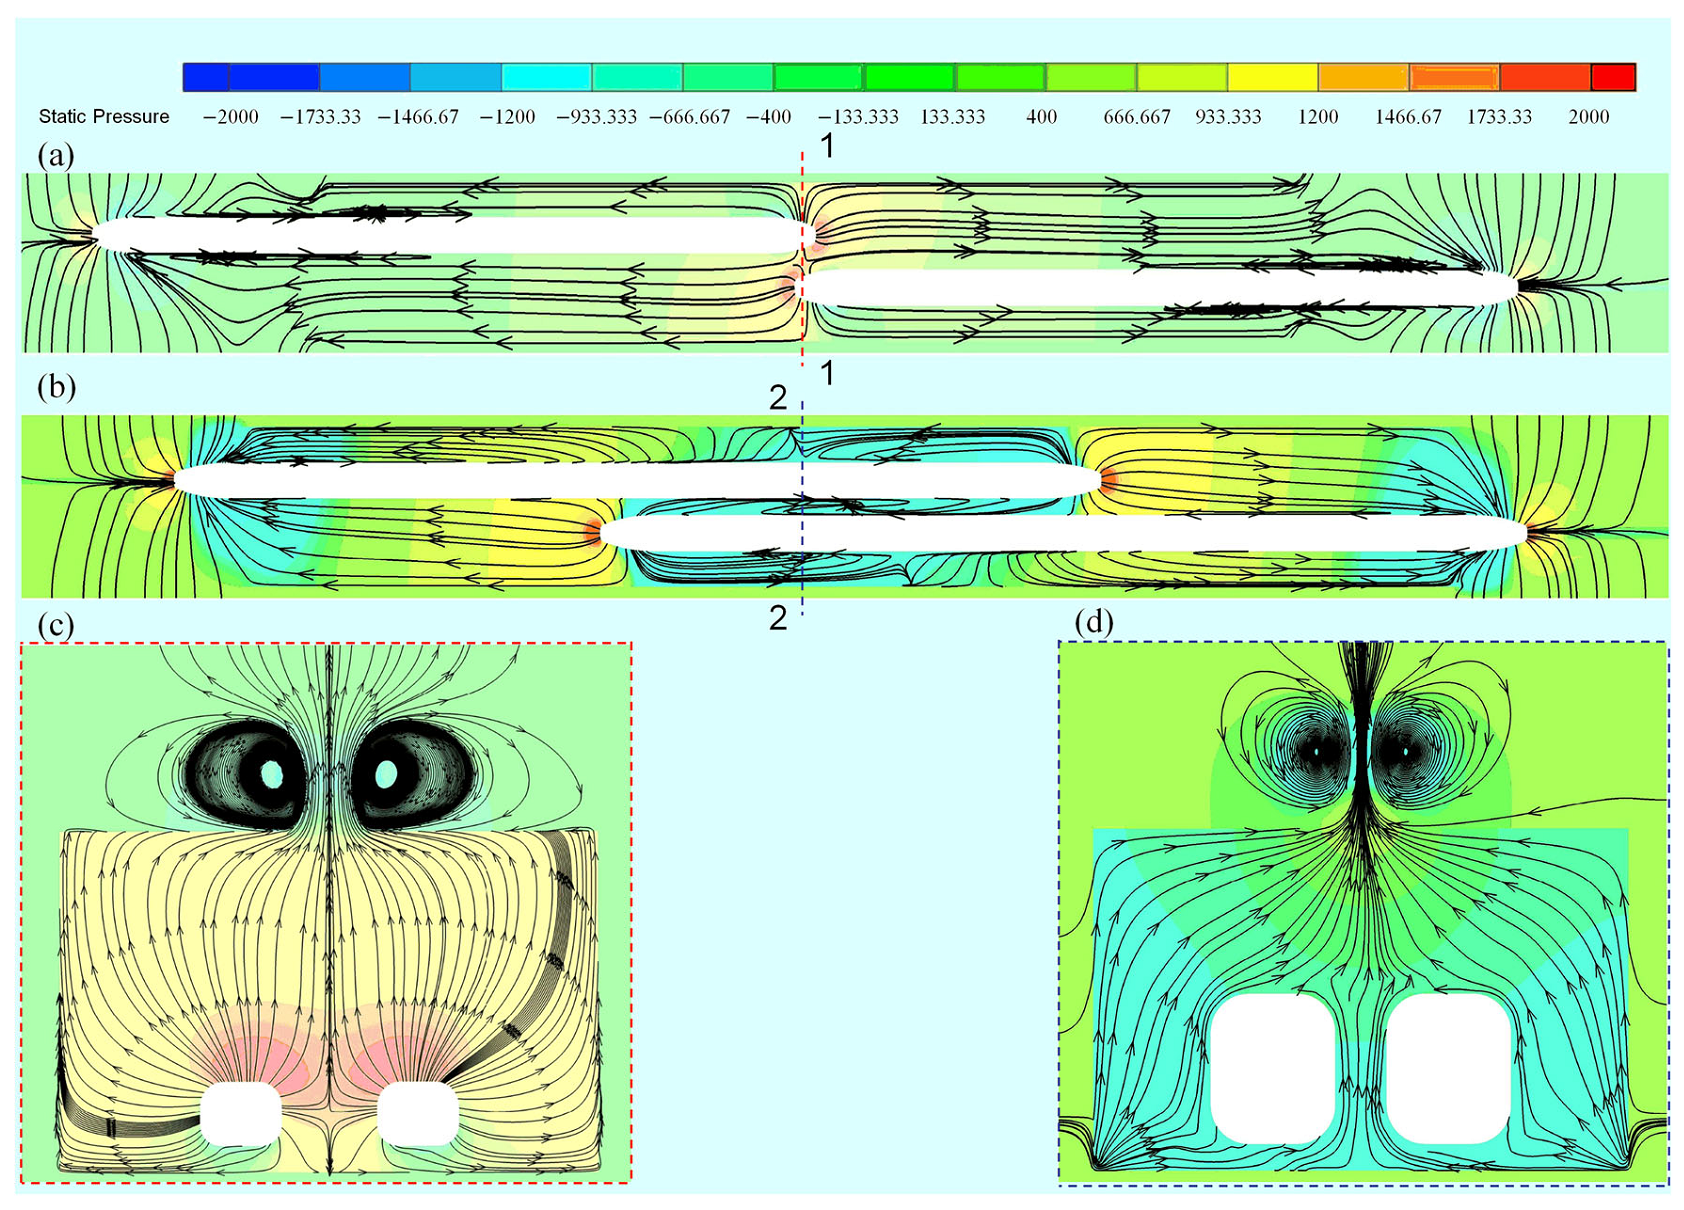
4.1.2. Global Distribution of the Pressure Induced by Double-Trains

Analyzing the flow field characteristics of three noise barriers under single-train operation reveals key differences in airflow paths, vortex scales, and pressure fluctuations. With its partially enclosed top structure, the semi-enclosed noise barrier enhances airflow constraints and complicates the flow field above the train. Under dual-train operation, this impact intensifies due to dynamic interactions, leading to more complex airflow dynamics.
The semi-enclosed noise barrier enhances airflow focusing and vortices in single-train operation, particularly in the train’s middle section. This effect may change in dual-train conditions due to airflow interference. Hence, a model for dual-train crossing noise barriers was created from the single-train model for further analysis, as shown in Figure 12. During dual-train operation, the space between trains alters vortex scale and distribution, leading to larger vortices on both barrier sides.
Moreover, regarding pressure fluctuations, distinct variations arise between single-train and dual-train operations. In dual-train scenarios, the additional trains generate greater pressure peaks and wider fluctuations across the semi-enclosed noise barrier. Here, the airflow limitations of the barrier, coupled with the dynamic interactions among the trains, cause more pronounced pressure fluctuations.

4.1.3. Point Pressure (Point P1-1) Induced by a Single Train

The fully enclosed sound barrier exhibits the highest compression wave pressure peak at 1768 Pa, significantly amplifying the pressure wave. The semi-enclosed barrier follows at 1336 Pa, while the vertical barrier shows the lowest at 1225 Pa, demonstrating that increased enclosure raises peak pressure and airflow restriction. For negative pressure peaks, the fully enclosed barrier also has a most extreme of −1724 Pa, with the semi-enclosed at −1257 Pa and the vertical at −1122 Pa. This highlights the enclosed structure’s constraining effect on airflow, intensifying expansion waves during train passage. Additionally, pressure fluctuation amplitudes (ΔPs) differ among the barriers: the fully enclosed barrier exhibits the highest at 3492 Pa, followed by the semi-enclosed at 2593 Pa, and the vertical at 2347 Pa, indicating that greater enclosure leads to more intense internal fluctuations.
Figure 13 visually represents pressure characteristics, comparing positive and negative pressure peaks and fluctuation amplitudes across three sound barrier types. It highlights the fully enclosed structure’s enhanced effect on pressure waves and the smoother fluctuations of the vertical barrier.
The pressure data in Figure 13 shows that the fully enclosed sound barrier amplifies pressure waves from passing trains the most, while the vertical barrier, with its open structure, weakens pressure waves, causing the least fluctuations. These characteristics relate to the design of sound barriers and offer essential insights for their optimization in engineering applications.

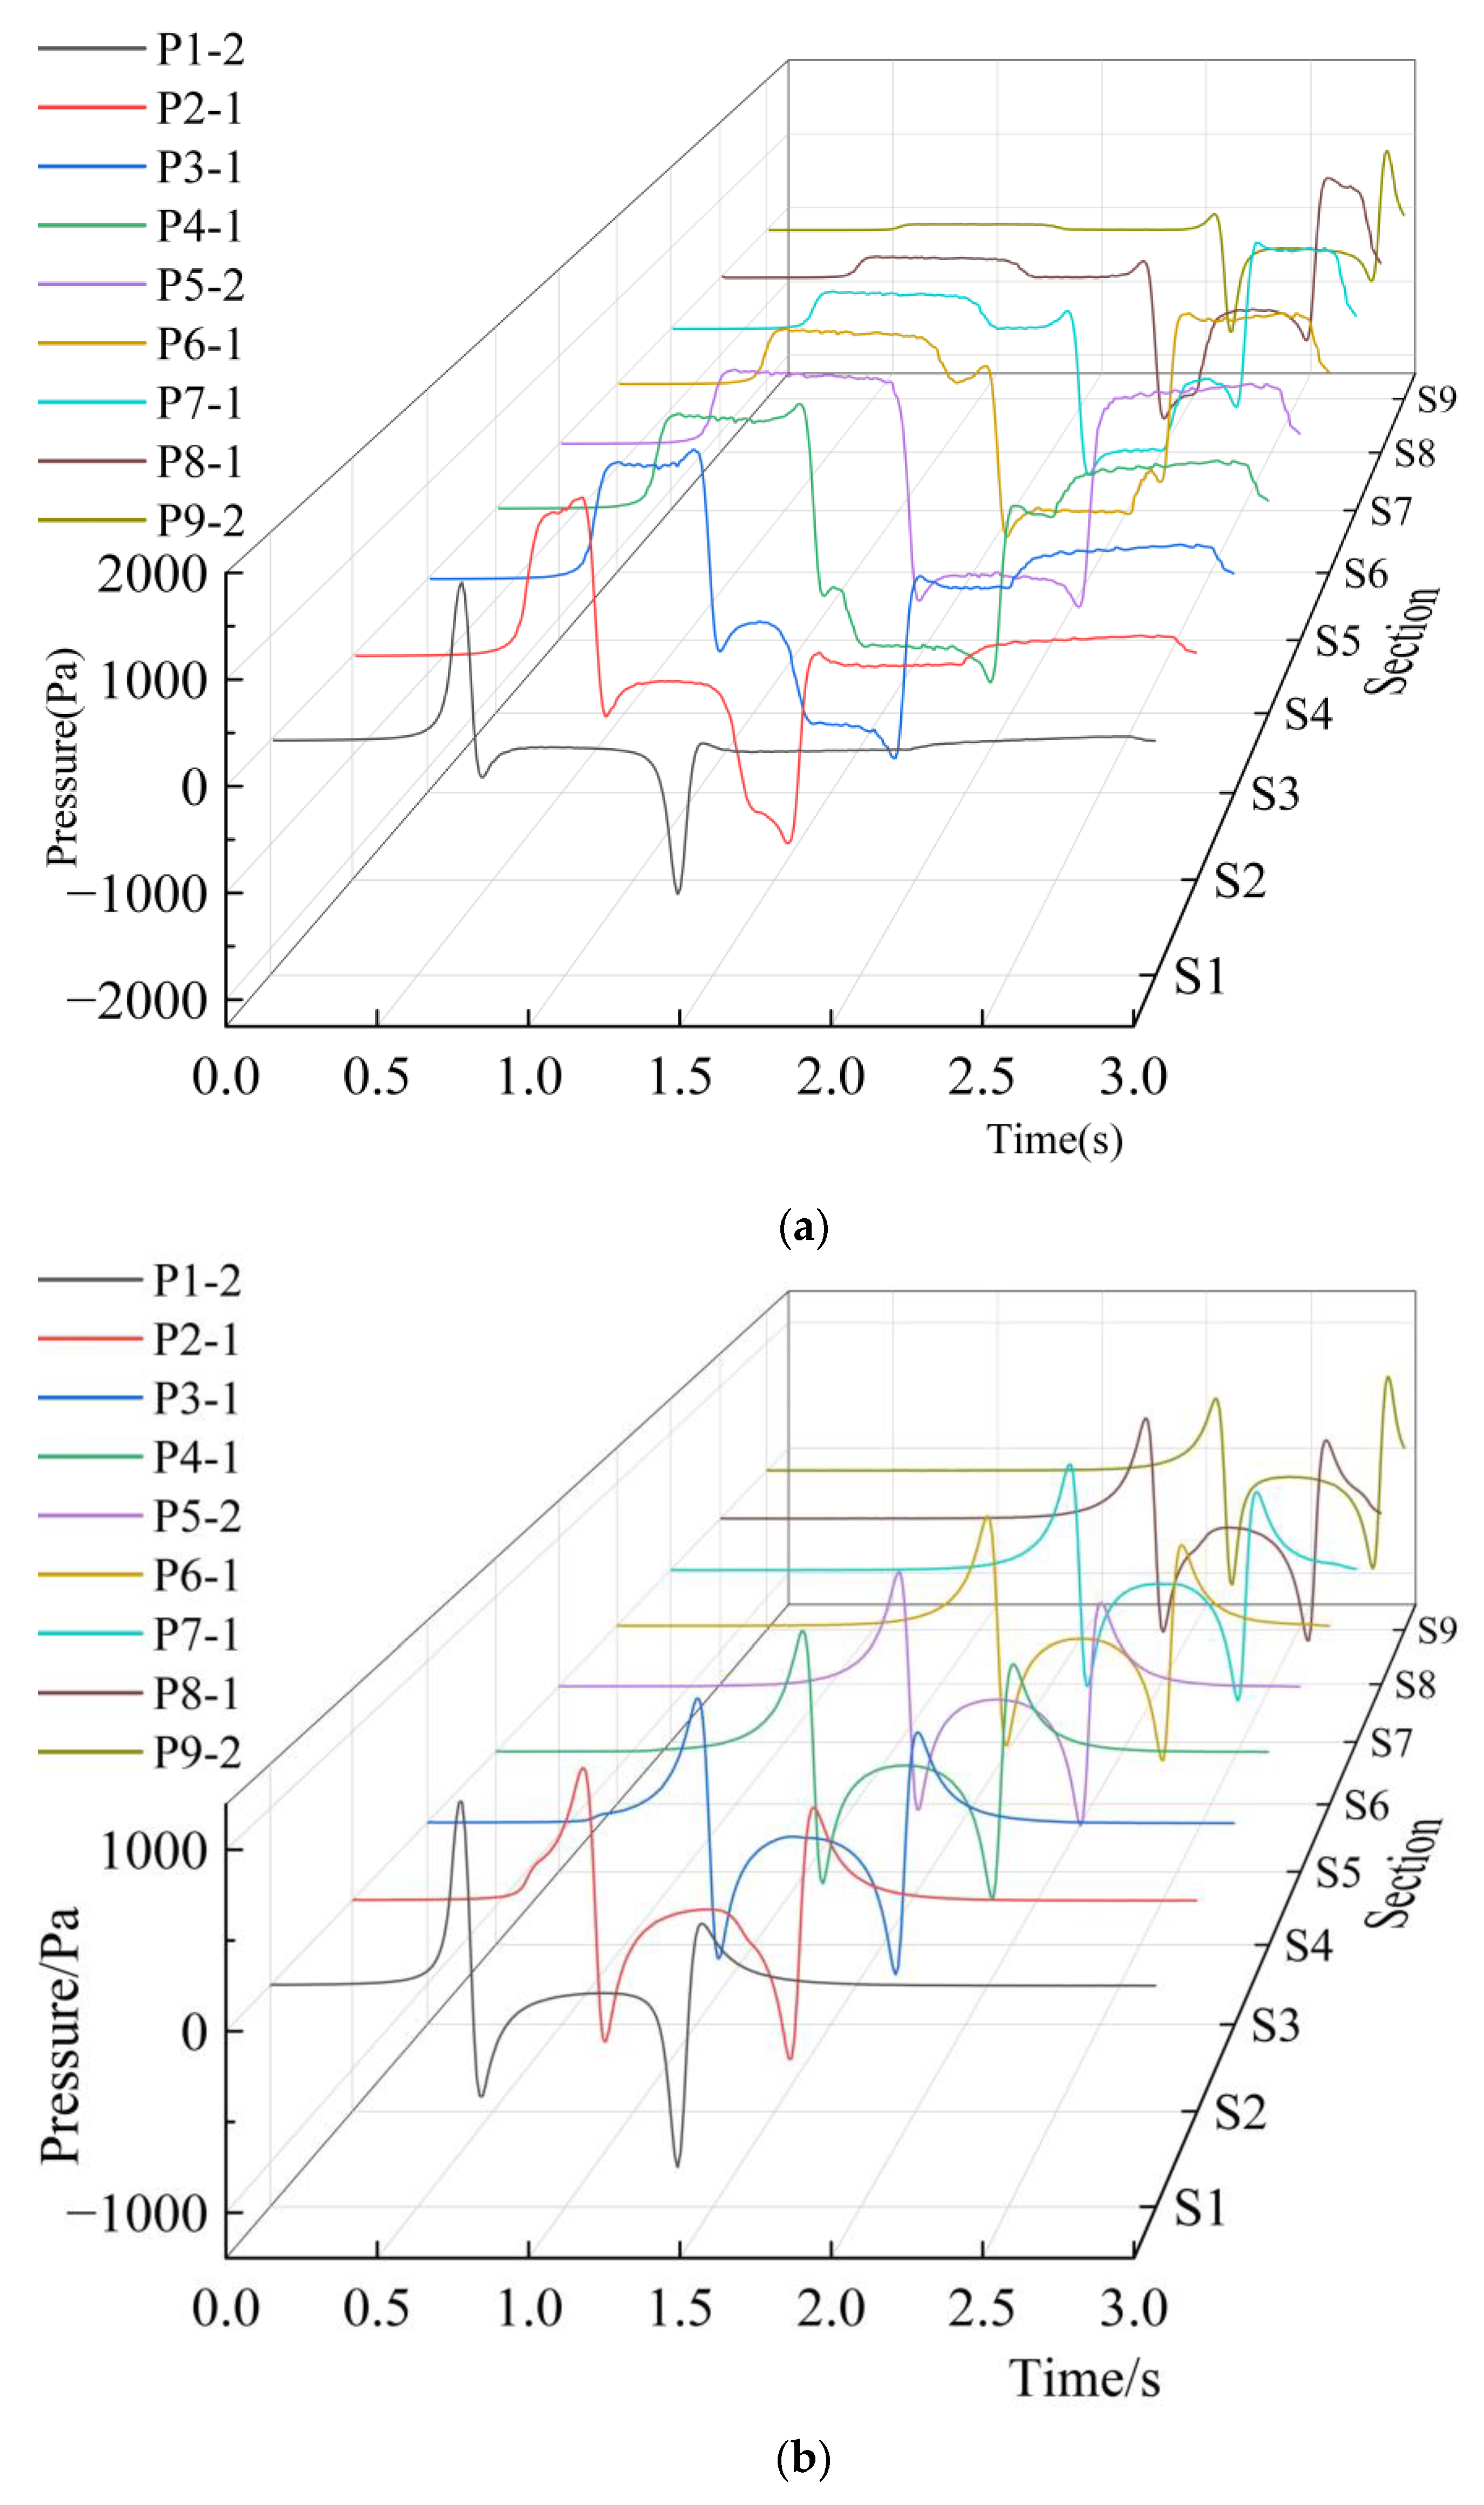
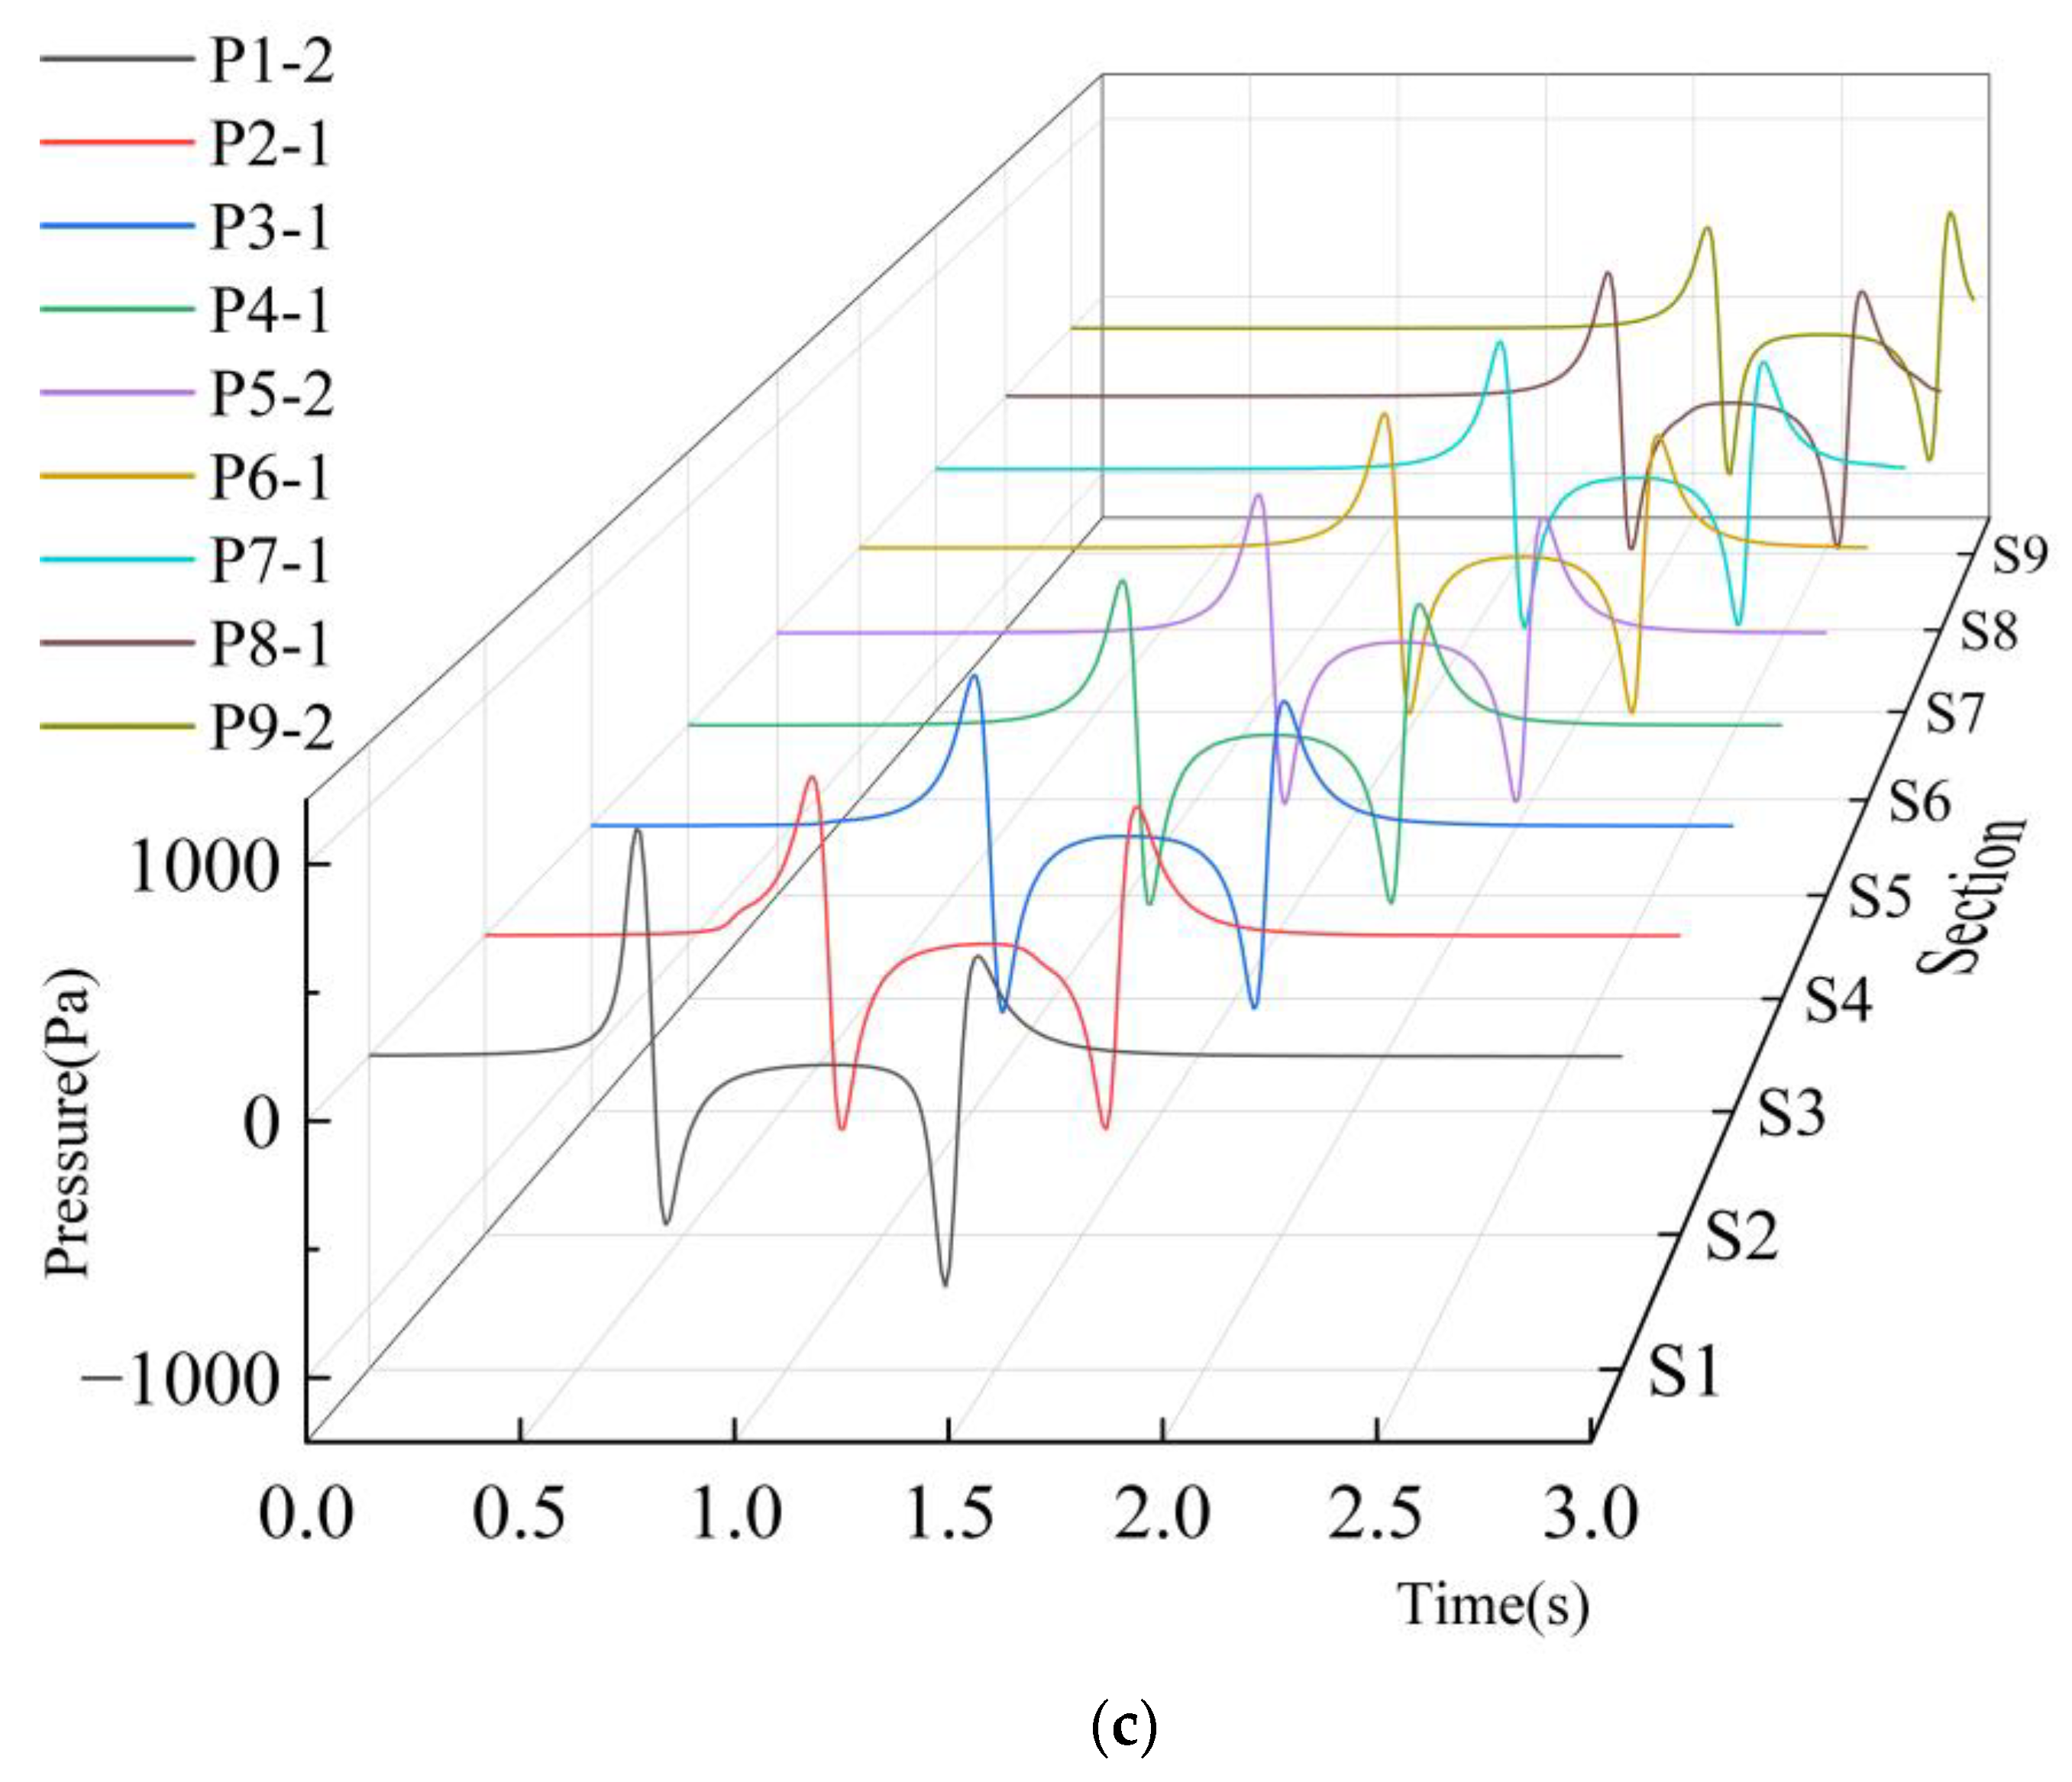
4.1.4. Line Pressure Induced by a Single Train

As shown in Figure 14, the time–history curve of aerodynamic pressure exhibits alternating positive and negative pressure characteristics. When the train reaches the measurement point, the compression wave causes a sharp rise in pressure, reaching a positive peak, followed by a rapid drop to a negative peak. As the middle section of the train passes, the pressure fluctuations gradually stabilize. When the train’s tail reaches the measurement point, the expansion wave leads to a sudden pressure drop to a second negative peak, which is then followed by a rapid increase to a second positive peak.
For vertical and semi-enclosed sound barriers that are connected to external air, the pressure–time curves at measurement points of the same height show similar patterns, characterized by alternating positive and negative pressure with brief extremes. However, in the fully enclosed sound barrier, while the pressure–time curves at the entrance and exit resemble those of the other two types, those at the midsection of the fully enclosed barrier exhibit noticeable changes. In this case, the pressure extremes are more stable and last for longer durations.

4.2. Variation in Aerodynamic Pressure Along the Height of the Sound Barrier

This section focuses on the fully enclosed sound barrier, exemplified in Figure 15, to examine the aerodynamic pressure distribution along its height. Such barriers, characterized by their entirely sealed structure, exhibit unique aerodynamic features in contrast to semi-enclosed or open sound barriers. Notably, on the windward side, the aerodynamic pressure varies at various heights due to several factors, including the operating speed of trains, airflow dynamics, and the height of the barrier.
Figure 16 illustrates the trends in aerodynamic pressure distribution at various heights of the same cross-section within a fully enclosed sound barrier. Although the monitoring points are positioned at different vertical heights along the barrier, their pressure variation trends remain fundamentally consistent, with peak pressures gradually decreasing as height increases within the barrier. This phenomenon is mainly attributed to the ground obstacle effect near the base of the barrier and is similarly observed in the pressure time–history curves of both vertical and semi-enclosed sound barriers.
The airflow near the base of the barrier is restricted by the ground surface, resulting in a smaller effective flow area compared to the upper regions. As a result, the airflow velocity near the bottom is lower, which leads to higher aerodynamic pressure peaks on the windward inner surface of the barrier’s base than at the top. This vertical variation in aerodynamic pressure highlights a critical aspect of structural design: the bottom of the sound barrier experiences greater pressure loading and, therefore, requires more reinforcement than the top. These findings, illustrated by the comparative data of P1-(1-3), P5-(1-3), and P9-(1-3), provide valuable insights into the aerodynamic behavior along the height of fully enclosed sound barriers, emphasizing the need for differential design considerations to ensure structural integrity and performance.

5. Conclusions

This study, based on Computational Fluid Dynamics (CFDs) theory, investigates the pressure fluctuations on vertical, semi-enclosed, and fully enclosed noise barriers as single trains travel at a speed of 350 km/h, as well as the pressure fluctuations on fully enclosed sound barriers for double row trains at the same speed. The simulation results and subsequent analysis lead to the following conclusions:
(i) Effect of Barrier Openness on Pressure: As barrier openness increases, peak pressure and pressure variation significantly decrease. Openness also affects the pressure–time history curves at the barriers’ middle measurement points. Extreme pressure durations are short for vertical and semi-enclosed barriers but last longer for fully enclosed barriers, showing a greater confinement effect on airflow.
(ii) Pressure Variation Along Barrier Height: Aerodynamic pressure decreases with height on the noise barrier, meaning the bottom endures greater loads than the top. Therefore, noise barriers should reinforce the bottom to handle these increased pressures.
(iii) Vortex Characteristics and Flow Complexity: The enclosure of noise barriers influences flow complexity and vortex formation. Fully enclosed barriers create large intense vortices due to restricted airflow, while semi-enclosed barriers produce moderate vortices, especially at the top. Vertical barriers have the least complex flow fields, with small vortices confined to the rear.
We analyzed the various wind pressures experienced by trains passing through sound barriers of different shapes. Subsequent research can examine the noise reduction efficiency of sound barriers with different designs and identify the most effective barrier with a higher safety factor through a comprehensive evaluation, thereby providing guidance for the construction of high-speed railway sound barriers.

Author Contributions

Conceptualization: S.Y.; methodology: S.Y.; software: Q.Y. (lead) and D.Z. (supporting); investigation: H.L. (lead) and S.Z. (supporting).; data curation: R.Z. (lead) and S.Z. (supporting); writing—original draft: R.Z. (lead) and D.Z. (supporting); writing—review and editing: S.Y. All authors have read and agreed to the published version of the manuscript.

Funding

This research was funded by the Taishan Industrial Experts Program grant number No. tscy20230660.

Data Availability Statement

The data that support the findings of this research work are available from the corresponding author, Shengyou Yang, upon reasonable request.

Conflicts of Interest

Although the author Rui Zhang and Qingyuan Yang were employed by the company Jinan-Qingdao High Speed Railway Co., Ltd, Hui Li, Dazheng Zhang, Siyu Zheng and Shengyou Yang declare that the research was conducted in the absence of any commercial or financial relationships that could be construed as a potential conflict of interest. The company had no role in the design of the study; in the collection, analyses, or interpretation of data; in the writing of the manuscript, or in the decision to publish the results.

References

  1. Kim, H.; Hu, Z.; Thompson, D. Effect of cavity flow control on high-speed train pantograph and roof aerodynamic noise. Railw. Eng. Sci. 2020, 28, 54–74. [Google Scholar]
  2. Wang, D.; Ge, J. Vibration and acoustic radiation of bogie area under random excitation in high-speed trains. J. Mod. Transp. 2019, 27, 120–128. [Google Scholar]
  3. Thompson, D.J.; Iglesias, E.L.; Liu, X.; Zhu, J.; Hu, Z. Recent developments in the prediction and control of aerodynamic noise from high-speed trains. Int. J. Rail Transp. 2015, 3, 119–150. [Google Scholar]
  4. Iglesias, E.L.; Thompson, D.J.; Smith, M.; Kitagawa, T.; Yamazaki, N. Anechoic wind tunnel tests on high-speed train bogie aerodynamic noise. Int. J. Rail Transp. 2017, 5, 87–109. [Google Scholar]
  5. Jiang, L.; Kang, J. Combined acoustical and visual performance of noise barriers in mitigating the environmental impact of motorways. Sci. Total Environ. 2016, 543, 52–60. [Google Scholar]
  6. Luo, W.; Chen, J. Study on the contribution of frequency characteristics of sound-absorbing sound barriers to noise reduction. Urban Mass Transit 2017, 20, 171–173. [Google Scholar]
  7. Luo, W.; Li, H.; Chen, J. Comparison of noise reduction effects of various sound-absorbing sound barriers. Urban Mass Transit 2017, 20, 101–103+116. [Google Scholar]
  8. Li, X.; Yang, D.W.; Gao, W.; Luo, Y.K. Study on Vibration and Noise Reduction of Semi-or Fully Enclosed Noise Barriers of High Speed Railways. Noise Vib. Control 2018, 38 (Suppl. S1), 8–13. [Google Scholar]
  9. Li, X.; Zhao, Q.; Zhang, X.; Yang, D. Field Test and Analysis of Noise Reduction Performance of High-speed Railway Semi-closed Sound Barriers. J. Southwest Jiaotong Univ. 2018, 53, 755. [Google Scholar]
  10. Wen, W.; Lei, K.; Yang, D.; Li, X. Full-scale Model Test Study on Noise Reduction Characteristics of Fully Enclosed Sound Barriers for High-speed Railways. J. China Railw. Soc. 2021, 43, 193–199. [Google Scholar]
  11. Xin, S.; Zhang, S.; Wang, X. Study on Noise Reduction Effect of Fully Enclosed Sound Barriers on the Beijing-Xiong’an Intercity Railway. Railw. Stand. Des. 2022, 66, 163–168. [Google Scholar]
  12. Song, Y.; Zhang, M.; Iseth, O.; Rnnquist, A. Wind deflection analysis of railway catenary under crosswind based on nonlinear finite element model and wind tunnel test. Mech. Mach. Theory 2022, 168, 104608. [Google Scholar] [CrossRef]
  13. Baker, C.; Jones, J.; Lopez-Calleja, F.; Munday, J. Measurements of the cross wind forces on trains. Wind. Eng. Ind. Aerodyn. 2004, 92, 547–563. [Google Scholar] [CrossRef]
  14. Wang, D.; Wang, B.; Chen, A. Vehicle-induced aerodynamic loads on highway sound barriers part 2: Numerical and theoretical investigation. Wind. Struct. Int. J. 2013, 17, 479–494. [Google Scholar] [CrossRef]
  15. Lichtneger, P.; Ruck, B. Full scale experiments on vehicle induced transient pressure loads on roadside walls. J. Wind. Eng. Ind. Aerodyn. J. Int. Assoc. Wind Eng. 2018, 174, 451–457. [Google Scholar] [CrossRef]
  16. Yao, S.; Li, R.; Kang, J. Strength calculation of the noise barrier under the wind loads caused by train on high speed railway. Transp. Eng. Inf. 2015, 13, 39–44. [Google Scholar]
  17. Belloli, M.; Pizzigoni, B.; Ripamonti, F.; Rocchi, D. Fluid-structure interaction between trains and noise-reduction barriers: Numerical and experimental analysis. WIT Trans. Built Environ. 2009, 105, 49–60. [Google Scholar]
  18. He, X.; Guo, K.; Yang, B. Numerical simulation study of 840 m fully enclosed sound barrier barometric load of high-speed railway. China Railw. Sci. 2020, 41, 137–144. [Google Scholar]
  19. He, X.; Ji, X.; Jing, H.; Ge, H.; Zhang, J. Numerical Simulations of the Pressure Waves and Micro Pressure Waves Generated by a High-speed Train Passing through an Enclosed Sound Barrier. Acta Aerodyn. Sin. 2021, 39, 142–150. [Google Scholar]
  20. Long, L.; Zhao, L.; Liu, L. Study on Air Pulsating Force of Train-induced Sound Barrier Structure. Eng. Mech. 2010, 27, 246–250. [Google Scholar]
  21. Han, J.; Pan, X.; Ji, X. Study on the time-varying characteristics of pulsating wind pressure of semi-enclosed sound barrier of 350 km/h high-speed railway. Railw. Stand. Des. 2025, 69, 191–197. [Google Scholar]
  22. Jing, H.; Peng, T.; He, X.; Zhou, J.; Zhang, S.; Zhang, H. Experimental Study on Wind Pressure Load of Enclosed Sound Barriers for High-speed Railways. J. Railw. Sci. Eng. 2021, 18, 1960–1967. [Google Scholar]
  23. Han, Y.; Yao, S. Scale effect analysis in aerodynamic performance of high-speed train. J. Zhejiang Univ. Eng. Sci. 2017, 51, 2383–2391. (In Chinese) [Google Scholar]
  24. EN14067-6; Railway Applications-Aerodynamics. Part 6: Requirements and Test Procedures for Cross Wind Assessment. European Committee for Standarization (CEN): Bressels, Belgium, 2018.
  25. Chen, X. Research on the Aerodynamic Pressure Characteristics of the Fully Enclosed Sound Barrier for High-Speed Railway Trains. Ph.D. Thesis, Shijiazhuang Tiedao University, Shijiazhuang, China, 2023. [Google Scholar]
  26. Li, Y.; Chen, X. Study on Aerodynamic Load of Fully Enclosed Sound Barriers for High-speed Railways Induced by Train Operation. Railw. Eng. 2023, 63, 81–88. [Google Scholar]
  27. Qin, X.; Li, X.; Zheng, J.; Wang, M. Fluctuating wind pressure on vertical sound barrier during two high-speed trains passing each other. Int. J. Rail Transp. 2023, 11, 111–128. [Google Scholar]
Figure 1. A sound barrier. (a) Global view. (b) Local view.
Dynamics 05 00014 g001
Figure 2. Illustration of the computational domain and boundary conditions.
Dynamics 05 00014 g002
Figure 3. Schematic type of the train operation modes and the noise barrier layouts. (a) fully enclosed sound barrier; (b) semi-enclosed sound barrier; (c) vertical sound barrier; (d) double-trains in a semi-enclosed sound barrier.
Dynamics 05 00014 g003
Figure 4. Meshes around the train.
Dynamics 05 00014 g004
Figure 5. Schematic diagram of the arrangement of observation points.
Dynamics 05 00014 g005
Figure 6. Local Mesh Refinement.
Dynamics 05 00014 g006
Figure 7. Independent verification.
Dynamics 05 00014 g007
Figure 8. Comparison and validation between numerical simulation and experimental results.
Dynamics 05 00014 g008
Figure 9. Flow field diagram of a vertical acoustic barrier: (a) profile of acoustic barrier; (b) cross-section at the rear of the vehicle; (c) cross-section at the body; (d) cross-section at the front.
Dynamics 05 00014 g009
Figure 10. Flow field diagram of semi-enclosed acoustic barrier: (a) profile of acoustic barrier; (b) cross-section at the rear of the vehicle; (c) cross-section at the body; (d) cross-section at the front.
Dynamics 05 00014 g010
Figure 11. Flow field diagram of a completely enclosed acoustic barrier: (a) profile of acoustic barrier; (b) cross-section at the rear of the vehicle; (c) cross-section at the body; (d) cross-section at the front.
Dynamics 05 00014 g011
Figure 12. Flow field diagram of a completely enclosed acoustic barrier: (a) top view profile of acoustic barrier at moment 1; (b) top view profile of acoustic barrier at moment 2; (c) cross-section of segment 11 in (a); (d) cross-section of cross-section 2-2 in (b).
Dynamics 05 00014 g012
Figure 13. Schematic diagram of influence and the data definition of a pneumatic pressure time history curve at the P1-1 measuring point.
Dynamics 05 00014 g013
Figure 14. The pressure time history curve of the measuring point in the development direction of the sound barrier: (a) fully enclosed sound barrier; (b) semi-enclosed sound barriers; (c) Vertical sound barrier.
Dynamics 05 00014 g014aDynamics 05 00014 g014b
Figure 15. Pressure distributions around the sound barrier (v = 350 km/h).
Dynamics 05 00014 g015
Figure 16. Pressure time history curves for measuring points along the height direction of three types of sound barriers: (1) vertical sound barrier; (2) semi-enclosed sound barriers; (3) fully enclosed sound barrier.
Dynamics 05 00014 g016aDynamics 05 00014 g016b
Disclaimer/Publisher’s Note: The statements, opinions and data contained in all publications are solely those of the individual author(s) and contributor(s) and not of MDPI and/or the editor(s). MDPI and/or the editor(s) disclaim responsibility for any injury to people or property resulting from any ideas, methods, instructions or products referred to in the content.

