1. Introduction
One concern in the field of Horizontal Axis Wind Turbines (HAWTs) is: What control strategies are needed to handle gust pulses in the wind to prevent extreme oscillations of the blades? This question is of concern because these gust pulses can significantly reduce operational life due to fatigue stress or even lead to total turbine destruction from the rupture of one or all of the blades.
In order to design innovative control strategies to modify the oscillatory response that occurs, it is crucial to establish the fundamental vibrational behavior of the blades when excited by gust pulses of different frequencies and amplitudes present in the fluctuating wind inflow. Proper handling of these gust-pulse situations has the potential of increasing the turbine energy output, and most importantly, substantially extending the turbine’s operational life.
Of particular interest is the relationship between the Tip Speed Ratio (TSR) of the rotor and the pitch angle of the blades (which constitute the two basic parameters for control of modern utility-scale HAWTs) and the rotor’s oscillatory response. The TSR is defined as the ratio between the tangential speed of the blade tips and the average speed of the undisturbed incoming wind, while the blade pitch has the dimensions of an angle. Both parameters are, by definition, non-dimensional quantities. This fact opens the possibility of finding a universal Reduced-Order Characterization (ROC) of the rotor’s oscillatory response that could be applied to turbines of any size, as long as they share geometrical similarity in the shape of their blades and similarity in the materials used in their internal structures. The latter two conditions are not infrequent, as blades for modern utility-scale wind turbines typically share common construction techniques and geometrical designs using the same families of airfoil cross sections, scaled at different sizes depending on their designed power output.
In a series of previous works (see Jalal et al. [
1] and Ponta et al. [
2]), the authors presented a novel reduced-order technique that provided an energy-based characterization of the fundamental modes of oscillation of wind turbine rotors when excited by combinations of wind gust pulses of different frequencies and amplitudes.
The great advantage of an ROC is that it provides a relatively simple formula that is capable of predicting the dominant vibrational modes of a blade with sufficient precision to be useful in the determination of a control decision, and it can be computed in real time. The latter aspect is of fundamental importance, as wind turbine control decisions must be implemented on a short-term basis to deal with rapid fluctuations in wind conditions. The main focus of the present work is to extend these original notions of an energy-based ROC to a universal technique expressed in terms of non-dimensional quantities that could be applied to turbines of any size, operating under any set of wind conditions, as long as they share geometrical and material similarity.
The usefulness of obtaining a universal ROC expressed in terms of non-dimensional quantities is very clear. This is because an ongoing trend has been occurring in which the size of wind turbines has been growing rapidly due to innovations in technology, economies of scale, as well as the need to meet higher demands for renewable energy generation [
3]. However, larger rotors must maintain a smaller ratio of mass to diameter to ensure minimization of the Levelized Cost of Energy (LCOE). This goal of a proportionally light rotor has resulted in rotors that are more flexible than previous iterations [
4,
5,
6]. One manifestation of the consequences of more flexible rotors is that these rotors have less aeroelastic stability and experience greater deformation during operation [
7]. These two effects work in tandem to create an overall great risk to the lifetime performance of the turbine if proper control strategies are not applied [
8,
9].
Keeping these risks in mind, it is even more important than ever to study the structural responses to different aerodynamic load situations to be able to compare these new interactions with the ones from previously studied smaller-scale turbines [
10]. However, given the extreme scale of modern HAWTs, wind tunnel testing is not a viable option to study the mentioned interactions. Looking at some current reference wind turbines, the Delft University 10 MW Reference Wind Turbine (DU-10MW-RWT) has a rotor diameter of 178.3 m [
11], whereas the National Renewable Energy Laboratory 5 MW Reference Wind Turbine (NREL-5MW-RWT) has a slightly smaller rotor diameter of 126 m [
12]. When looking at available wind tunnels, one of the largest, owned by NASA, only has a section that is 24.4 m by 36.6 m [
13], which limits the size of the rotor models that could fit inside. These large differences between the scale of the models and the scale of the prototype preclude proper extrapolation of the wind tunnel data at the prototype scale. Therefore, this leads to the need for the use of fluid simulations.
For rotor flow modeling, several computational approaches have been considered, for instance: classical Reynolds-Averaged Navier–Stokes (RANS) [
14,
15,
16], Large Eddy Simulation (LES) [
17,
18,
19,
20,
21], Direct Numerical Solution (DNS) [
22], and reduced-order analysis [
23]. These models show differences in accuracy and computational costs, which are related to the wide range of techniques utilized [
24,
25].
A common limitation related to the use of these flow models is that they are not easily integrable with the models of structural response that would be needed to study blade aeroelastic dynamics, and such integration would result in a final software package with a substantially high cost in terms of computational resources given the high-order nature of the flow models themselves. Reduced-order models that integrate aeroelastic dynamics have been created using the Blade Element Momentum (BEM) technique [
26,
27]. However, as previously mentioned, model results can vary widely in quality depending on the strength of the model.
In an effort to handle the multiphysical interactions associated with aeroelastic dynamics, a new simulation modeling suite was introduced by Ponta et al. [
28] and subsequently validated using the NREL-5MW-RWT and other turbines as benchmarks. This new multiphysics suite was given the name of the Common ODE Framework (CODEF) and has the ability to account for the dynamic responses of wind turbine blades. CODEF’s aeroelastic module, called the Dynamic Rotor Deformation–Blade Element Momentum (DRD-BEM) model, also ensures that any changes in the blade geometry due to deformation, which affect blade section attitude versus the incoming flow, are accounted for dynamically. Some general details regarding the algorithmic structure of CODEF will be given in
Section 2 to make this paper self-contained. An in-depth covering of CODEF, its aeroelastic modules, and its validation can be found in Ponta et al. [
28], as well as several other previous publications by the authors (see Jalal et al. [
1] and Ponta et al. [
2] and the references within).
In Jalal et al. [
1], the authors used the Delft University 5 MW Reference Wind Turbine (DU-5MW-RWT) [
29], a stall-controlled alternative to the pitch-controlled NREL-5MW-RWT, for a range of different experiments to assess what effect gusts would have on turbine operational conditions relating to the frequency content and time evolution of the oscillatory aeroelastic response of the rotors. These gusts occurred in a constant wind regime but themselves varied in amplitude and time span. The gust pulses were designed this way to ensure that the pure aero-elasto-inertial dynamics of the rotor’s response could be studied in a controlled manner and to ensure that the gusts used replicated those found in real-world scenarios. Once the study was completed, Reduced-Order Characterization (ROC) of the rotor dynamics as a system that oscillates was applied based on the idea of energy transfer principles. These results were then generalized for machines that were geometrically similar.
Another study, presented by the authors in Ponta et al. [
2], focused on the Sandia National Labs National Rotor Testbed (SNL-NRT) turbine, based on the turbine design of Kelley [
30]. In this study, the baseline SNL-NRT turbine was used, along with a version that was scaled by 10× in size. Modifications to the blade shell and inner spar cap were also completed via reduction of the total material used. The goal here was to simulate a current model turbine, an upcoming state-of-the-art sized turbine, and several variations that had more flexible blades due to the modifications mentioned to determine how changes in flexibility changed the oscillatory responses of the blades. Elucidated from the Ponta et al. [
2] study were two ideas of note:
Firstly, as blade flexibility increased, so too did aerodynamic dampening and the rate of dissipation of the rotor’s oscillations. This can potentially lead to passive methods of turbine control to mitigate wind turbulence caused blade vibrations. This potential passive control effect should be taken into account in the formulation of advanced active control strategies for wind turbine rotors to ensure that they create a synergistic effect without counteracting or interfering with each other’s operation.
Secondly, the previously mentioned ROC technique can be generalized into a universal form based on non-dimensional quantities, which would be applicable to many rotors of different sizes as long as they share geometrical and material similarity in their blade structure. This new non-dimensional ROC could provide a fundamental tool to design standardized active control strategies that could be used in machines that share the same design philosophy over a wide range of power output.
These two ideas led to the study described in this article. Here, the oscillatory decay behavior of the NREL-5MW-RWT, along with one up-scaled and one down-scaled variation of 0.5× and 2× scaling factors, respectively, was further investigated. These two scales were chosen in particular because, when applied to the original NREL-5MW-RWT design, they cover the typical range of sizes of commercial utility-scale wind turbines that are in operation today, as well as the ones that could be expected to enter into operation in the near future. The methodology for obtaining this universal non-dimensional ROC will be discussed in
Section 3 and
Section 4. This will be followed by a discussion of the rotor’s aeroelastic stability in
Section 5.
In order to facilitate interpretation of the abbreviations and acronyms used in this work, a table has been added to the Abbreviations section at the end of this paper.
2. An Overview of the CODEF Suite and Its Aeroelastic Modules
In this section, the theoretical background for CODEF and its aeroelastic sub-models, the Generalized Timoshenko Beam Model (GTBM) and the DRD-BEM, will be discussed. First, CODEF, as a multiphysics modelling suite, will be covered, followed by GTBM, with DRD-BEM being last. Of note is that CODEF also includes another module it can use as well, a Gaussian Vortex Lattice Model (GVLM). This module is mainly used when wind farm situations are being studied. For the work presented here, the focus is on simulating the aeroealstic response of a single wind turbine. Hence, the following description will mostly focus on the GTBM/DRD-BEM modules.
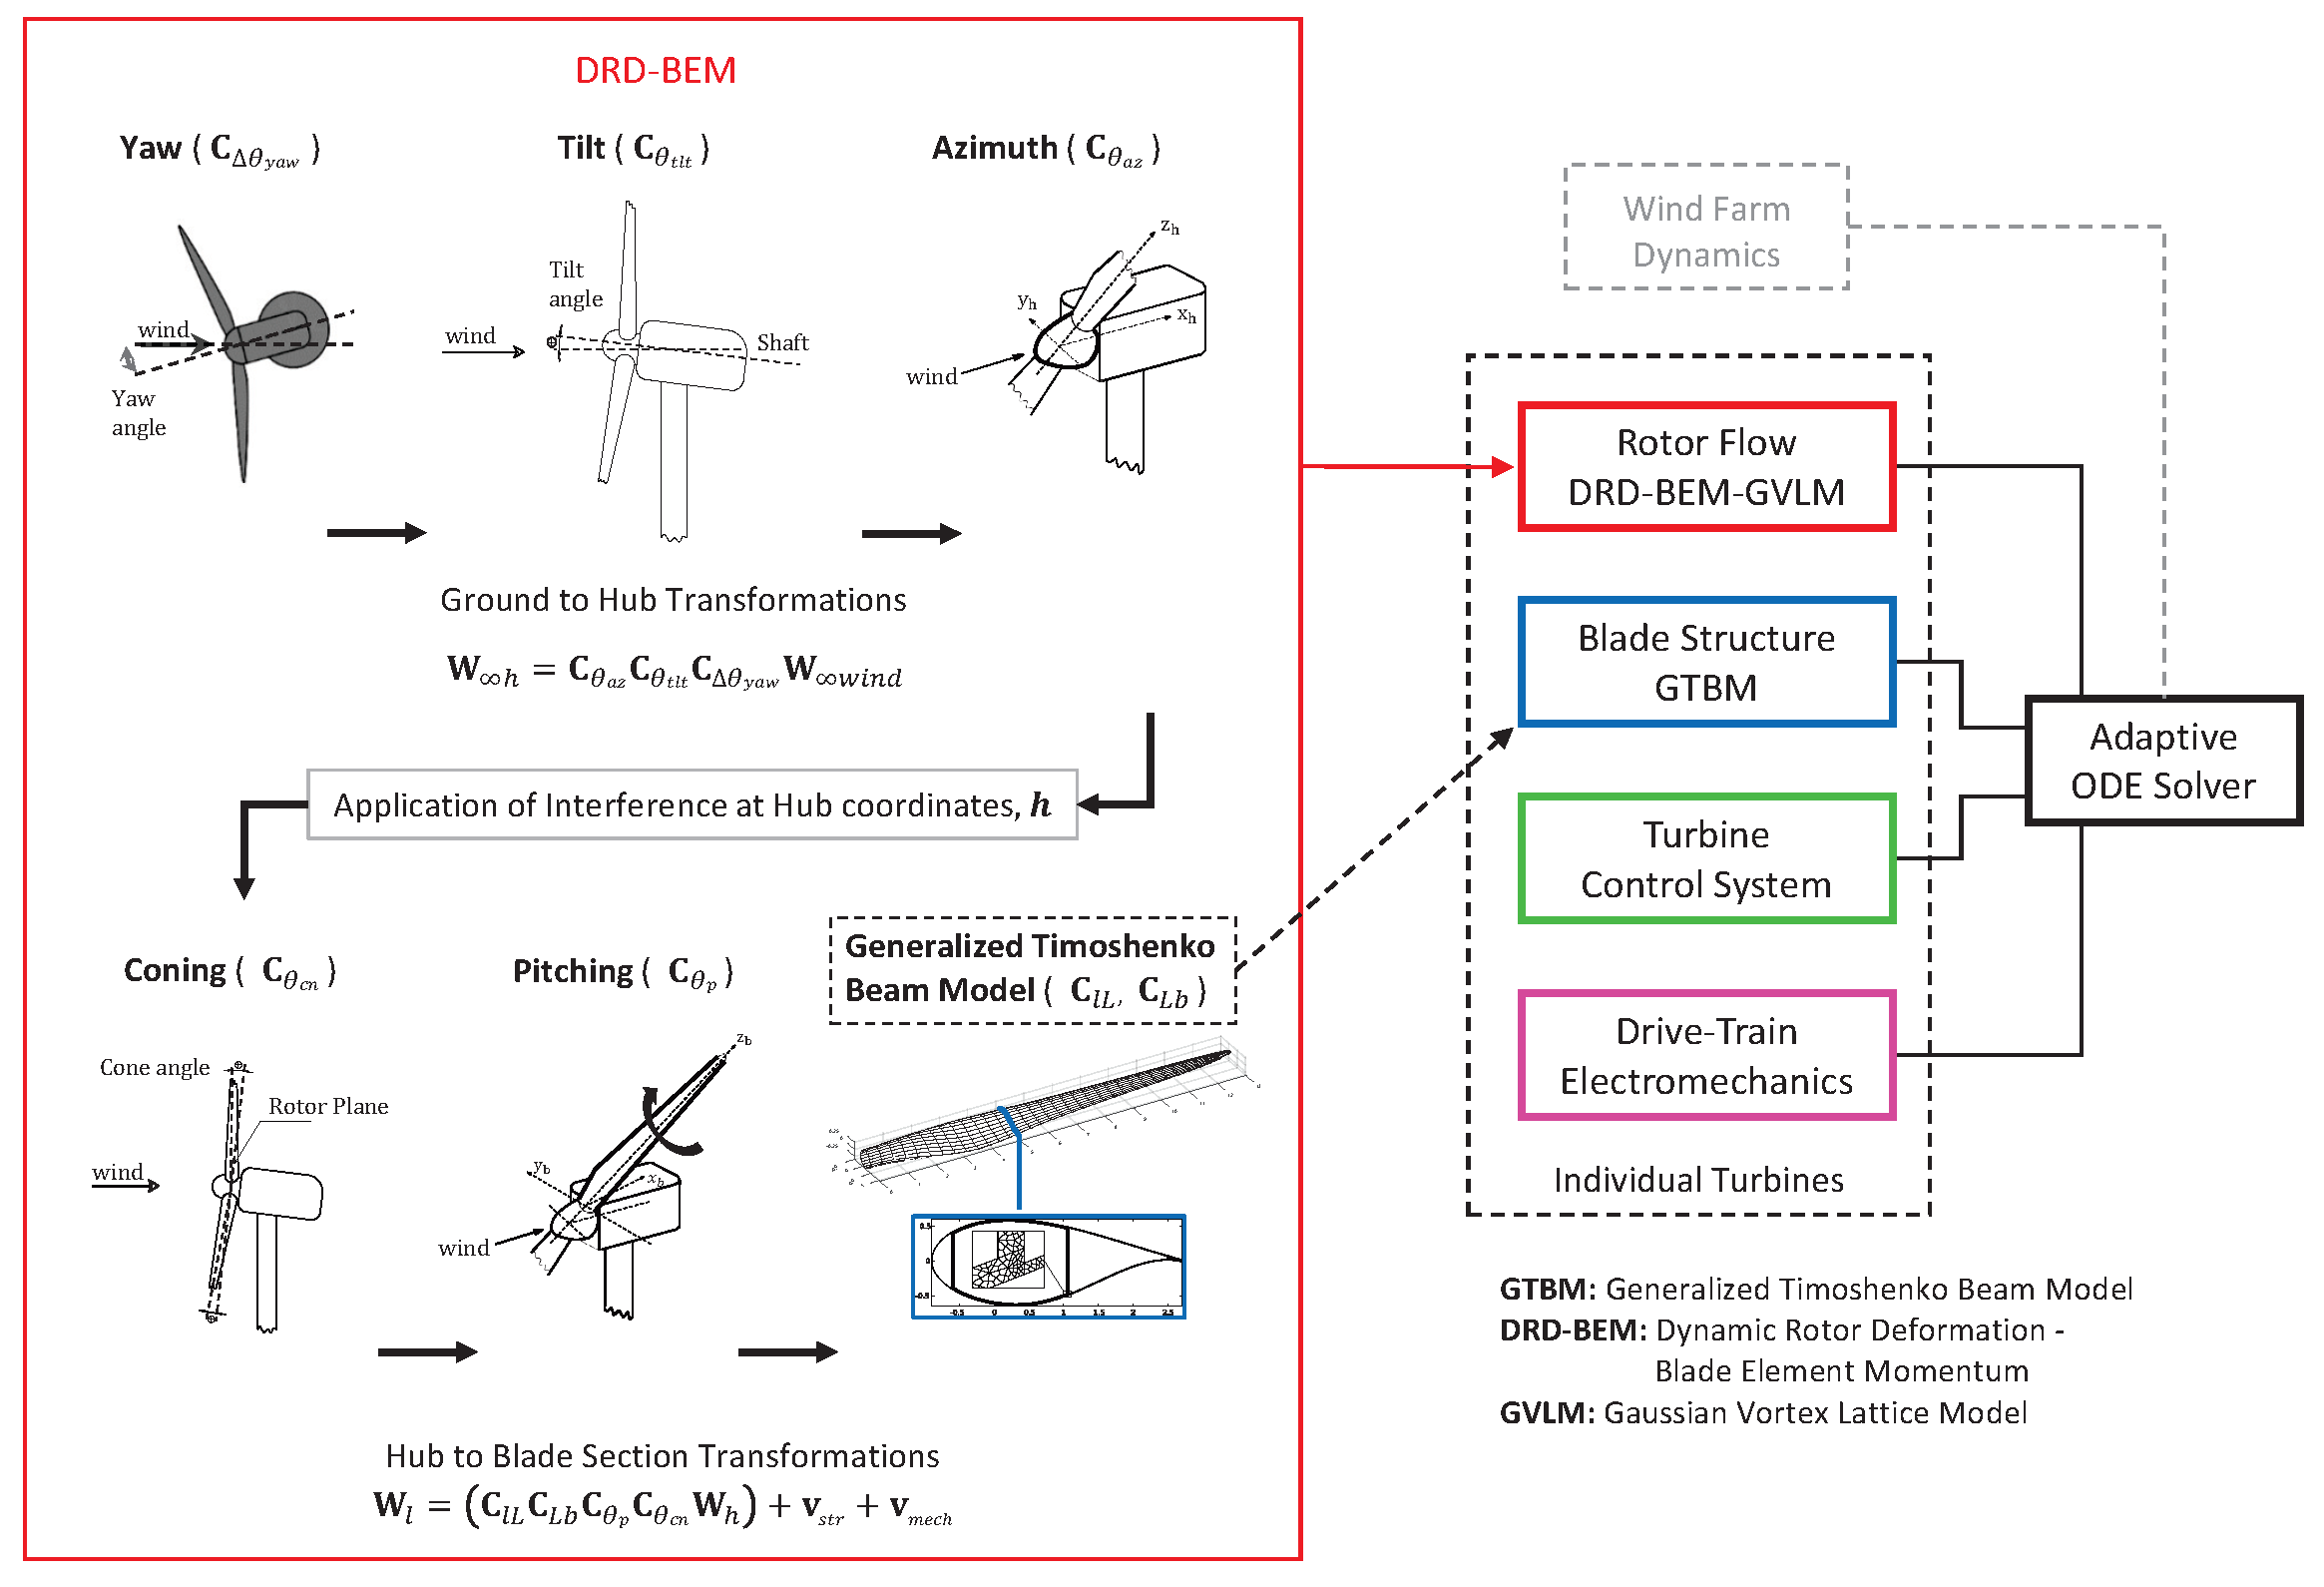
Figure 1 shows a schematic representation of CODEF’s flowchart. By using a multivariable ODE solution in time, CODEF is able to solve wind turbine dynamics as an adaptive dynamic multiphysics modeling technique. It uses a non-linear adaptive variable-timestep/variable-order set of algorithms to solve the overall ODE system. This system has modules that model rotor flow, blade structure, control systems, and electromechanical devices. The equations for these modules are gathered by CODEF, and the local truncation error at every timestep is monitored. This monitoring process allows CODEF to be computationally efficient and have time-marching stability despite its scope, as it effortlessly integrates all the aspects of the multi-physics problem. These features also make CODEF capable of modeling the aeroelastic dynamic responses that occur due to taken control actions, as well as interfacing with a further set of equations that would allow for the solving of electrical interactions within the wind farm grid, the overall wind farm control system, and the farm-scale collective flow via the mentioned GVLM module.
Moving on to the modules that make up CODEF, the first is GTBM. The purpose of the GTBM module is to reduce the structural problem from being 3D down to 2D, and then down to a 1D, non-linear, time-dependent solution of an equivalent beam that is considered one ODE system. This is accomplished using a set of linear pre-solutions on the blade section along the span. GTBM uses the same variables as the classical Timoshenko beam theory; however, the key idea that beam sections stay planar is no longer considered. Rather, a 2D finite mesh is used to interpolate the real warping of the beam sections.
Once the real warping is found, the strain energy of the 3D blade is pre-solved by being rewritten to conform to the classical 1D variables. The dimensional reduction that occurs creates a completed 6×6 stiffness matrix for the warped blade section, which does include all coupled deformation modes such as the bend–twist mode. From this, the blade’s structural dynamics can be solved during each timestep of the overall ODE, which is part of what allows CODEF itself to be as efficient as it is. Further details can be found in Ponta et al. [
28] and the references therein.
The aerodynamic counterpart of GTBM is the DRD-BEM module. Introduced by Ponta, et al. [
28], the overall goal of the DRD-BEM module is to transform the incoming wind vector in the ground coordinate system,
, using a series of linear orthogonal matrix operators, to its instantaneously deformed configuration,
. In this manner, the angular misalignment caused by large rotations of the airfoil sections due to blade deformation, induced by the action of mechanisms like yaw or pitch variation, or caused by blade and rotor design features such as twist and tilt are included in the computation of the flow velocities and aerodynamic forces acting on each blade element.
Figure 1 shows iconic representations of these coordinate transformations and their associated mathematical expressions as a series of multiplications of the orthogonal matrix operators:
,
,
,
,
,
,
.
Briefly breaking down the sequence, the first step of the DRD-BEM module is to take the incoming wind in the ground coordinate system, , and transform it into the hub coordinate system, , by accounting for potential yaw, tilt, or azimuth angles. Then, , which is still the undisturbed wind velocity, is modified via the application of the axial and angular velocity induction coefficients to account for rotor interference, transforming into . Next, is transformed from the hub coordinate system to the instantaneous blade-section coordinate system by accounting for aspects such as rotor coning, blade pitching, blade section rotations induced by blade twist in the geometric blade design (i.e., in its non-deformed configuration), and rotations caused by the instantaneous structural deformation (updated dynamically with results from the GTBM module). Then, additional components that may affect blade velocity are accounted for, including structural vibrations and/or mechanical actions. Ultimately, this all leads to being used to calculate the aerodynamic forces that each blade section experiences, which are transformed back to be referred to the hub coordinate system. These aerodynamic forces on the blade sections are also back-fed into the GTBM module to account for the structural changes they may cause—this ultimately means these two modules are intimately related in their solutions.
Full details about the DRD-BEM implementation, as well as mathematical formulae, can be found in Ponta et al. [
28], along with the results of DRD-BEM solutions applied to studies of vibrational modes of wind-turbine blades and validation tests against well-established data from Jonkman et al. [
12] and Xudong et al. [
31].
As mentioned before, the CODEF module for wind farm flow vortex-wake simulation has the additional capacity of modeling inter-turbine wake dynamics and wake interactions with background atmospheric flow through implementations of the GVLM, introduced by Baruah and Ponta [
32]. For interested readers, the latter reference also includes a series of validation tests that compares GVLM results for the operation of wind turbines at the SNL’s Scaled Wind Farm Technology (SWiFT) facility in Lubbock, TX [
33,
34,
35], with their respective Light Detection and Ranging (LiDAR) field measurements of wake velocity patterns reported in Herges et al. [
36].
Briefly, GVLM uses a set of Gaussian-core vortex filaments to represent the wake generated by each turbine. These Gaussian-distributed vortex cores propagating downstream along the farm flow domain account for the viscous decay of the vortex cores. This represents what would occur naturally in the wake evolution. This differs from earlier vortex-lattice models based on the Biot–Savart law, which uses a singularity concentration of vorticity at the filaments axis, producing unrealistically high vortex-filament-induced velocities in the filament’s proximity.
As changes in rotor structural responses can influence the manner in which turbine vortex-wake structures form, thereby affecting wake evolution [
7], GVLM flow information is designed to be fully integrated with DRD-BEM and the rest of the modules in the CODEF suite.
For further details regarding the free vortex lattice technique, please refer to Ponta and Jacovkis [
37] and Strickland et al. [
38], Cottet and Koumoutsakos [
39], Karamcheti [
40], and Baruah and Ponta [
32]. Further details regarding the Gaussian-core vortex theory are available in Ponta [
41], Lamb [
42], Batchelor [
43], Trieling et al. [
44], Flór and van Heijst [
45], and Hooker [
46].
3. ROC’s Theoretical Background and Methodology of the Present Analysis
As previously mentioned, in a series of previous works, the authors introduced the notion of ROC. To ensure this paper is self-contained, the two main aspects of ROC, as well as its main findings, will be covered in the section below. For the interested reader, Jalal et al. [
1] and Ponta et al. [
2] can be referred to for full details.
The first aspect regarding the ROC that will be discussed consists of the specifics related to the gust pulses that are applied onto a steady-state flow stream. In an effort to replicate gust pulses that reproduce real-world scenarios, several pulse sources were considered to properly design the simulation pulses after. These were pulses created by the rotation of blades through a variable flow field; pulses in the time signals of wind velocity, direction, shear, and veer; pulses originating from the wake of an upwind turbine; and pulses created by control actions such as pitching, yawing, or variable rotational speed operation.
Ultimately, pulses coming from changes in the time signals of wind velocity were chosen to reproduce the effect of real pulses, as they induce the same behavioral response on the rotor’s oscillations. From these pulses, three categories were designated based on the timespan of the pulse, as this was the more important factor when characterizing the behavior of the turbine response elicited. These three categories are described by comparing the relative timespan of the gust pulse versus the period of the first (and slowest) bending mode of blade oscillation in the direction of the rotor’s axis.
The first type of gust pulse belongs to the “short” category. These are gust pulses that are short enough in timespan that they end before the turbine blades have time to reach their first peak of bending oscillation. In this situation, aerodynamic damping has no time to act, and essentially all the kinetic energy of the gust pulse is stored as elastic energy in that first oscillation peak. By monitoring the peaks in the blade deflection signal, it is possible to describe the evolution of vibrational energy stored within the rotor as an oscillatory system. For this reason, short pulses are used in the energy-based ROC.
On the other end of the timespan spectrum are the “long” pulses. For gust pulses to be considered long, they must be long enough that the energy of the pulse is applied gradually to the blades, letting the blades absorb the energy and dissipate it via aerodynamic damping in a practically simultaneous manner. This causes these types of pulses to stimulate only small, even negligible, oscillations.
In between the two previous categories, there are the “transitional” pulses. For a pulse to be considered transitional, it must occur for a long enough period of time that the blades start to see oscillatory energy dissipation via aerodynamic damping before the pulse ends. This causes only a partial amount of the pulse energy to be imparted into the blades as elastic energy. In this type of pulse event, the peaks of bending deflection, even though not negligible as in the case of the long pulses, are not so marked as in the case of the short pulse events, and their effects are not critical.
The next aspect to be described about the ROC technique is the energy-transfer characterization, where controlled gust pulses of the aforementioned short category in varied combinations of timespans and amplitudes are applied on top of the background steady-state wind stream of a certain velocity, Ws. From this, the various axial blade deflection time signals are computed. These are blade deflections in the direction of the rotor’s axis, and they are measured from a “reference” deflection value corresponding to the one induced by the mean wind stream. As mentioned previously, the kinetic energy of an individual gust pulse belonging to the short category is essentially absorbed in its entirety by the rotor as a spring-mass mechanical oscillator. The amount of mechanical energy stored at the rotor at any time can be quantified via evaluation of the instantaneous value of the elastic energy of deformation stored in the rotor at each of the peaks in the blade deflection signal and the enveloping curve that connects those peaks. In this manner, a correlation could be established between the elastic energy accumulated as the blades deform and the kinetic energy content of the pulse that induced the oscillation signal.
There is a range of wind speeds and rotational velocities where the rotor’s oscillatory response is stable; that is, the oscillations induced by a gust pulse decay with time. When the rotor operates within that stable region, the kinetic energy per unit area of the rotor’s disk surface delivered by the gust pulse, , can be used as a normalization factor for the axial blade deflection, .
The signals of this Normalized Blade Deflection (NBD) of the oscillatory response for all individual pulses,
, collapse into one nearly identical plot. This collapse not only involves a coincidence in the signal’s frequency but, most importantly, in the enveloping curve that defines the oscillatory decay. The rate of decay of the NBD was found to be dominated by aerodynamic damping, depending exclusively on the operational regime (given by the background wind speed and the rotational speed), regardless of the particular amplitude and time span of the pulse applied (see Jalal et al. [
1] and Ponta et al. [
2] for more details). This results in a unique characterization of the dynamic vibrational response of the rotor that only depends on its operational regime, not on the nature of the individual gust pulse that excited the oscillations.
The energy-based characterization hinges upon using the first axial mode (also known as the first “flapwise” mode) of the blade’s deflection as the single parameter to measure the elastic energy that remains stored in the rotor at every instant of its oscillatory evolution (hence the notion of “Reduced-Order” included in the naming of the ROC). As mentioned in
Section 1, this reduction in the order of the characterization of the rotor’s vibrational response allows for the use of a simpler formula that could be solved in real time within the logics of a control system while still preserving enough accuracy in the prediction of the oscillatory evolution. This is due to the fact that, within the range of operational conditions where the rotor’s response is stable, the first mode (Mode-1) of oscillation is by far the dominant one. Thus, a single-mode characterization based on Mode-1 suffices to describe the rotor’s oscillatory evolution.
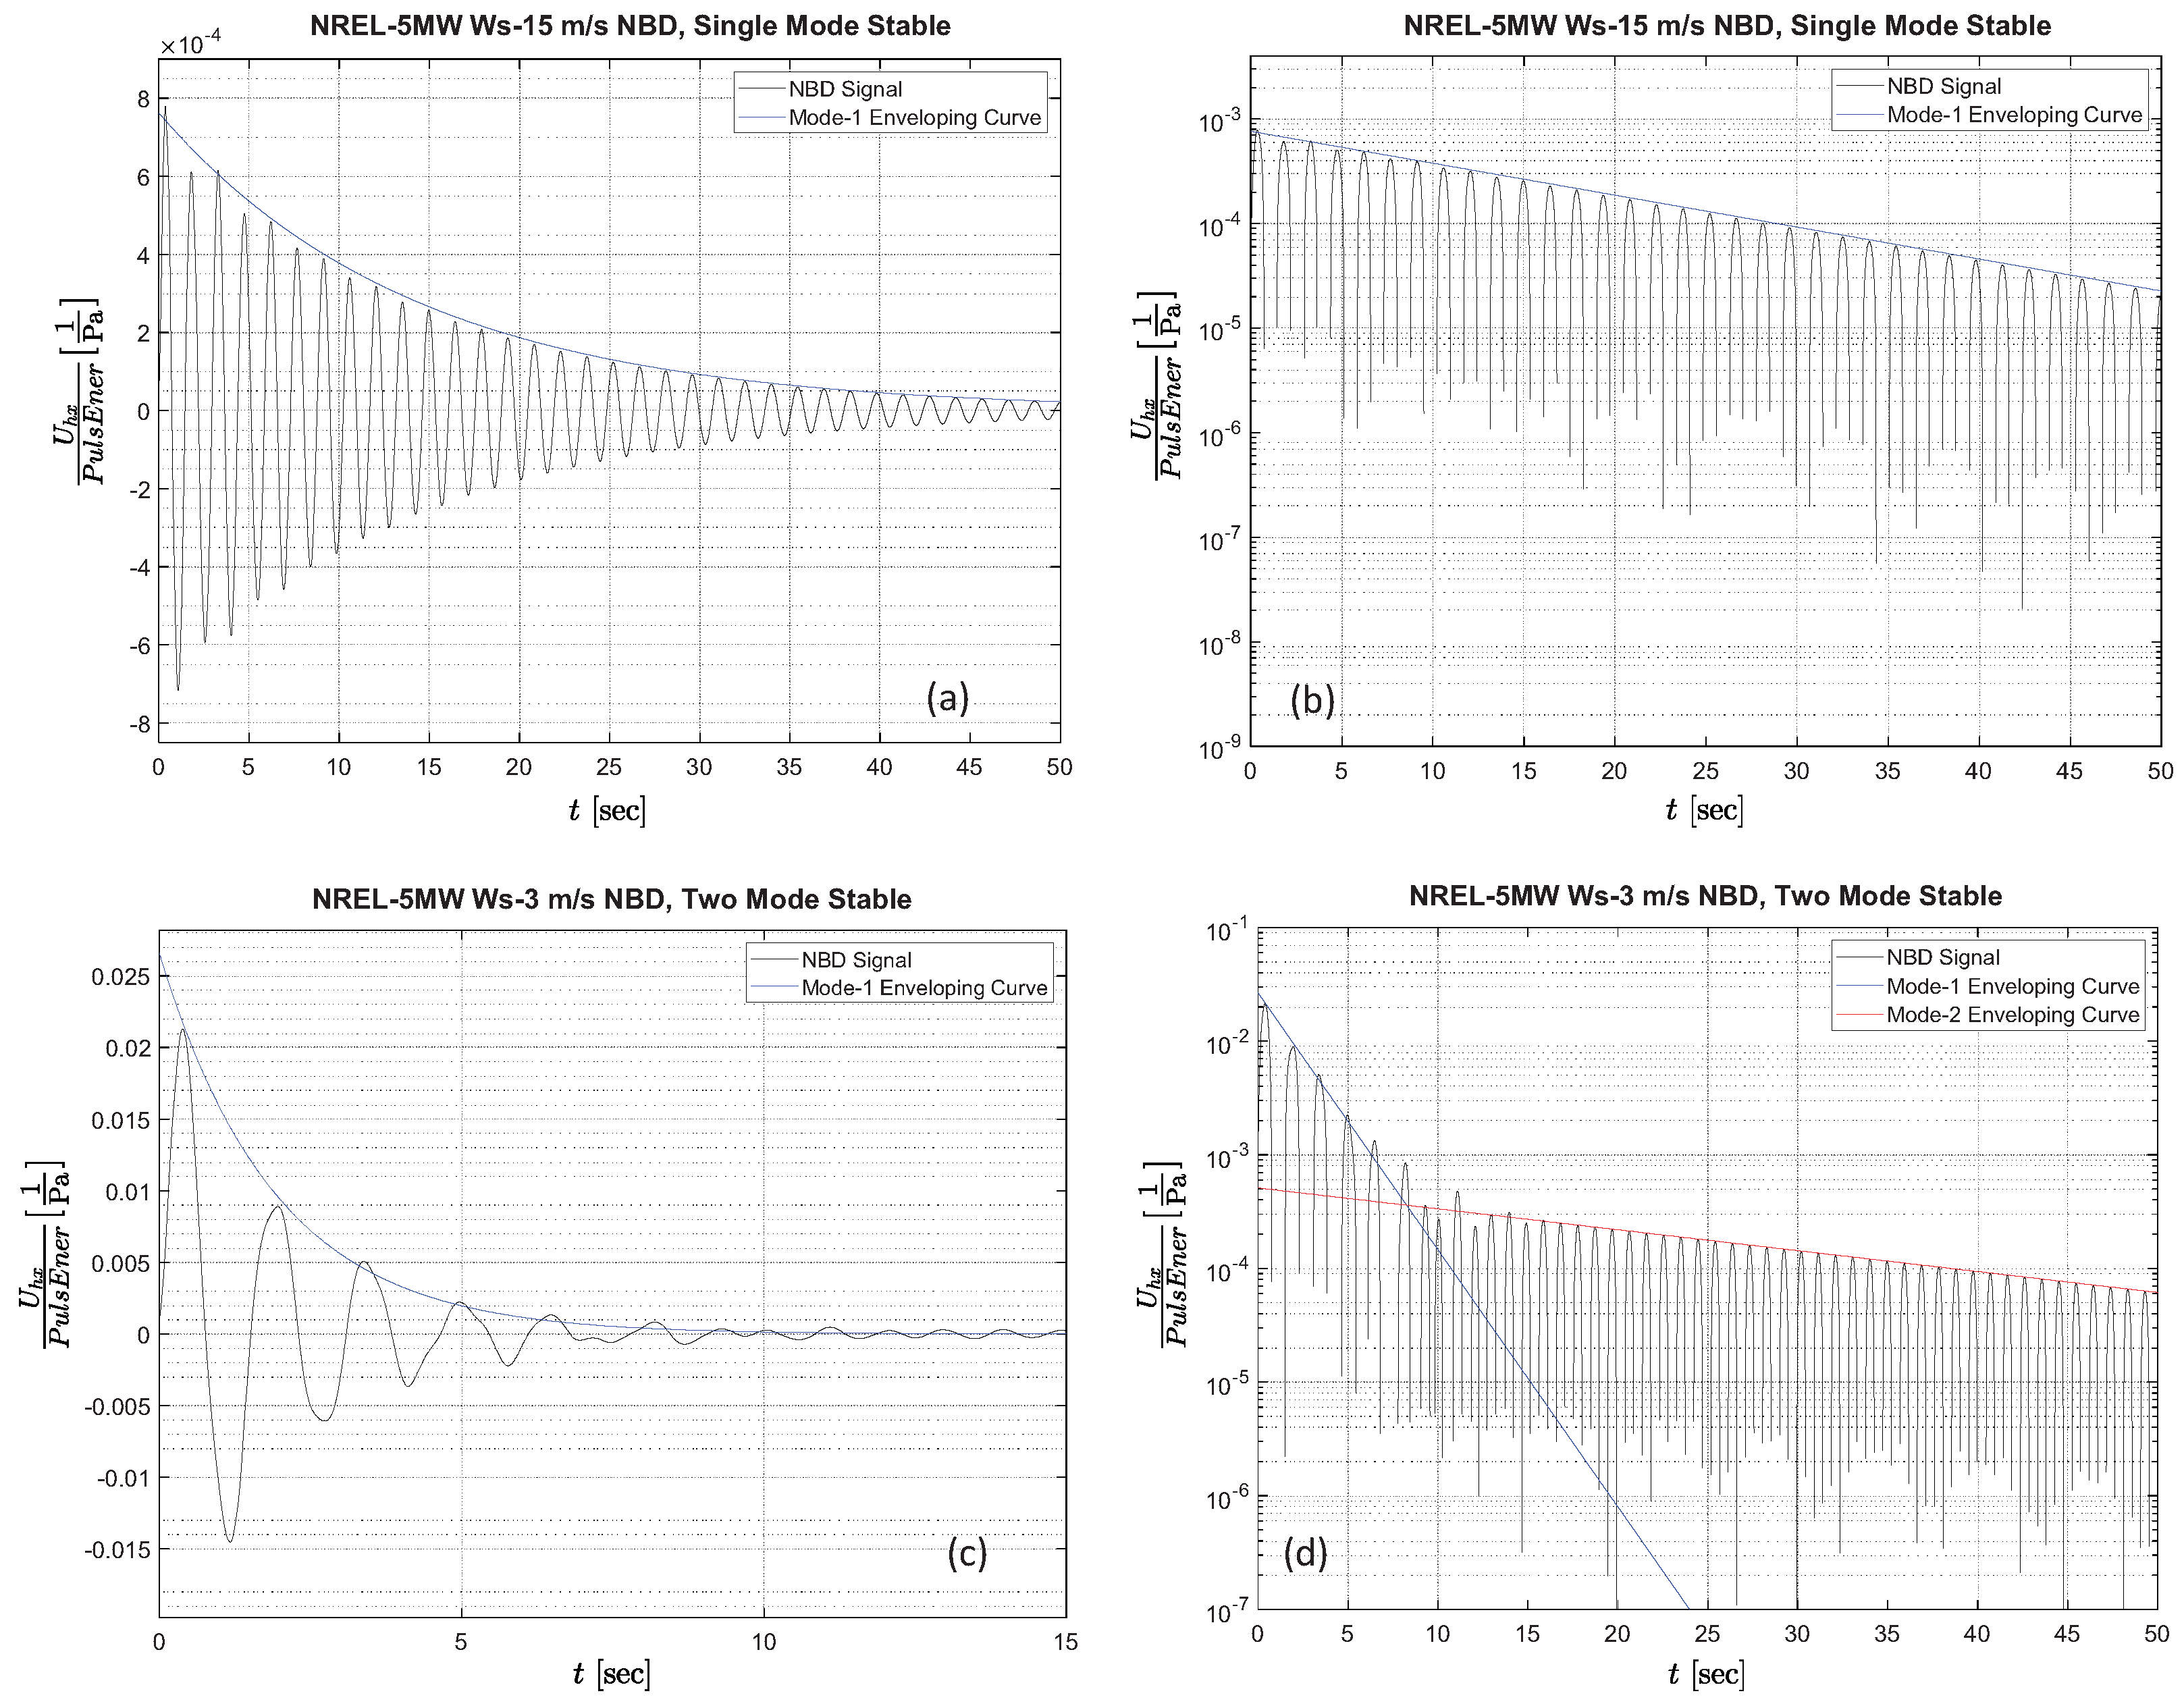
To further illustrate this point,
Figure 2 shows two selected examples of the typical oscillatory behavior of the blades of an NREL-5MW-RWT turbine excited by different gust pulses when operating within the aforementioned stable region. The first example, shown in
Figure 2a, shows the time evolution of the NBD for a case where the blades’ vibrational response is entirely dominated by the first flapwise mode of oscillation, Mode-1 exhibits a singular value of exponential decay,
on the entirety of its enveloping curve. The single-mode exponential nature of the oscillations decay can be readily observed in the semi-log plot of the same signal shown in
Figure 2b.
The other example of behavior that is frequently observed in the stable region is a two-mode decaying vibrational response, illustrated in
Figure 2c. The presence of a second oscillatory mode manifests itself visually as an alteration in the shape of the signal curve, which is clearly visible in several of the initial oscillatory cycles. The second mode of vibration, Mode-2, has the characteristic of being significantly less intense than the first one, but it also typically exhibits a lower rate of decay,
, which makes “residual” Mode-2 vibrations slower to dissipate and thus more persistent in the long term. The semi-log plot of this two-mode signal shown in
Figure 2d allows us to observe this combined interplay between the two modes, their relative contribution to the total vibrational energy, and their respective rates of decay.
Figure 2d also illustrates an additional aspect occasionally appearing during the two-mode behavior, which is the presence of an even weaker third mode of oscillation, Mode-3. For the stable region, Mode-3 is found to be significantly lower than Mode-2, and it is only visible as a slight distortion in the signal localized around the time range where the two straight lines depicting the enveloping curves of Mode-1 and Mode-2 intersect in the semi-log plot in
Figure 2d.
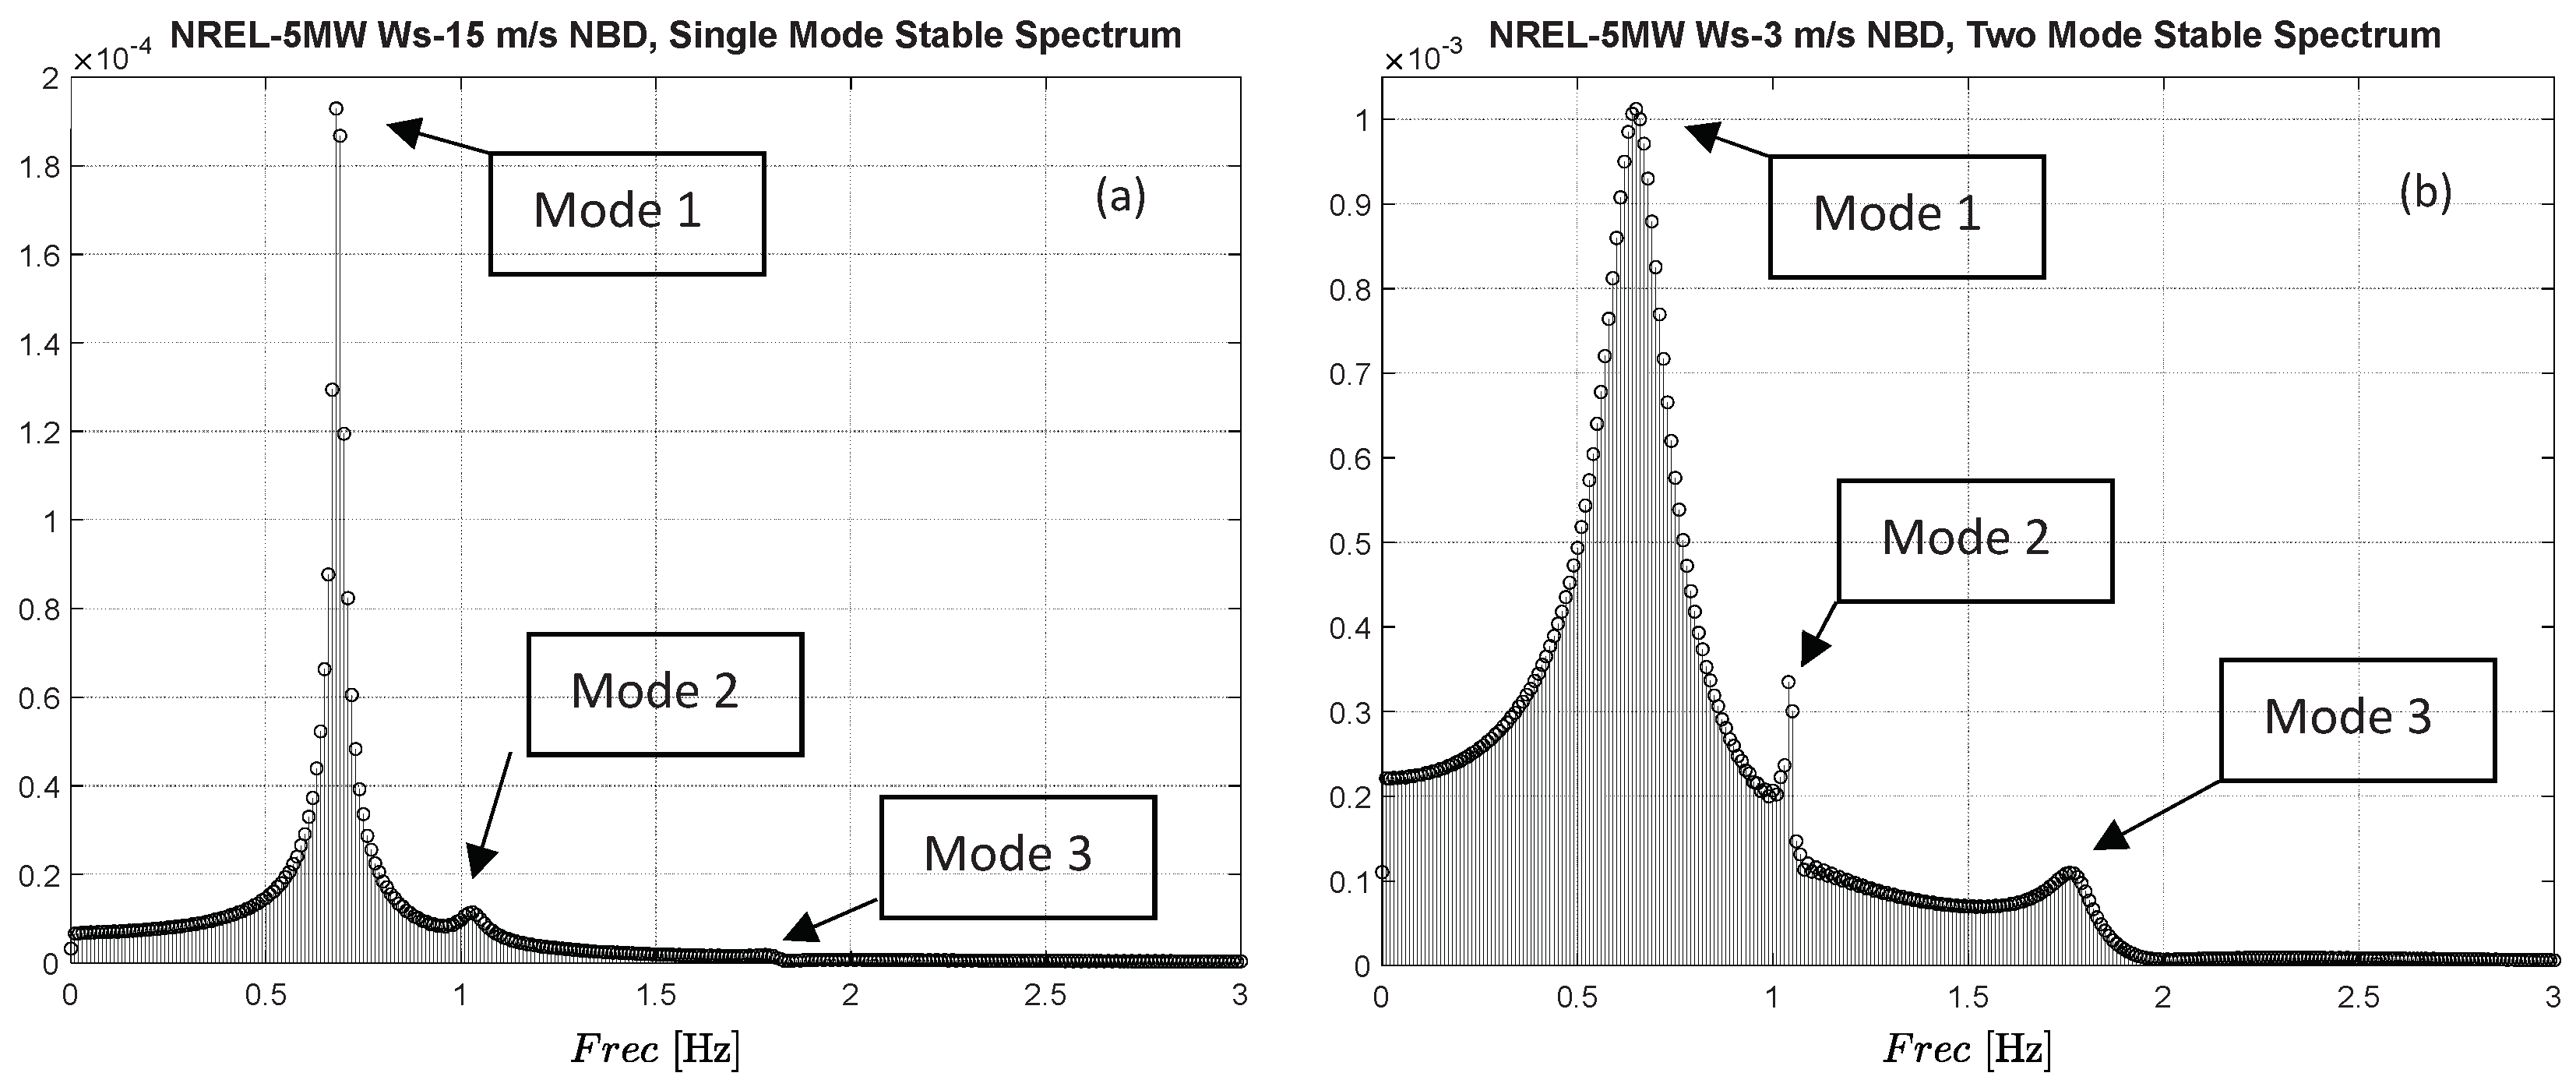
The relative intensity of the three oscillatory modes could be better illustrated by observing the respective spectra of the single-mode oscillatory signal, shown in
Figure 3a, and the two-mode signal shown in
Figure 3b. For the case of the NREL-5MW-RWT, Mode-1 has a characteristic frequency,
, around 0.65 Hz, while Mode-2 and Mode-3 have frequencies of 1.05 Hz and 1.76 Hz, respectively.
The presence of these three modes of oscillation characteristically observed in the stable region was first reported by the authors in Jalal et al. [
1] and further confirmed in Ponta et al. [
2]. These two works, together with the present one, involved a long series of numerical experiments covering a wide range of combinations of several turbines of different sizes, structural constructions, and aerodynamic shape designs, evaluated under multiple operational conditions in terms of wind speed, rotational regimes, and blade pitch angles for the cases of pitch-controlled turbines (these tests also included a stall-controlled turbine reported in Jalal et al. [
1]).
In all of these studies, the behavior observed confirmed the fact that, in the stable region, Mode-1 is dominant, even in the presence of Mode-2 and Mode-3. This supports the validity of using the single-mode ROC technique as a way of predicting the dominant aspects of the vibrational dynamics of wind turbine rotors when they operate in that stable region. The search for a generalized non-dimensional characterization applicable to turbines of different sizes is the main objective of the present work, which will be covered in the next section.
Later in this paper, other regimes of operation, where unstable behavior is observed (and where the relative dominance of the several modes varies), will be briefly discussed, together with some relevant observations about the shape and location of the boundaries between the stable and unstable regimes.
4. Generalization of the ROC Technique to Turbines of Multiple Sizes
A new piece of knowledge regarding ROC, reported by the authors in Ponta et al. [
2] as an outlook for further work, is related to the fact that the NBD signals of turbines of different sizes, sharing a similar aerodynamic geometry and internal structural construction, seem to collapse into one curve when the time base of their oscillatory response is scaled by the relative length of their blades.
The notion of using the bade length as a scaling factor comes from the fact that, from a structural point of view, a wind turbine blade is essentially a cantilever beam. Even though it is more complex than a simple prismatic beam, the period of the first flapwise mode of the blade’s basic vibrational response, Model-1, still scales with the length of the “beam”, in the same manner as a classical prismatic beam of homogeneous material. That means that, in the context of reduced single-order characterization, the frequency vibrational response of the blade could be generalized to similar blades of multiple sizes.
Moreover, as the initial test in Ponta et al. [
2] revealed, not only did the frequency of Mode-1,
scale with the inverse of the blade length, but also the magnitude of the exponential decay of Mode-1 oscillations,
. This discovery was significant, because it goes beyond just the physics associated with the structural response. It means that the amount of aerodynamic damping that is induced by the vibrational response, which is the cause of the oscillatory decay, also scales with blade length, even though it is a more complex phenomenon of aero-elasto-inertial nature and not just structural in origin.
In a sense, this observation opened the door for extending the ROC technique into a universal simple formula that is capable of characterizing rotor stability and predicting the speed at which oscillations induced by any combination of wind gust-pulses are dissipated. This formula, if properly defined, could be applicable to turbines of any size that share the same conceptual design.
In the Ponta et al. [
2] study, the SNL-NRT turbine and an up-scaled variant 10 times larger were subjected to similar pulse stimuli. The SNL-NRT is a lightweight test turbine of advanced design 27 m in diameter, intended to replace one of the instrumented Vestas V27 rotors originally employed in SNL’s SWiFT wind-farm evaluation facility.
The reason why a factor of 10 was selected for the aforementioned up-scaled test reported in Ponta et al. [
2] was that it gave a diameter of of 270 m for the up-scaled rotor, which is approximately on the order of the state-of-the-art commercial wind turbines currently offered in the market by manufacturers or planned for the near future. This gave the test a more realistic representation of actual commercial turbines.
In Ponta et al. [
2], the timespan of the pulses was also scaled by a factor of 10; that is, the relative proportion between the blade lengths. By applying a gust pulse scaled by the same factor as the blade’s period for the Mode-1 response, the pulses are “perceived” by the blades in a similar manner versus their bending time of reaction. Hence, pulses for the two turbines of different sizes belong to the same short-pulse category previously discussed in
Section 3.
In the present work, we decided to use the NREL-5MW-RWT rotor as the starting point of our study, and we proceeded to scale it down by a factor of 0.5 and up by a factor of 2. In addition to being a well-known benchmark turbine, the NREL-5MW-RWT (here referred to as the NREL-5MW) has a rotor of 126 m in diameter and a nominal output power of 5 MW. These characteristics put it in the middle of the spectrum of the power and size of turbines currently installed in wind farms globally. By using the scaling factors of ×0.5 and ×2, the rotors obtained have diameters of 63 m and 252 m, with nominal powers of 1.25 MW and 20 MW, respectively. These two rotors represent, closely, the ends of the spectrum of power and size of most turbines currently installed, giving the current study a realistic representation of the actual turbines currently in operation. These scaled variations of the NREL-5MW will be referred to as the NREL-1.25MW and the NREL-20MW, respectively.
In the present study, a long series of tests was conducted, involving various combinations of pulses of different amplitudes (Amp) and timespans (Tsp), applied to several background wind speeds in the range from 3 m/s to 25 m/s, which constitutes the designed operational range of the NREL-5MW and also represents the typical operational range of contemporary wind turbines. The NREL-5MW is a pitch-controlled turbine, and a sample of several pitch angles has also been tested. In order to preserve clarity in the graphical representation of oscillatory response signals, a sub-sample of representative pulses has been selected for the following figures. These pulses are described by the following key:
05P02: Amp 0.5 m/s—Tsp 0.2 s
05P01: Amp 0.5 m/s—Tsp 0.1 s
025P02: Amp 0.25 m/s—Tsp 0.2 s
025P01: Amp 0.25 m/s—Tsp 0.1 s
05P04: Amp 0.5 m/s—Tsp 0.4 s
1P02: Amp 1.0 m/s—Tsp 0.2 s
1P04: Amp 1.0 m/s—Tsp 0.4 s
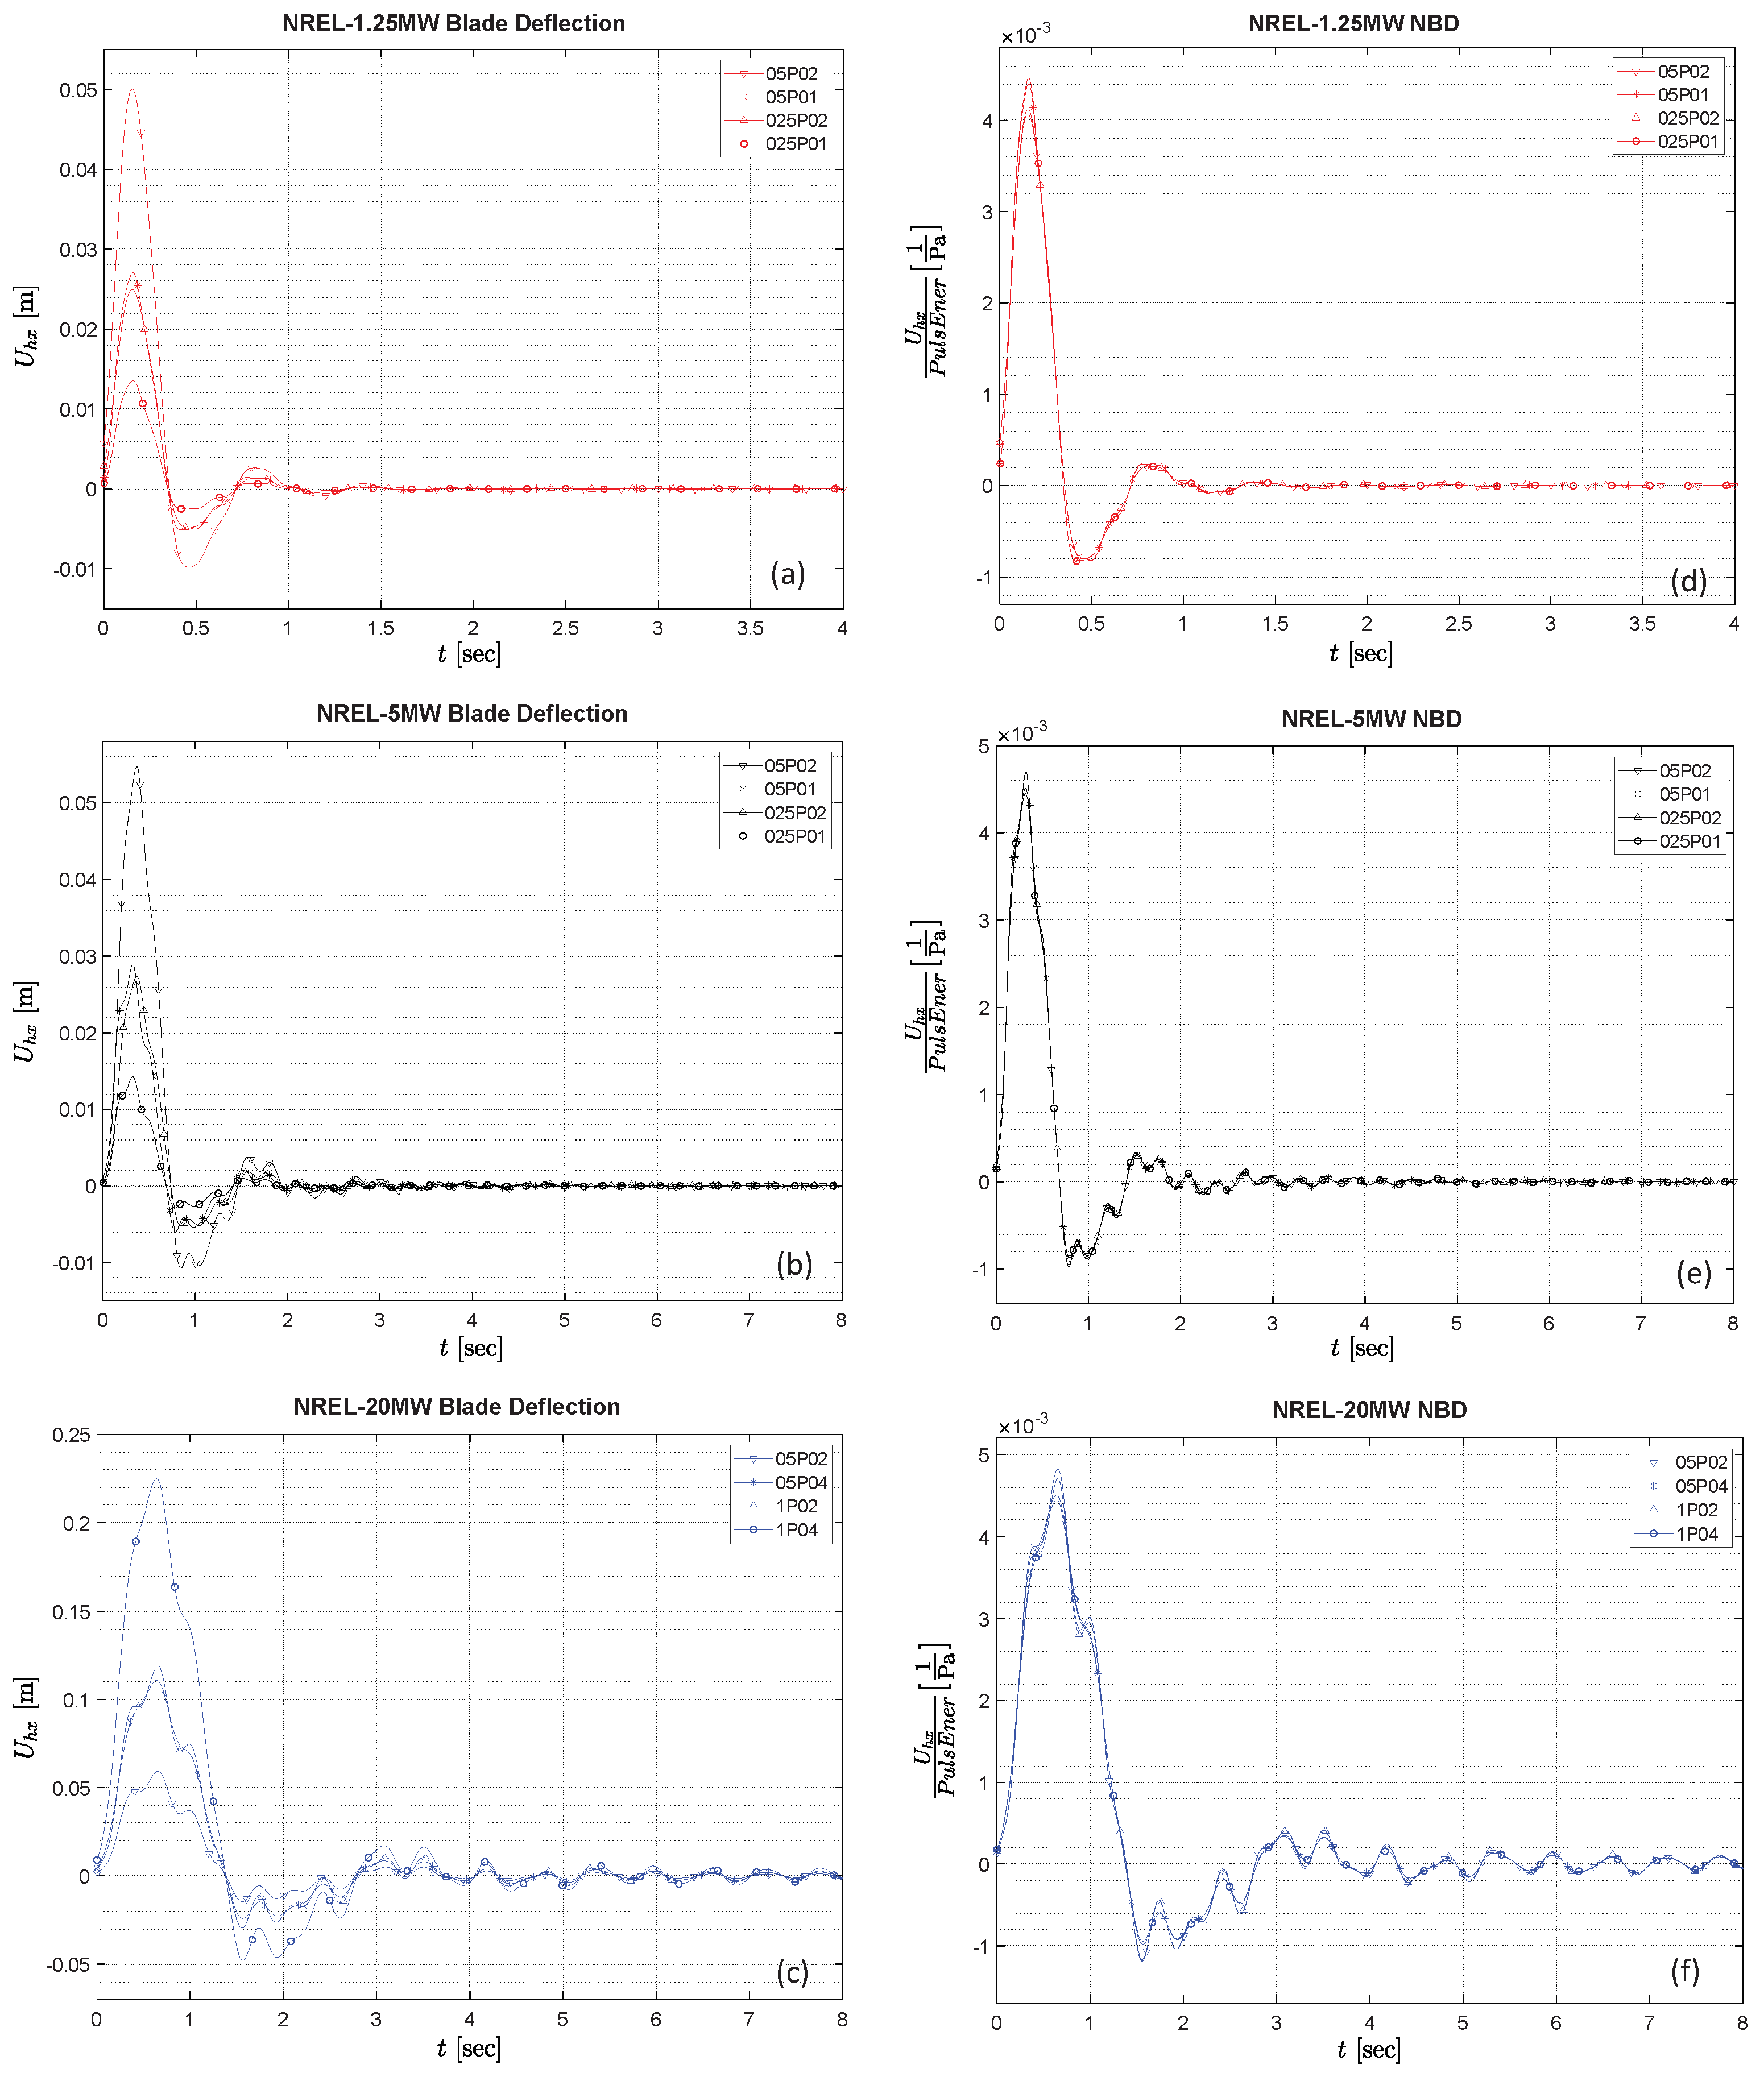
The first series of numerical tests that will be discussed were performed by applying controlled gust pulses to the three size variations of the NREL-5MW-RWT rotor, namely the NREL-1.25MW, the NREL-5MW, and the NREL-20MW. This initial set of tests followed the pattern of the energy-based ROC technique previously discussed, in that gust pulses of the short variety were applied onto an otherwise steady wind stream at several values of wind speed covering the entire operational range of the NREL-5MW design at TSR values in the stable region (i.e., cases that give decaying oscillatory vibrations).
Figure 4 shows the oscillatory response for an example of these tests, conducted at a wind speed Ws = 11.4 m/s, a TSR = 7, and pitch = 0°, which corresponds to the rated operational parameters of the NREL-5MW design.
Figure 4a–c show the time evolution of the axial blade deflection for the NREL-1.25MW, the NREL-5MW, and the NREL-20MW cases, respectively. These plots are paired with their associated energy-normalized NBD signals shown in
Figure 4d–f, respectively.
The collapse of the signals for different pulses observed in these tests therefore verify that the NREL-5MW, as well as its up-scaled and down-scaled versions, does act in accordance with the energy-based normalization based on ROC. As previously mentioned, one of the findings reported by Ponta et al. [
2] for the preliminary test was that
, the period of Mode-1 (i.e., the dominant mode of the rotor’s oscillatory response), seemed to scale with blade length, as is the case for the bending oscillations of a prismatic cantilever beam. Hence, the next step in finding a universal characterization independent of size involved the scaling of the time axis of the response signals by using the relative blade length of the rotors as a normalization factor.
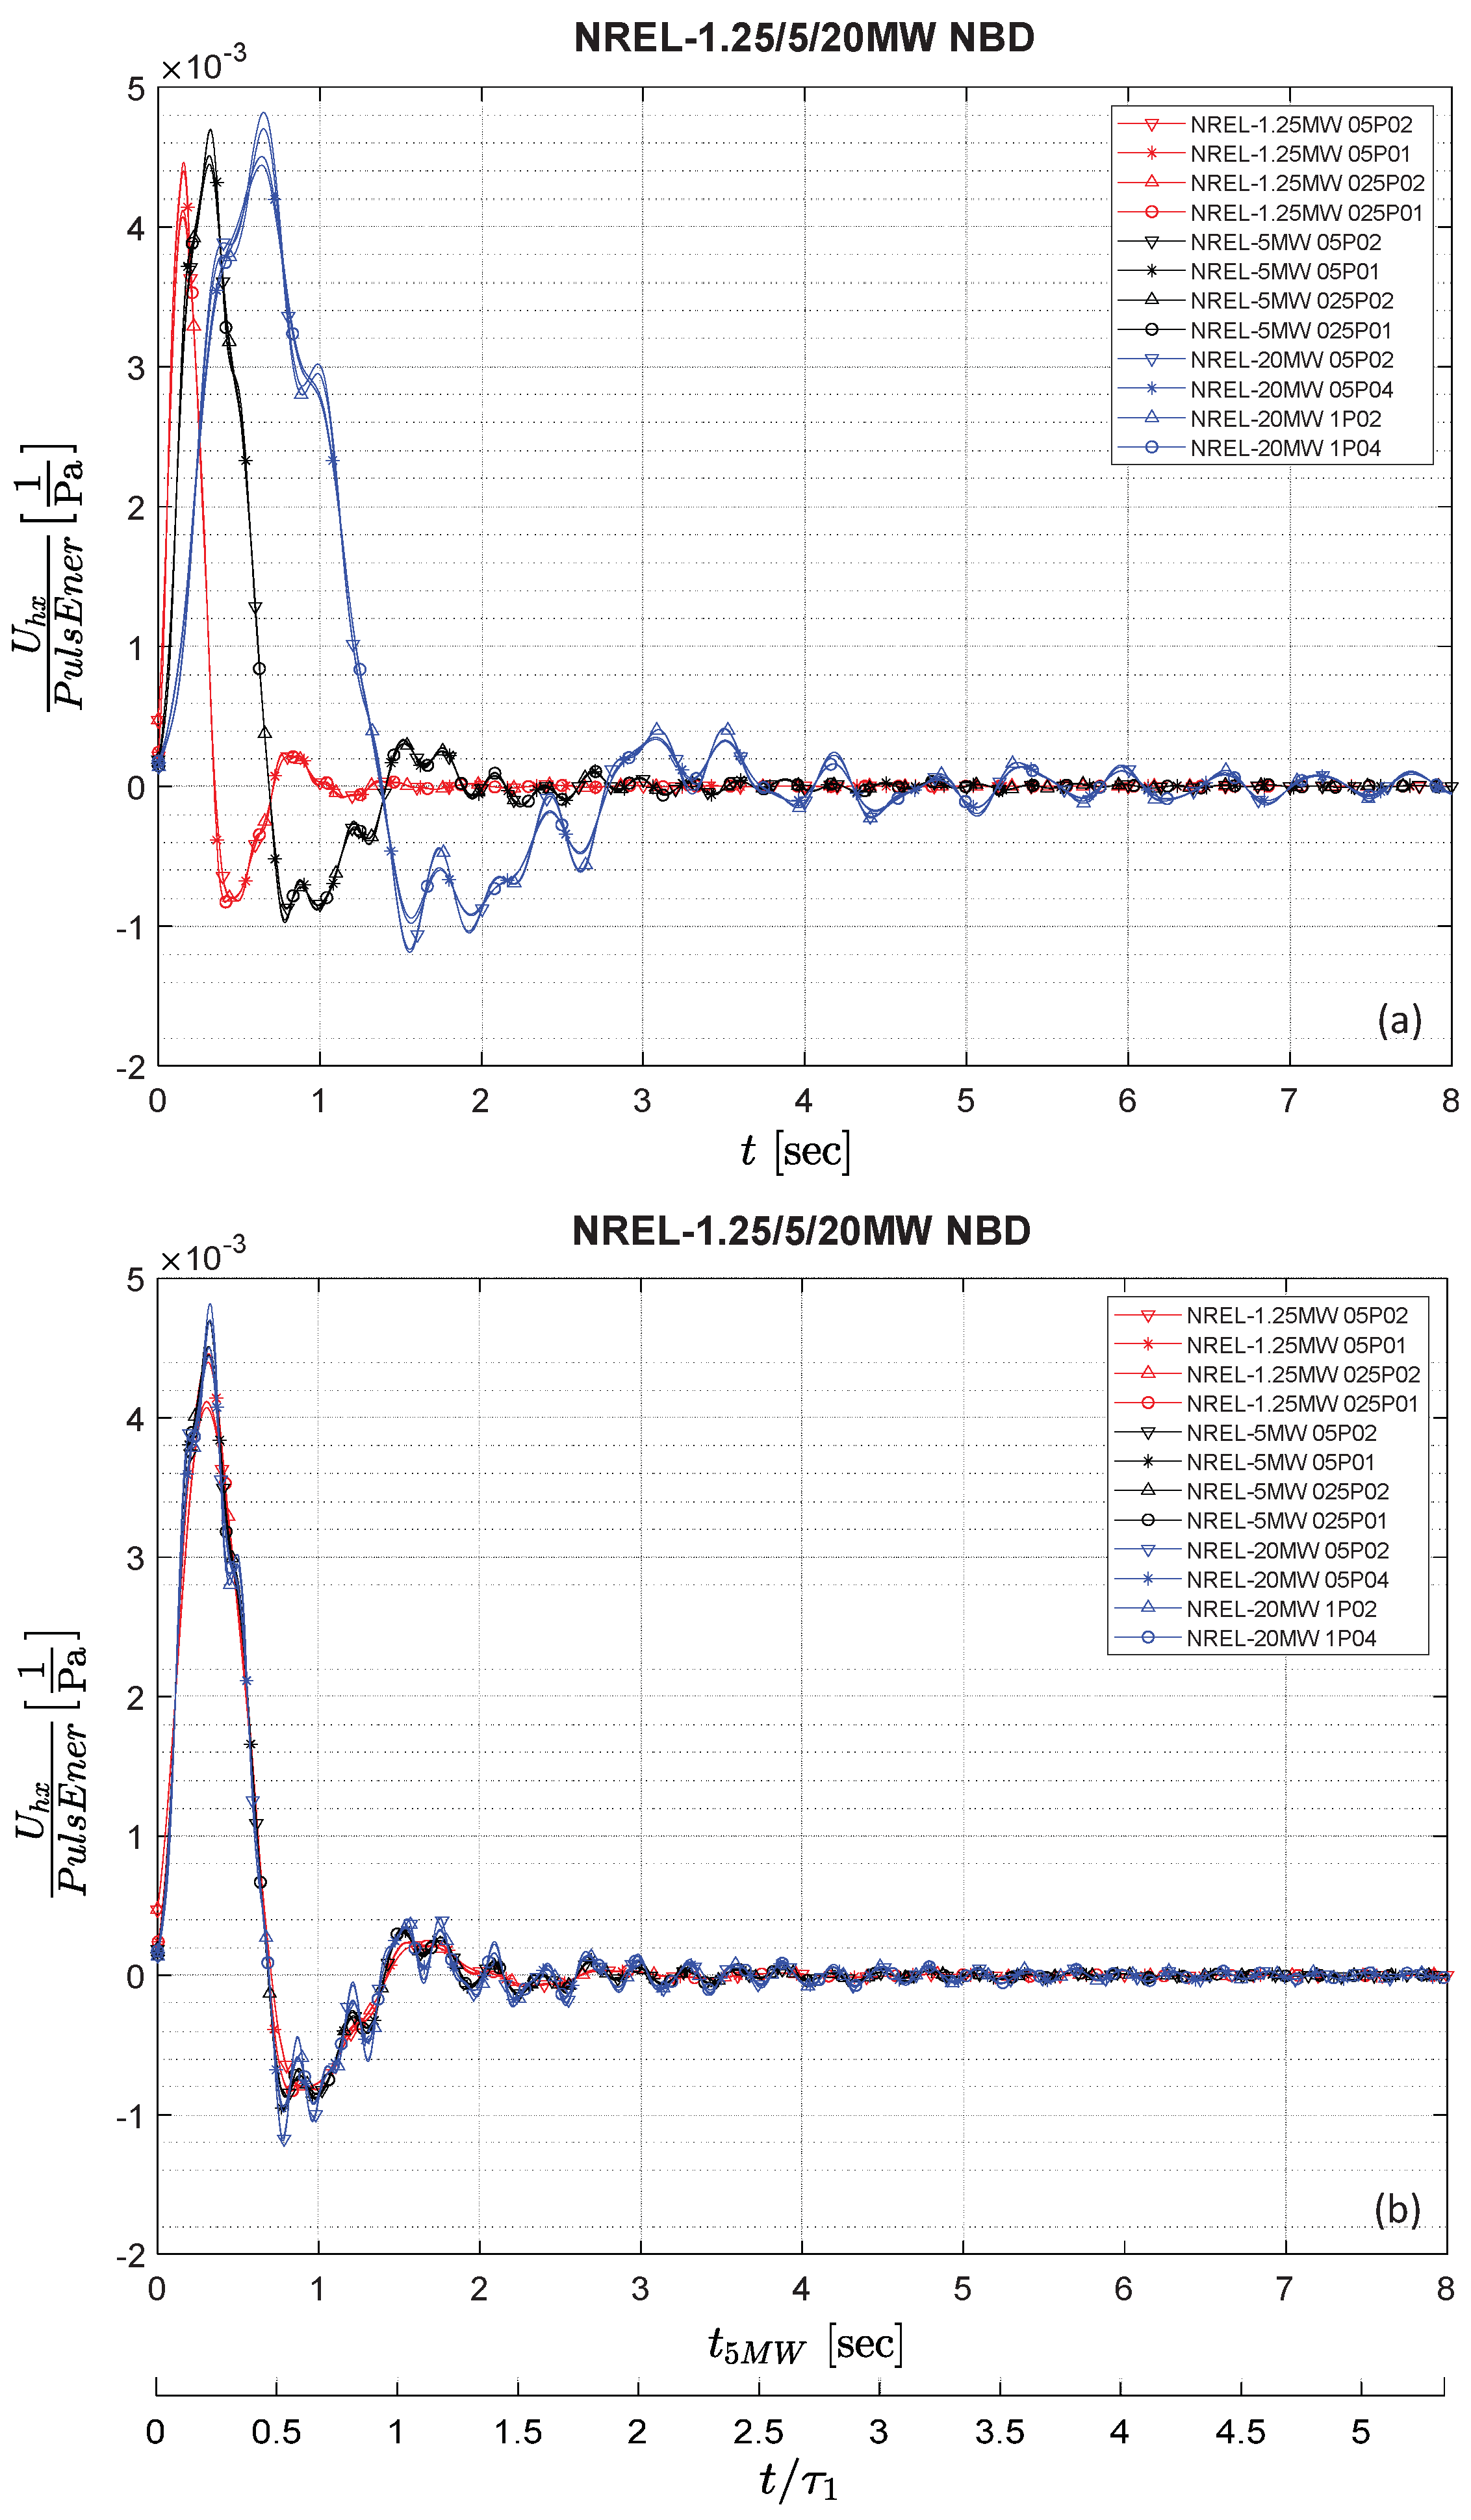
Figure 5 shows the results of applying the blade length-based scaling of the time axis of the all the NBD signals previously shown in
Figure 4, collapsing the signals for all the pulses and for all the rotor sizes. To illustrate this process, we first used the time base of the original NREL-5MW rotor,
, as a reference for the size-based time scaling of the other two turbines, then we translated this into a universal non-dimensional time base,
, by using the period of the first mode of oscillation of each rotor,
, as a normalization factor.
Figure 5a shows the gathering of all NBD signals before the time-scaling. This is followed by the depiction of the time-scaled signals in
Figure 5b plotted as a function of
. The latter plot also includes a parallel horizontal axis showing the non-dimensional time base,
.
The same collapse of all the NBD versus
signals, shown in
Figure 5, has also been observed for all the different combinations of operational conditions that have been tested across the oscillatory stable region. This points to universal validity of a time-scaled extended version of the ROC based on blade length. To further illustrate this point, a selected sample of results will be shown below.
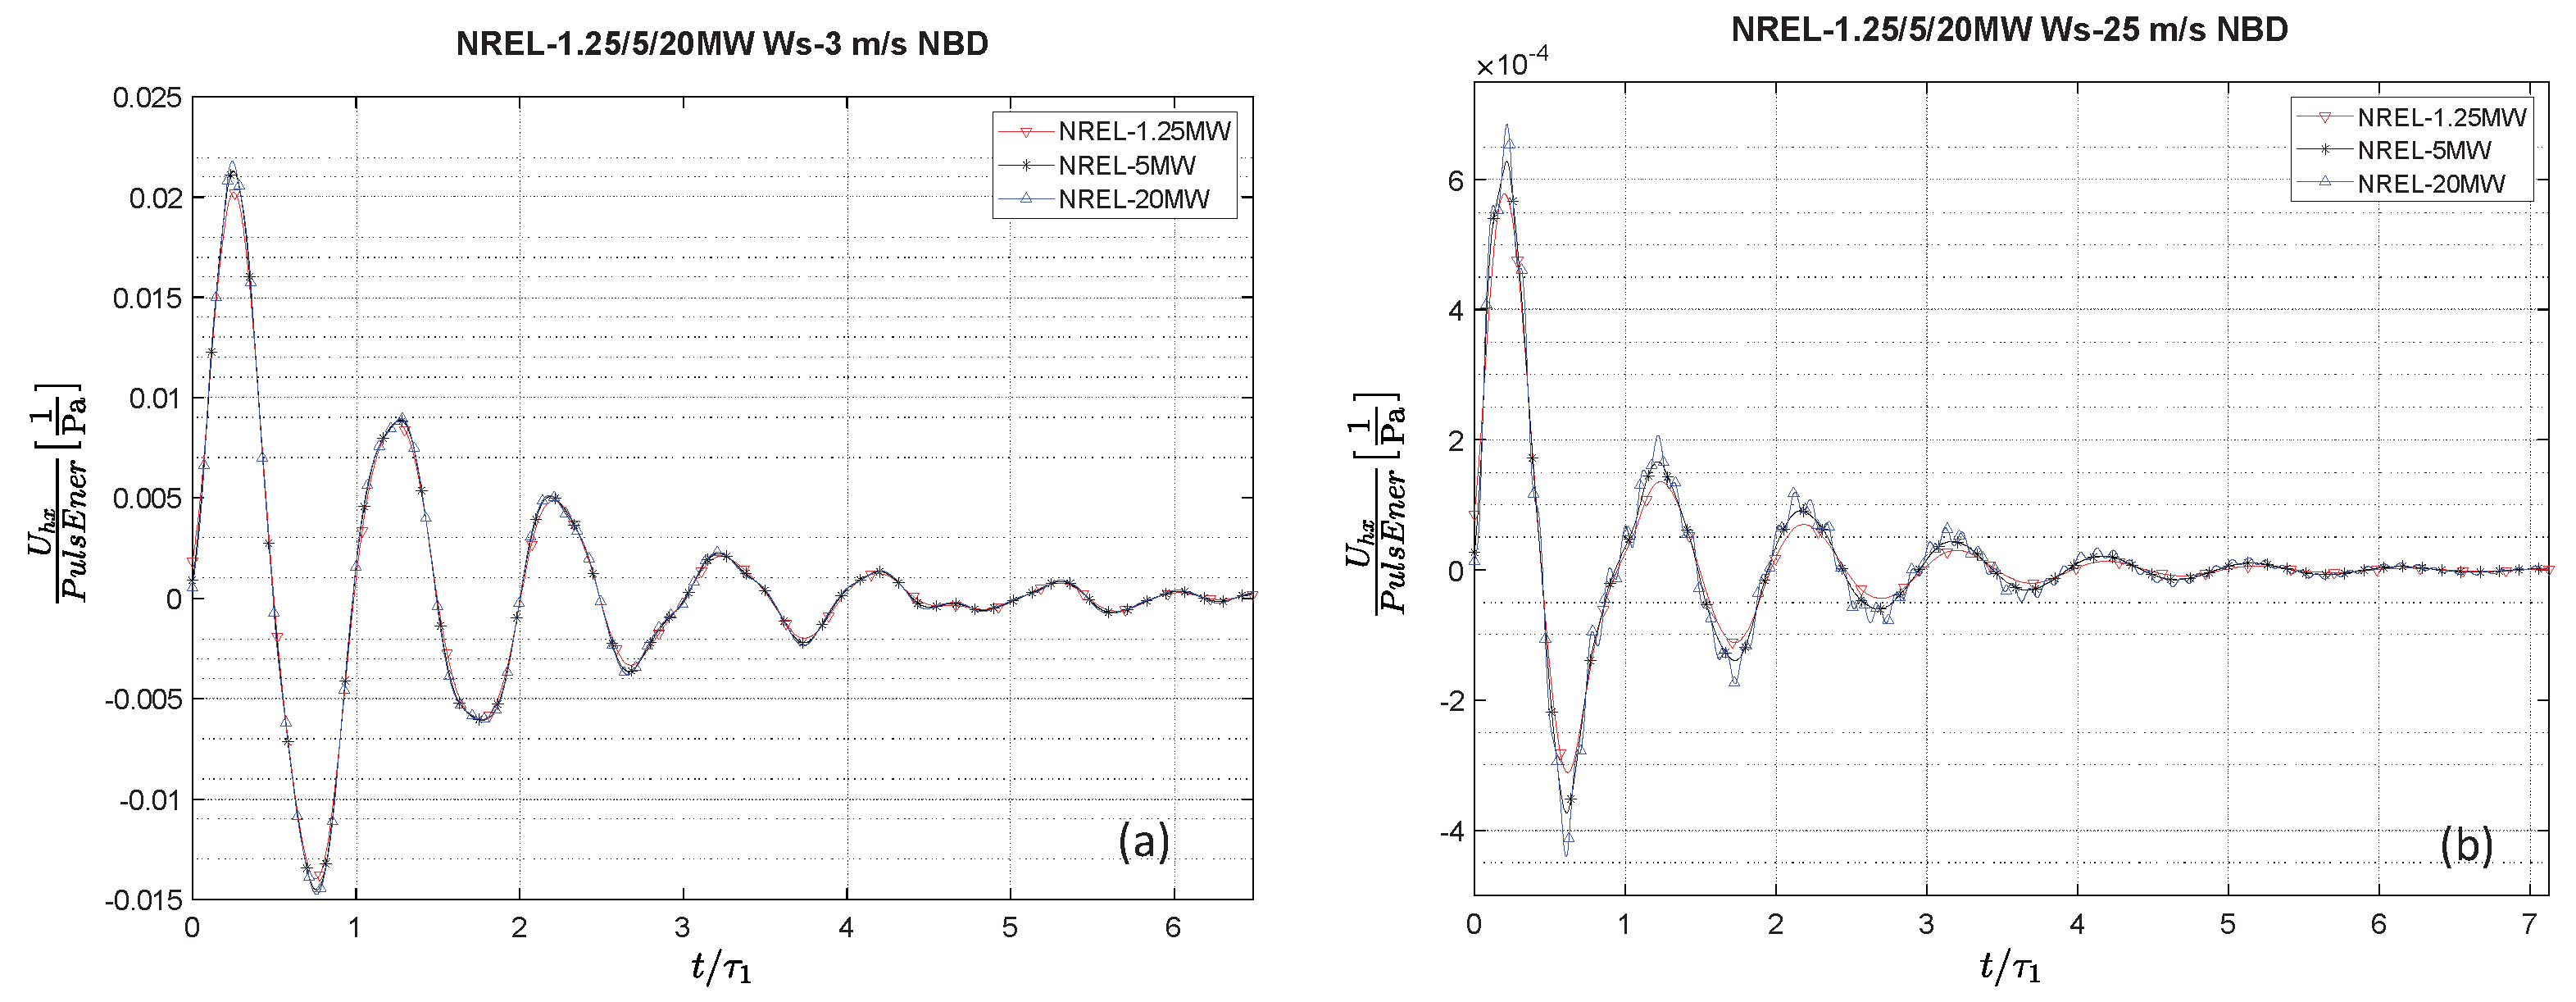
Figure 6 shows examples of NBD versus
signals for the NREL-1.25MW, the NREL-5MW, and the NREL-20MW turbines, tested at the two ends of the range of operational wind speeds of the NREL-5MW design.
Figure 6a shows an example with the three turbines operating at the cut-in Ws = 3 m/s, with a TSR = 7 and pitch = 0°, and
Figure 6b shows an example with the turbines operating at the cut-out Ws = 25 m/s, with a TSR = 4 and pitch = 0°.
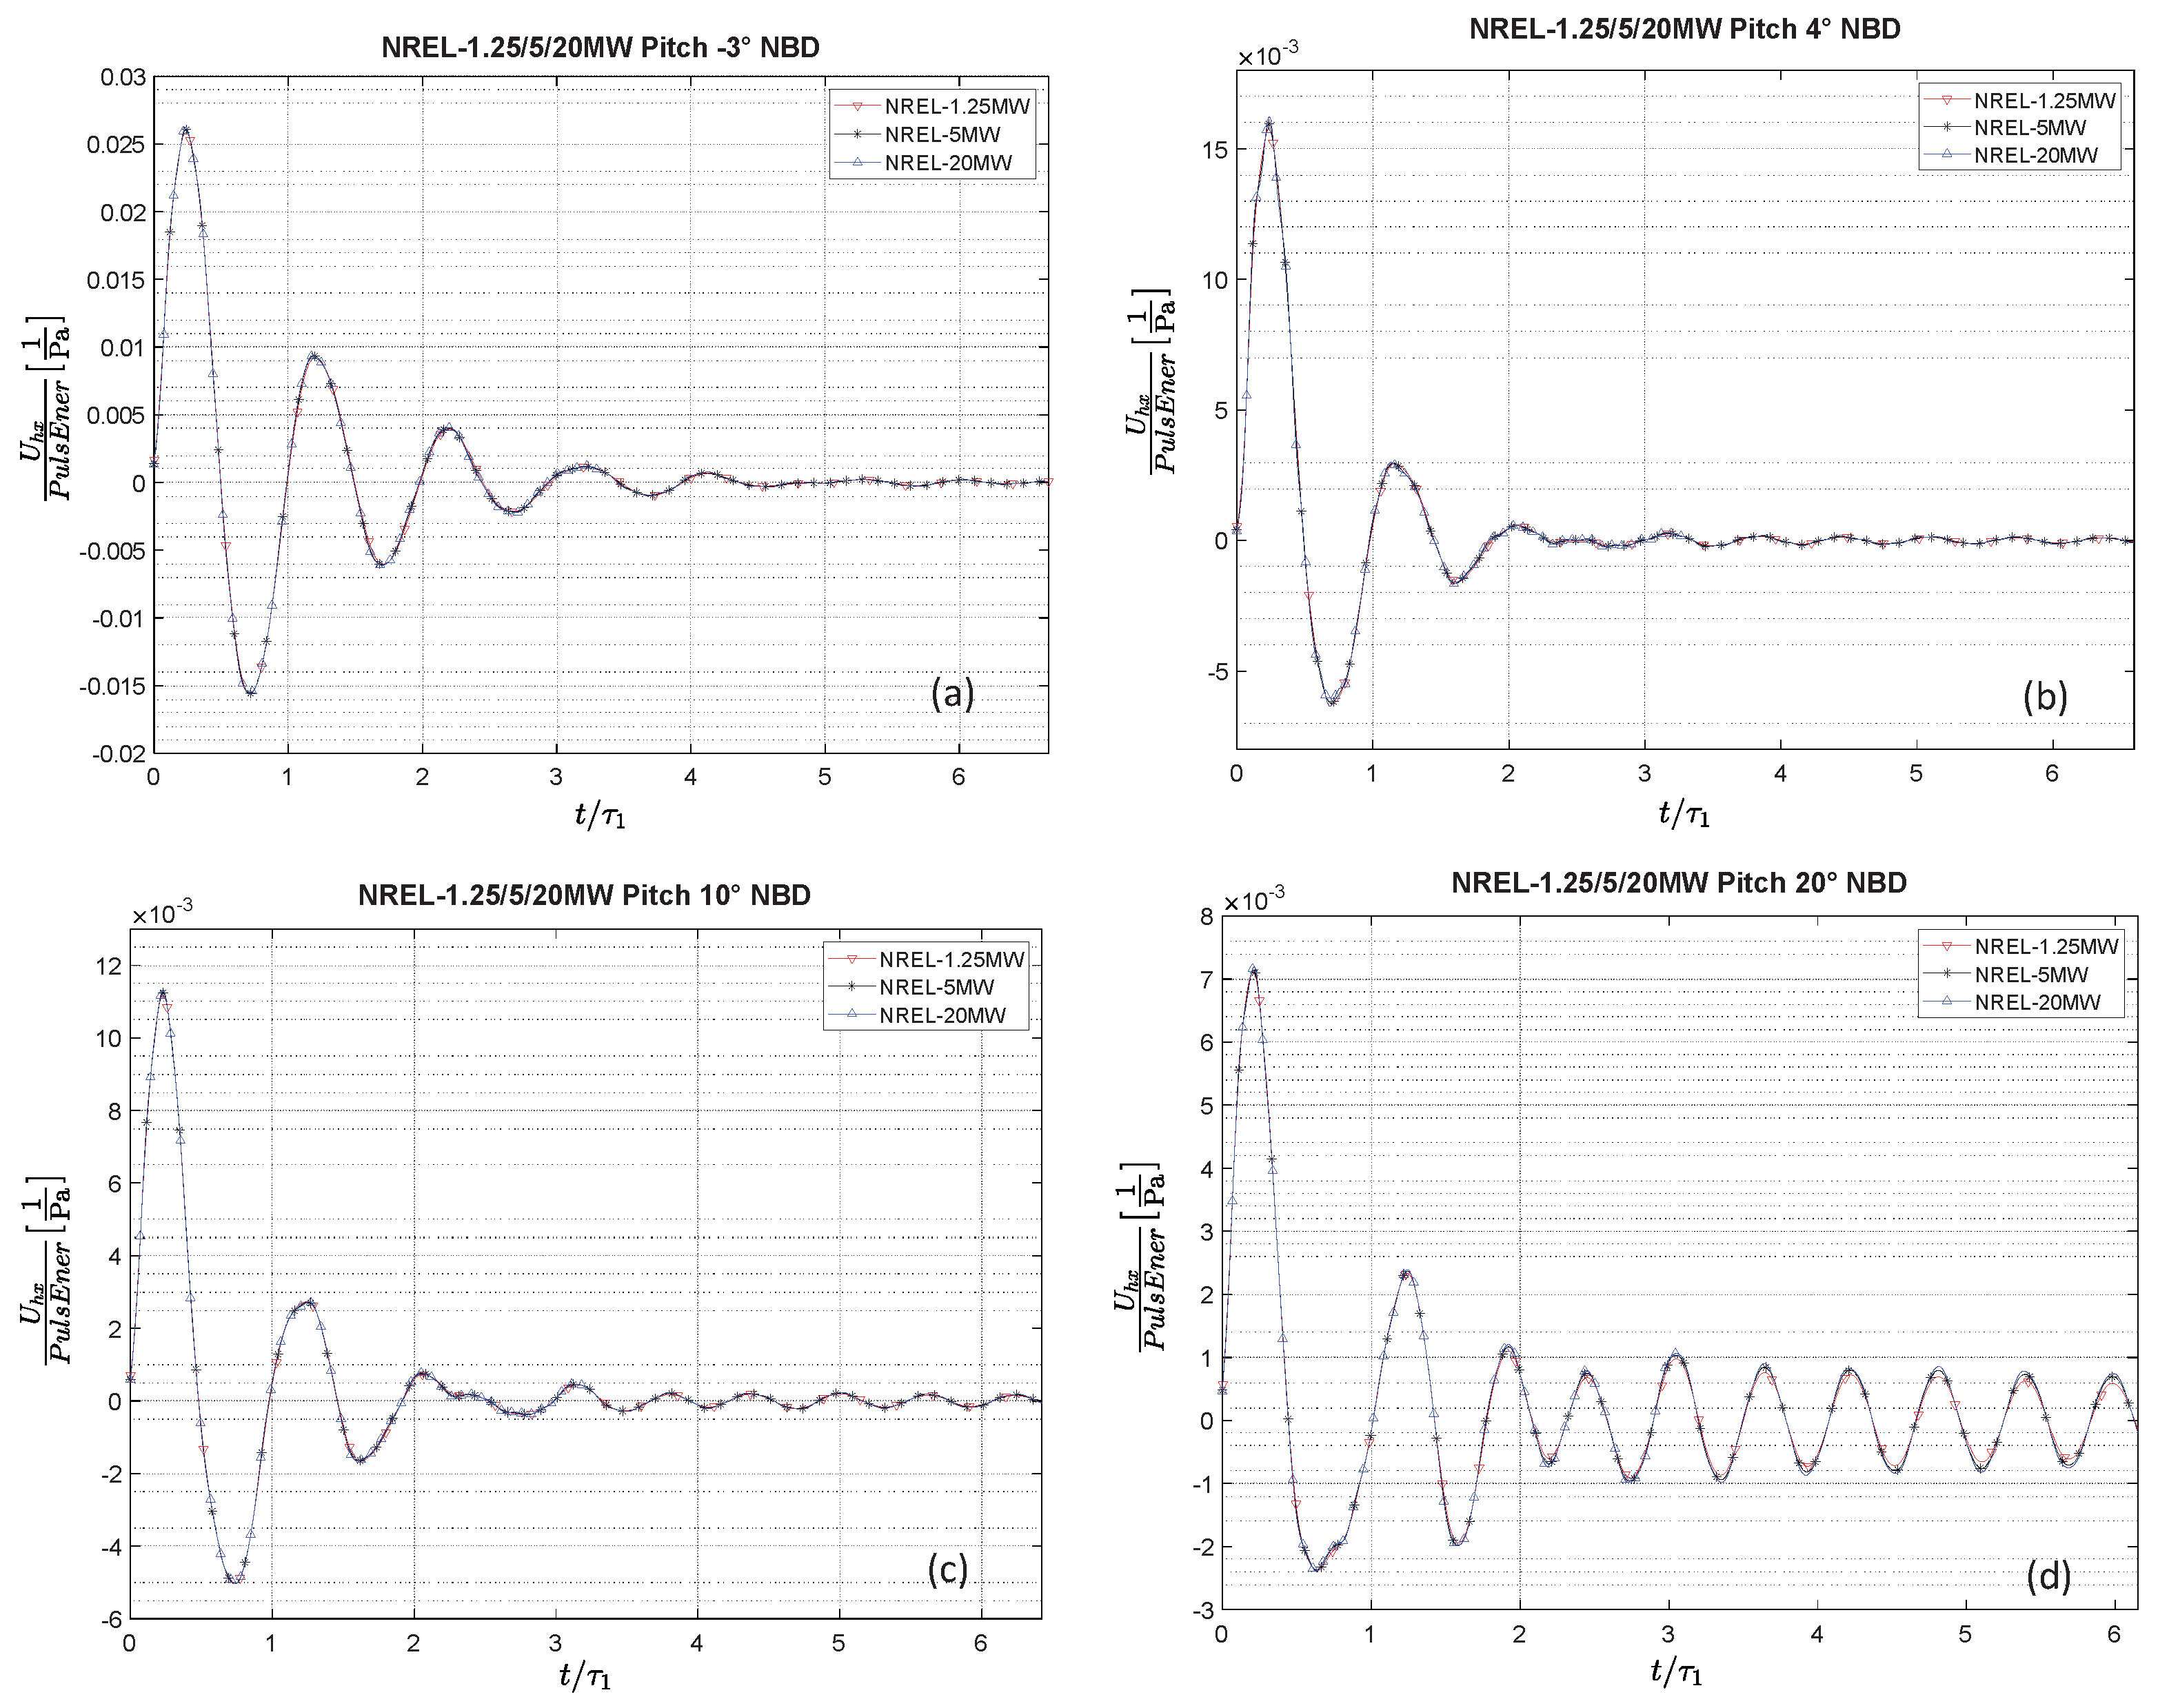
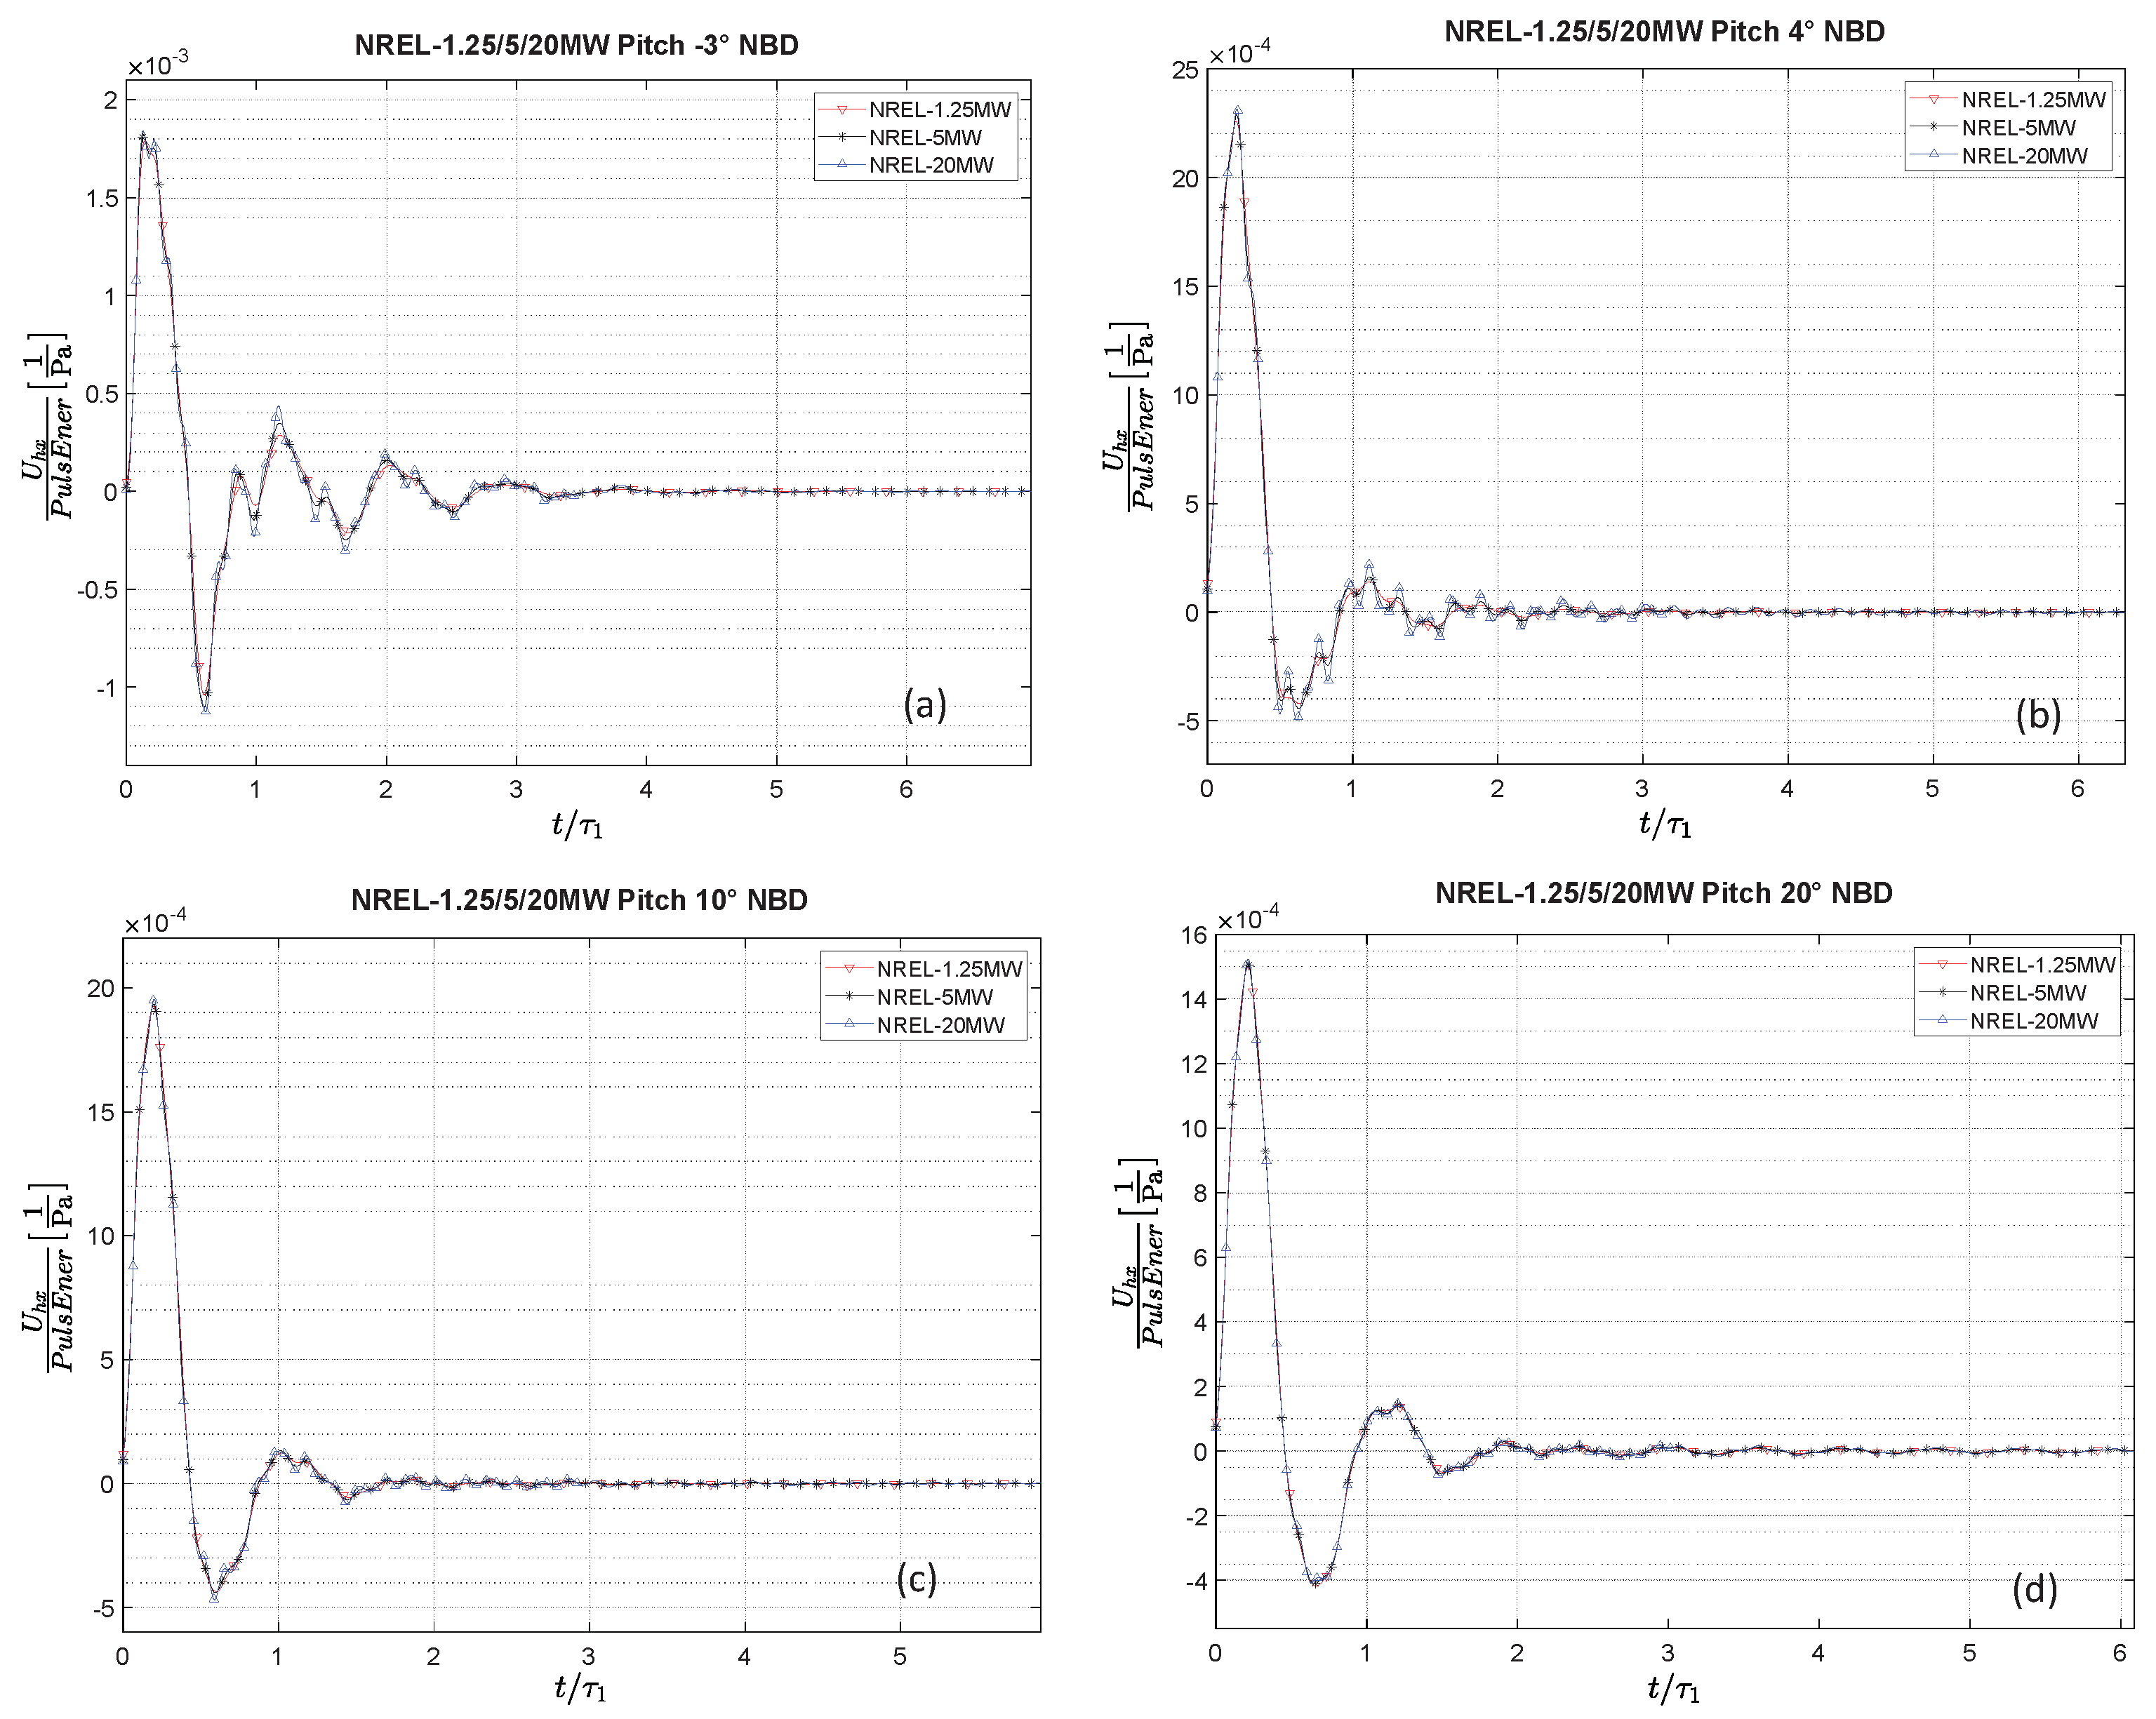
In order to cover several other potential situations of control strategies combining rotor control parameters in a different way, cases with several blade-pitch angles of actuation have also been tested, augmenting the pitch = 0° cases shown before.
Figure 7 shows a variety of examples of the collapsed NBD versus
signals for the NREL-1.25MW, the NREL-5MW, and the NREL-20MW turbines, tested at a Ws = 5.0 m/s.
Figure 7a shows the case of pitch = −3° and TSR = 10,
Figure 7b the case of pitch = 4° and TSR = 10,
Figure 7c the case of pitch = 10° and TSR = 8, and
Figure 7d the case of pitch = 20° and TSR = 8.
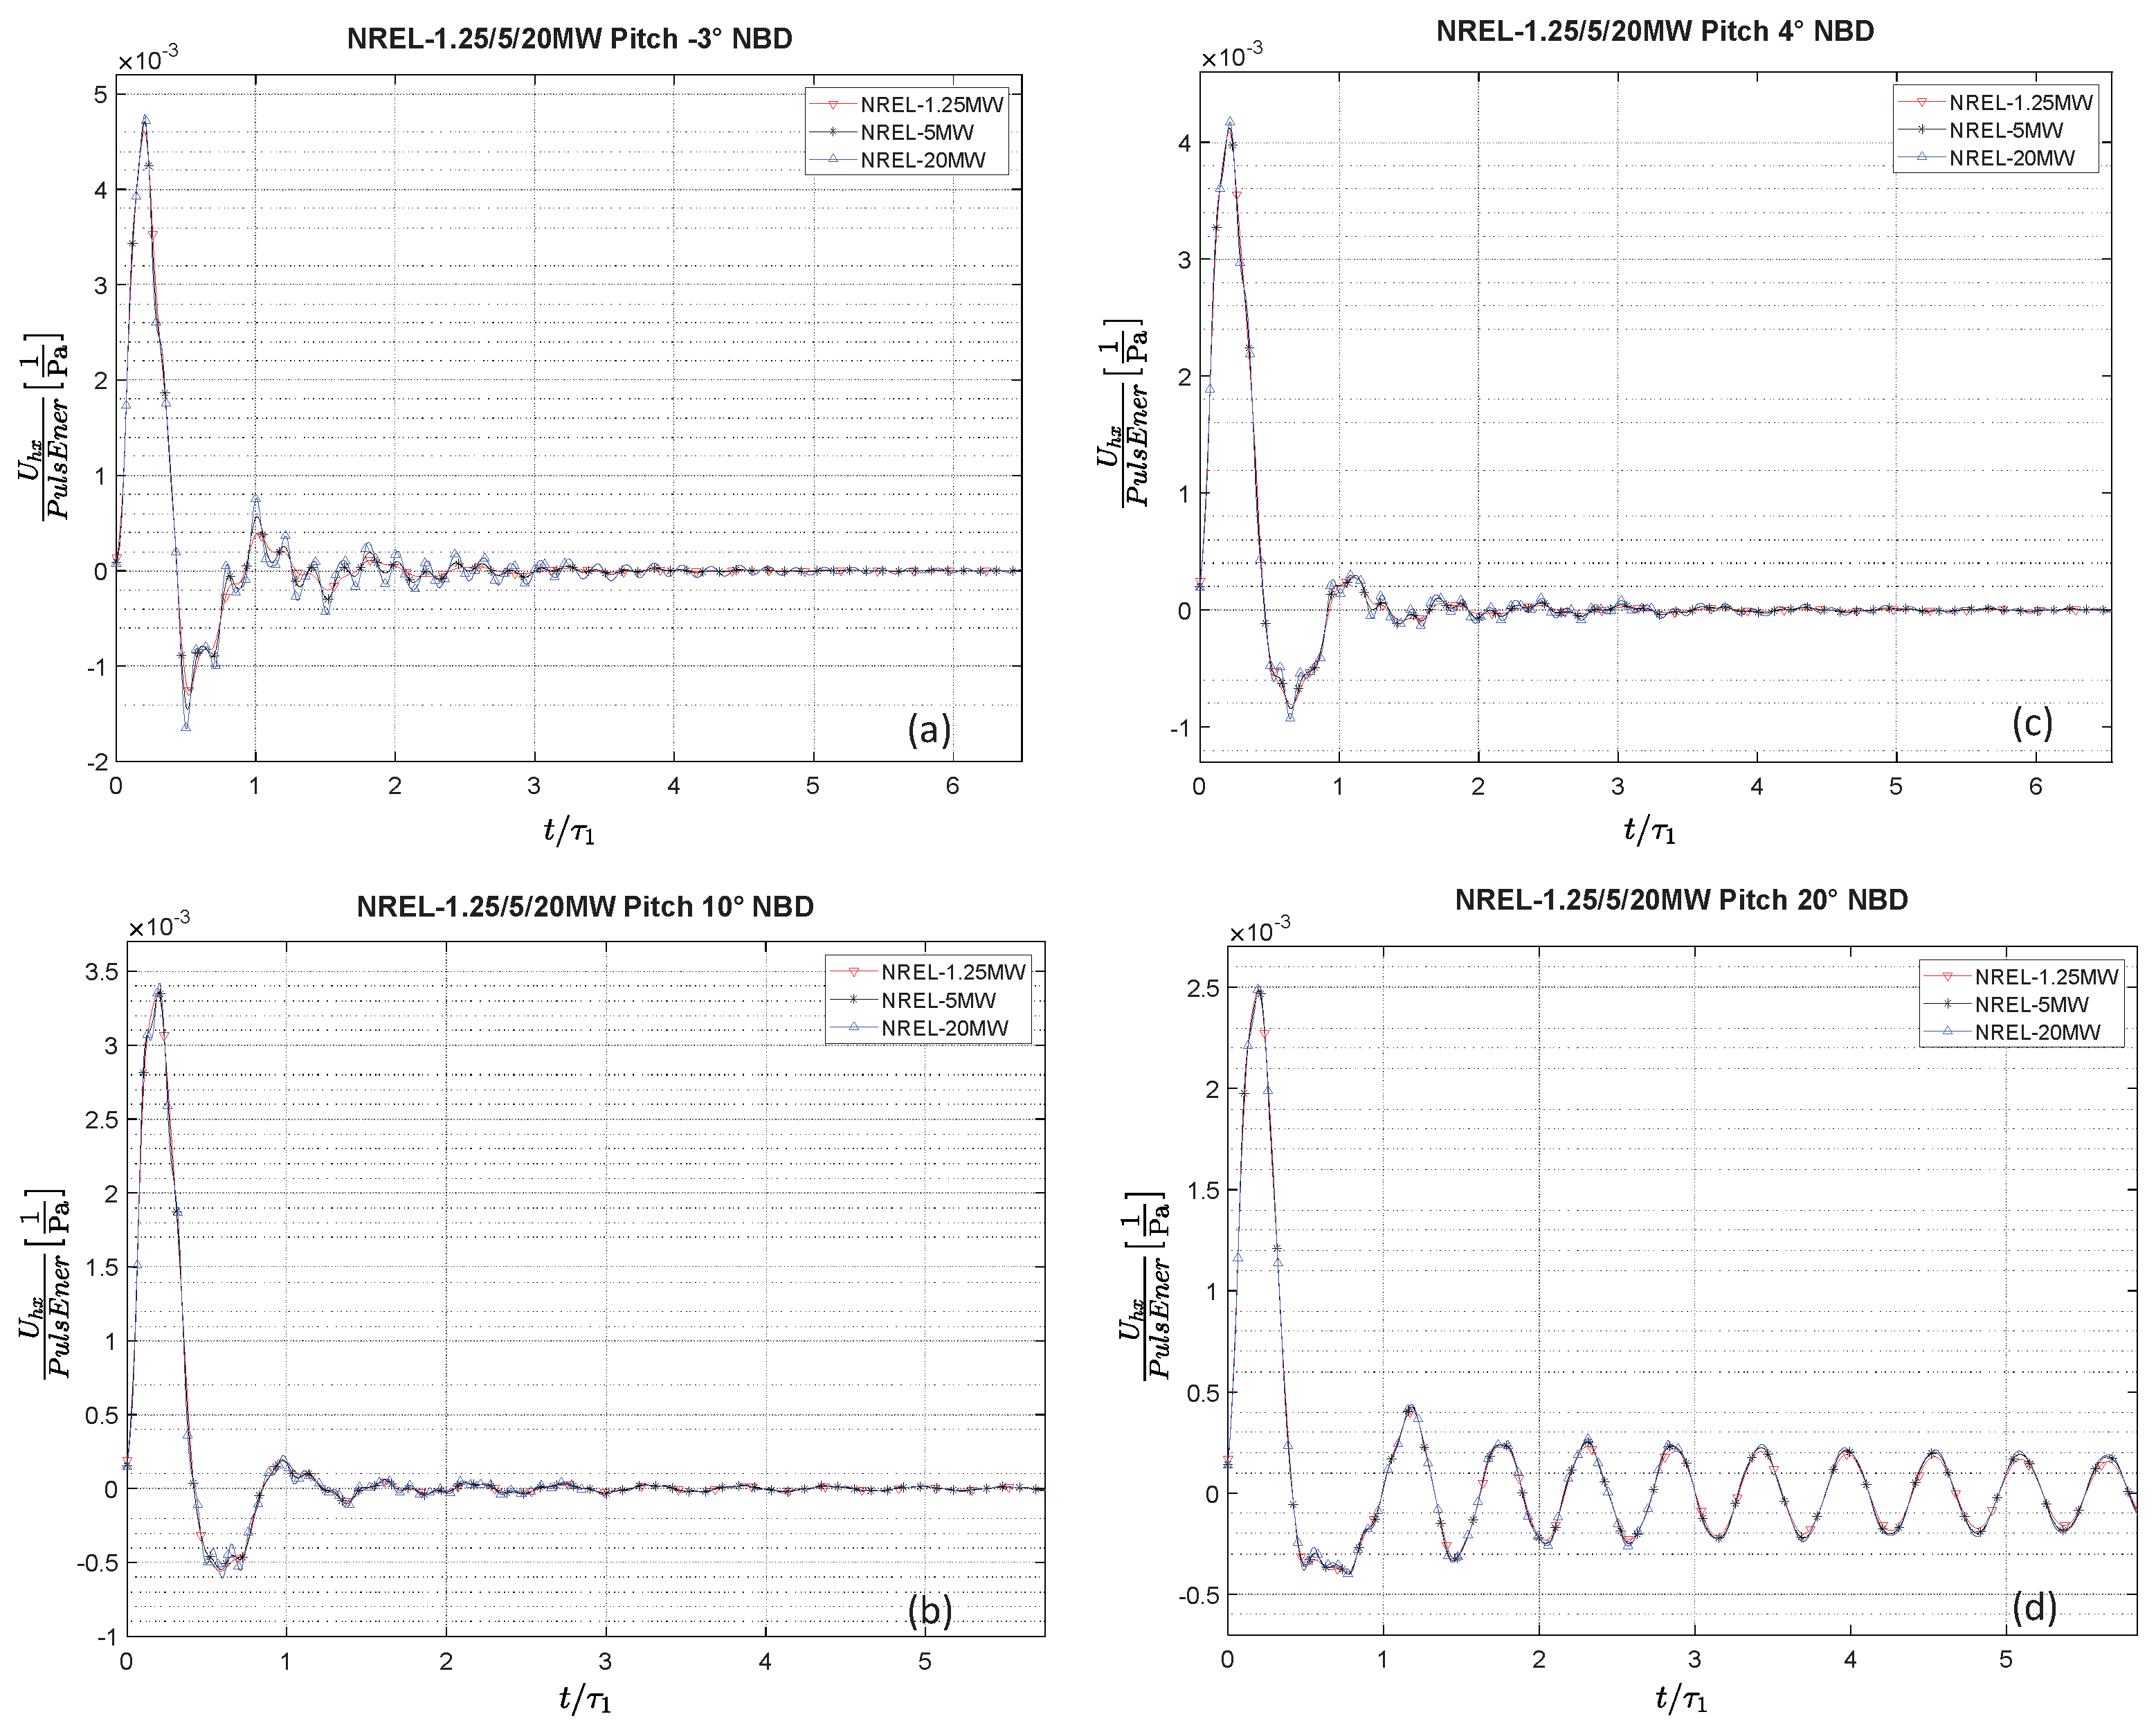
Additional examples of cases covering different combinations of control parameters are presented in
Figure 8, which shows NBD versus
signals for the NREL-1.25MW, the NREL-5MW, and the NREL-20MW turbines, tested at a Ws = 11.4 m/s.
Figure 8a shows the case of pitch = −3° and TSR = 7.55,
Figure 8b the case of pitch = 4° and TSR = 7,
Figure 8c the case of pitch = 10° and TSR = 6, and
Figure 8d the case of pitch = 20° and TSR = 5.
Finally,
Figure 9 shows NBD versus
signals for the same three turbines, tested at a Ws = 15 m/s.
Figure 8a shows the case of pitch = −3° and TSR = 6,
Figure 8b the case of pitch = 4° and TSR = 5,
Figure 8c the case of pitch = 10° and TSR = 4, and
Figure 8d the case of pitch = 20° and TSR = 3.
An interesting point observed in all cases that have been tested, which could also be seen in the examples shown, is the different levels of excitation of the secondary oscillatory modes, in particular Mode-2. These levels of secondary-mode excitation may vary depending on the combination of parameters (Ws, TSR, pitch) of each case and are visually manifested as higher-frequency fluctuations of relatively lower amplitude mounted on top of the low-frequency oscillations of the largely dominant Mode-1. As mentioned in
Section 3, this coincides with observations reported in previous stages of this research [
1,
2].
Generally, cases associated with combined values of Ws, TSR, or pitch that lay close to the boundaries of the stable region show a tendency to increase the excitation of secondary modes. Thus, even though the single-mode characterization based on the elastic energy accumulated in Mode-1 still accounts for the dominant features of the rotor’s oscillatory dynamics in the reduced-order sense in the oscillatory stable region, it may prove to be beneficial to explore a future extension of the ROC of a multi-modal nature, including Mode-2 and Mode-3 as additional degrees of freedom. We shall return to these topics in
Section 5 and
Section 6 of this paper.
Universal Characterization of the Vibrations’ Exponential Decay in the Stable Regime
As mentioned in
Section 3, a fundamental finding of the original ROC research effort, reported by Jalal et al. [
1] and Ponta et al. [
2], was that the exponential rate of decay of the NBD was found to be dominated by aerodynamic damping, and that it depends exclusively on the rotor’s operational conditions, given by the background wind speed, Ws, and the rotational regime, given by the TSR. Hence, the value of the exponential decay of the dominant mode,
, is essentially determined by operational conditions, regardless of the particular amplitude and time span of the gust pulse applied.
By using the time-scaling procedure based on blade length, the results presented in the current study extended the application of the ROC to turbines of any size that kept geometrical and structural similarity.
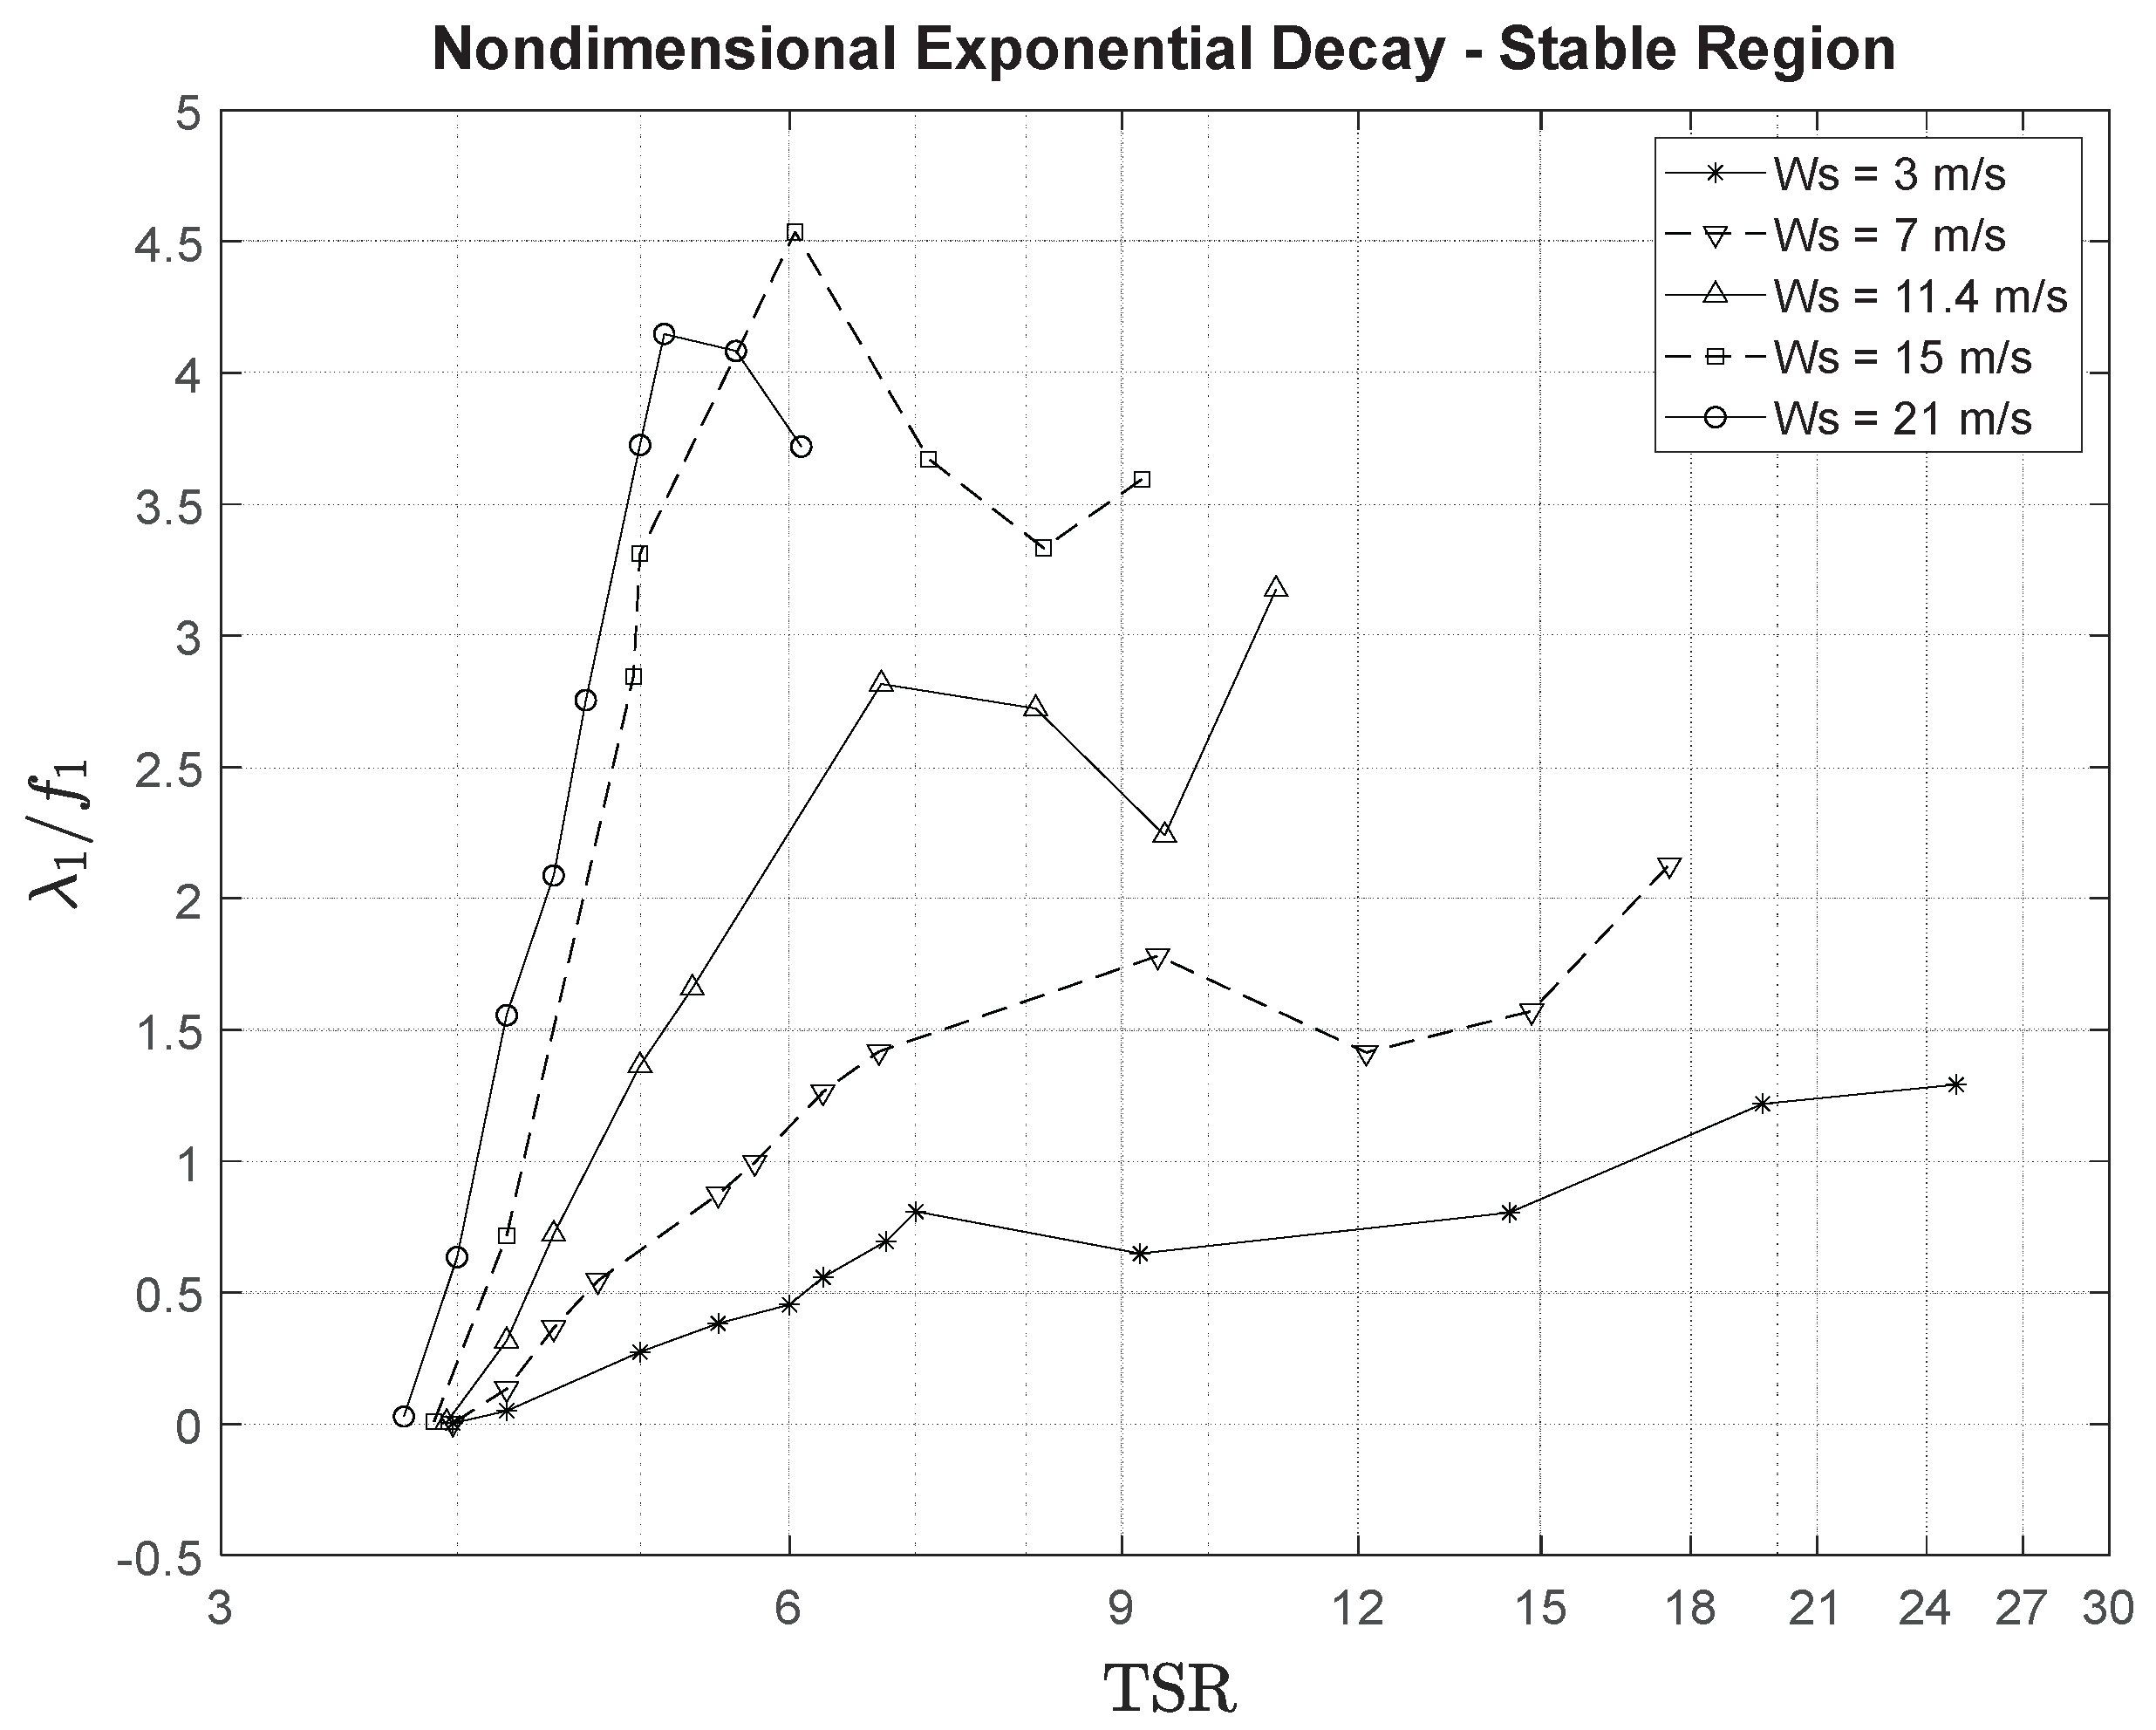
If the values of exponential decay, , are normalized by the corresponding Mode-1 frequency, (which, as previously discussed, also depends exclusively on the operational regime), unique characterization of the dynamic vibrational response of similar rotors of any size could be produced.
The resulting non-dimensional quantity, (usually referred to as the logarithmic decrement), would only depend on the operational regime, given by the specific combination of Ws, TSR, and pitch angle, and this would be independent of the nature of the gust pulse impinging on the rotor.
Figure 10 shows an example of
plot versus TSR in the stable region for the case of pitch = 0°, with a set of curves for different values of Ws spread over the range of operational speeds of the NREL-5MW design. These curves are valid for any up-scaled or down-scaled version of the NREL-5MW rotor. Plots of other values of blade pitch angle could also be produced.
5. Stability Regions of the Rotor’s Oscillatory Dynamics
As mentioned in
Section 3, other regimes of operation besides the stable regime analyzed in
Section 4 have been observed. These additional regimes are characterized by unstable behavior, where the amplitude of the oscillations excited by the gust pulse do not decay but actually expand, feeding on the kinetic energy of the steady stream wind even after the gust pulse has ended. That is, the action of the forces associated with the physical mechanism that, in the stable regime, are responsible for creating aerodynamic damping, now operate in such a manner that they contribute to the oscillatory motion, amplifying the amplitude of the vibrational response. In this regime, the value of
inverts its sign and becomes negative.
This phenomenon was first reported by the authors in Jalal et al. [
1] for the case of the stall-controlled DU-5MW-RWT rotor. The same behavior was found for the turbines analyzed in the present study, where more insights about the nature of the stability regions were made. These insights include the presence of a second region of instability, the nature of the boundaries between the stability regions, the location of those boundaries, and the dependence of the shape of the boundary curves with the aerodynamic load induced by the operational wind speed, Ws.
The importance of determining the nature and topology of these stability regions and their corresponding traditional boundaries cannot be overemphasized. They mark the limits of the envelope of diverse wind turbine control strategies that could be safely adopted in the context of a certain set of operational conditions without the risk of incurring a potential unstable aeroelastic response. That is, eventual innovative control strategies, given by a combination of control parameters (namely pitch and TSR), have to be designed to operate within those stability limits. After ensuring that the turbine operates within the limits of the stable region, those control strategies also have to embed a predictive algorithm that takes into account the time required to dissipate the eventual oscillations created by the gust pulses present in the wind speed signal detected by the turbine’s anemometry sensors using information given by
charts like the one shown in
Figure 10.
In this Section, recent findings about relevant aspects about the stability regions and their corresponding traditional boundaries will be discussed.
5.1. Lower Unstable Region
The first stability transition that will be discussed here occurs when the value of the operational TSR is lowered below a certain threshold. As mentioned in
Section 1, the TSR is defined as the ratio between the tangential speed of the blade tips and the speed of the incoming wind, given by the formula
, where
is the rotational speed of the turbine in rad/sec, and R is the nominal radius of the rotor [
26]. Hence, the decrease in TSR might be produced by a decrease in rotational speed when the turbine is operating at a certain wind speed, by a sustained increase in the wind speed, or by a combination of both factors, depending on the situation. In all cases, the result is an inversion of the the exponential decrease,
, and the switch in the behavior of the physical mechanism of aerodynamic damping, which turns into an amplifier of the oscillations.
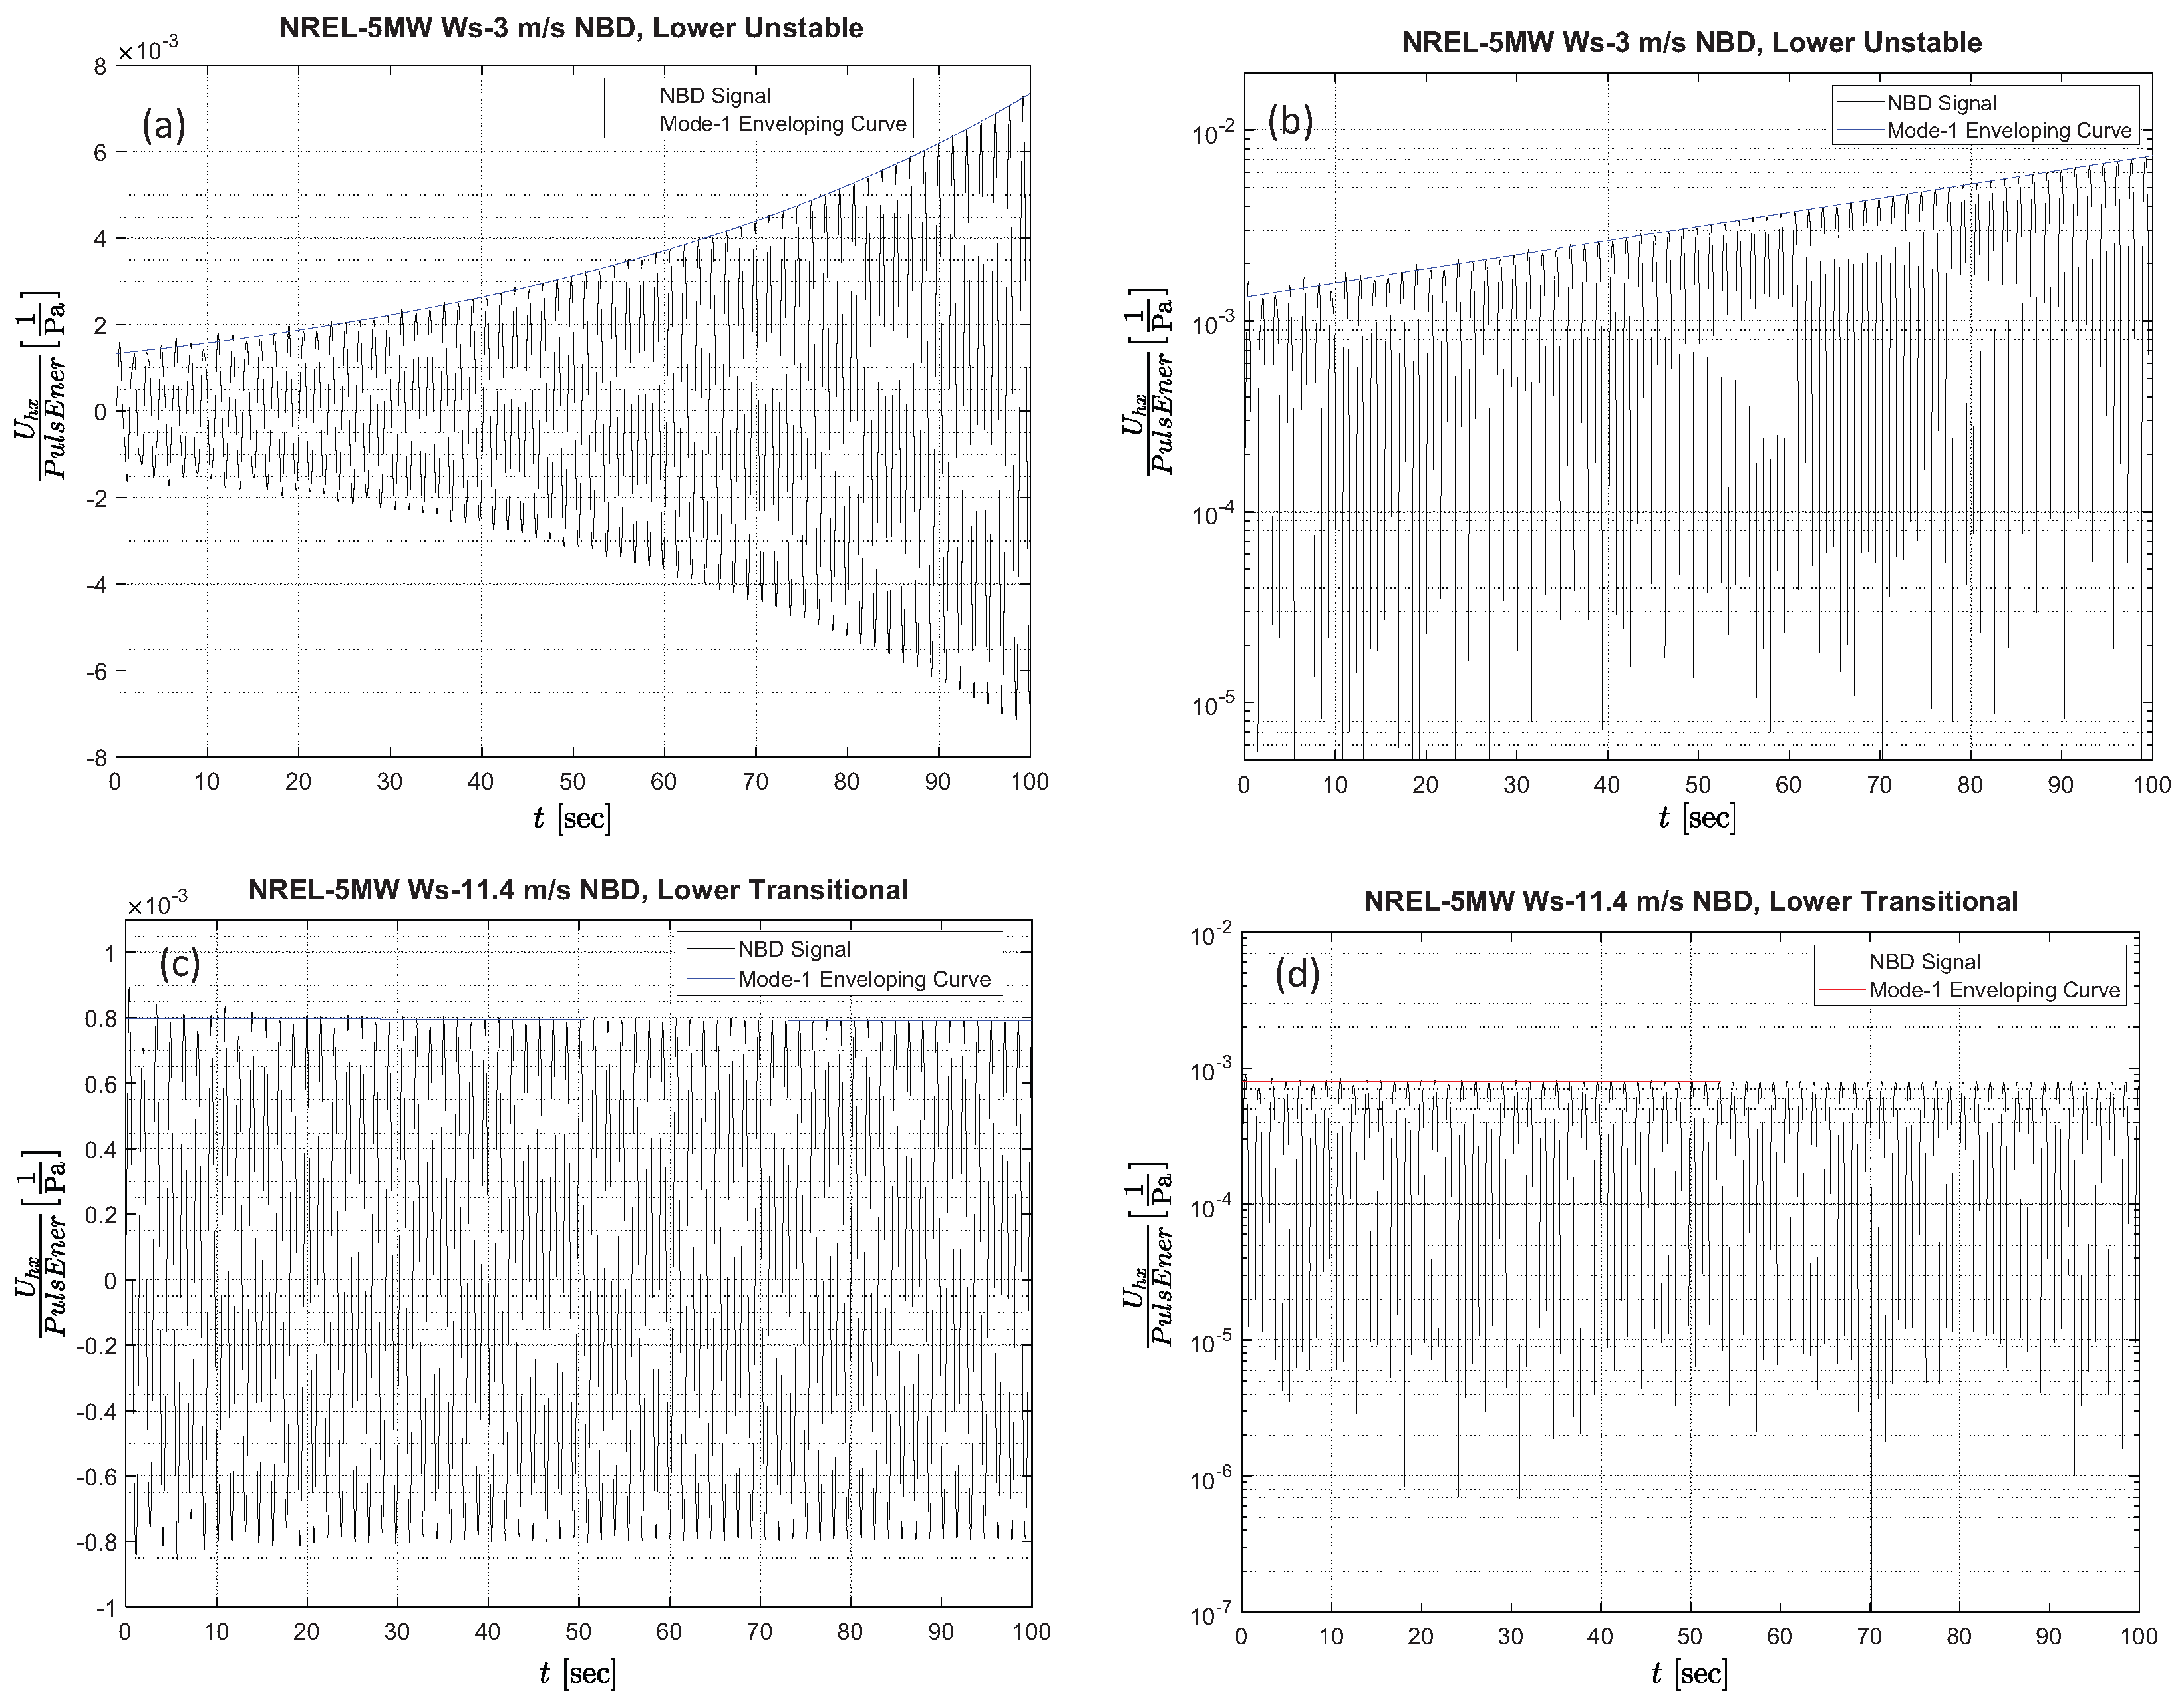
Figure 11 shows examples of NBD signals for an NREL-5MW rotor, illustrating the typical oscillatory behavior observed in the Lower Unstable Region (LUR) and the behavior observed in the Lower Transitional Boundary (LTB), which is the locus of operational conditions that separate the LUR from the stable region of operation.
Figure 11a shows the NBD signal example for the LUR with Ws = 3.0 m/s, TSR = 3.82, and pitch = 0.
Figure 11b shows the semi-log plot counterpart of the same signal, where the now positive slope of the peak enveloping curve (corresponding to a negative value of
) could be observed.
Figure 11c shows the NBD signal example for the LTB with Ws = 11.4 m/s, TSR = 3.94, pitch = 0.
Figure 11d shows the semi-log plot counterpart of the same signal. In this case, the enveloping curve is essentially flat, which corresponds to a zero value of
with sustained oscillations that neither increase nor decrease. As in many transitional situations, there is a band of uncertainty around the transitional boundary. In the case of the LTB, that zone of uncertainty is relatively thin for most of the cases analyzed.
As could be seen in the examples shown, the LUR oscillatory behavior is characterized by the inversion of the sing of
, and it is completely dominated by the growth in the amplitude of Mode-1, as shown by the single enveloping curve in
Figure 11a,b. This has been systematically observed in all the LUR cases analyzed.
5.2. Upper Unstable Region
The lower unstable region discussed in
Section 5.1 is by far the most important to determine because its transitional boundary lies the closest to the typical TSR regimes where wind turbines operate in normal situations. However, in order to expand this search for a map of the stability behavior, a preliminary exploration was conducted on regimes on the other end of the TSR spectrum; that is, high values of TSR that could only be reached in extreme conditions that may occur occasionally. These rare situations might happen during extreme and sudden changes in wind conditions or during rapid transients between one regular regime and another.
In an effort to test the upper TSR limits that innovative control strategies could safely achieve, tests were conducted with increasing values of TSR beyond the typical rated values. The results of these tests generally agreed with the basic principles previously shown for the LUR oscillatory behavior discussed in
Section 5.1. In this Upper Unstable Region (UUR), three response signal types—stable, unstable, and transitional—have also been observed, but in these higher TSR regimes, different oscillatory response signals were seen, both in their qualitative and quantitative aspects.
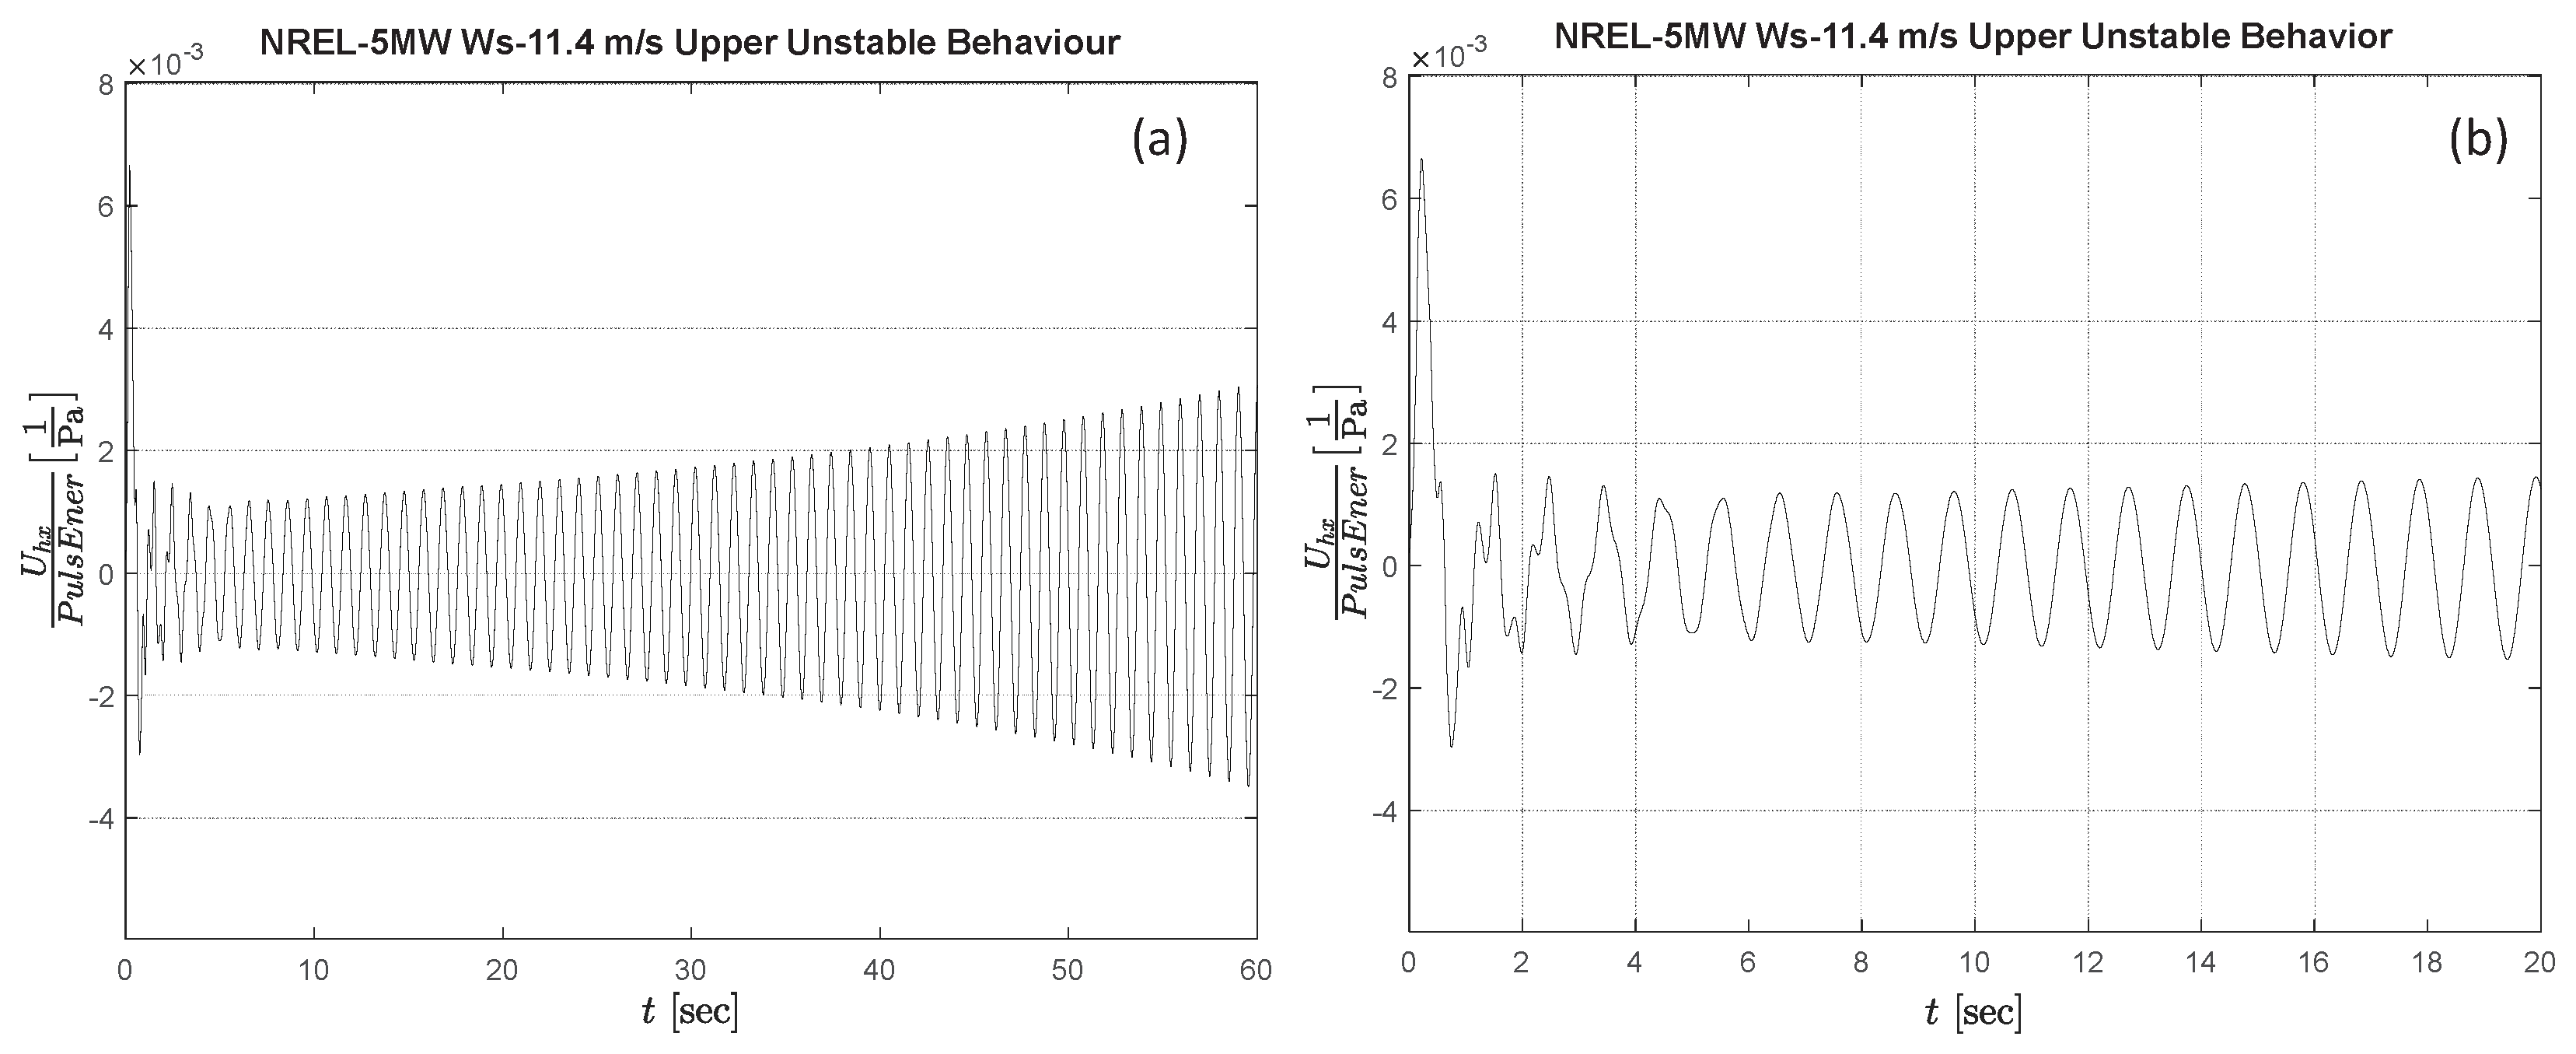
Figure 12 shows an example of an NBD signal for an NREL-5MW rotor operating within the UUR, with Ws = 11.4 m/s, TSR = 10.93, and pitch = 0.
Figure 12a shows the NBD signal for a time period long enough to appreciate the unstable condition in the long term, visually manifested in the expanding nature of the signal’s peaks.
Figure 12b shows a close-up of the same signal in the short term, where an initial decrease in the signal’s amplitude could be seen before the systematic expansion starts to dominate in the long-term response.
In contrast with the typical behavior observed in the LUR, the UUR first shows decay of the first mode of oscillation. Then, when the first mode loses its dominance, the two secondary modes take over. The presence Mode-2 and Mode-3 could be visually appreciated in the close-up image in
Figure 12b. Even though the high-frequency oscillations of Mode-3 eventually dissipate in a few cycles, Mode-2 remains active the entire time. Ultimately, Mode-2 becomes dominant, leading to systematic expansion of the oscillation amplitude, which indicates inversion of the sign of the Mode-2 exponential decay,
.
Different from what has been observed in the lower unstable region discussed in
Section 5.1, in the case of the UUR, the associated Upper Transitional Boundary (UTB) between the stable region and the UUR was found to exhibit an uncertainty zone that is characteristically thicker. The preliminary series of tests conducted hitherto in these regimes have also shown a rich nature in their behavior, with different ways in which the three oscillatory modes contribute to the evolution of the NBD signal. Given this richness of behavior, a comprehensive analysis of the UUR and the associated UTB would require an extensive set of numerical experiments that goes beyond the scope of the present work. In particular, the relative levels of secondary-mode excitation and how they vary depending on the combination of operational parameters would be an interesting topic for further exploration. In this sense, as mentioned in the closing comments in
Section 4, it may prove to be beneficial to explore a future extension of ROC of a multi-modal nature, including Mode-2 and Mode-3 as additional degrees of freedom.
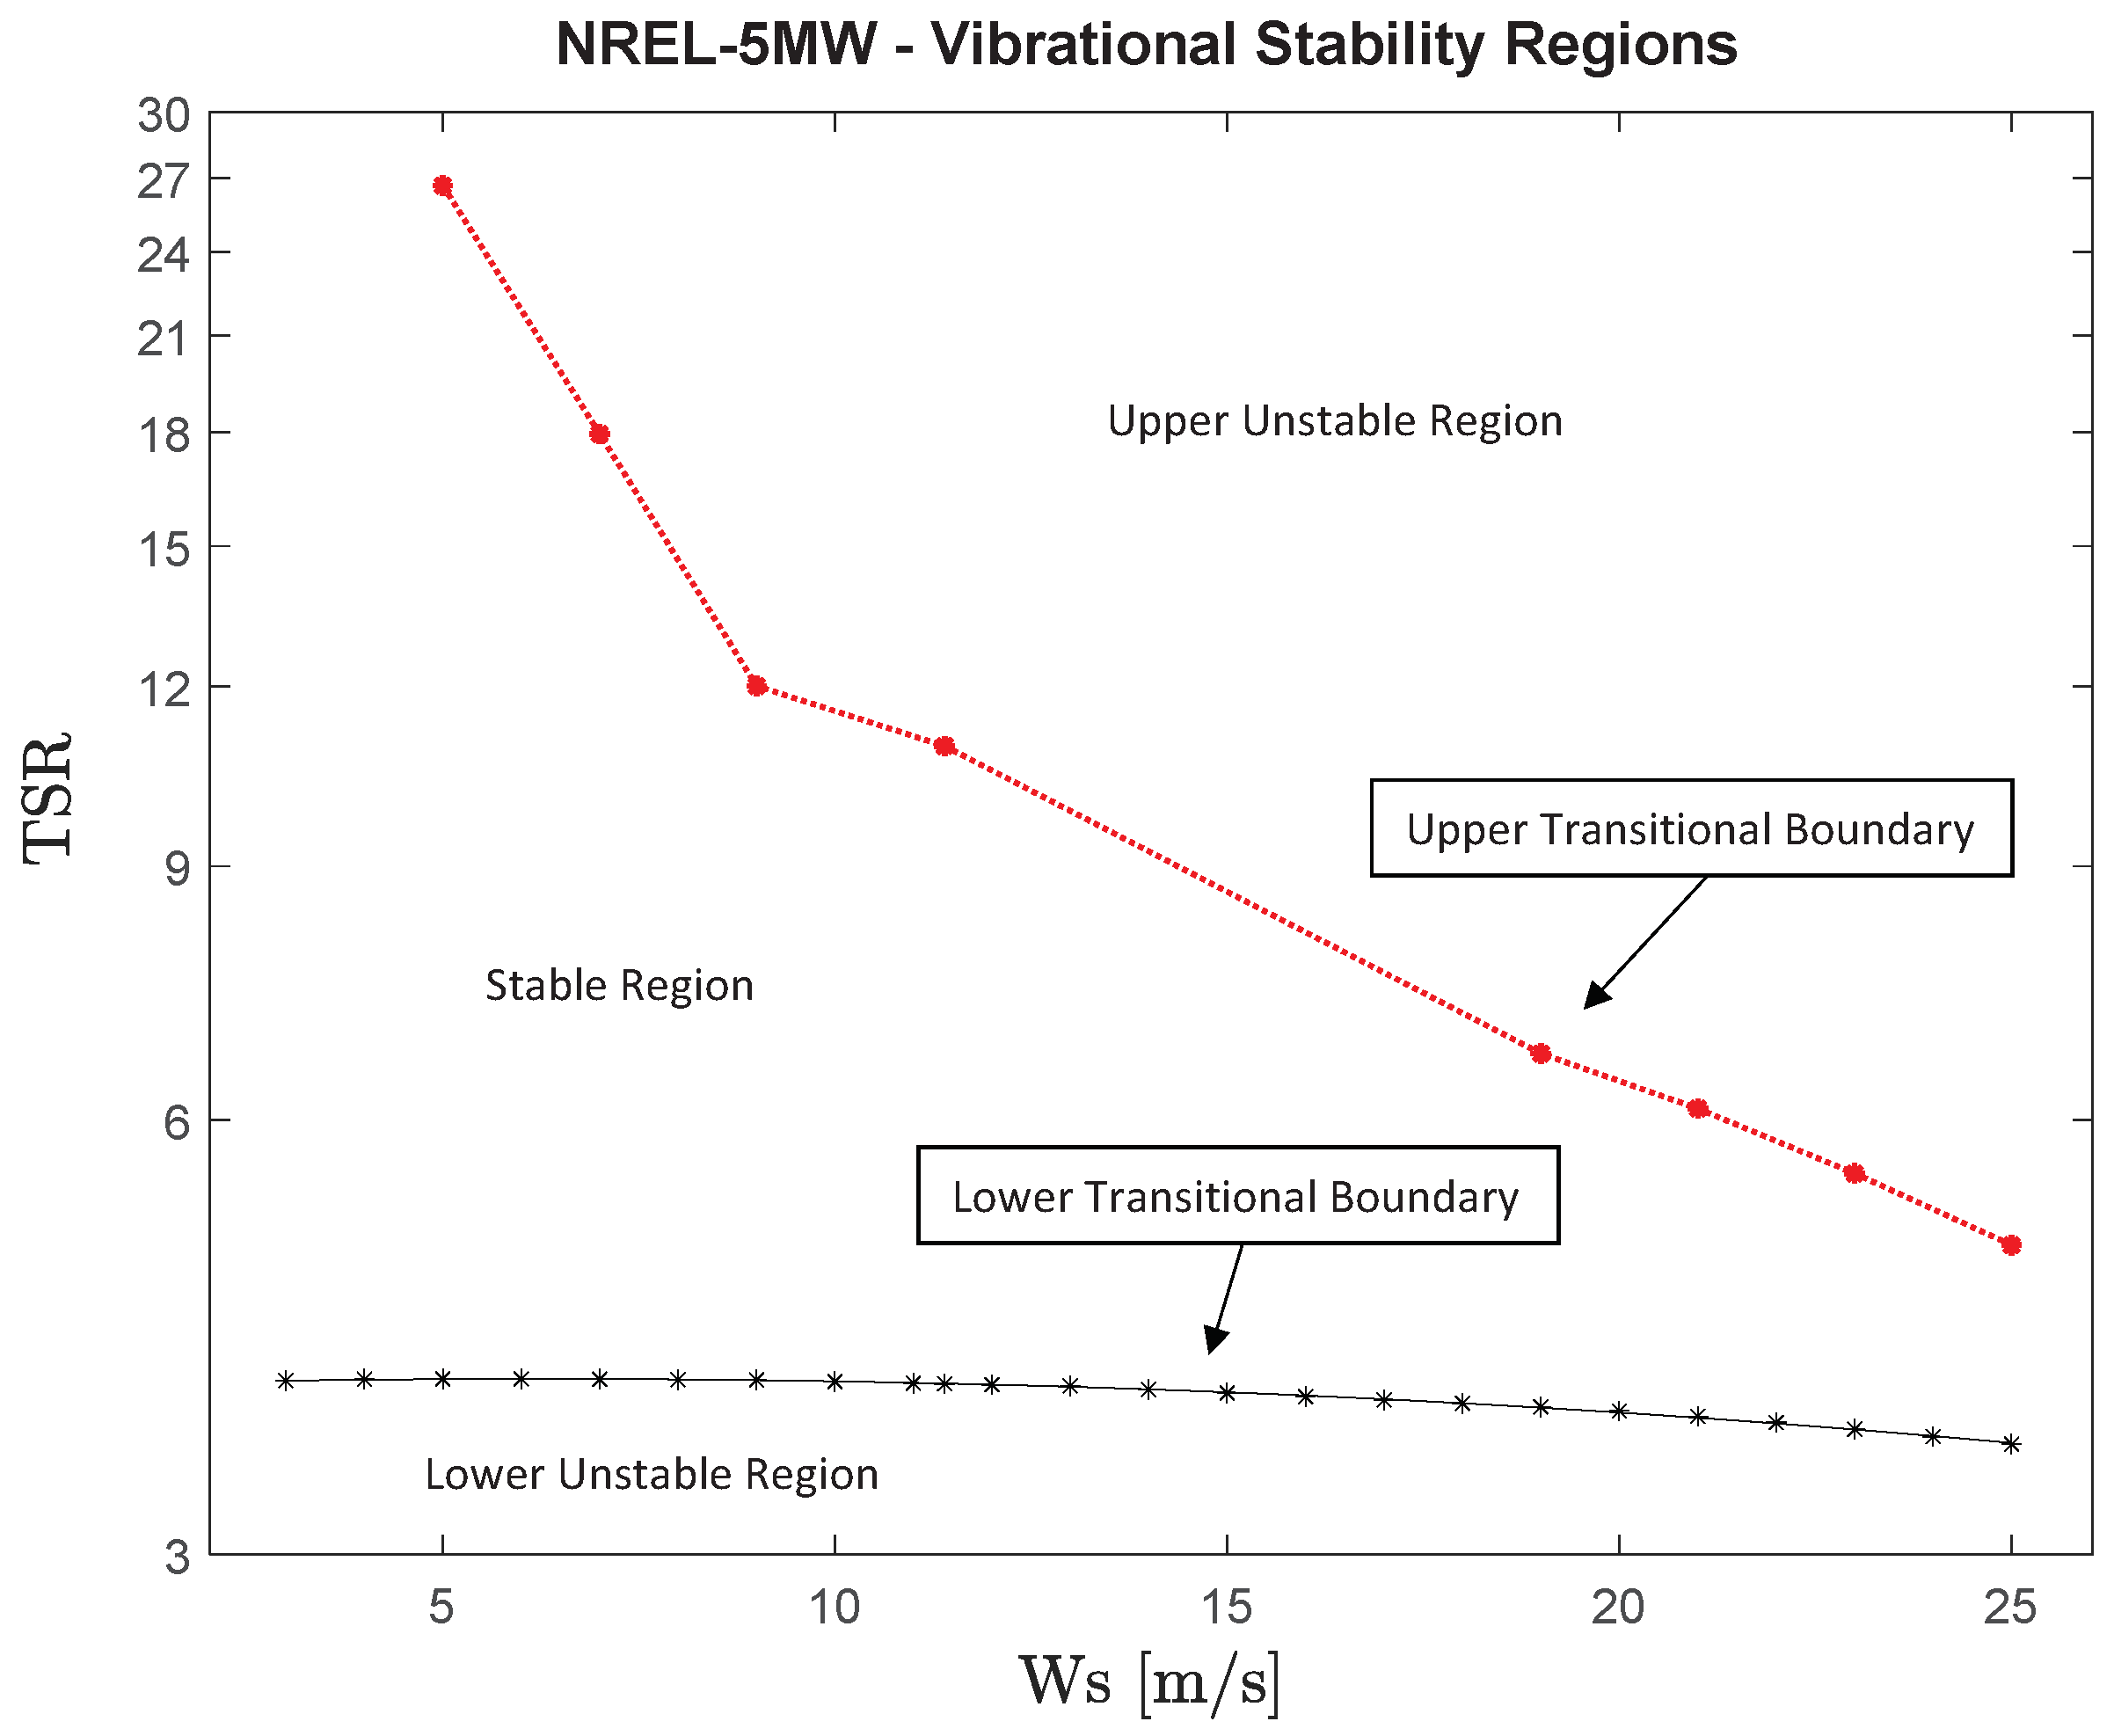
Summarizing the different types of oscillatory behavior discussed in this section,
Figure 13 shows am example of a map of the stability regions for the NREL-5MW rotor, operating at a blade pitch angle of 0°, for different values of TSR and wind speeds covering the entire operational range of the NREL-5MW design. The loci of LUR, UUR, LTB, and UTB are indicated.
Finally, additional findings about the particular shape of the curve marking the LTB, its dependence with the operational wind speed, Ws, and the associated aerodynamic load that it exerts on the blade will be presented in the following section.
5.3. Lower Transitional Boundary Dependence on Aerodynamic Load
In the context of a spring-mass system model of the rotor as a mechanical oscillator, the blade could be seen as a leaf spring with distributed masses attached to it along its length. The overall result in terms of the equivalent mass and stiffness representing the blade in that oscillator reduced model would depend on the blade’s geometrical design, the types of materials used in its construction, the layout of those materials in the blade internal structure, and the distribution of those parameters along the blade span from the root to the tip.
In this same type of oscillator model analogy, the role of the blade’s geometrical design as a lifting body, given by the the width and profile of its airfoil-shaped cross sections, and how those properties are distributed along the span, would determine the level of aerodynamic damping associated to the blade as a whole. This provides the equivalent of the damper in the mechanical-oscillator analogy. As previously discussed, when the operational conditions are such that the rotor operates in either of the LUR or the UUR instability regions, the value of turns negative, and the damper becomes a driver to the oscillations.
One of the aspects of the ROC discussed in
Section 3 was that the peaks of the NBD signal essentially represent instances where all the vibrational energy of the rotor is stored as elastic energy of deformation. Moreover, the first peak of the oscillation indicates the moment at which all the kinetic energy per unit area of the rotor’s disk delivered by a gust-pulse is “captured” by the blade’s equivalent leaf spring in the oscillator model analogy.
Observing the plots of NBD signals presented earlier, it could be noticed that the NBD parameter has the units of an equivalent modulus of flexibility, expressed as in the international system of units. Conversely, this value could be interpreted as the inverse of a modulus of elasticity, . This magnitude represents the equivalent of a modulus of elasticity for the leaf-spring equivalent of the blade as a whole when its structural layout and material properties are considered in an integral way.
The fact that the normalizing magnitude in the definition of the NBD,
, is computed as energy per unit area means that the NBD in itself is independent of the rotor’s size. This is reflected in the collapse in the vertical axis of all the NBD signals shown in
Section 4, regardless of rotor size. That is, the value of
remains the same as long as the rotors have geometrical and structural similarity, and material similarity is also the reason for the Pa unit of measurement for
.
A fact that was noticed in previous works by the authors (Jalal et al. [
1] and Ponta et al. [
2]) was that the value of this equivalent stiffness depends not only on the basic stiffness of the blade itself but also on the value of the mean wind-speed regime, Ws. The original hypothesis was the this dependence of
on Ws could be attributed to the fact that the blade deflection created by the mean wind flow establishes a base of the deformation state around which the various instantaneous oscillations due to different pulses occur. This base state of axial blade deformation acts as a pre-loading (or pre-stiffening) state for the equivalent leaf-spring. This pre-loading state is common to all pulse-induced oscillations occurring in the same base Ws condition, regardless of the nature of the pulse. This results in a unique value of
and of
and
associated with a certain operational condition.
Following this line of reasoning to the next step, it is possible to establish a connection between the value of Ws and the level of pre-loading. Due to the fact that the pre-loading comes from the axial projection of aerodynamic forces acting on the airfoil sections distributed along the blade’s span (in particular, the lift force), it seems natural to assume that pre-loading would scale with the dynamic pressure of the base flow, which, in turn, depends on the square of Ws.
In the course of the present study, it was found that a close-up inspection of the curve representing the loci of the lower transitional boundary, previously shown in
Figure 13, can help to confirm the hypothesis of the pre-loading dependence on the square of Ws. The reason is that the LTB locus essentially represents the combination of parameters Ws and TSR that make the value of the aerodynamic damping
equal to zero. Given the fact that, as previously mentioned,
depends on the pre-loading effect, the locus of the values at which
crosses the zero axis should also depend on pre-loading and thus on the square of Ws.
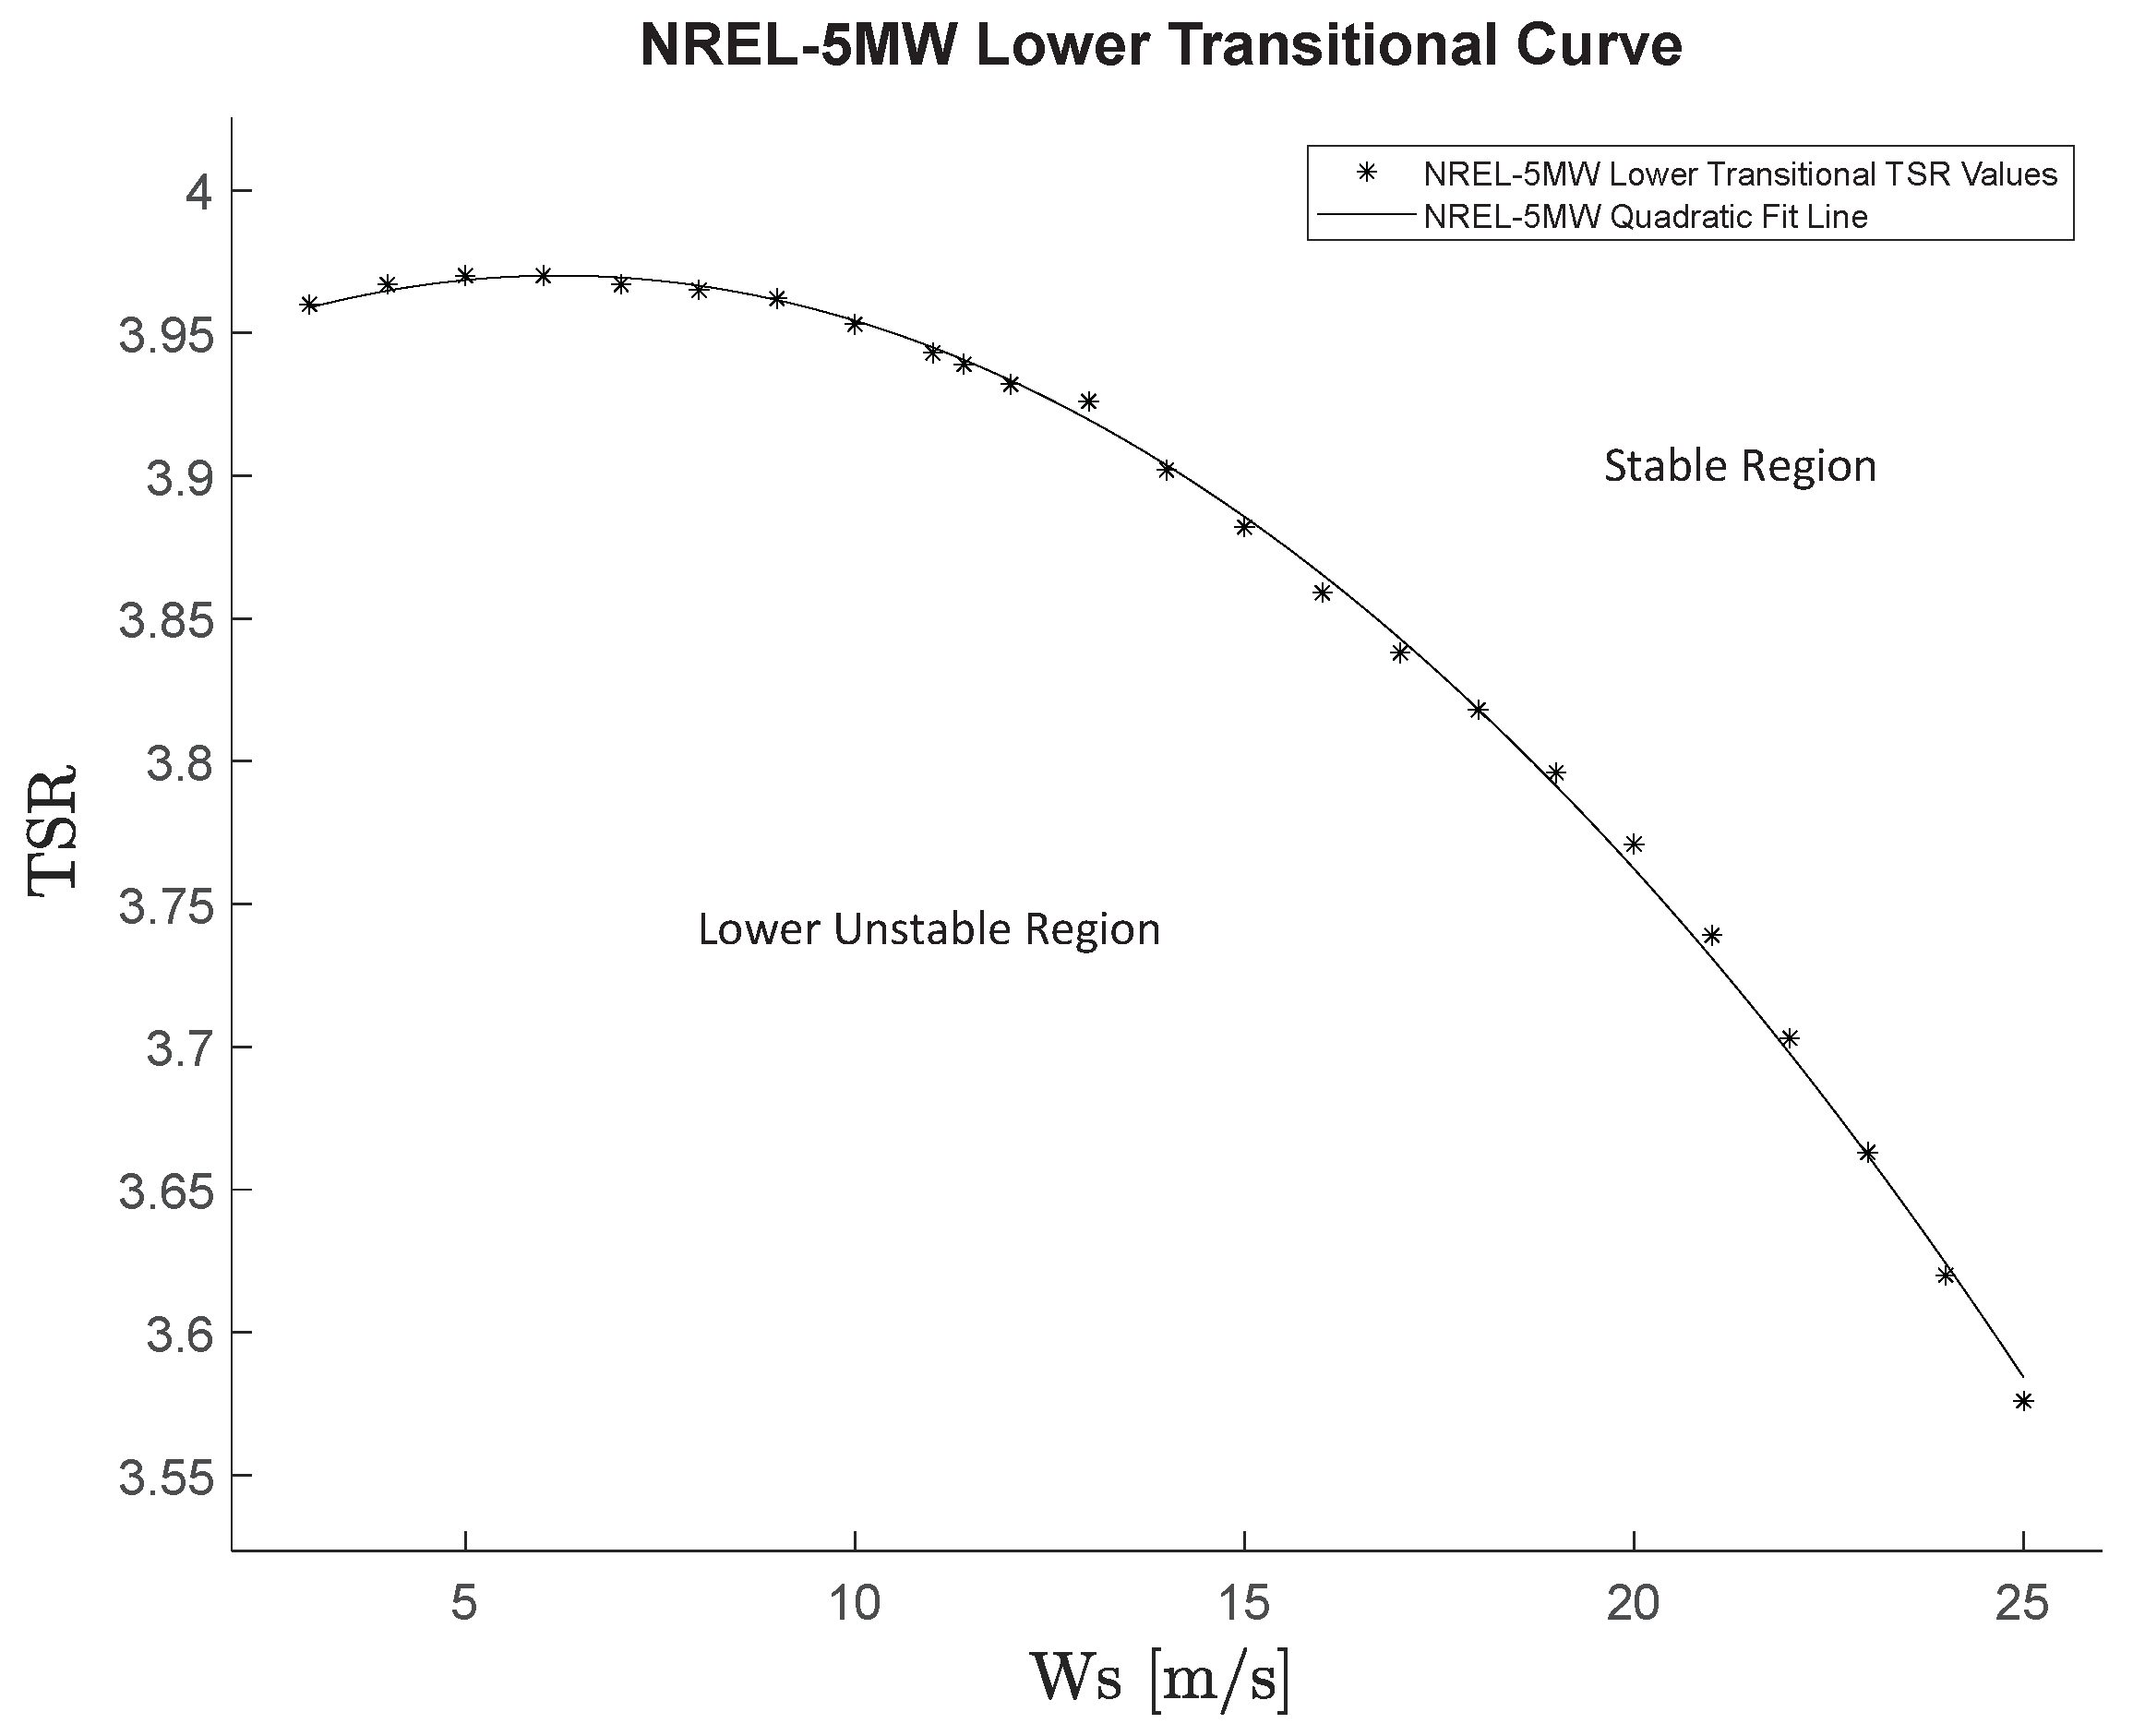
Figure 14 shows a close-up view of the LTB curve, previously shown in
Figure 13, for the NREL-5MW rotor operating at pitch = 0° for different values of TSR and Ws. The plot shows the individual values of TSR vs Ws based on several numerical results obtained at the transitional conditions connected by a quadratic best-fit line.
The remarkable agreement of the LTB locus and the quadratic fitting curve clearly indicates that there is indeed a dependence between the transitional curve and the square of Ws, sustaining the hypothesis of the flow’s dynamic pressure, with the associated aerodynamic load being a determining factor in the particular shape of the LTB.
One factor that can be noticed by inspecting the position of the vertex of the parabolic fitting in
Figure 14 is that the dependence of the LTB curve with Ws is not monotonic. The curve first increases in the Ws range from 3 m/s to approximately 6 m/s and then decreases systematically until the end of the operational range of Ws at 25 m/s. That is, even though the transitional locus does depend on the dynamic pressure of the flow, that dependence is not a direct one. Strictly speaking, the pre-load effect is caused by the aerodynamic loading of the blade in the axial direction, which, as previously discussed, depends on the square of Ws. But, another factor in this dependence is the geometrical configuration of the blade in its deformed state when under a load; in particular, the attitude of the blade’s airfoil sections versus the incoming flow, which controls the way in which the flow’s dynamic pressure is translated into the aerodynamic forces of lift and drag that ultimately create the axial loading. The geometrical configuration of the blade in its deformed state varies as the load changes when increasing Ws. That is, the “ability” of the blade to translate dynamic pressure into aerodynamic axial load has to be taken into account in order to completely define the dependence of the LTB curve on Ws.
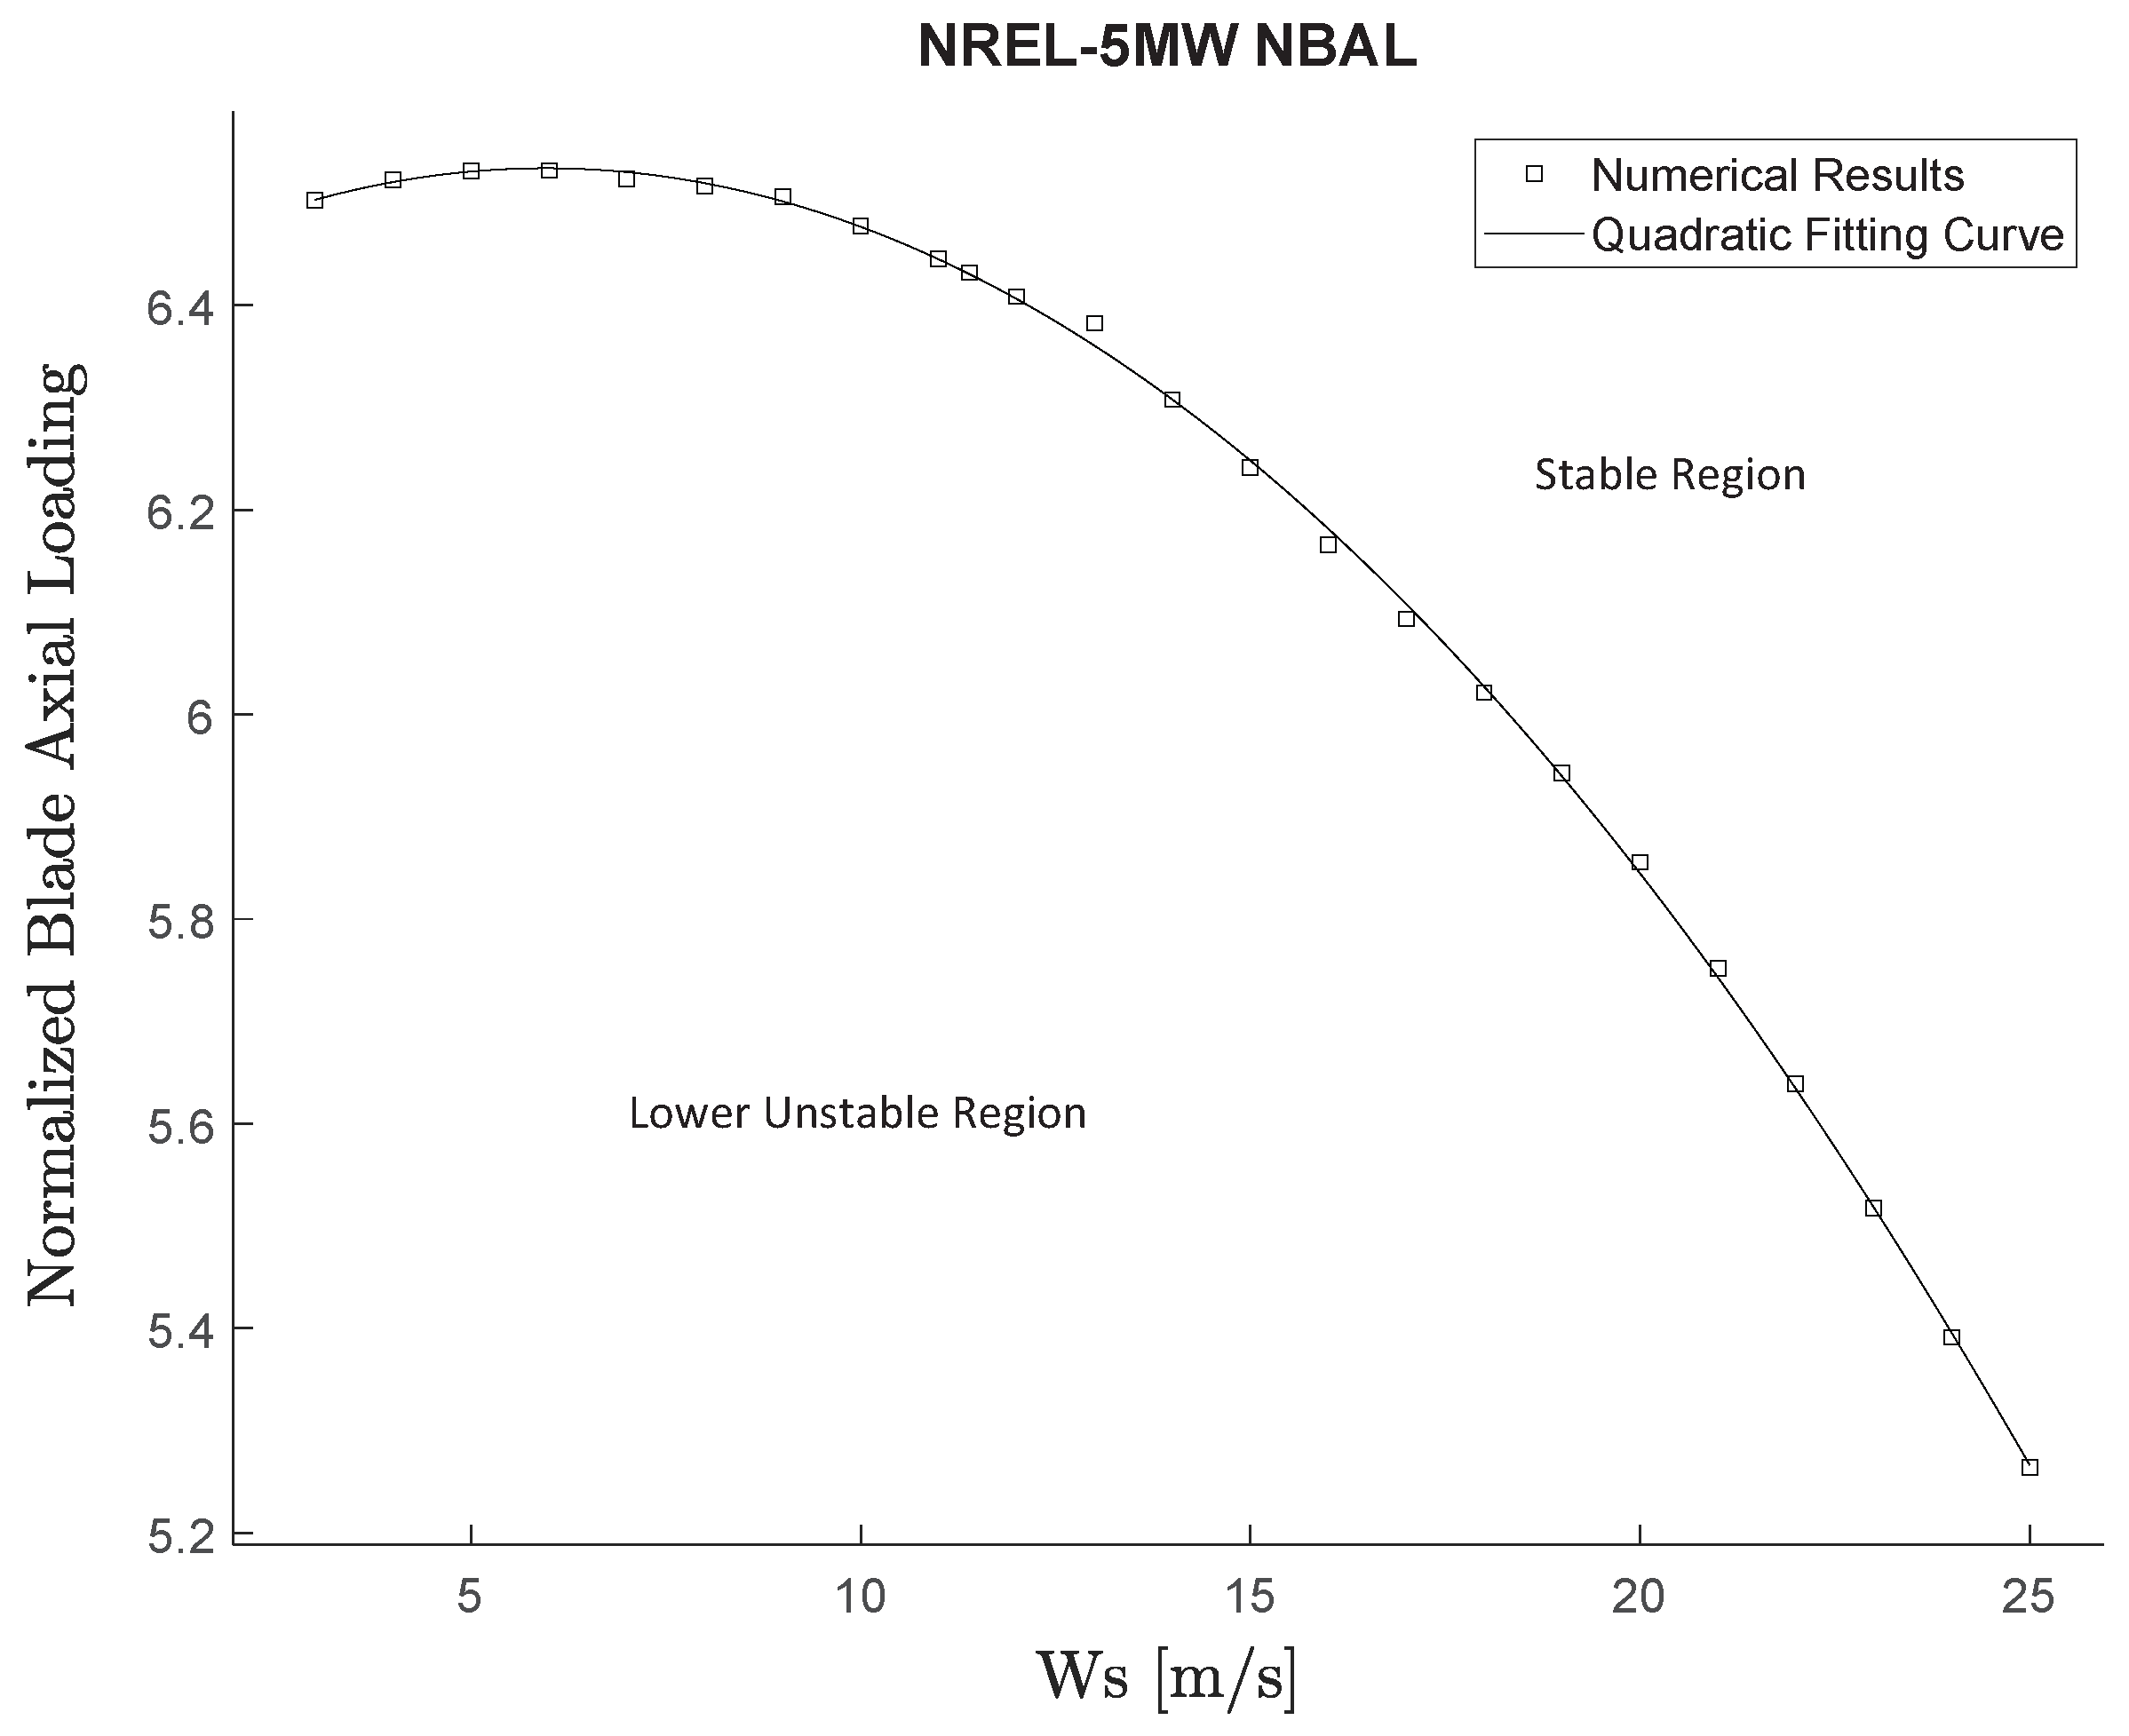
To elucidate the role that blade deformation plays in the generation of axial load, a series of numerical experiments was design to measure the Normalized Blade Axial Load (NBAL) for different values of Ws covering the operation range of the NREL-5MW design. The NBAL is defined as a non-dimensional quantity given by the ratio between the total axial load acting on the blade (obtained from the integration of the axial loads on the blade airfoil sections distributed along the blade’s span) and the dynamic pressure of the flow scaled by the planar area of the blade.
Figure 15 shows the values of NBAL vs. Ws for the NREL-5MW rotor operating at pitch = 0° and the values of TSR corresponding to the transitional operational conditions on the LTB. The plot shows the individual values of NBAL vs. Ws from several numerical results obtained at the TSR transitional conditions, connected by a quadratic best-fit line.
The remarkable agreement between the shape of the TSR vs. Ws and the NBAL vs. Ws curves further confirms the connection between the axial pre-load state and the parameters controlling the oscillatory response, , and of and observed for each operational condition.
The non-dimensional nature of NBAL implies that it should be identical for all up-scaled and down-scaled versions of a certain turbine. That fact was confirmed in the course of this study. The NBAL vs Ws curves for all scaled variations of the NREL-5MW design (NREL-1.25MW, NREL-5MW, and NREL-20MW) indeed collapse into an almost indistinguishable line, making these findings about the pre-loading phenomenon applicable to turbines of any size that share geometrical and material similarity.


