Article

Unveiling Dynamical Symmetries in 2D Chaotic Iterative Maps with Ordinal-Patterns-Based Complexity Quantifiers

by
Benjamin S. Novak
1 and
Andrés Aragoneses
1,2,*
1
Department of Physics, Eastern Washington University, Cheney, WA 99004, USA
2
Department of Physics, Whitman College, Walla Walla, WA 99362, USA
*
Author to whom correspondence should be addressed.
Dynamics 2023, 3(4), 750-763; https://doi.org/10.3390/dynamics3040040
Submission received: 14 October 2023 / Revised: 6 November 2023 / Accepted: 6 November 2023 / Published: 9 November 2023
(This article belongs to the Special Issue Chaotic Dynamics in Discrete Time Systems)

Abstract

:
Effectively identifying and characterizing the various dynamics present in complex and chaotic systems is fundamental for chaos control, chaos classification, and behavior-transition forecasting, among others. It is a complicated task that becomes increasingly difficult as systems involve more dimensions and parameters. Here, we extend methods inspired in ordinal patterns to analyze 2D iterative maps to unveil underlying approximate symmetries of their dynamics. We distinguish different families of chaos within the systems, find similarities among chaotic maps, identify approximate temporal and dynamical symmetries, and anticipate sharp transitions in dynamics. We show how this methodology displays the evolution of the spatial correlations in a dynamical system as the control parameter varies. We prove the power of these techniques, which involve simple quantifiers as well as combinations of them, in extracting relevant information from the complex dynamics of 2D systems, where other techniques are less informative or more computationally demanding.

1. Introduction

Characterization of the different dynamics present in a complex system is a paradigmatic problem. It is of great interest in order to distinguish chaos from noise, classify different dynamic regimes, forecast transitions in behavior, and identify critical points or extreme events [1,2,3,4], just to name a few. Methods and techniques have been developed to classify chaos, which depend on the particular chaotic system and/or the available parameter(s) that can be observed [4]. Some tools using ordinal patterns have been introduced that focus on the dynamics of the complex systems [5,6,7]. These try to identify repeating or forbidden patterns in the temporal or spatial parameters of the system. While these techniques are informative on their own and can identify key features of the dynamics, combinations of quantifiers usually provide a deeper and more complete description of the complex dynamics [8,9,10].
Here, we apply and combine recently introduced tools to characterize and distinguish families of chaos, and to identify approximate symmetries underlying the different chaotic regimes of two-dimensional iterative maps.
A simple yet powerful technique to quantify complexity is permutation entropy (PE) [5], based on the concept of ordinal patterns (OPs), also referred to as words. PE and combinations of PE with other quantifiers have been used to classify chaos, distinguish chaos from stochasticity, identify complex dynamic structures, and forecast transitions in behavior [7].
Another useful quantifier of complexity, suited to characterize local dynamics in a time series, is the Fisher information measure (FIM) [8,11]. FIM quantifies the local slope of a time series, and it is sensitive to small behavioral changes, whereas PE is a global measure.
A combination of Shannon entropy and FIM was introduced by Vignat and Bercher as the Fisher–Shannon information plane [8]. This approach allows the visualization in a 2D plane of similarities and differences among complex dynamical systems, or within the same system for various values of the control parameter [10,11].
Spichak et al. [12,13] used OPs to compute both entropy and FIM. They used the Fisher–Shannon plane to characterize the different dynamical regimes of 1D chaotic non-invertible iterative maps. The features of these maps were shown to be clearer and provide more detail in the Fisher–Shannon plane if computed based on OPs. They were able to distinguish families of chaos in these 1D maps. They found a universality pattern underlying similarities among the different maps, and they identified self-similar behavior as a function of the control parameters.
Recently, Nguyen et al. [14] introduced a new set of quantifiers (TARDYS after Temporal And Reversible DYnamical Symmetries) to extract approximate symmetries in the chaotic dynamics of a photonic neuron (diode laser with external optical feedback). They were able to distinguish different dynamical regimes and, by combining the TARDYS quantifiers with PE and FIM, create 2D landscapes that allowed for chaos characterization of 1D chaotic maps. This new technique allowed the forecasting of chaos-to-regular transitions as a function of the control parameter. These TARDYS quantifiers are associated with approximate dynamical symmetries, as they are calculated using the OPS, which are computed as relative values.
In this paper we extend the analysis of OP-based quantifiers to 2D chaotic iterative maps and show their power in classifying and distinguishing families of chaos. Our results support those found for 1D iterative maps and confirm the adequacy of these quantifiers to characterize 2D chaotic maps. We identify different families of chaos within several 2D iterative maps, and we anticipate transitions in dynamics. In addition to corroborating the suitability of these techniques to explore complex dynamics, and to extend them to 2D iterative maps, we also show how this technique reveals the temporal correlations for all points in phase space, and displays the evolution of these correlations as the control parameter is varied. Some characteristic features of the dynamical systems, like Koopman operators and strange attractors, are also uncovered by focusing on these dynamical correlations. It is worth mentioning that this is an easy to compute method that is suitable for experimental data and robust against noise.

2. Ordinal Patterns and Complexity Quantifiers

2.1. Ordinal Patterns (OPs)

Given a time series X = { x n : n N }, ordinal patterns are constructed from examining subsets of consecutive values of length D (dimension) by comparing their relative magnitudes. There are D ! possible patterns. For example, for patterns of dimension D = 3 , if x n < x n + 1 < x n + 2 , the subset corresponds to the pattern ‘012’ (or Word-1). For x n < x n + 2 < x n + 1 , we obtain pattern ‘021’ (Word-2), and so on (see Table 1).
Computing the probability of occurrence of the words (more probable words, less probable words, forbidden words) we can capture temporal correlations in the time series, which serve as a measure of the memory in the dynamical system. Based on these patterns, we compute different complexity quantifiers.

2.2. Permutation Entropy (PE)

Permutation entropy is the Shannon entropy of the probabilities of the words in a time series. It is a global measure of complexity defined as
P E = 1 ln D ! i = 1 D ! P i ln P i
Here, P i refers to the probability of word i. For a time series of length N, there are N D + 1 subsets of D consecutive values. PE is normalized, so that 0 P E 1 . Entirely random, unstructured processes have values of P E = 1 , whereas values closer to 0 indicate highly ordered and thus more deterministic processes involved.
One of the limitations of PE is that the time series needs to satisfy N D to be statistically significant. Also, because of the definition of the words, which only considers relative values, this method loses some information of the time series, but this filtering makes it also robust against experimental noise.

2.3. Fisher Information Measure (FIM)

For a discretized time series, the Fisher information measure is defined as
F I M = F 0 i = 1 D ! 1 ( P i + 1 P i ) 2
where F 0 = 1 if P i * = 1 for i * = 1 or i * = N ; and P i = 0 i i * . F 0 = 1 2 otherwise. FIM is normalized to give a value between 0 and 1, where values closer to 0 correspond to locally stochastic processes and values closer to 1 correspond to locally deterministic processes.
Here we use FIM based on OPs; that is, P i corresponds to the probability of word i. This has been shown to provide a more descriptive visualization of the structure of the dynamical system in the 2D complexity plane [11,12], allowing for a better classification and identification of dynamical regimes. In ref. [13], the authors showed the effect on FIM of the ordering of the words’ probabilities. Here we used the sorting array S A * with word order ‘ 241536 ’.

2.4. Temporal and Reversible DYnamical Symmetries (TARDYS)

Regular temporal structures present in the dynamics of a complex system should be related to some internal symmetries or constraints in the system. Identifying these symmetries in a chaotic system is challenging. Nevertheless, words themselves describe approximate (they are not exact as they use relative values) dynamical symmetries and trends. Also, combinations of words can describe other symmetries in the system [15]. TARDYS is a set of measures that, inspired in the natural dynamical symmetries of a photonic neuron [14], quantify the presence of some temporal symmetries.
T α = 1 | w 1 w α | T β = 1 | w 6 w β | T δ = 1 | P 2 P 3 | | P 4 P 5 | T ρ = 1 | P 1 P 6 | | P 2 P 4 | | P 3 P 5 |
where P i is the probability of word i, and w 1 = | P 1 1 6 | , w 6 = | P 6 1 6 | , w α = | ( P 2 1 6 ) + ( P 3 1 6 ) | , and w β = | ( P 4 1 6 ) + ( P 5 1 6 ) | . TARDYS quantifiers are bound to be between 0 and 1 (for a completely satisfied symmetry).
T α quantifies the probability of Word 2 and Word 3 being away from randomness ( P = 1 6 ), being compensated by the probability of Word 1 being away from randomness in the opposite direction. It is similar for T β with Word 4, Word 5, and Word 6. T δ quantifies the presence of the clusters P 2 = P 3 and P 4 = P 5 (also referred to as rotational symmetry), and T ρ quantifies the approximate reversibility of the dynamics of the system.

3. Hénon Map

We start our analysis by applying the quantifiers described in Section 2 to the 2D iterative Hénon map [16], defined as
x n + 1 = 1 a x n 2 + y n y n + 1 = b x n
where a and b are control parameters. Depending on these control parameters and the initial conditions ( x 1 , y 1 ), the system will show regular or chaotic behavior.

3.1. 1D Analysis: b = 0.3 , 1.0 a 1.4

A Hénon map is a 2D map [ x , y ] and has two control parameters, a and b. The most studied choice of parameters is for a = 1.4 and b = 0.3 as this presents chaotic dynamics. For other values, it can be chaotic, intermittent, or regular, depending on the initial values x 1 and y 1 . If we set one parameter as fixed, we can perform a 1D analysis as we vary the other one. We set b = 0.3 and scan 1.0 a 1.4 to compute the words’ probabilities, PE, and the TARDYS for these combinations.
A simple analysis of the words’ probabilities as a function of either control parameter shows that (i) the probabilities are not compatible with a stochastic process ( P i 1 6 ), therefore showing signatures of determinism, and (ii) the hierarchies of the words’ probabilities can distinguish regions of different dynamics within the chaotic regions, allowing for the identification of different families of chaos.
Figure 1a shows the bifurcation diagram for the Hénon map for b = 0.3 and 1 a 1.42 . It shows periodic windows of different periodicity, a period-doubling route to chaos, and different chaotic regions, as the control parameter a is varied. Figure 1b shows the corresponding words’ probabilities of dimension D = 3 . These probabilities are not equally probable ( P i 1 6 i ), plus there is one forbidden word ( P 6 = 0 , a ), indicating that the dynamics is not compatible with a stochastic process and are clearly deterministic. This last statement might sound obvious as the time series were generated with Equation (4), but it shows that it can help to distinguish stochasticity from determinism in an experimental time series for which there is no known model equation.
The hierarchies and relations among the words’ probabilities indicate different dynamics, even in the chaotic regions. The different regions of periodicity (around a 1.05 , around a 1.25 , around a 1.3 , …) show different hierarchies and clusters in the words’ probabilities. This indicates that the constraints and symmetries in these dynamics are different. On the other hand, the chaotic windows also show different hierarchies of the probabilities (around a 1.09 , around a 1.15 , around a 1.35 , …), indicating different families of chaos and different underlying approximate symmetries [14], and making the different families of chaos distinguishable.
Figure 2a shows the TARDYS quantifiers for the same region and parameters as Figure 1. These measures quantify the relevance of the different approximate temporal symmetries in the dynamics, where T ρ quantifies its reversibility. We can appreciate several dynamical regions based on the TARDYS quantifiers, indicated with vertical dotted lines in Figure 2a, which were also identified by the words’ probabilities in Figure 1b, but the TARDYS identifies the underlying symmetries of these different dynamical regions. In the first large region, despite including chaotic dynamics, all four TARDYS symmetries are perfectly represented. In the second region, reversibility and the rotational symmetry T δ drop but stay equal ( T ρ = T δ ) while the other two symmetries are highly present ( T α = T β ). In the third region, reversibility is low and T δ is also low, but T ρ T δ and T α = T β . There is a fourth region ( 1.22 a 1.28 ) that, despite reversibility and rotational symmetries being low, is stable and indicates a window of regularity.
Remarkably, as was also found by Nguyen et al. [14], these quantifiers also forecast the transition from chaos to regularity as we move along a. The region between the dashed lines in Figure 2a is zoomed-in in Figure 2c (Figure 2b is the corresponding bifurcation diagram for this zoomed-in region). This region is centered around a window of periodicity. T α β = T α T β identifies, within the chaotic regions, when the dynamics is going to turn from chaotic to regular. T α β 0 in the window of periodicity, but this condition is also satisfied in the chaotic region right when the control parameter approaches this periodic window. Meanwhile T α β = 0 for the rest of the range. This loss of symmetry is a good precursor of a dynamical transition.

3.2. Two-Parameters Analysis

Because the Hénon map depends on two control parameters (a and b), it is of interest to characterize its dynamics as a function of their values. We scan 0 a 2 and 0.5 b 0.5 using the same initial conditions ( x 1 = 0.1 and y 1 = 0.3 ). It is worth mentioning that we explored several sets of initial conditions and, although the quantifiers studied were (slightly) different, the analysis does not change qualitatively (see Appendix A).
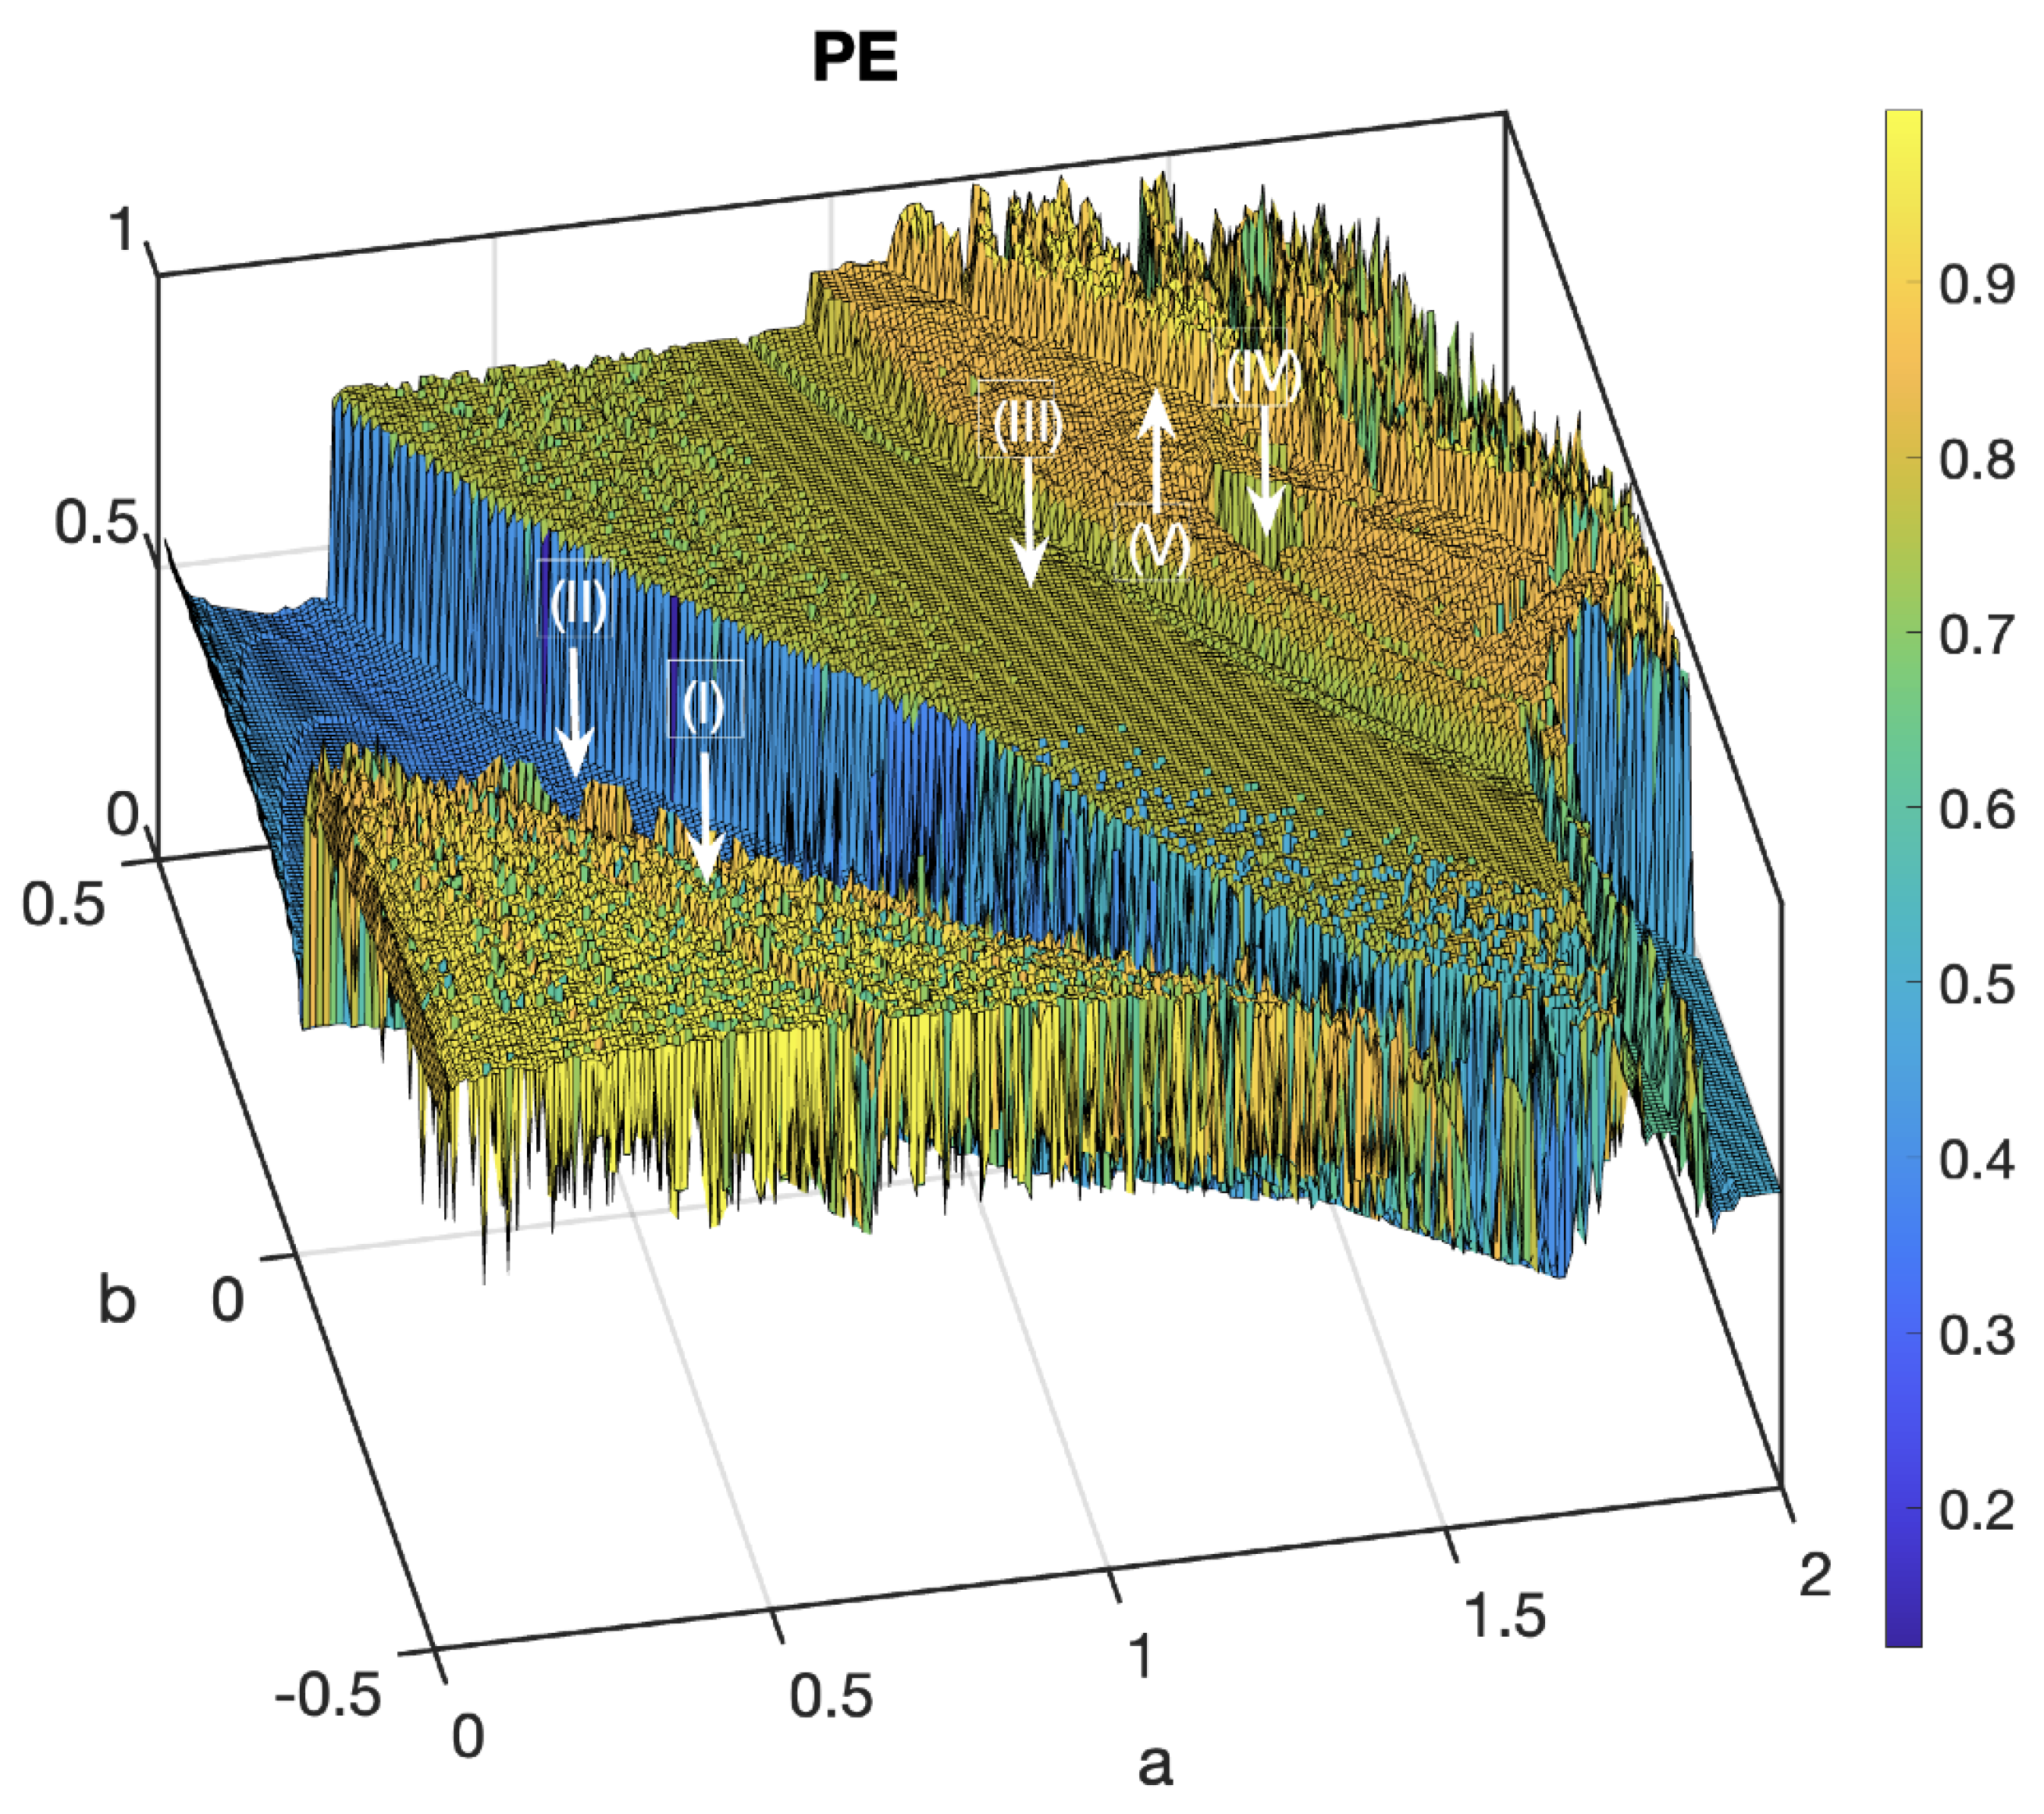
Figure 3 shows the permutation entropy as a function of a and b. PE identifies different dynamical regions where entropy is stable to changes in any of the two parameters (regions II or III, for example). There are other regions (I or IV, for example) that are very sensitive to small changes in the parameters set. Different PE plateaus also classify different dynamical families. All these regions are related to different combinations and intensities of the approximate TARDYS symmetries, as can be seen in Figure 4, and therefore related to different constraints or symmetries.
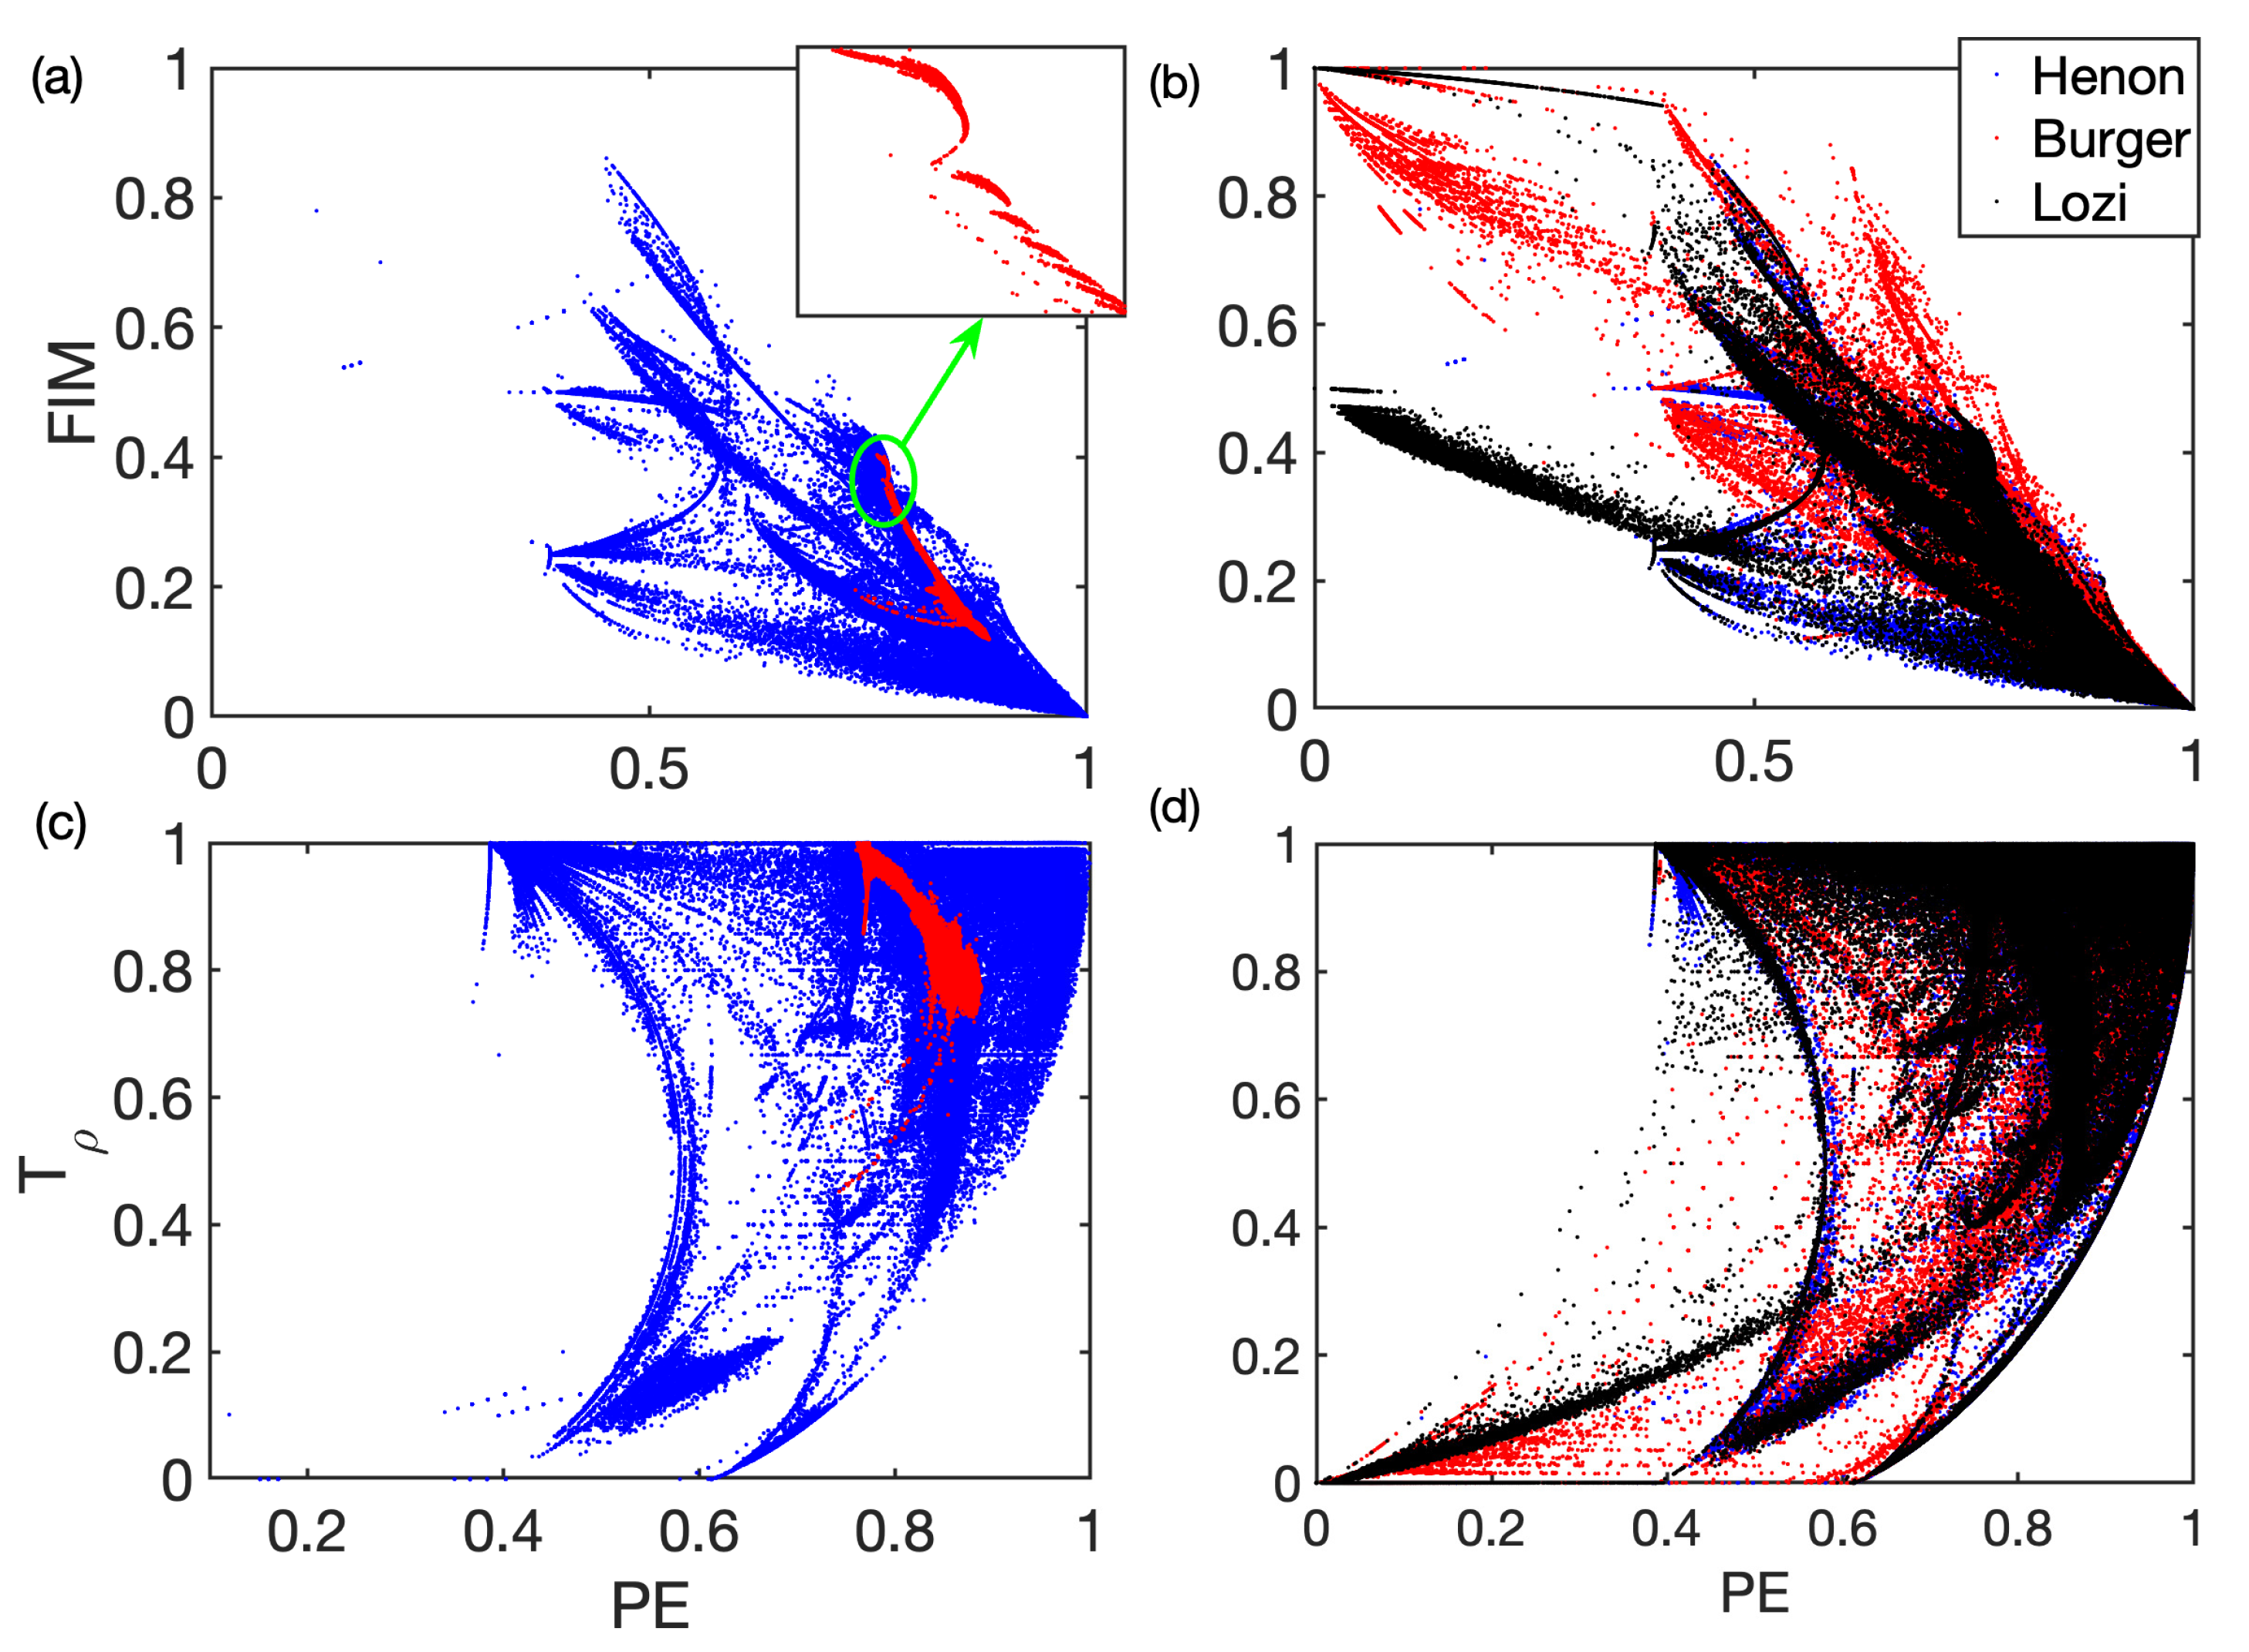
As indicated above, combinations of suitable quantifiers can provide a richer 2D analysis tool [17,18,19]. FIM and PE project the dynamical system on a plane as one parameter is varied (see Figure 5a). Each combination of parameters, a and b, is shown as a dot on the plane. As a and b change, the system explores the 2D FIM-PE plane. It is expected that, for highly chaotic dynamics, the system will explore the bottom-right corner of the plane (high entropy and low Fisher information measure). Nevertheless, the system does not wander randomly on the plane for the Hénon map, but on the contrary, the fingerprint on the FIM-PE plane shows a clear structure. Red dots in Figure 5a indicate a narrower region around b = 0.3 ( 1.0 a 1.4 , 0.299 b 0.301 ). The inbox is a detail of the region inside the green circle in the main figure, which highlights the non-trivial structure on this plane, revealing features of the evolution of the dynamics as a is varied and suggesting self-similar features related to the period-doubling route to chaos of the system.
Figure 5c shows the complexity plane between T ρ and PE, which presents the same complex structure characteristic of this map but with a different 2D signature. The trajectories of the map on these planes are related to the different dynamical regions identified with the words, PE, and the TARDYS.
The ability of these complexity measures is found in other 2D iterative maps. In the Appendix A, we show the permutation entropy and the TARDYS symmetry T δ for the Burger and the Lozi maps. They distinguish regions with different complex dynamics and the corresponding dynamical symmetries present (or absent) in the regions.
Figure 5b,d shows the FIM-PE and reversibility-PE landscapes for the Hénon, Burger, and Lozi maps. Aside from the clear structure in all three 2D iterative maps, these planes show clear similarities in the dynamics of all three maps, indicating regions with the same dynamical symmetries as well as some individual characteristic dynamics where the fingerprints do not overlap. A similar result was found by Spichak et al. [12] when studying 1D non-invertible iterative maps. There, the studied maps shared a common underlying signature while some of them also presented more detailed structure.
These results extend those found for 1D iterative maps [12,13] and show that they are not unique to 1D maps or to the ones studied in previous works, and this technique is also powerful even with the richer structure of 2D maps. It also shows that the parameter-space of these maps shows clear correlations that are captured by studying the temporal patterns of their time series. It is worth mentioning that these quantifiers do not require a known model to be computed, but only the time series of the dynamics of the system is required, making this a suitable technique for experimental data. Also, because of the nature of the quantifiers, based on the ordinal patterns, it is robust against experimental noise.

3.3. Initial Conditions Analysis

Dynamical systems such as the Hénon map are two dimensional, and henceforth they depend on two variables [ x , y ] . For any given set of the control parameters (a and b in this case), the dynamics can be different depending on the initial conditions [ x 1 , y 1 ] . Next, we present a characterization of the dynamics depending on the initial conditions for the Hénon map.
Figure 6 shows the PE for the positions’ landscape ( 2 x , y 2 ) for four different sets of values of the control parameters, corresponding to the ones indicated in Figure 3 ( I [ a = 0.5 ; b = 0.25 ] , I I [ a = 0.5 ; b = 0.0 ] , I I I a = 1.15 ; b = 0.15 , I V [ a = 1.5 ; b = 0.15 ] , and V [ a = 1.4 ; b = 0.3 ] ). These plots identify which initial conditions share similar behavior in their dynamical evolution and differentiate spatial regions.
While the combination of parameters in region I (Figure 6a) is very sensitive to the initial conditions, and the entropy of the dynamics of a trajectory can be manifestly different from that of a neighbouring trajectory, the combinations of parameters in region I I (Figure 6b) is very robust, although there are three differentiated dynamical regions for that parameter set.
Figure 6c captures the Hénon map’s strange attractor (shown in perspective to highlight it). This region shows a lower value of PE than the surrounding area, and is stable (the same for all initial conditions within that region). The surrounding region is more sensitive to the initial conditions, and PE varies quickly as we choose slightly different initial conditions. The fact that PE can track the strange attractor can be interpreted as the system being attracted to a PE-stable region. This (unexpected) result cannot be found in 1D maps as they only have one coordinate
Figure 6d resembles the Koopman mode found by Zhang et al. [20] for the Hénon map. Koopman operators describe the evolution of functions defined in the phase space of a dynamical system, and their eigenvalues and eigenfunctions capture global aspects of the dynamics of the system. The advantage of PE (and TARDYS and combinations) is the simplicity of its computation. While the Koopman operators depend on the functions defined, the coarse grain of the chosen partition and its computation lacks a systematic procedure, PE and TARDYS only require the time series of the dynamical system. Even more, PE and TARDYS discard the actual value of the time series and only consider relative values among consecutive iterations.

4. The Standard Map

We conclude our analysis by studying Chirikov’s standard map. It is a well-known 2D iterative map that presents regular as well as chaotic trajectories depending on the initial conditions. Depending on the control parameter K, the whole phase space can present regular trajectories ( K 0 ), fully chaotic trajectories ( K ), or mixed trajectories ( 1 K 6 ) that can change from regular to chaotic depending on a small change in the initial conditions.
The Chirikov standard map is a 2D area-preserving map defined by:
p i + 1 = p i + K s i n ( θ i ) ; m o d ( 2 π ) θ i + 1 = θ i + p i + 1 ; m o d ( 2 π )
The dynamics is restricted to 0 θ , p 2 π , and the parameter K is the nonlinear kick strength. For K = 0 the system is linear, in the whole space, and the dynamics periodic. As K increases, the dynamics can be periodic or chaotic, depending on the position in phase space. As K increases, the proportion of phase space that behaves chaotically also increases, and so does the Lyapunov exponent.
Figure 7 shows the Fisher–Shannon complexity plane for different values of the nonlinear intensity between 10 6 K 10 . Figure 7d shows several K values simultaneously, displaying the whole structure of the standard map on this complexity plane. When the system is linear, the fingerprint on the complexity plane is a clear trajectory covered as we scan the phase space (Figure 7a). These well-defined curves are characteristic of the temporal correlations in the dynamics of all points in the phase space for K = 0 .
As K increases, this fingerprint starts to evolve. The initial curve starts to “break down” at a localized small region (Figure 7b) in the complexity plane. This breakdown area is related to the area in phase space where the dynamics starts to become chaotic. As K continues to increase, the original curve starts to fade away, the perturbed part of the curve increases, and the complexity plane starts to occupy the bottom-right area, as expected for a more chaotic dynamics. For intermediate values of K, (Figure 7f) the plane shows the coexistence of regular dynamics and chaotic dynamics. For very large values of the control parameter, the whole dynamics is represented by a lump at F I M 0 and P E 1 (inbox in Figure 7d shows K = 10 ). This is a novel visual way to see the evolution of the map transition from a purely regular phase space to a purely chaotic phase space.
Computing PE for the phase space also provides information about the different dynamical regions present for each K. Regions with constant PE, or regions with smoothly varying PE, or regions with sharp changes in PE identify areas of different dynamics and approximate symmetries. Similar to what we saw in Figure 6 for the Hénon map, Figure 8 shows PE for the standard map for a range of K values. For K 0 , the dynamics are regular in all phase space. PE varies smoothly and shows mirror symmetry around p = 0 . As K increases, the complexity of the landscape of PE also increases and shows clear differentiated regions. K = 1 distinguishes clearly regions of regularity and chaos. For K = 5 , almost all phase space presents chaos except for two small islands of regularity.

5. Conclusions

We have analyzed 2D iterative chaotic maps using a battery of complexity quantifiers aiming at characterizing their complex dynamics. All the quantifiers are based on the ordinal patterns method introduced by Bandt and Pompe [5], referred to as words here. This method relies on temporal correlations defined by comparing consecutive values in a time series. Despite losing the information of the actual value of the data, it is shown to be powerful as it retains the relevant information about the dynamics and discards somewhat redundant information.
PE is informative of the complexity of the dynamics of a time series. Nevertheless, the words’ probabilities (that are required to compute PE) are more descriptive as they are six quantifiers (for D = 3 ) and can distinguish dynamics with different hierarchies of the words but the same PE.
Based on the words’ probabilities, we calculate the TARDYS quantifiers for the studied 2D iterative maps. These novel measures quantify hidden (approximate) temporal symmetries. In the analysis of the Hénon map, the TARDYS quantifier T α β is shown to be a good precursor identifier for chaos-to-regular transitions
The combination of two quantifiers portrays the complex system in a two-dimensional landscape where identifying similar and different regimes becomes easy and intuitive. FIM versus PE and T ρ versus PE display clear fingerprints for the studied 2D iterative maps. They place the dynamical system in a 2D landscape and its evolution as the control parameters are varied. This allows us to see the parametric evolution of the system, as well as to find similarities and differences among the dynamics of the same or different complex systems.
In addition to extending the finding of 1D maps to 2D maps (with more diverse dynamics), we have shown how PE, TARDYS, and combinations of them (i) display the evolution of the temporal correlations in phase space and (ii) unveil characteristic features of the dynamical systems such as strange attractors or Koopman modes.
Finally, it is worth noting that these quantifiers can be computed for any time series, and do not require prior knowledge of the equations that generate the dynamics. There is no need to propagate partial differential equations, as for the Lyapunov exponent, and the procedure is systematic, unlike the calculation of Koopman modes. The fact that words are computed based on relative values makes these quantifiers suitable for experimental data and robust against noise.
In this work, we have used PE as one of the key complexity quantifiers, and combinations of PE with other quantifiers (FIM and TARDYS). There are other complexity quantifiers worth exploring in order to identify and highlight the features of the complex dynamics of a dynamical system. For example, weighted PE [21] tries to incorporate part of the information lost in PE by weighting the words’ probabilities. This might be of interest if studying spiking time series, which is not the case in this study. Rényi permutation entropy [22], which includes a bias parameter that can privilege rare events, or salient events, is another entropy measure to explore. For noisy time series, permutation min-entropy [23] is another entropy quantifier that can be explored. We think that comparing different entropies with our approach is worth exploring to find the optimum set of tools for the different families of dynamics. Nevertheless, the goal of this paper is to show the power and simplicity of using PE, FIM, and TARDYS to unveil and classify complex dynamics, and we leave that for future research.
We have demonstrated the suitability of these measures in 2D systems that can characterize the dynamics based on control parameters and also based on phase space. We think that they can be powerful in identifying features of complex dynamics in a broad range of dynamical systems in nature as well as in helping better understand abstract chaotic systems, independent of the number of parameters and dimensionality. It will be of special relevance in experimental data, as no model is required to compute the quantifiers used here, and these are robust against experimental noise.

Author Contributions

Conceptualization, A.A.; methodology, A.A.; software, B.S.N. and A.A.; validation, B.S.N. and A.A.; formal analysis, B.S.N. and A.A.; investigation, B.S.N. and A.A.; resources, A.A.; data curation, B.S.N. and A.A.; writing—original draft preparation, B.S.N.; writing—review and editing, A.A.; supervision, A.A.; funding acquisition, A.A. All authors have read and agreed to the published version of the manuscript.

Funding

This research was funded by Eastern Washington University through the internal “Research and Creative Works 2023” grant.

Data Availability Statement

The data that support the findings of this study are available upon reasonable request from the authors.

Conflicts of Interest

The authors declare no conflict of interest.

Appendix A

Figure A1 shows the permutation entropy (a,c) and the TARDYS quantifier T δ (b,d) for the Burger map (a,b) and the Lozi map (c,d). It is clear that these quantifiers can distinguish regions with different complex dynamics and identify the dynamical symmetries present, or lacking, in those regions. Both maps show regions where PE and T δ are stable or change smoothly, and other regions where there complexity quantifiers are very sensitive to the values of the control parameters a and b.
Figure A1. PE (a,c) and T δ (b,d) versus the control parameters a and b for the Burger map (a,b) and the Lozi map (c,d).
Dynamics 03 00040 g0a1

References

  1. Tsonis, A.A.; Elsner, J.P. Nonlinear prediction as a way of distinguishing chaos from random fractal sequences. Nature 1992, 358, 217–220. [Google Scholar]
  2. Rosso, O.A.; Larrondo, H.A.; Martin, M.T.; Plastino, A.; Fuentes, M.A. Distinguishing Noise from Chaos. Phys. Rev. Lett. 2007, 99, 154102. [Google Scholar]
  3. Amil, P.; Soriano, M.C.; Masoller, C. Machine learning algorithms for predicting the amplitude of chaotic laser pulses. Chaos 2019, 29, 113111. [Google Scholar]
  4. Bianconi, G.; Arenas, A.; Biamonte, J.; Carr, L.D.; Kahng, B.; Kertesz, J.; Kurths, J.; Lu, L.; Masoller, C.; Motter, A.E.; et al. Complex systems in the spotlight: Next steps after the 2021 Nobel Prize in Physics. J. Phys. Complex 2023, 4, 010201. [Google Scholar]
  5. Bandt, C.; Pompe, B. Permutation Entropy: A Natural Complexity Measure for Time Series. Phys. Rev. Lett. 2002, 88, 174102. [Google Scholar]
  6. Zanin, M.; Olivares, F. Ordinal patterns-based methodologies for distinguishing chaos from noise in discrete time series. Comm. Phys. 2021, 4, 1038. [Google Scholar]
  7. Leyva, I.; Martínez, J.H.; Masoller, C.; Rosso, O.A.; Zanin, M. 20 years of ordinal patterns: Perspectives and challenges. Eur. Phys. Lett. 2022, 138, 31001. [Google Scholar]
  8. Vignat, C.; Bercher, J.F. Analysis of signals in the Fisher–Shannon information plane. Phys. Lett. A 2003, 312, 27–33. [Google Scholar]
  9. Parlitz, U.; Berg, S.; Luther, S.; Schirdewan, A.; Kurths, J.; Wessel, N. Classifying cardiac biosignals using ordinal pattern statistics and symbolic dynamics. Comp. Biol. Med. 2012, 42, 319–327. [Google Scholar]
  10. Ravetti, M.G.; Carpi, L.C.; Goncalves, B.A.; Frery, A.C.; Rosso, O.A. Distinguishing Noise from Chaos: Objective versus Subjective Criteria Using Horizontal Visibility Graph. Comp. Biol. Med. 2014, 9, 108004. [Google Scholar]
  11. Olivares, F.; Plastino, A.; Rosso, O.A. Contrasting chaos with noise via local versus global information quantifiers. Phys. Lett. A 2012, 376, 1577–1583. [Google Scholar]
  12. Spichak, D.; Kupetsky, A.; Aragoneses, A. Characterizing complexity of non-invertible chaotic maps in the Shannon–Fisher information plane with ordinal patterns. Chaos Sol. Fract. 2021, 142, 110492. [Google Scholar]
  13. Spichak, D.; Aragoneses, A. Exploiting the impact of ordering patterns in the Fisher-Shannon complexity plane. Chaos Sol. Fract. 2022, 154, 111620. [Google Scholar]
  14. Nguyen, N.; Pattanayak, A.K.; Aragoneses, A. TARDYS Quantifiers: Extracting Temporal and Reversible DYnamical Symmetries. Photonics 2022, 9, 938. [Google Scholar]
  15. Bandt, C. Small Order Patterns in Big Time Series: A Practical Guide. Entropy 2019, 21, 613. [Google Scholar]
  16. Hénon, M. A two-dimensional mapping with a strange attractor. Comm. Math. Phys. 1976, 50, 69. [Google Scholar]
  17. Yao, W.; Yao, W.; Wang, J.; Dai, J. Quantifying time irreversibility using probabilistic differences between symmetric permutations. Phys. Lett. A 2019, 383, 738. [Google Scholar]
  18. Olivares, F.; Zanin, M.; Zunino, L.; Pérez, D.G. Contrasting chaotic with stochastic dynamics via ordinal transition networks. Chaos 2020, 30, 063101. [Google Scholar]
  19. Silva, A.S.A.; Menezes, R.S.C.; Rosso, O.A.; Stosic, B.; Stosic, T. Complexity entropy-analysis of monthly rainfall time series in northeastern Brazil. Chaos Sol. Fract. 2021, 143, 110623. [Google Scholar]
  20. Zhang, C.; Li, Y. Koopman Operator and Phase Space Partition of Chaotic Map. Chaos 2020, 32, 063132. [Google Scholar]
  21. Fadlallah, B.; Chen, B.; Keil, A.; Príncipe, J. Weighted-permutation entropy: A complexity measure for time series incorporating amplitude information. Phys. Rev. E 2013, 87, 022911. [Google Scholar]
  22. Zhao, X.; Shang, P.; Huang, J. Permutation complexity and dependence measures of time series. Europ. Phys. Lett. 2013, 102, 40005. [Google Scholar]
  23. Zunino, L.; Olivares, F.; Rosso, O.A. Permutation min-entropy: An improved quantifier for unveiling subtle temporal correlations. Europ. Phys. Lett. 2015, 109, 10005. [Google Scholar]
Figure 1. (a) Bifurcation diagram of the Hénon map for b = 0.3 , scanning between 1.0 a 1.4 . (b) Words’ probabilities of dimension D = 3 ( w 1 = 012 , w 2 = 021 , w 3 = 102 , w 4 = 201 , w 5 = 201 , and w 6 = 210 ) for the range of parameters as (a). Words’ probabilities capture the different dynamical regimes, from chaos to regularity, but can also capture different kinds of periodicity, as well as capture dynamical constraints in the chaotic regions, distinguishing among different families of chaos.
Dynamics 03 00040 g001
Figure 2. (a) TARDYS quantifiers (see Equation (3)) for the Hénon map. The regions between the vertical dotted lines indicate regions with different dynamics. The region between the red dashed lines is zoomed-in in (c). (b) Bifurcation diagram for the zoomed-in region, which presents a small window of periodicity anticipated by T α T β .
Dynamics 03 00040 g002
Figure 3. Permutation entropy (PE) for the Hénon map for the range 0 a 2 and 0.5 b 0.5 with initial conditions as in previous figures. Differentiated regions (I to V) identify regions with different dynamics and temporal constraints.
Dynamics 03 00040 g003
Figure 4. TARDYS quantifiers for the Hénon map for the same region as Figure 3. (a) T α , (b) T β , (c) T δ , and (d) T ρ .
Dynamics 03 00040 g004
Figure 5. (a) FIM versus PE for the Hénon map. 0 a 2 ; 0.5 b 0.5 , [ x 1 = 0.1 , y 1 = 0.3 ] . (c) Reversibility T ρ versus PE. Red dots indicate a narrow region: 1 a 1.4 ; 0.299 b 0.301 , as seen in Figure 1. (b) FIM versus PE for the Hénon (blue), Burger (red), and Lozi (black) maps. (d) T ρ versus PE. They all show clear overlap, indicating that some regions in parameter space present the same dynamics and the same underlying symmetries.
Dynamics 03 00040 g005
Figure 6. PE for the Henón map for the position space 2 x , y 2 for four different combinations of the control parameters a and b. (a) a = 0.5 ; b = 0.25 , (b) a = 0.5 ; b = 0.0 , (c) a = 1.5 ; b = 0.15 , (d) a = 1.4 ; b = 0.3 .
Dynamics 03 00040 g006
Figure 7. FIM versus PE plane for the Standard map for different values of the control parameter K. The figure is computed scanning 10 4 states in the whole [ θ , p ] phase space between K = 10 6 and K = 10 . (a) K = 10 6 . (b) K = 10 3 . (c) K = 0.1 . (e) K = 0.5 . (f) K = 1 . (d) K = 10 6 to K = 10 on the same FIM-PE plane.
Dynamics 03 00040 g007
Figure 8. Landscapes of PE on phase space for the standard map for different values of K. (a) K = 10 6 . (b) K = 10 3 . (c) K = 0.1 . (d) K = 0.5 . (e) K = 1 . (f) K = 5 .
Dynamics 03 00040 g008
Table 1. Possible ordinal patterns for D = 3 and their associated words.
PatternWord
‘123’1
‘132’2
‘213’3
‘231’4
‘312’5
‘321’6
Disclaimer/Publisher’s Note: The statements, opinions and data contained in all publications are solely those of the individual author(s) and contributor(s) and not of MDPI and/or the editor(s). MDPI and/or the editor(s) disclaim responsibility for any injury to people or property resulting from any ideas, methods, instructions or products referred to in the content.