Article

Effect of Channel Roughness on Micro-Droplet Distribution in Internal Minimum Quantity Lubrication

Engineering Technology & Industrial Distribution Department, Texas A&M University, College Station, TX 77843, USA
*
Author to whom correspondence should be addressed.
Dynamics 2022, 2(4), 336-355; https://doi.org/10.3390/dynamics2040019
Submission received: 22 July 2022 / Revised: 7 October 2022 / Accepted: 9 October 2022 / Published: 14 October 2022
(This article belongs to the Special Issue Numerical Study of Minimum Quantity Lubrication)

Abstract

:
This research studied the effect of channel roughness on micro-droplet distributions in internal minimum quantity lubrication for effective machining. Mixtures of different oils and air were flown though internal channels with simulated different roughness: as fabricated, partially threaded, and fully threaded. The airborne droplets were collected, analyzed, and compared with simulated results by computational fluid dynamics. For low-viscous lubricant, the rough channel surface helped to break large droplets in the boundary layer into smaller droplets and reintroduce them into the main downstream flow. The opposite trend was found for the higher viscous lubricant. The study also performed chemical etching to roughen selected surfaces of carbide cutting tools. The synergy of hand and ultrasonic agitation successfully roughened a carbide surface within twelve minutes. Scanning electron microscopy examination showed deep etching that removed all grinding marks on a WC–Co cutting tool surface.

1. Introduction

Machining operations use lubrication to mitigate heat and friction, thus decreasing tool wear and delivering precise workpieces. It is very difficult to direct coolant to the cutting edge of a drill bit in a high-aspect-ratio drilling operation using traditional external lubrication techniques. Lack of adequate lubrication leads to large frictional forces that cause accelerated tool wear and less precision in machining operations. Traditional methods, such as flood cooling, spray large amounts of lubrication across the cutting surface. Although coolant may not reach the tool chip interface, it removes heat through convection and conduction from the tool and machined workpiece. One of the disadvantages of flood lubrication is the need for a secondary system to capture, filter, and dispose of used lubricant after machining.
Minimum quantity lubrication (MQL) delivers micro-droplets of lubricant directly to the cutting zone using external or internal delivery methods. In drilling operations, internal channels aim fluid directly at the cutting edge of the drill bit. The utilization of MQL, therefore, decreases operating costs since lubrication is required for machining. Another advantage of MQL is its environmentally friendliness when eliminating treatment and disposal of used cutting fluid.
Previous studies involving MQL largely focused on the effects of different MQL lubricants and mist parameters on tool life and workpiece quality using external delivery methods. Studies have shown that decreased microdroplet size increases wettability and machining quality. Few studies were found for internal MQL that described the resulting droplets and droplet distribution due to different shape and size of coolant channels. Limited experimental work has been performed to show the effect of channel surface roughness on droplet size, its distributions and machining operations. A more comprehensive study on the impact of channel surface roughness, therefore, is sought. The objectives of this research were to:
(i).
Characterize the effect of channel surface roughness and air flow on MQL droplet size.
(ii).
Study methods of modifying the surface of WC–Co drill channels to improve high aspect ratio drilling performance.
(iii).
Compare experimental data with those from computer simulation.

2. Literature Review

This section reviews the principles of MQL and MQL systems, and how droplet distribution and droplet size are affected due to channel geometry and properties of a lubricant. The impacts of MQL on machining and different technologies to control surface roughness of tool material are then presented.

2.1. MQL and Systems

Efforts to reduce the consumption of lubricants have been driven by economic and environmental concerns. Lubrication techniques are deployed to remove heat, control tool wear, and aid in chip removal during machining operations. At low cutting speed flood coolant achieves all three of these objectives, but as the cutting speed increases a flood coolant becomes ineffective since it cannot reach the cutting zone [1]. MQL has emerged as a way to reduce the amount of coolant used and increase lubrication performance at high machining speeds. It uses a pressurized mix of air and lubricant sprayed directly onto the cutting zone. MQL can be administered externally using nozzles positioned above the workpiece, or internally by through-tool delivery. In machining applications, MQL has become increasingly popular as it decreases manufacturing costs, reduces negative environmental impacts, simplifies cleaning processes, and increases tool life [1,2]. Smaller MQL droplets provide better lubrication which decreases tool wear and leads to smoother surfaces and quality of the machined workpiece [3].
The two main system designs for MQL are single and dual channels. In a single-channel system, the lubricant and pressurized air are mixed externally and then routed through the system spindle [2]. External mixing is performed using a metering pump or pressurized tank [4]. The metering pump method utilizes a positive displacement micro pneumatic pump to connect the lubricant flow with an air blast nozzle. Oil volume is controlled by the pump speed. The pressurized tank method uses a pressurized lubricant tank and venturi nozzle to mix the aerosol solution. The oil quantity delivered is adjusted by the tank pressure. In such a single-channel system, the rate of oil delivery is dependent on the air flow rate [4]. In a dual-channel system, air and lubricant are routed through the system in separate channels, and the two streams are mixed together near the tool point, or system outlet [2]. The rate of oil delivery is controlled using a positive displacement pump with a built-in speed controller, or a pressurized oil tank with a metering valve [4]. In a dual-channel system, the oil delivery rate is independent of the air flow rate.
Both systems have advantages and disadvantages. Single-channel setups are much less expensive than dual, and they are popular in sawing operations as dimensional tolerances are more relaxed and the surface roughness is not an important control metric. The drawbacks of single-channel systems include large lubricant droplets due to the longer travel of the aerosol mixture, and instability of mist quality due to the effect of inertial and centrifugal force when delivered to the tool tip [2]. Dual-channel setups offer a more robust lubricant delivery. They result in less dispersion of the aerosol mixture and deliver finer and more uniform mist than single-channel systems. The biggest disadvantage of dual-channel systems is the added cost when compared with a single channel.
Race et al. [5] and Hwang et al. [6] compared MQL and flood coolant using face milling and turning of steels, respectively. The authors concluded that:
  • MQL reduced tool flank wear and surface roughness of machined parts.
  • MQL resulted in a 1.5 kW reduction in peak milling machine power when compared with flood coolant. This showed that MQL was more economic than flood coolant not only because of the reduction in lubricant used, but a reduction in energy consumption as well.
  • Smooth surfaces were achieved at a higher feed rate using MQL as compared with flood coolant (0.02 mm/rev and 0.01 mm/rev, respectively).
  • MQL and flood coolant resulted in similar cutting forces (approximately 200 N), but MQL achieved a 30% reduction in surface roughness of workpieces when compared with those with flood coolant.
Khan et al. [3] experimentally studied the micro-droplet distributions created with polished (3.2 µm Ra) and rough (16.8 µm Ra) channel through-tool MQL. Three tests were conducted using 275 kPa, 415 kPa, and 550 kPa inlet air pressures [3]. Table 1, interpreted from the results of this study, shows that as the surface roughness increased in the nozzle channel, the resultant average droplet diameter decreased. The air pressure also affected the droplet size. At lower pressures, larger droplets were formed.
Tasdelen et al. [7] studied MQL versus emulsion lubrication in drilling operations using through-tool delivery. Optical images showed that MQL led to less tool wear. Smoother surface finish in the drilled holes were achieved using MQL (1 µm Ra) compared with emulsion (1.4 µm Ra).
Maruda et al. [8,9] studied MQL emulsion mist generation by characterizing the effect of air flow, emulsion flow, and nozzle to workpiece distance on the size and count of micro-droplets. In this study, water soluble OPORTET RG-2 emulsion, commonly used in milling, turning, and threading operations, was tested at a 2% concentration in water. The results showed that air flow rate and the distance between the nozzle and cutting zone had the most significant impact on droplet diameter in the range 13–23 µm. An increase in either caused the droplet size to decrease and count to increase. Changes in emulsion flow, however, had less impact on the droplet distributions.

2.1.1. Effect of Internal Channel Geometry

Past studies characterized the effects that channel shape and size have on droplet distributions in internal MQL. Raval et al. [10] compared straight versus helical channels and concluded that straight channels experienced annular flow due to high velocity in the axial direction. This led to higher momentum in the axial direction than the radial momentum generated by centrifugal force from drill rotation. In the helical channels, no annular flow was recorded. These channels generated secondary vortices within that disrupted the annular distribution.
Raval et al. [11] and Kao et al. [12] also compared circular versus triangular channels using multiple channel sizes. Circular channels showed high mist concentration at the outer edges of the channel and low concentration in the center. This created annular flow in which air traveled through the center of the channel and lubricant along the outer walls. Triangular channels showed high mist concentrations at the vertices, and low concentration in the center of the channel. The reversed triangle channels mirrored the results of the triangular channels, as the mist distributions shifted 180°. This proved that droplet distribution depended on the channel orientation. Circular channels resulted in higher air speeds than the triangular. Larger channels showed higher air speeds overall while smaller channel sizes experienced increased droplet coalescence, which caused mist to transition to lubricant flow. These simulations concluded that channel shape and orientation affected the mist distribution.

2.1.2. Effect of Oil Type

Many researchers classified the effects of oil types on machinability using MQL systems. Yildrim et al. [13] used nickel-based super alloy in milling operations to test the effects of four different oil types on machinability. The results of this experiment showed that vegetable oil achieved the longest tool life, and tool life decreased with synthetic, mineral, and synthetic-mineral based oils, respectively. Vegetable oil performed best because its surface tension and viscosity allowed better penetration of the lubricant into the cutting zone; therefore, it enhanced lubrication between the tool and workpiece. When compared with the other three oil types, the vegetable-based oils formed a thin and lasting layer of lubricant in the cutting zone, reduced cutting force and friction, and prolonged tool life for better machinability.
Tai et al. [14] compared nine different cutting fluids (biodegraded esters, renewable acid esters, naturally derived synthetic, vegetable based, vegetable based + sulfurized EP, natural fatty oils, and synthetic ester listed in order of increasing viscosity) in terms of physical properties, bench tests, and machining tests. It was determined that water based traditional machining lubricants had higher thermal conductivity than common MQL fluids. As viscosity increased, thermal conductivity also increased in MQL fluids. Common MQL lubricants had lower contact angles and better wettability when compared with water-based lubricants; the latter had poorer lubricity as they resulted in higher tapping torques compared with MQL fluids. Distribution testing showed that MQL formed smaller airborne droplets when compared with wet machining (2.90–4.07 µm and 5–10 µm, respectively). The major conclusions from these findings were as follows:
  • Low viscosity resulted in high wettability, high mist concentration, and larger droplet diameters.
  • Large mist diameters correlated with less energy consumption, smoother surface finish, and more accurate machined dimensions.
  • Higher wettability led to better dimensional accuracy.

2.1.3. Effect of MQL on Machining

The effects of MQL in turning, milling, micromilling, and drilling have been studied by many researchers [3,15,16,17,18,19,20,21,22,23,24,25]. Comparisons have been drawn between dry machining, flood lubricant, and MQL. The results of those studies are detailed below:
  • In drilling, dry machining resulted in a much shorter tool life when compared with MQL (0.2 mm of tool wear at cumulative drilling depths of 100 mm and 450 mm, respectively) due to tool chipping, high temperatures, and increased frictional force [16]. Davim et al. [17] showed that after drilling AA1050 aluminum, the resulting surface roughness measurements were approximately 3.5 µm, 2 µm, and 1.5 µm Ra for dry, flood coolant, and MQL, respectively, after drilling at 0.15 mm/rev feed rate and 75 m/min cutting speed. In these experiments, MQL was achieved using fluid deliveries in order of mL/h compared with L/h for flood coolant.
  • In milling, MQL was more effective than flood coolant as it led to an approximately 50 N reduction in cutting force due to a reduction in adhesion and frictional forces at a high cutting speed of 3500 m/min [18]. Iskandar et al. [19] studied the effect of air and oil flow rate and nozzle distance from the cutting zone on external MQL flow characteristics. Particle image velocimetry and phase Doppler anemometry visualization methods were used to characterize the external MQL flow. Air flow rates of 20, 25, 28, 31 L/min and oil flow rates of 10, 17.5, 24 mL/min were tested. The study showed that as air and oil flow rate increased, flow velocity increased. As the distance from the nozzle to the cutting zone increased the flow velocity decreased, and the droplet size and count also decreased. The optimal MQL spray was obtained by combining the maximum air flow rate (31 L/min) and minimum oil flow rate (10 mL/min), generating a large number of 50µm-droplets at a distance 40 mm away from the nozzle. The effects of MQL, compressed air, dry, and flood coolant in milling operations of carbon fiber reinforced plastic composites were performed. Various combinations of MQL air and oil flow rates showed similar tool temperatures (only 7% variation). The study found that the optimal MQL spray generated temperatures on the high end of the dataset while feed force was the same for MQL and flood coolant. Tool wear was 20–30% less using MQL when compared with cooling methods using flood, dry, or compressed air. The optimal MQL spray generated the lowest tool wear (17% less than other MQL combinations). MQL also held better dimensional accuracy than flood coolant, with the optimal spray satisfying the tool requirement of ±10 µm.
  • In micromilling, MQL was studied to compare the effect of droplet size and air speed on surface roughness and tool wear [3]. High pressurized MQL (550 kPa) increased air speed, and when paired with a rough lubricant delivery channel (16.8 µm Sa) a Ø5 µm average droplet size was achieved. Low pressurized MQL (275 kPa) decreased air speed, and when paired with a smooth lubricant delivery channel resulted in a Ø9 µm average droplet size. At a milling distance of 20 mm the high-pressure rough channel test resulted in approximately 1.5 µm Sa surface roughness and 10 µm tool wear. At the same milling distance, the low-pressure smooth channel resulted in approximately 2.75 µm Sa surface roughness and 25 µm tool wear.
  • In turning operations, MQL resulted in a surface roughness of 4.25 µm Ra compared with 5.00 µm Ra in dry machining. MQL also improved surface finish by reduced abrasion, tool chipping, and built-up edge (BUE) formation. The maximum flank wear for MQL inserts was ~200 µm less than that of dry machining [20]. Chetan et al. [21] characterized the wear behavior of PVD TiN-coated carbide turning inserts when machining Nimonic 90 and Ti6Al4V. An external MQL emulsion mixture (10:1 ratio of water and sunflower oil) was used in comparison with dry machining. The results showed that applying the mixture to Ti6Al4V allowed ample wetting, decreasing the intensity of flank wear at high cutting speeds. The lubricant also better penetrated the surface of the Ti6Al4V workpiece, reducing flank wear when compared with Nimonic 90.

2.2. Surface Modification

Many manufacturing processes can be used to control the surface of a workpiece: Electrical discharged machining (EDM), electrochemical polishing (ECP), grinding, honing, chemical mechanical polishing (CMP), lapping, and sand blasting. Applying any of these processes to internal lubricant delivery channels of a drill is a challenge since a drill incorporates helical channels for lubricant delivery (Figure 1). Due to the small geometry, the methods listed above cannot be applied as it would be very difficult to access the internal surface of the channels using traditional methods. Liquid flow or slurry-based methods can possibly be used for internal surface modification.
An applicable method to modify the surface of metallic workpieces is chemical etching/polishing. The process can be accelerated by raising temperature or ultrasonic agitation. Etching is commonly applied to external surfaces to increase the surface roughness and/or to improve adhesion properties for coatings.
Haubner et al. [26] and Chakravarthy et al. [27] etched WC–Co substrates using a Murakami solution (10 g K3[Fe(CN)6] + 10 g KOH + 100 mL H2O) paired with a Caro’s acid etching process (5% H2SO4 + 35% H2O2) to enhance the adhesion of diamond deposition particles. The findings were as follows:
  • The Murakami solution dissolved WC particles, leaving the Co binder unetched.
  • Following the Murakami solution etch, Caro’s acid partially dissolved the Co binder, leaving a textured surface finish. Caro’s acid etching caused oxidation of the Co binder to a soluble Co2+ compound.
  • Without the primary Murakami etching, Caro’s acid had little effect on the WC–Co substrate.
Sha et al. [28] improved the coat-ability of WC–Co substrates by using a 1–3 min Murakami solution etch followed by a 10–40 min HNO3:HCl (1:1 ratio) etch. The workpieces had an original surface roughness of 0.2 µm Ra. After the two-step etching process the resultant surface roughness was increased to 1.0 µm Ra. The Co binder content decreased from the original 15% to a range of 0.84–6.04% while an overall etching depth of 5–10 µm was achieved.
Jung et al. [29] chemically etched WC–Co (10% Co) using two alternatives to the two-step etching process previously discussed.
The first alternative etching process was tested using a reagent of boiling H2O diluted HCl for a 12 h submersion. The study noticed dissolving of Co particles when a WC–Co substrate was boiled in HCl. The interface between WC and Co became visible, but the WC grain boundaries were not revealed.
The second alternative method involved an etching step in 90% H2O2 and 10% HNO3 at 60 °C for 12 min. Unlike the boiling HCl, the new etchant was able to dissolve WC particles as well, which allowed for the WC–Co interface and WC grain boundaries to become visible.

2.3. Ultrasonic Cleaning

Ultrasonic pulsation is commonly used for cleaning applications. In a reagent bath, ultrasonic waves help to continuously flush the cleaning solution from the surface of a part, thus allowing fresh solvent to stay in contact with the workpiece. This same phenomenon can be applied in etching processes [27] such that uncontaminated etchant solution is constantly in contact with the surface of the workpiece. The second aspect of ultrasonic pulsation is the formation of cavitation bubbles on the surface of the workpiece. Growing and bursting of unstable bubbles causes high-pressure waves that dislodge and remove loosely adhered contaminates.
Brujan et al. [30] studied the bursting pressure of cavitation bubbles formed by ultrasonic pulsation. Shock waves emitted by the collapse of cavitation bubbles on the rigid wall of a workpiece had the largest damage potential. At a distance of 68 µm from the bubble wall, the maximum shock wave pressure was measured to be 1.3 ± 0.3 GPa. Extrapolation of the data showed that pressures on the wall of the workpiece were as high as 7.7 ± 1.6 GPa and agreed with results from Pecha and Gompf [31]. WC–Co has a compressive strength of 3347–6833 MPa and a tensile strength of 370–530 MPa [32]; therefore, the strength of WC–Co is at least one order of magnitude lower than the minimum bursting pressure of cavitation bubbles.

2.4. Summary of Literature Review and Research Gap

Previous MQL research has focused on the effect of channel geometry, lubricant type, and aerosol flow parameters on mist characteristics, and machining results using internal and external delivery methods. Past studies showed that in both external and internal MQL, pairing low viscosity lubricants with high air pressure would decrease the resultant microdroplet size, while increasing wettability and machining quality. There has been little research into how channel roughness affects the droplet distributions and subsequent machining effectiveness. The following section (i) presents the experimental work and computer simulation on how surface roughness of MQL nozzles affects droplet size, and (ii) proposes a technique to modify nozzle surface texture of WC–Co cutting tool material.

3. Materials and Methods

3.1. MQL Droplet Characterization

3.1.1. Equipment

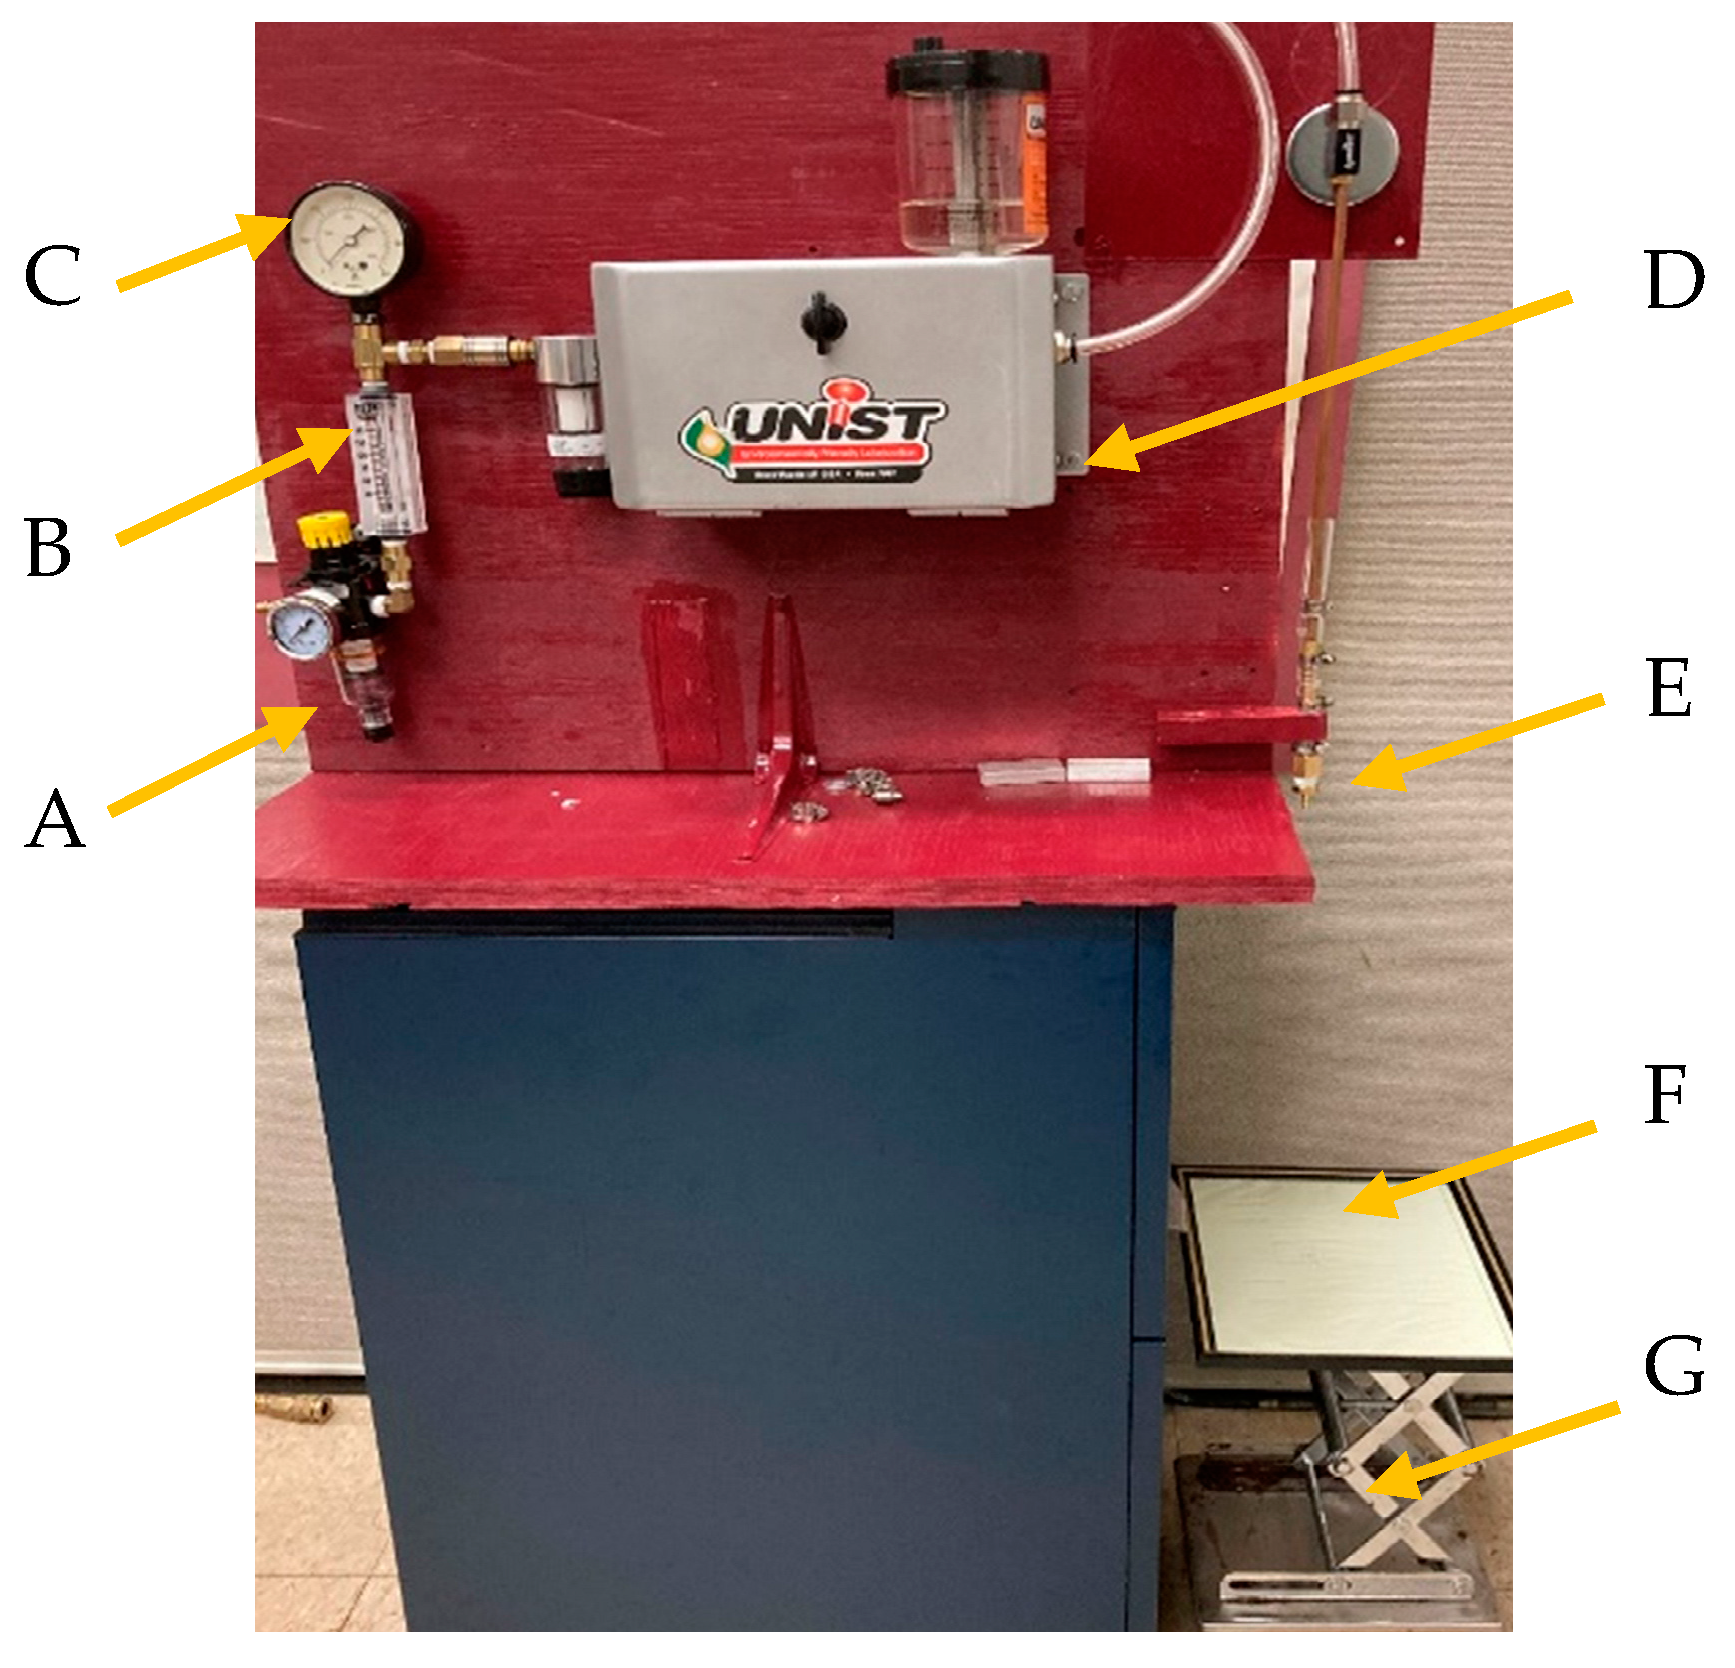
The MQL system (Figure 2) consisted of the MQL system (D) (Unist Coolubricator, MI, USA) with three connecting test tips at the output nozzle (E). The system was connected to a compressed air supply through an air regulator (A), air flow meter (B), and pressure gage (C). A paper grid stored under a 236 mm × 182 mm glass picture frame (F) was used to collect the micro-droplets distributed by the MQL system. A jack plate (G) was used to adjust the distance between the test tip and glass plate.
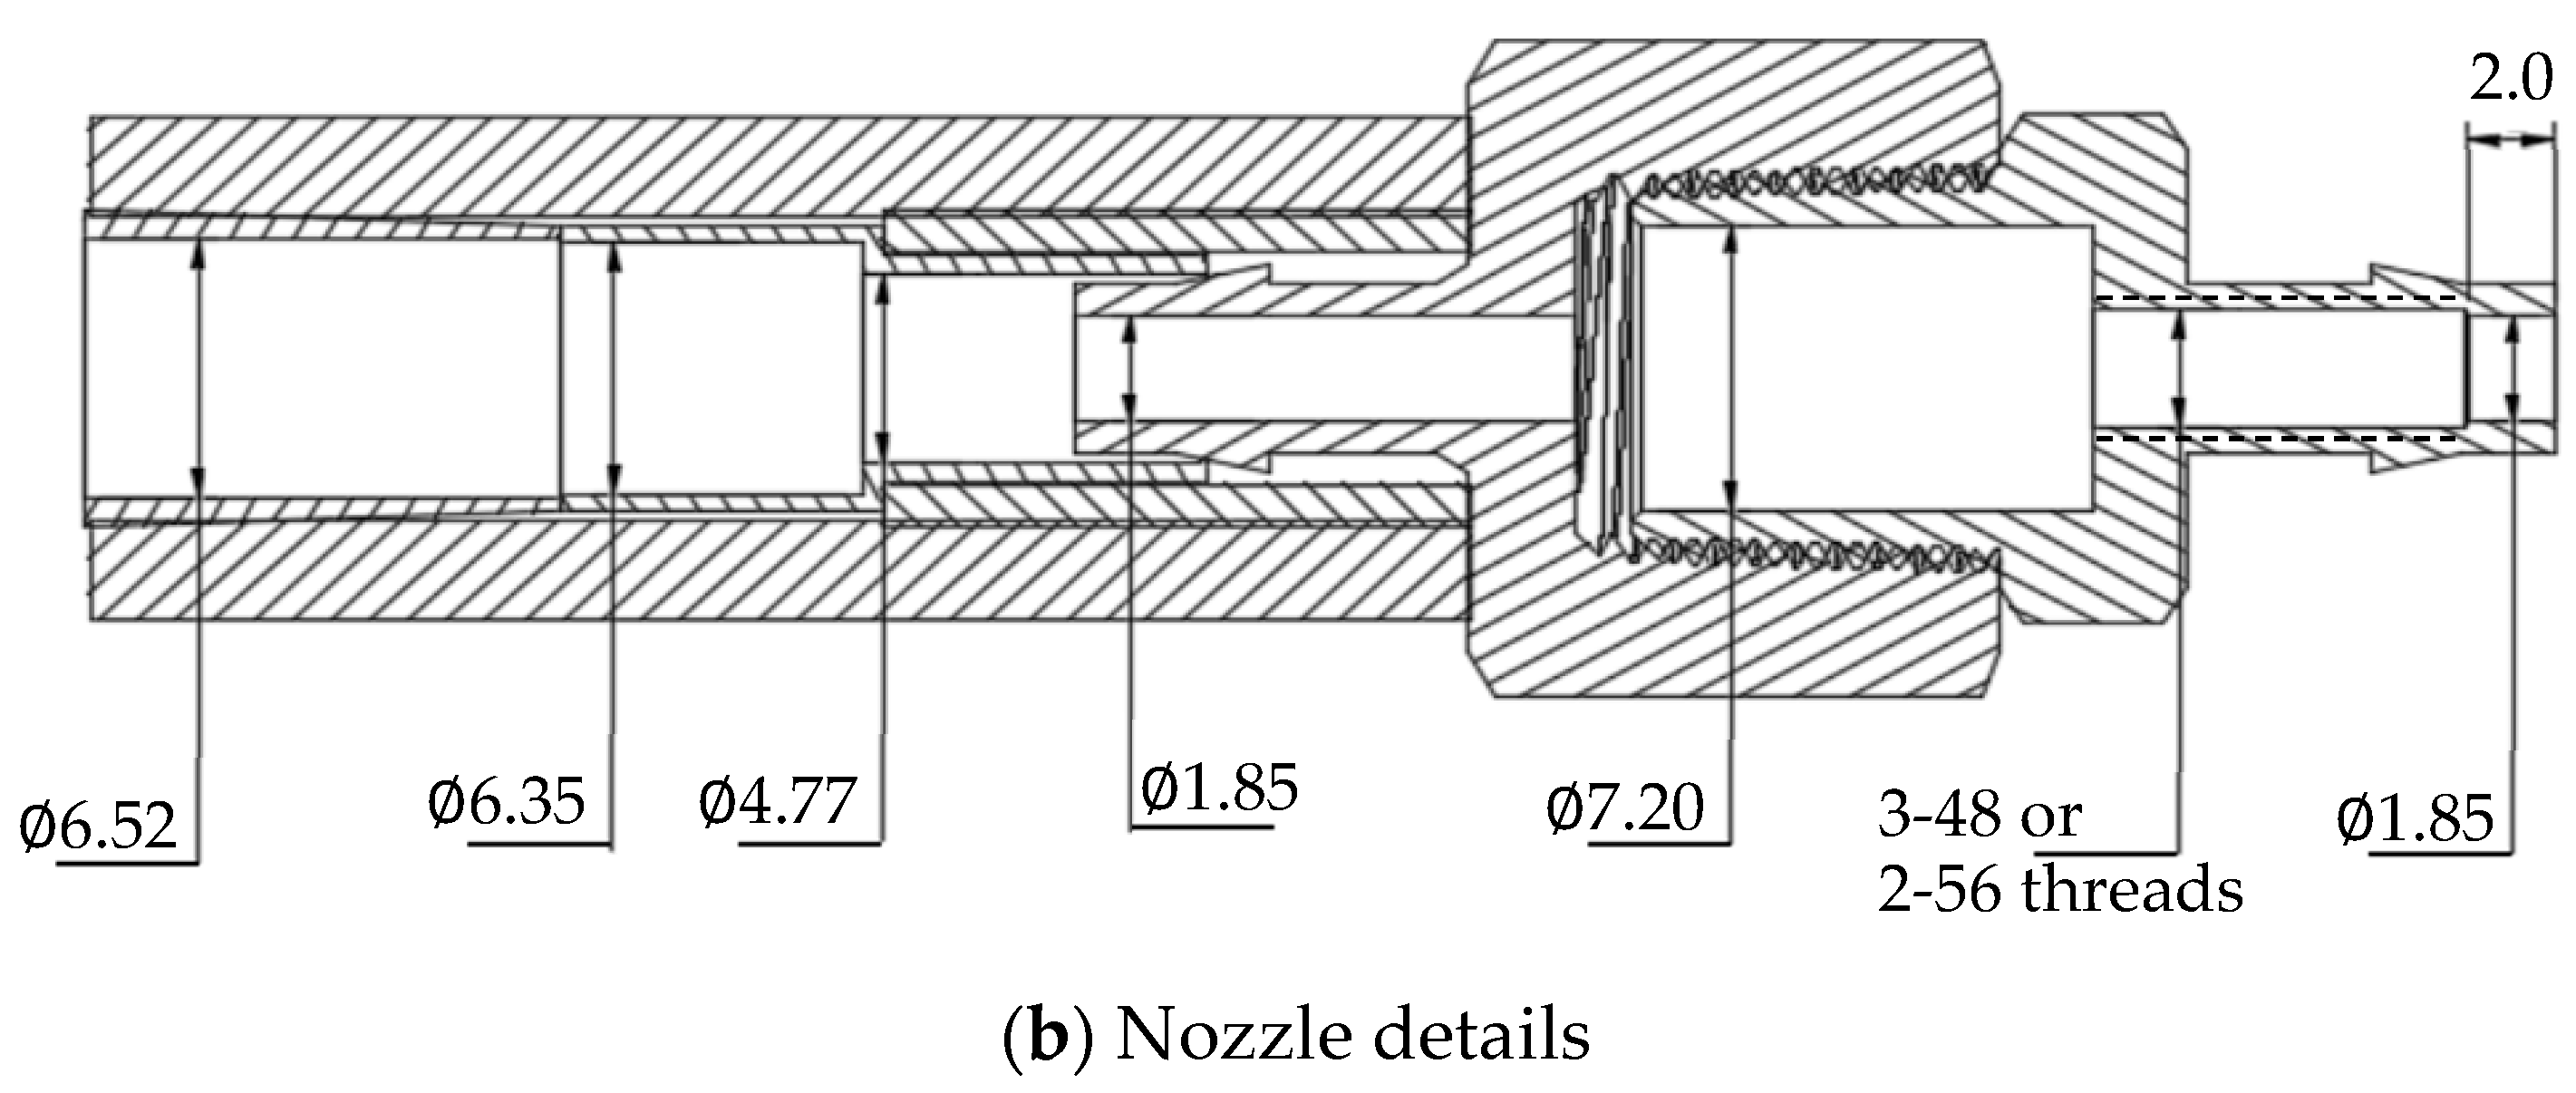
Figure 3a,b show the test tip assembly. The brass hose splicer was connected to the copper nozzle and barbed barb × Male Ion Pipe (MIP) adapter female fitting (ϕ3.175 mm × ϕ6.25 mm) with a Ø6.25 mm vinyl tubing. The tubing was wrapped in ϕ9.525 mm vinyl tubing to add rigidity when securing the hose clamps. The smooth, partially threaded, and threaded 3.175 mm × 6.35 mm diameter barbed barb × MIP adapter male fitting was screwed into the female fitting.
Figure 4 shows a polar coordinate layout of the collection grid used to acquire data pertaining to the droplet distribution as a function of radial distance. Due to the conical shape of exit aerosol mixture from a channel, eight different zones surrounding the nozzle were used to capture most of the droplets. Before each test, the outlet tip was centered above the origin at location 5.

3.1.2. Materials

Three channel finishes were achieved by modifying the barbed MIP adapters. A smooth channel was tested using an as-fabricated brass fitting. A medium channel roughness was fabricated with an under-sized #2–56 tap ( 2.18 mm) to form partial internal threads. The roughest channel was threaded with a #3–48 tap ( 2.51 mm). This large tap would cut fully into the channel, creating deeper threads and a rougher internal surface finish. Since lubricant may be collected at the exit threads, partial tapping was performed to leave approximately 2 mm without threads from the exit end (Figure 3).
Two commercially available MQL fluids were tested, labeled lubricants LA and LB, respectively. Their properties, gathered from manufacturer data sheets and the work of Patil et al. [33], are shown in Table 2.

3.1.3. Methods

The fixed parameters used for micro-droplet collection are shown in Table 3. For each tip (smooth, partially threaded, or fully threaded) and each lubricant (LA or LB), the following procedure was used for micro-droplet collection:
(a)
The MQL droplet system was set up using the parameters shown in Table 3.
(b)
The tip was centered above the origin at location #5.
(c)
The system was purged for 15 s, immediately followed by a 1 s droplet collection. Cardboard was used to block and control the flow of MQL droplets onto the collecting glass plate.
(d)
One 7 × 7 mm2 microscopic image of droplet distribution was captured at the center of each zone seen in Figure 4.
The tip to grid distance was optimized at 356 mm to minimize the lubricant coalescence and splashing on the collection grid. The same distance was used for every test.

3.2. MQL Lubricant Flow Simulations

MQL flow within each channel was simulated using the ANSYS Fluent 2020 software. The boundary conditions are listed in Table 4.

3.3. Chemical Etching and Metrology

To study the effect of etching on surface finish, carbide inserts were etched externally as an alternative to etching coolant channels of a carbide drill. A 9:1 mixture of H2O2:HNO3 (15.3 g:3.15 g) was used for etching WC–Co inserts. The mixture was maintained at 60 °C with a hot plate and monitored with an infrared pyrometer. A cleaned and new cutting inserts (K20, TPG433, C2 carbide, Kennametal, Latrobe, PA, USA) was partially dipped in the etchant at 5 min increments, rinsed in water, and blew dry with compressed air. Gentle hand agitation and ultrasonic agitation were applied to compare the etching effects.
The etched surface roughness was measured with an optical 3D digital system (Alicona Infinite Focus G4, Austria). The line roughness Ra was recorded along a random 0.5 mm line and repeated 4 times. The surface roughness Sa was recorded within a 0.25 × 0.25 mm2 area and repeated 4 times.
A measuring microscope (Olympus STM6, Japan) was used to collect images of the micro-droplet distribution seen in each test. Adobe Photoshop version 22.5.1 was used to convert the microscope images to grayscale to increase the contrast between the droplets and background. ImageJ version 1.52a was used to adjust the image thresholds and capture the projected area of the microdroplets. A scanning electron microscope (Vega3 Tescan, Czech Republic) was utilized to study the etched surface morphology.

4. Results and Discussion

4.1. MQL Droplet Characterization

Airborne droplet sizes were calculated using data from the projected droplets deposited on a glass plate [32]. The definitions of variables are as follows:
A: area of projected droplet (µm2)
P: projected droplet diameter (µm)
θ: contact angle of a lubricant on glass (Table 2)
V: droplet volume (µm3)
d: airborne droplet diameter (µm)
C = 0 for 90° < θ < 180°, and C = 1 for 0° < θ < 90°
The projected droplet areas A were calculated using the image pixels with ImageJ. Assuming perfect circles of projected droplets, the projected diameter P was calculated using Equation (1):
P = 2 ( A π ) 1 / 2  
Knowing the respective contact angle θ, and project size P, the droplet volume V was calculated from Equation (2):
P 3 V = ( 24 π ) [ ( 1 C c o s 2 θ ) 3 / 2 2 3 c o s θ + c o s 3 θ ]  
Assuming no evaporation during flight, no splashing when impacting the glass plate, and no droplet coalescence on the glass plate, an airborne droplet would have the same volume as that on the plate. Its airborne diameter d was simply:
d = ( 6 V π ) 1 3
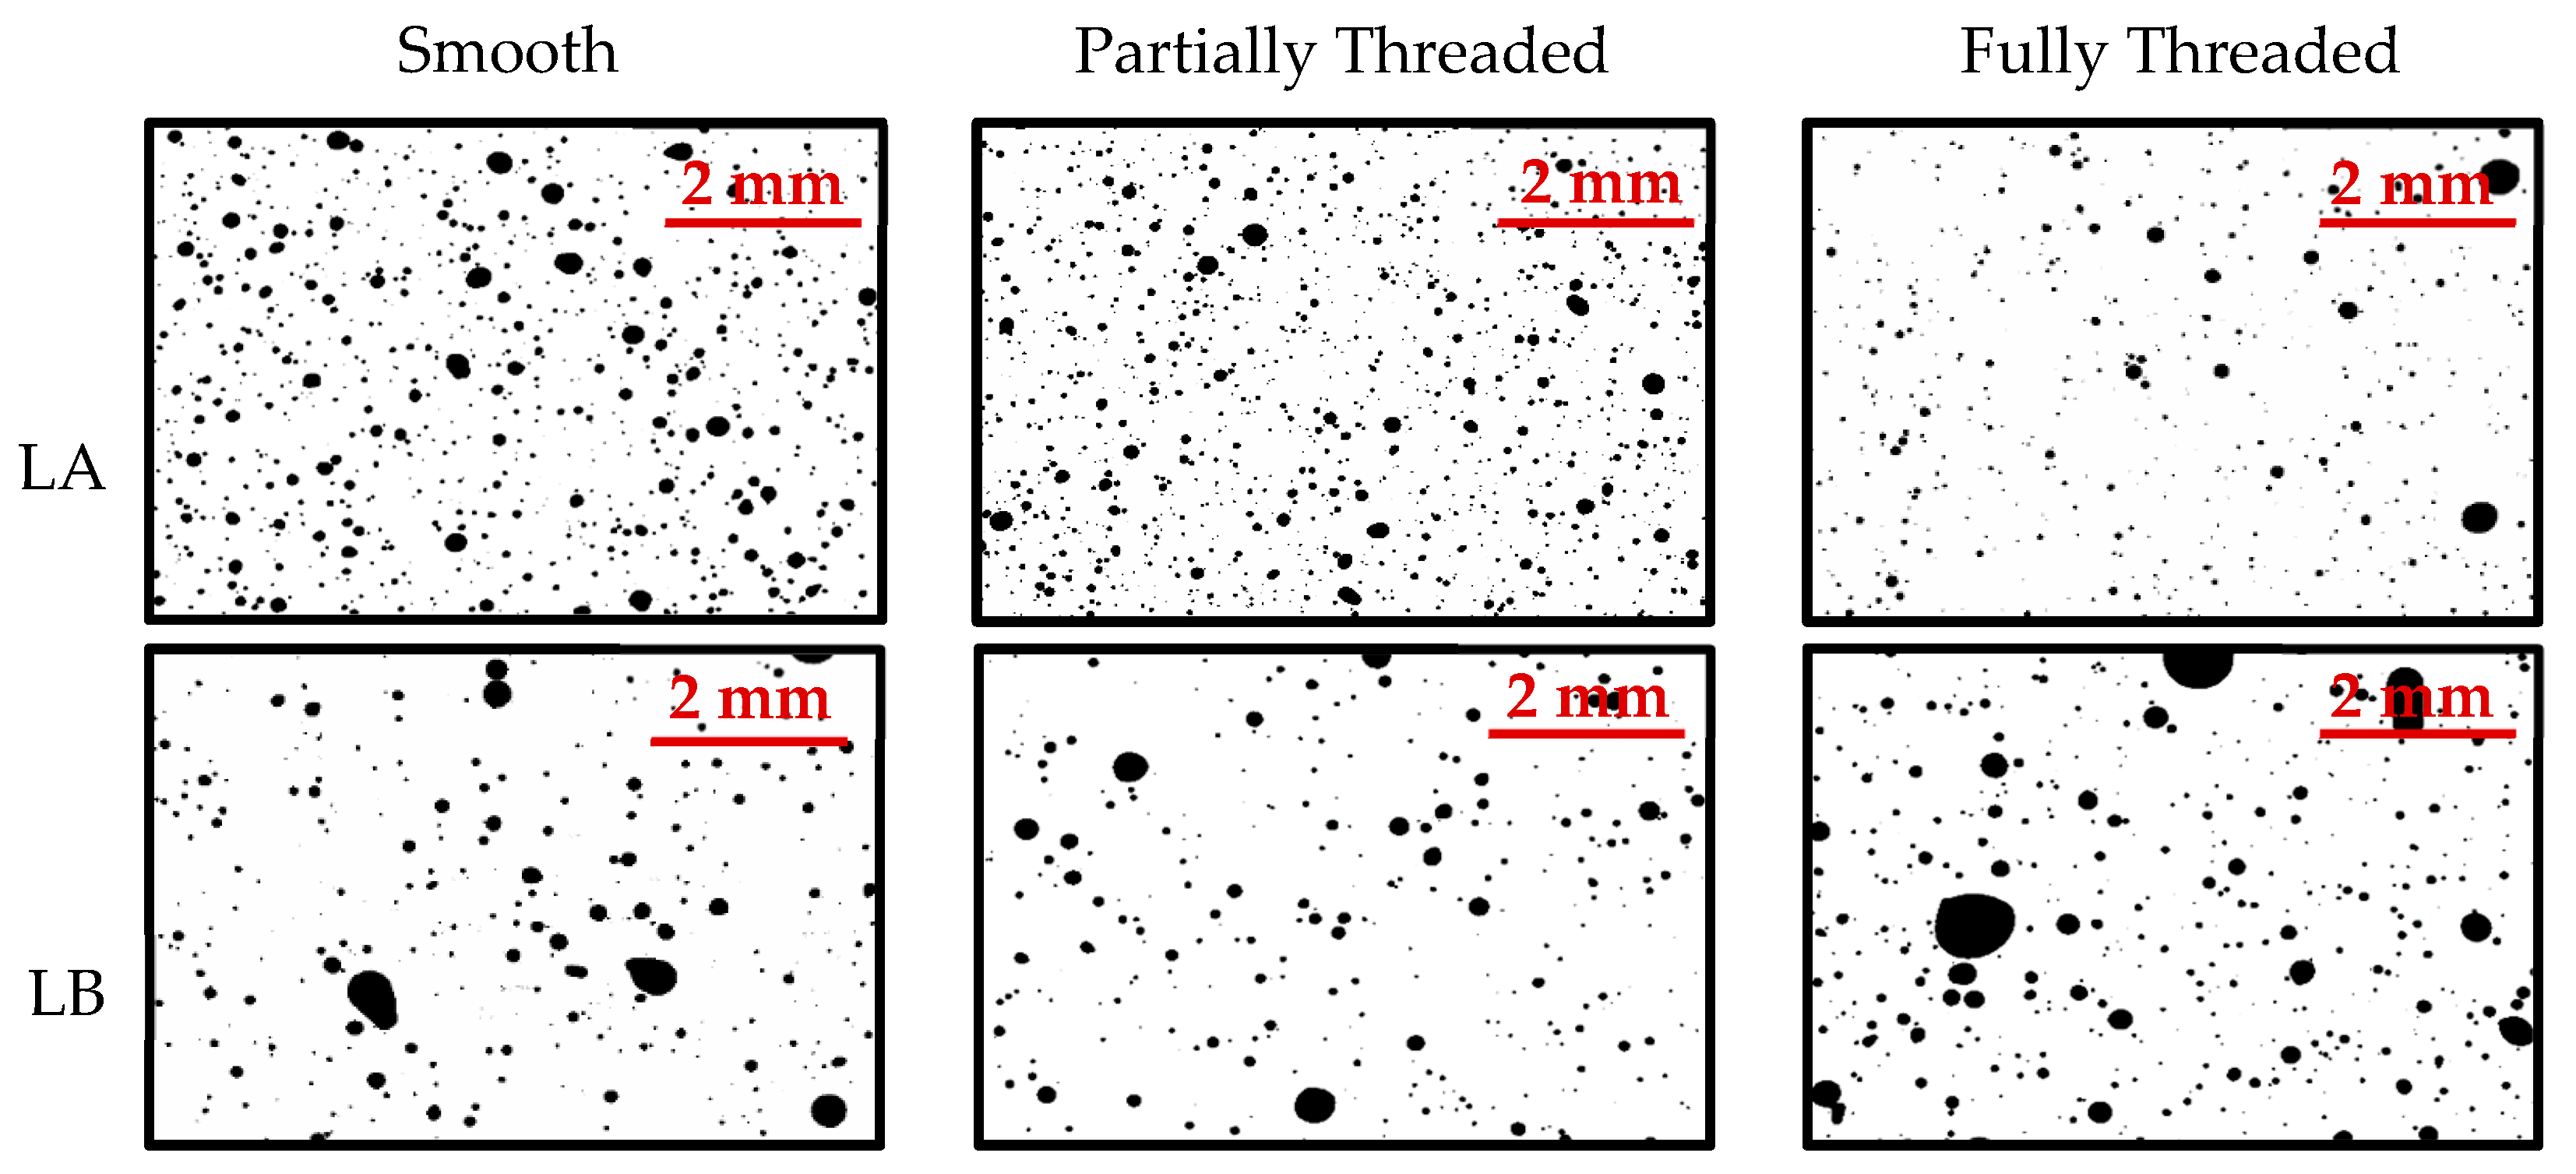
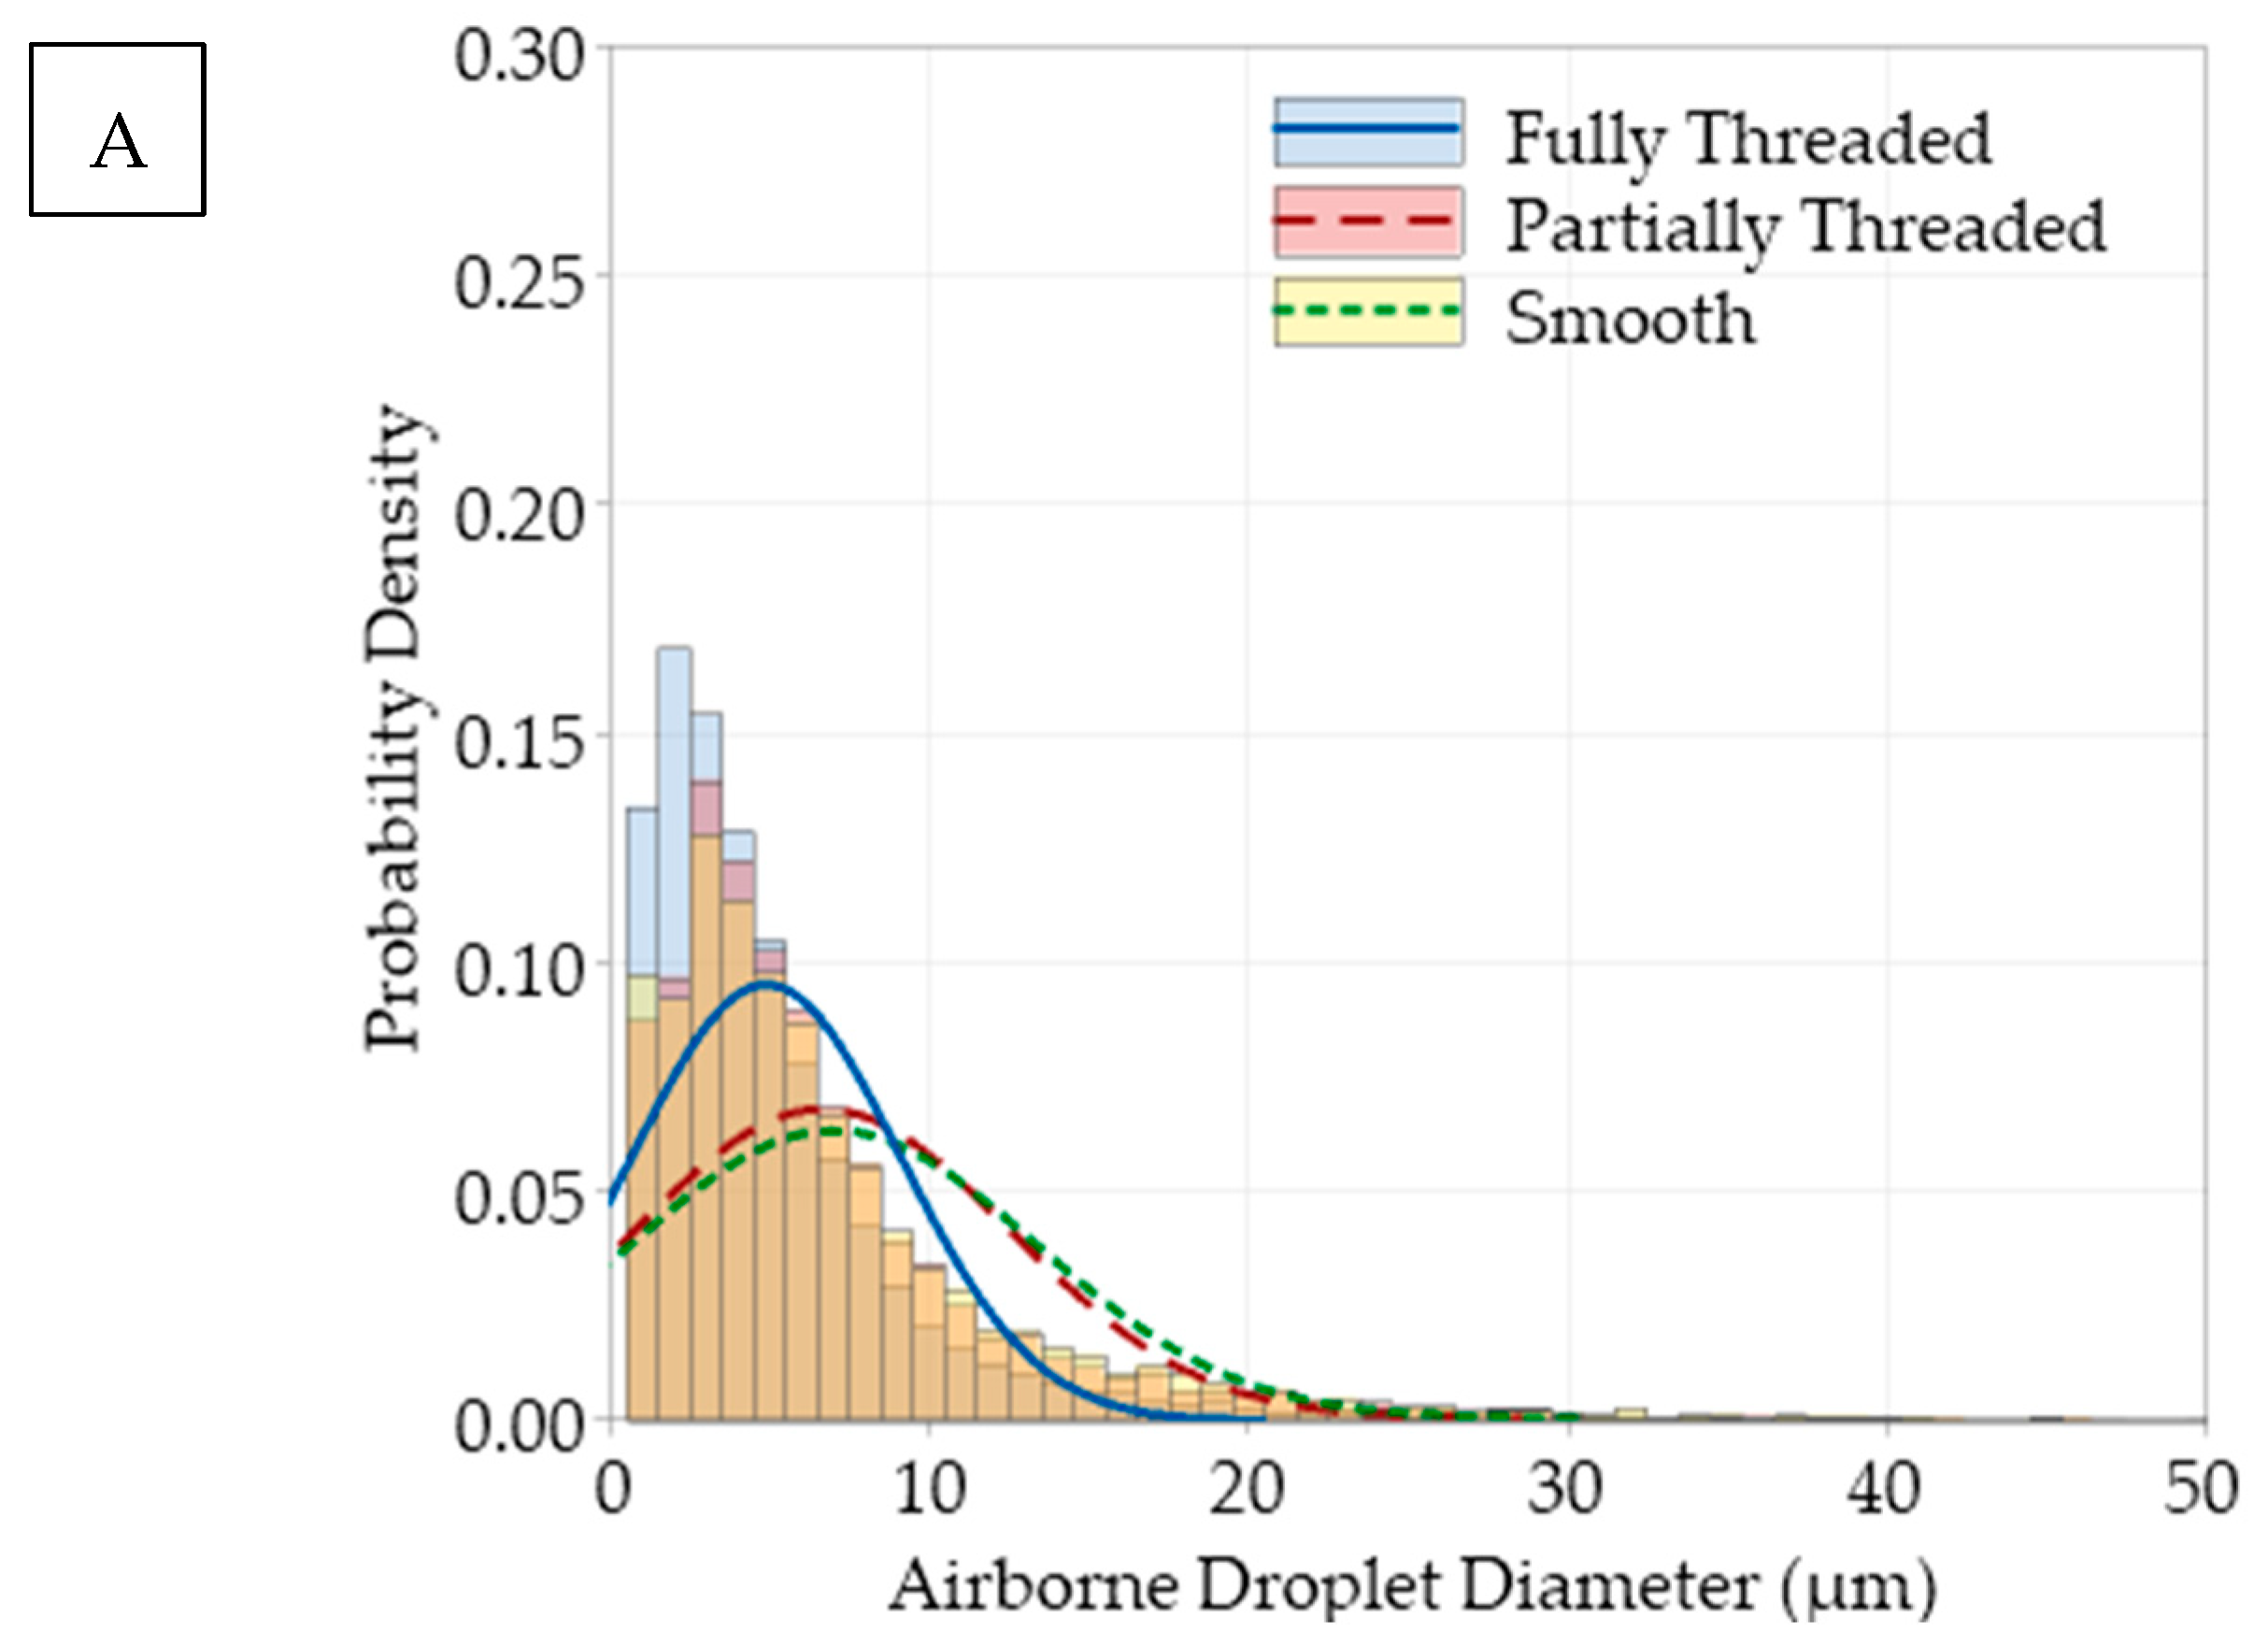
Figure 5 compares the resultant droplets for both lubricants at different channel conditions. Some droplets (<1 µm), being too small for the optical microscope, were excluded in the analysis. To reduce skew in the distributions, large droplets due to droplet coalescence were also excluded from the histograms in Figure 6.
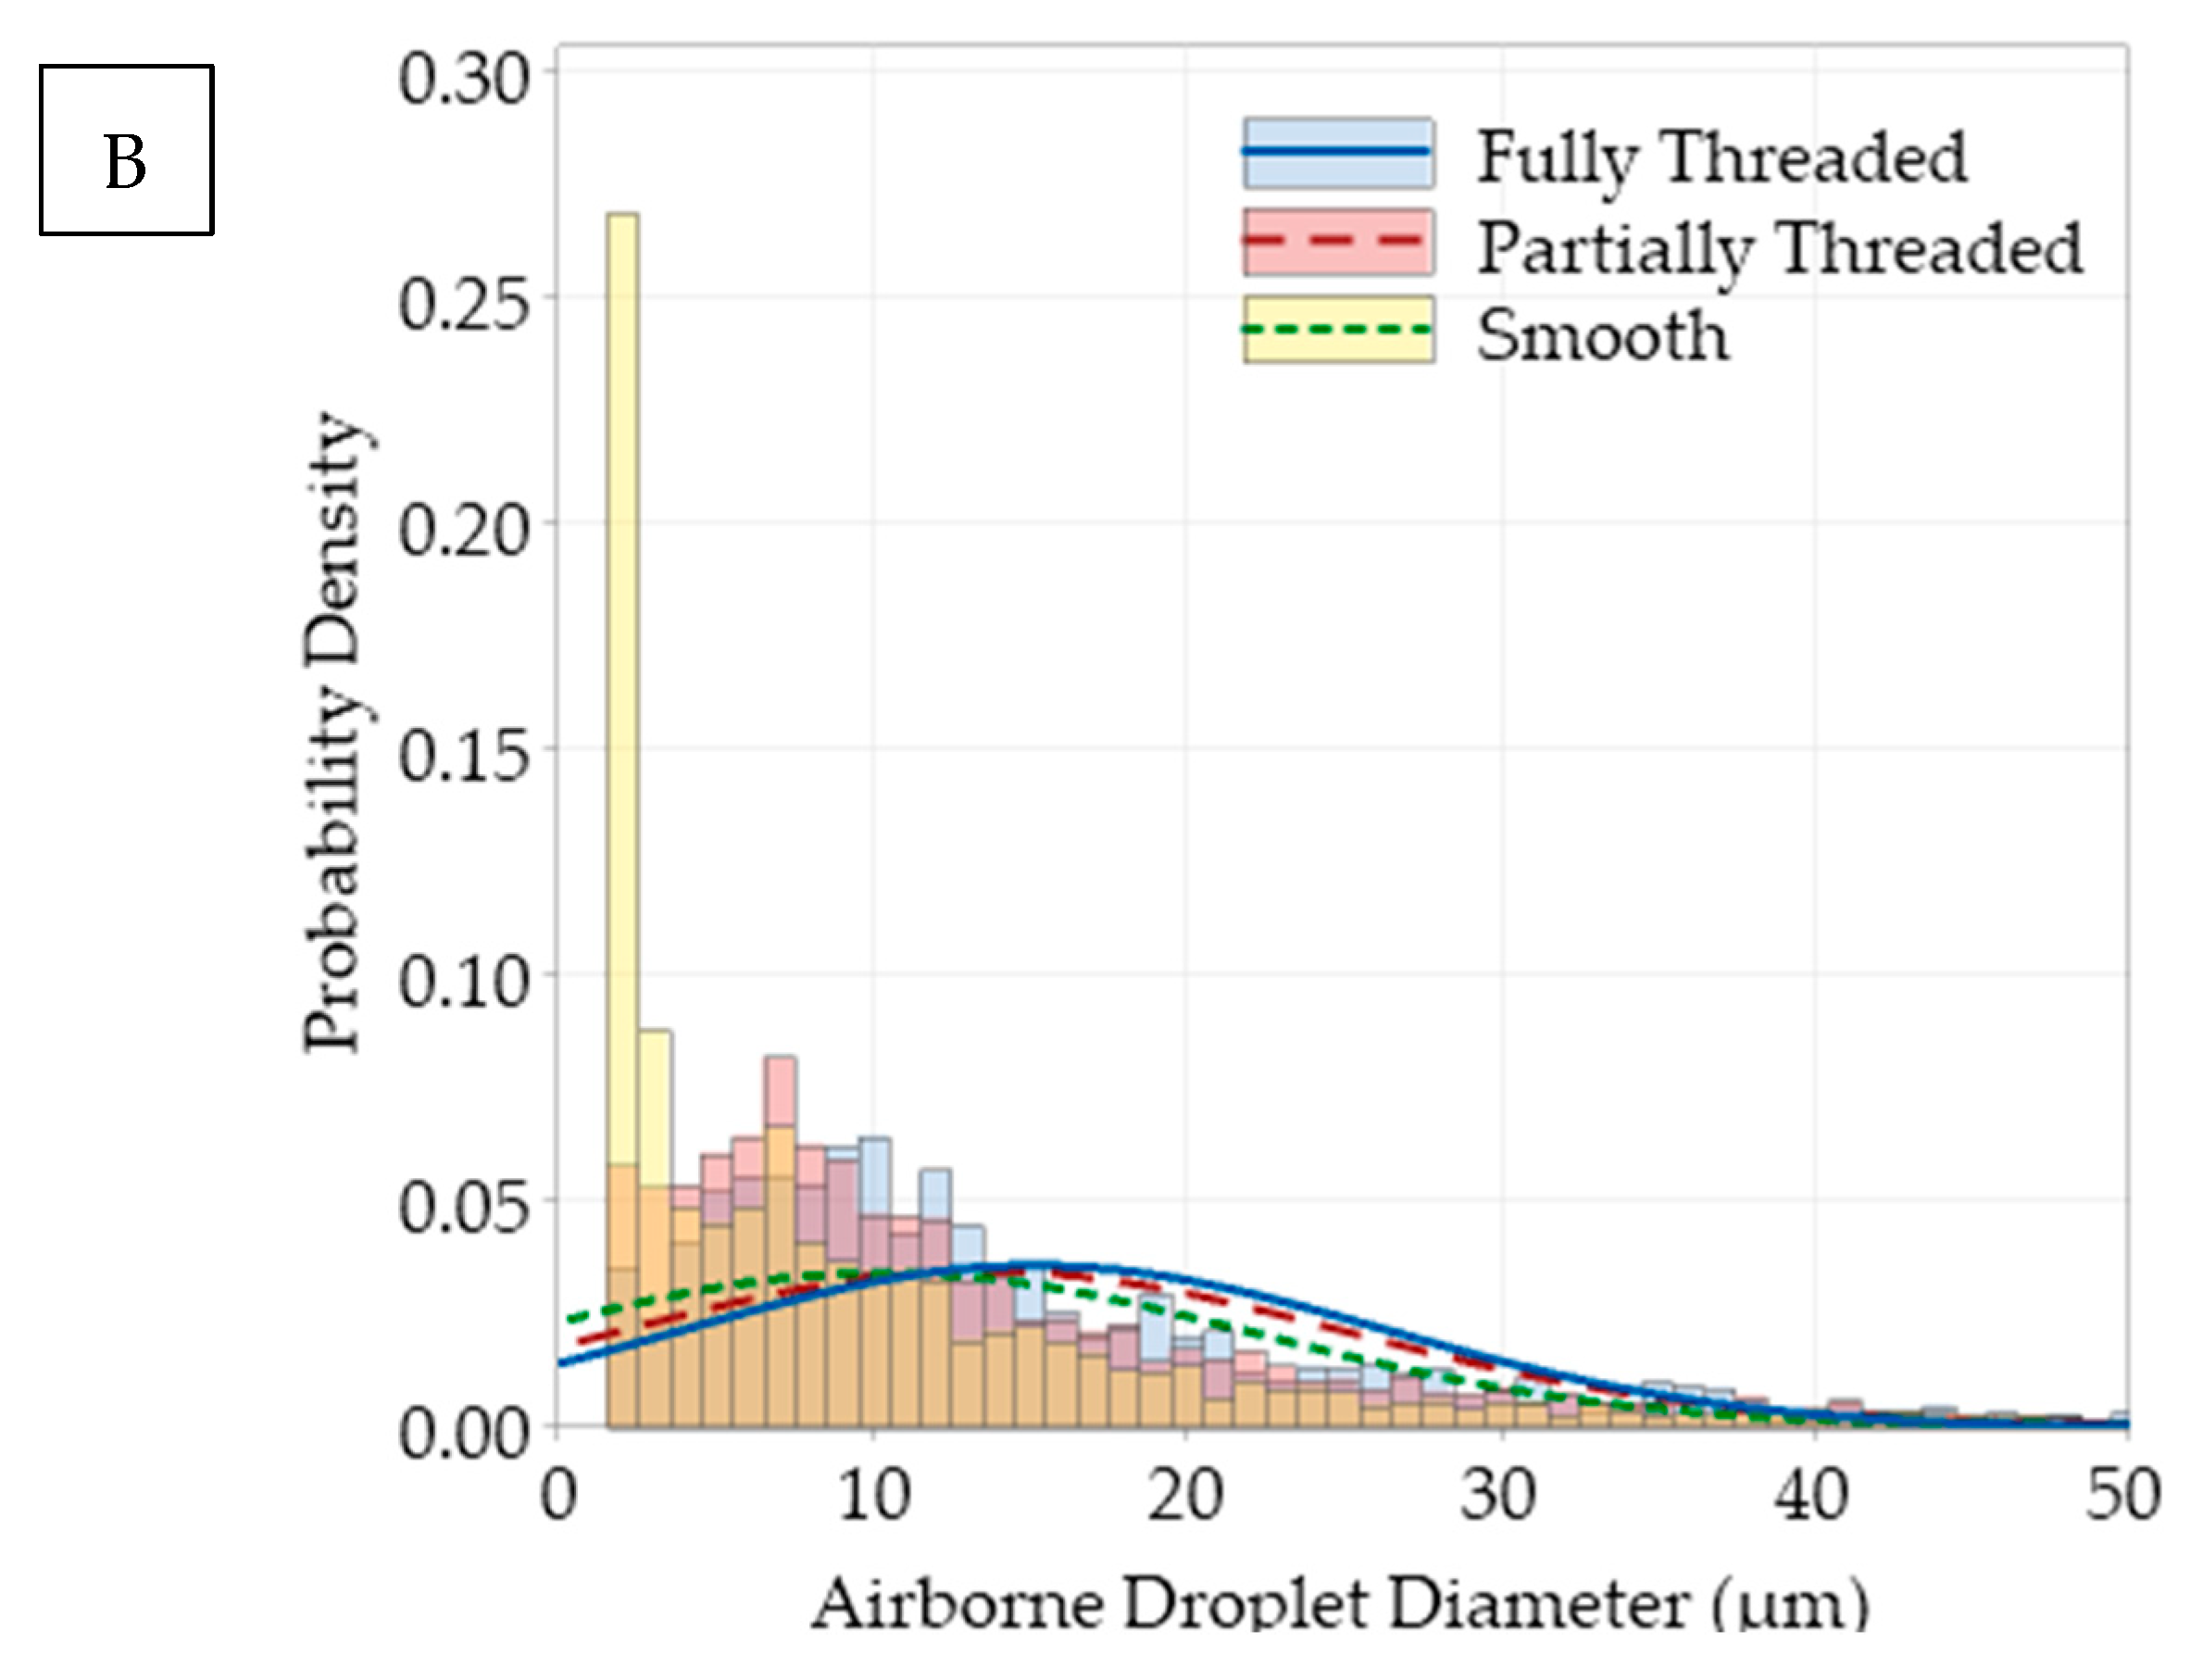
Figure 6 shows the distribution of drop size as probability density (frequency of occurrence), and the numeric results of these distributions are shown in Table 5 to compare the effects of channel roughness on droplet quality and quantity. Opposite trends were found for lubricants A (with low viscosity) and B (with high viscosity):
  • The low-viscous lubricant A was easily broken into smaller droplets. The ability to self-divided into smaller droplets was enhanced by a rougher surface as evidenced with the change from smooth to partially threaded and fully threaded channels.
  • The high-viscous lubricant B showed the opposite trend. Higher viscosity and perhaps lower surface energy forced a lubricant droplet to adhere to the channel wall, forming larger droplets. A rougher surface would promote this characteristic, i.e., more lubricant adhering to the channel wall and fewer airborne droplets.
The low-viscous lubricant LA allowed the desirable and smaller droplet size with increasing channel surface roughness. Such results were confirmed with another study where airborne droplets were collected through a rough 3D-printed ABS channel and through an acetone polished ABS channel [3]. In a subsequent section, the computer simulation of MQL mixture through different channels further explains the effect of lubricant viscosity on quality of MQL mixture.
The MQL mixture is characterized by drop size, speed, and its distribution in a flow. Let:
Droplet   density   ( #   drops / mm 2 ) = Number   of   droplets   ( # drops ) Collection   area   ( mm 2 )  
Figure 7a,b show the airborne droplet diameter and droplet density as a function of radial distance for both lubricants LA and LB. Recall that the collection area for each image was 7 × 7 mm or 49 mm2. The experimental data suggested that:
  • Droplet dispersion: The high droplet density was found directly below the nozzle since compressed air exited within a cone shape and diverged away from the tip. Higher central air velocity constrained the droplets near the central axis of the cone and deposited most droplets in the central zone #5.
  • Airborne drop size: The drop size was larger at the central zone #5 compared with other zones. A large droplet with heavy mass and inertia would travel straight out of the nozzle and have less tendency to deviate from a flight path due to minor turbulence.
  • Effect of viscosity: The LA lubricant, with viscosity of 14.5 mm2/s compared with 28 mm2/s of lubricant LB (Table 2), would easily breakdown into smaller droplets to form mist with smaller airborne drop size and higher droplet density. This reasoning also agreed with the relationship of contact angle, drop size, and surface tension in the Gibbs equation [34]:
c o s θ = γ S G γ S L γ L G + ( K γ L G ) ( 1 a )
where θ is the contact angle, γSG is the surface tension of solid relative to gas, γSL is the surface tension of solid relative to liquid, γLG is the surface tension of liquid relative to gas, K is the line tension, and a is the droplet radius.
Table 2 tabulates the smaller contact angle on glass of lubricant LA (6°) compared with that of lubricant LB (22°). The contact angles on different solids would be different, but it assumed that the relative comparison would be unchanged. Equation (4) suggests that a liquid with smaller radius a would likely form a smaller contact angle. Patil et al. [33] used a high-speed video camera and confirmed the smaller airborne drop size of lubricant LA compared with that from LB at different air pressure levels.
The experimental results from this study agreed with information from published literature. The results of the droplet characterization experiment were consistent with the works Patil et al. [33], who also tested both LA and LB, and concluded that the combination of lower viscosity of lubricant LA and high air pressure would result in smaller and desirable droplets. However, Tai et al. [14] who tested esters, naturally derived synthetics, vegetable-based lubricants, and fatty oils, showed an opposite trend in viscosity and droplet size. The combination of the trends in Figure 7 are supported by Park et al. [35], who studied wetting area as a function of radial distance from the collection zone to the MQL nozzle. The authors found that wetting area, defined as the total area covered by droplets, decreased with increasing radial distance from the MQL nozzle. With an increase in radial distance, the droplet density and airborne droplet size decreased, which corresponded to a smaller droplet coverage area.

4.2. MQL Air Flow Simulations

The flow of air in MQL was simulated in a circular channel. Due to the channel symmetry, only a quarter of a channel was shown for different channel roughness (smooth, partially threaded, or fully threaded). Since air was the carrying medium for the droplets, it was assumed that the droplets were small enough and followed the path of the air. Figure 8 shows the velocity of the air near the wall of an internal MQL channel.
The simulation showed the effect of the channel wall roughness on boundary layer and the near wall flow pattern.
  • In a smooth channel, the velocity of the air is parallel to the wall; therefore, once the droplets stick to the wall, it is very difficult for the droplets to reenter the bulk of the fluid (Figure 8a).
  • In a partially threaded channel, turbulent flow was seen due to the threaded wall. The thread geometry, typically 60°, allowed air to recirculate back and disrupt the boundary layer (Figure 8b).
  • The effect was more significant in fully threaded channel. The returning air in a threaded portion effectively disrupted the stagnant layer and reintroduced oil drop-lets back to the main air flow above the threaded wall. As the result, there was more pressure drop in the fluid and the velocity of the air was lower (approximately 125 m/s) compared with that in a smooth channel (approximately 250 m/s) (Figure 8c).
The results of MQL lubricant flow simulation complemented the experimental results shown in Figure 5, Figure 6 and Figure 7. The lubricant LA with low viscosity and low surface energy broke up into smaller droplets when flowing through a partially threaded channel, and even finer droplets in a fully threaded channel. This is shown as smaller droplets (Figure 7a) and increasing droplet density (Figure 7b). The reason, illustrated with flow simulations above, was due to the recirculating air flow that disrupted the boundary layer and reintroduced stagnant oil into the downstream flow. The very fine airborne droplets, however, may not have been captured in the experimental study due to possible evaporation or 1μm resolution limitation of the optical microscope.
The opposite trend, however, was observed for the higher viscous and higher surface tension of lubricant LB. The oil droplets were larger (Figure 7a) and adhered to the rough surface of threaded channel. This caused them to not be recirculated into the downstream flow by very low air velocity within a thread. Therefore, the droplets are larger and fewer airborne droplets were collected (Figure 7b).

4.3. Chemical Etching

The resultant surface roughness measurements are shown in Table 6. For each trial, the average and standard deviation were calculated from data collected at four random locations on each etched area of a WC–Co insert.
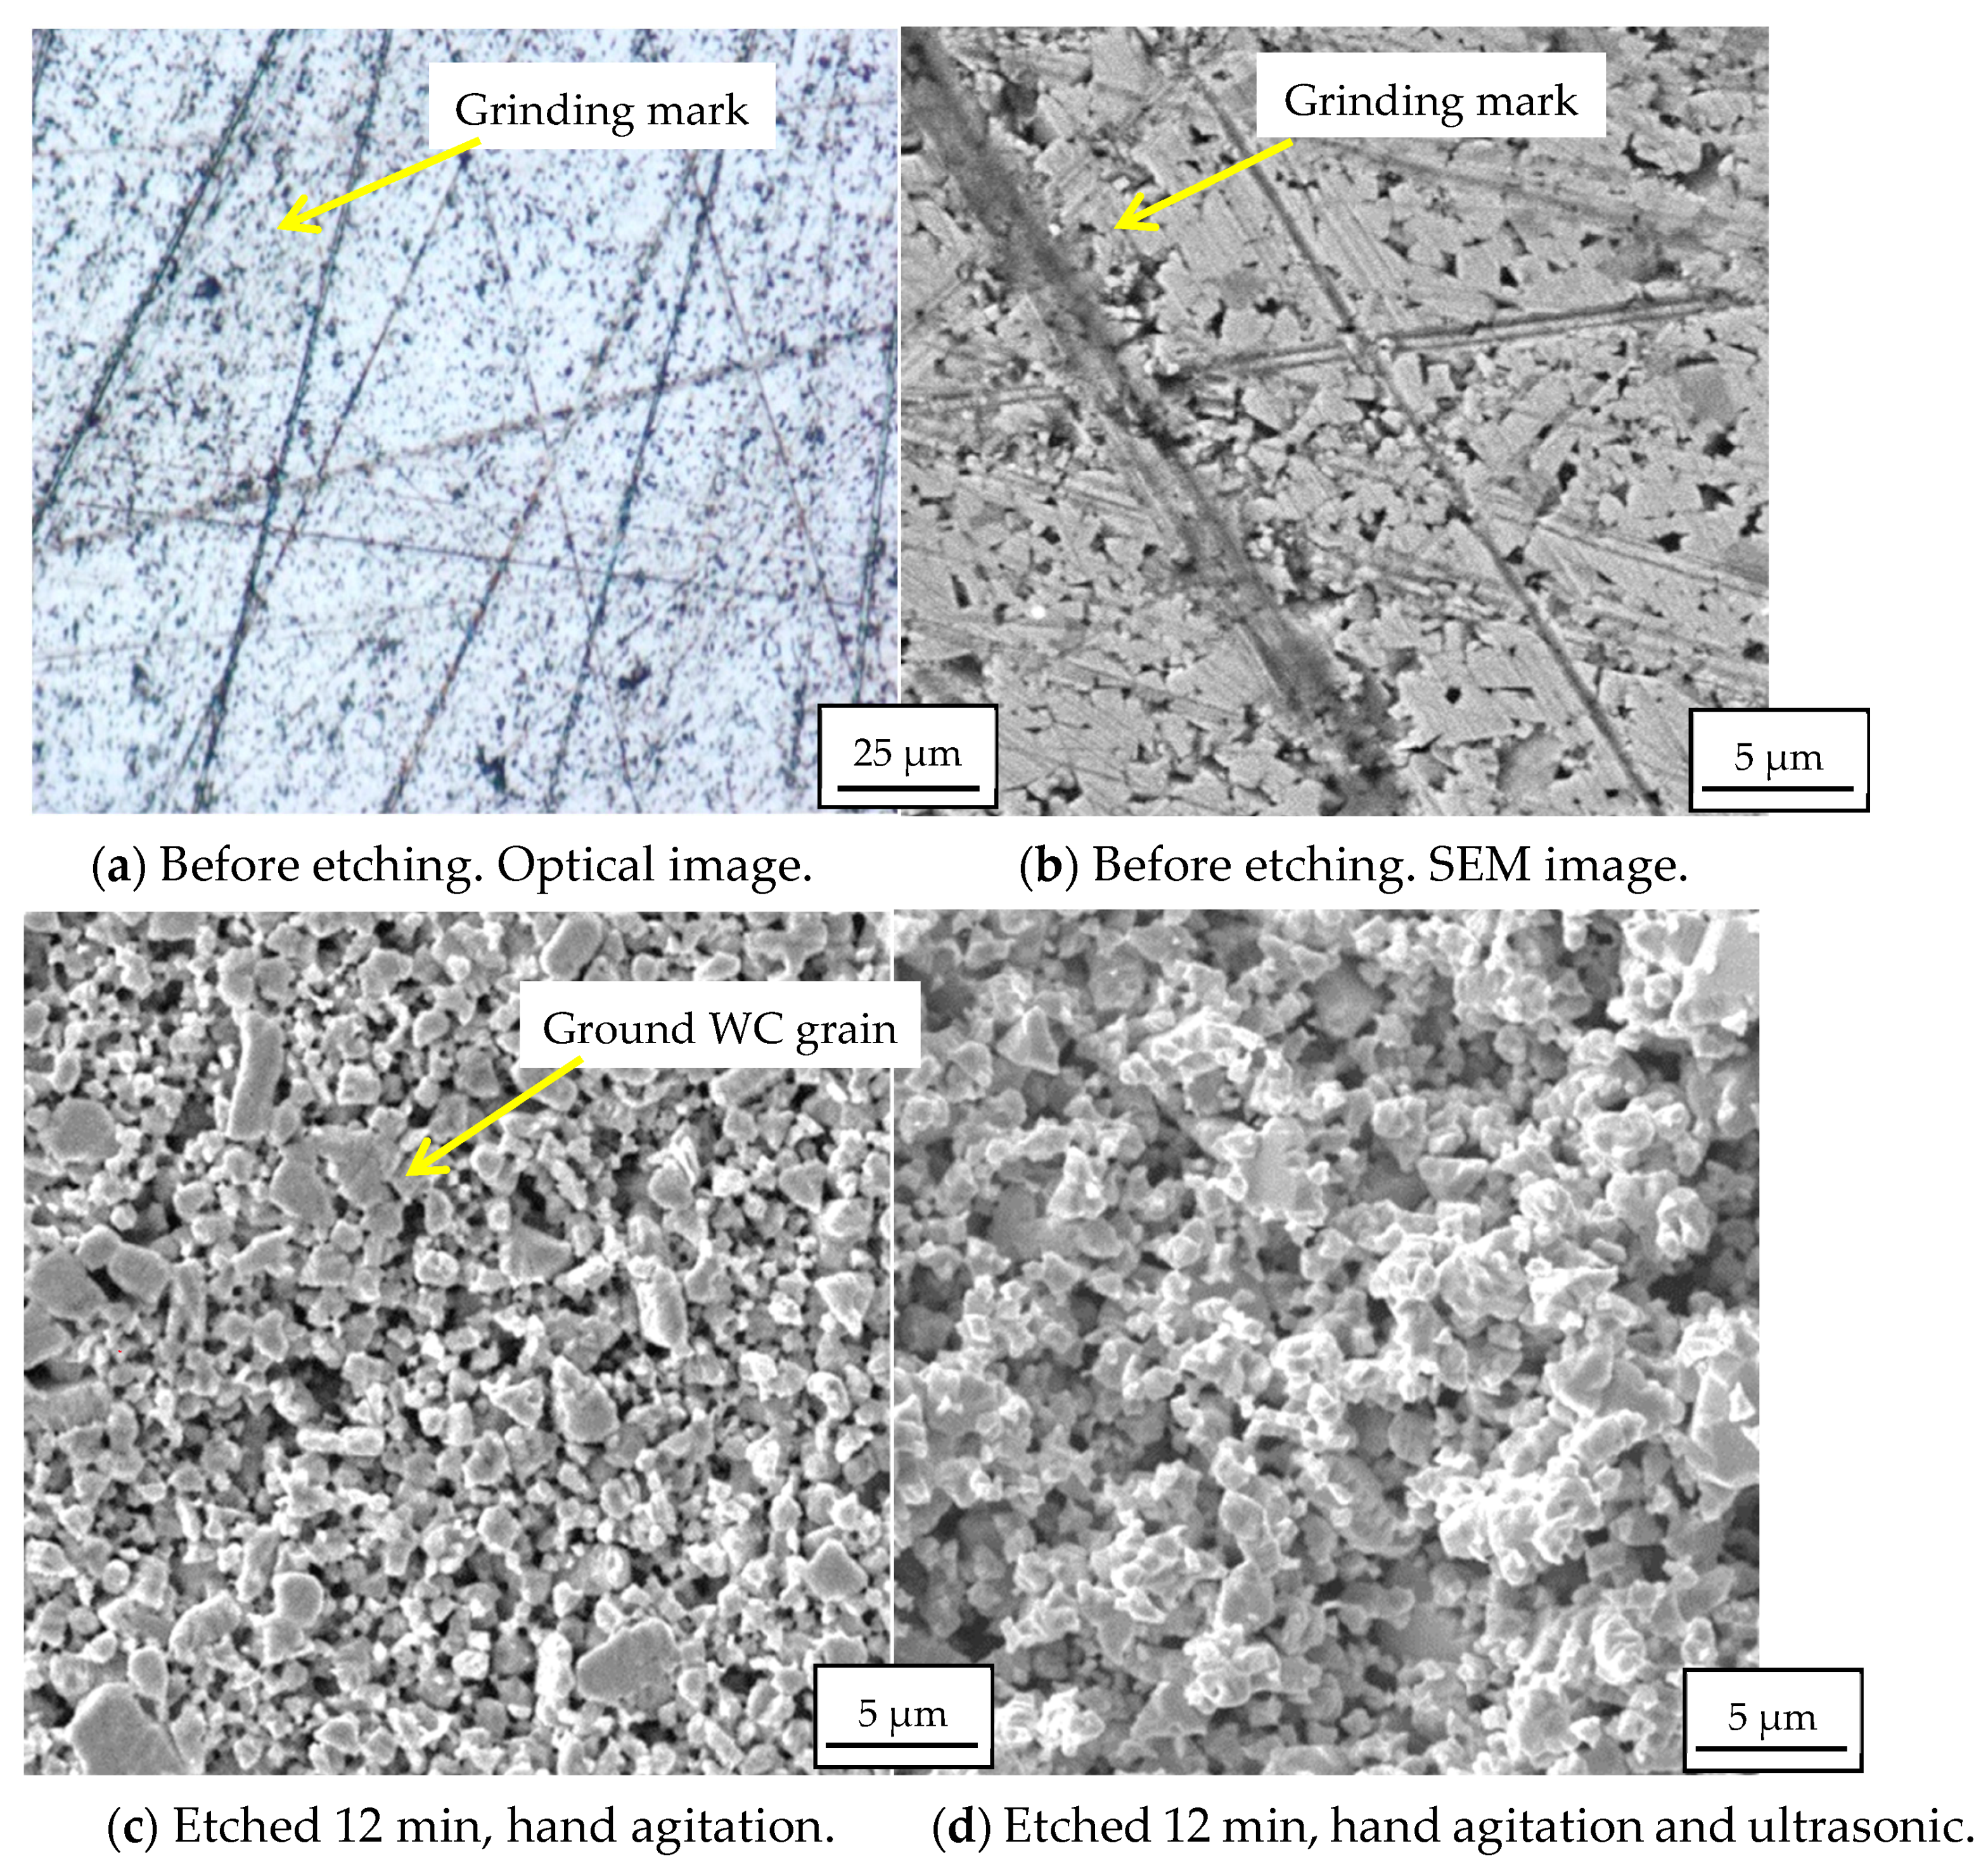
Figure 9 summarizes the etching result by showing the average percent change in surface finish measurements. Although the surface was slightly etched, there was no significant change on surface roughness after 5 min etching with hand or ultrasonic agitation. Obvious effects were seen after etching for 12 min to remove all grinding marks. Hand agitation helped to remove etching products while refreshing the surface with new etching chemical. Since carbide grains with partially ground surfaces were still visible (Figure 10c), additional etching time was required to remove the ground surface completely. The synergy effect of hand agitation and ultrasonic vibration produced drastic changes on the etched surface: all partially ground carbide grains and grinding marks were completely disappeared, and evidence of deep etching below the surface was seen (Figure 10d). Forming and bursting of cavitation-induced gas bubbles would dislodge carbide grains and the cobalt matrix, therefore, accelerating the etching rate. Increasing the etching time to 20 min etched deeper below the original plane, generating a rougher surface, although the effectiveness of ultrasonic became less significant.
Although all inserts were taken from the same batch, large variation of surface roughness results was seen. Residual stress level after sintering and grinding of the inserts, inconsistent hand agitation, and imprecise control of the etching bath temperature could contribute to the difference results from different inserts.
Both optical and scanning electron microscopy were used to observe the etched surfaces of WC–Co inserts. The effect of hand agitation (HA) and ultrasonic (US) agitation were significant. Grinding marks and pores between WC grains were visible on the surface of each substrate before etching (Figure 10a,b). In the post-etched HA sample, the Co matrix was removed interstitially between WC grains, but the ground WC grains were still visible after etching (Figure 10c). This showed that etching for 12 min with hand agitation only removed a thin layer of WC; however, no grinding marks or ground grains were visible after etching for 12 min while combining agitation with hand and ultrasonic wave (Figure 10d). It was postulated that ultrasonic cavitation air bubbles formed, busted, and dislodged small WC grains and the binding cobalt matrix. The result was a very rough surface finish on WC–Co inserts.
Although the external surface of a carbide cutting insert was etched in this study, the material removal mechanism would be the same if etching on an inner surface of coolant channels of carbide tools. By achieving a rough surface of internal channels, MQL using a lubricant with low viscosity can (i) produce finer droplets for efficient machining, (ii) generate higher drop density for uniform lubrication, and (iii) utilize lubricant efficiently since most lubricant will become airborne droplets rather than adhering to the tool channels.

5. Conclusions and Recommendations

Selection of cutting fluid could be tedious and expensive trial and error steps. Understanding the fundamentals of MQL and physical properties of lubricants would allow optimal operation of MQL and achieving a highly productive environment. Droplet distributions were studied using internal MQL delivered through smooth, partially threaded, and fully threaded channels. Testing with the low-viscous LA and high-viscous LB lubricants showed:
  • A rough channel surface helped to break down lubrication droplets to form higher quantities of finer airborne droplets when using low-viscous lubricant such as the LA lubricant in this study. The opposite trend was seen for the higher viscous lubricant LB. Computational fluid dynamic simulations showed that a rough surface, such as threaded channel, induced turbulent flow at the channel surface. Such turbulent air flow would disrupt the stagnant lubricant liquid in the boundary layer and reintroduce the lubricant droplets into the downstream air flow. The effect was more drastic on the low-viscous lubricant LA compared with the high-viscous lubricant LB.
  • For both lubricant types, the average droplet size and droplet density decreased as a function of increased radial distance. This showed that the dispersion of lubricant was most concentrated directly beneath the outlet tip and decreased at further collection points. This result was expected due to the conical shape of air flow out of a circular nozzle.
  • A rough lubricant channel of a WC–Co cutting tool can be etched chemically to produce desirable roughness from nanometer to micrometer levels. A low-frequency hand agitation helped to refresh the tool surface with new etchant, while a high-frequency ultrasonic agitation accelerated the material removal rate by cavitation mechanism. Scanning electron microscopy examination showed that all grinding marks on WC–Co inserts were effectively removed after etching for 12 min with hand and ultrasonic agitation.
Future work should consider:
(a)
Modify internal surface of coolant channels to achieve desirable surface roughness. This can be performed by flowing etchant through a channel for roughening, or pumping abrasive slurry through a channel for polishing.
(b)
Simulating oil–air mixture flow through simulated chemically etched surface. The result can be verified experimentally to characterize the airborne droplet, and confirmed with actual machining of metallic workpieces.

Author Contributions

Conceptualization, W.H.; experimental design and performance, M.C.; simulation, J.R., critical review, A.P.; funding acquisition, B.T. All authors have read and agreed to the published version of the manuscript.

Funding

This research was funded by the National Science Foundation under the GOALI Grant No. 1760985.

Institutional Review Board Statement

Not applicable.

Informed Consent Statement

Not applicable.

Data Availability Statement

The data are contained within the article.

Acknowledgments

Kind support was provided by Ford Motor Company, Unist Inc., and Texas A&M University Microscopy and Imaging Center Core Facility RRID:SCR_022128.

Conflicts of Interest

The authors declare no conflict of interest.

Nomenclature

EDMElectrical discharge machining
FT, PTFully threaded, partially threaded
HAHand agitation
HA + USHand agitation and ultrasonic pulsation
LA, LBLubricant A, B
MQLMinimum quantity lubrication
MIPMale iron pipe
T1, T2Trial 1, Trial 2
aDroplet radius
AArea of droplet calculated by ImageJ
CConstant for contact angle calculation
dAirborne droplet diameter
KLine tension
PProjected droplet diameter
VVolume of droplet
θContact angle
γLGSurface tension of liquid relative to gas
γSGSurface tension of solid relative to gas
γSLSurface tension of solid relative to liquid

References

  1. Sharma, V.S.; Singh, G.; Sørby, K. A Review on Minimum Quantity Lubrication for Machining Processes. Mater. Manuf. Process. 2014, 30, 935–953. [Google Scholar] [CrossRef]
  2. Tai, B.L.; Stephenson, D.A.; Furness, R.J.; Shih, A.J. Minimum Quantity Lubrication (MQL) in Automotive Powertrain Machining. Procedia CIRP 2014, 14, 523–528. [Google Scholar] [CrossRef] [Green Version]
  3. Khan, W.A.; Hoang, N.M.; Tai, B.; Hung, W.N. Through-tool minimum quantity lubrication and effect on machinability. J. Manuf. Process. 2018, 34, 750–757. [Google Scholar] [CrossRef]
  4. Stephenson, D.A.; Agapiou, J.S. Metal Cutting Theory and Practice; CRC Press: Boca Raton, FL, USA, 2019; pp. 803–822. [Google Scholar]
  5. Race, A.; Zwierzak, I.; Secker, J.; Walsh, J.; Carrell, J.; Slatter, T.; Maurotto, A. Environmentally sustainable cooling strategies in milling of SA516: Effects on surface integrity of dry, flood and MQL machining. J. Clean. Prod. 2020, 288, 125580. [Google Scholar] [CrossRef]
  6. Hwang, Y.K.; Lee, C.M. Surface roughness and cutting force prediction in MQL and wet turning process of AISI 1045 using design of experiments. J. Mech. Sci. Technol. 2010, 24, 1669–1677. [Google Scholar] [CrossRef]
  7. Tasdelen, B.; Wikblom, T.; Ekered, S. Studies on minimum quantity lubrication (MQL) and air cooling at drilling. J. Mater. Process. Technol. 2008, 200, 339–346. [Google Scholar] [CrossRef]
  8. Maruda, R.W.; Feldshtein, E.; Legutko, S.; Krolczyk, G. Research on emulsion mist generation in the conditions of minimum quantity cooling lubrication (MQCL). Teh. Vjesn.-Tech. Gaz. 2015, 22, 1213–1218. [Google Scholar]
  9. Maruda, R.W.; Krolczyk, G.M.; Feldshtein, E.; Pusavec, F.; Szydlowski, M.; Legutko, S.; Sobczak-Kupiec, A. A study on droplets sizes, their distribution and heat exchange for minimum quantity cooling lubrication (MQCL). Int. J. Mach. Tools Manuf. 2016, 100, 81–92. [Google Scholar] [CrossRef]
  10. Raval, J.K.; Tai, B.L. An optical tomographic method to characterize the mist distribution in MQL Tools. J. Manuf. Process. 2021, 62, 275–282. [Google Scholar] [CrossRef]
  11. Raval, J.K.; Kao, Y.-T.; Tai, B.L. Characterizing Mist Distribution in Through-Tool Minimum Quantity Lubrication Drills. J. Manuf. Sci. Eng. 2020, 142, 031002. [Google Scholar] [CrossRef]
  12. Kao, Y.-T.; Takabi, B.; Hu, M.; Tai, B.L. Coolant Channel and flow characteristics of MQL drill bits: Experimental and numerical analyses. In Proceedings of the ASME 2017 12th International Manufacturing Science and Engineering Conference Collocated with the JSME/ASME 2017 6th International Conference on Materials and Processing, Los Angeles, CA, USA, 4–8 June 2017; Volume 2. [Google Scholar]
  13. Yıldırım, Ç.V.; Kıvak, T.; Sarıkaya, M.; Erzincanlı, F. Determination of MQL Parameters Contributing to Sustainable Machining in the Milling of Nickel-Base Superalloy Waspaloy. Arab. J. Sci. Eng. 2017, 42, 4667–4681. [Google Scholar] [CrossRef]
  14. Tai, B.L.; Dasch, J.M.; Shih, A.J. Evaluation and Comparison of Lubricant Properties in Minimum Quantity Lubrication Machining. Mach. Sci. Technol. 2011, 15, 376–391. [Google Scholar] [CrossRef]
  15. Chinchanikar, S.; Choudhury, S.K. Hard turning using HiPIMS-coated carbide tools: Wear behavior under dry and minimum quantity lubrication (MQL). Measurement 2014, 55, 536–548. [Google Scholar] [CrossRef]
  16. Rahim, E.A.; Sasahara, H. Investigation of tool wear and surface integrity on MQL machining of Ti-6AL-4V using biodegradable oil. Proc. Inst. Mech. Eng. Part B J. Eng. Manuf. 2011, 225, 1505–1511. [Google Scholar] [CrossRef] [Green Version]
  17. Davim, J.P.; Sreejith, P.S.; Gomes, R.; Peixoto, C. Experimental studies on drilling of aluminium (AA1050) under dry, minimum quantity of lubricant, and flood-lubricated conditions. Proc. Inst. Mech. Eng. Part B J. Eng. Manuf. 2006, 220, 1605–1611. [Google Scholar] [CrossRef]
  18. Kishawy, H.; Dumitrescu, M.; Ng, E.-G.; Elbestawi, M. Effect of coolant strategy on tool performance, chip morphology and surface quality during high-speed machining of A356 aluminum alloy. Int. J. Mach. Tools Manuf. 2005, 45, 219–227. [Google Scholar] [CrossRef]
  19. Iskandar, Y.; Tendolkar, A.; Attia, M.; Hendrick, P.; Damir, A.; Diakodimitris, C. Flow visualization and characterization for optimized MQL machining of composites. CIRP Ann. 2014, 63, 77–80. [Google Scholar] [CrossRef]
  20. Dhar, N.; Kamruzzaman, M.; Ahmed, M. Effect of minimum quantity lubrication (MQL) on tool wear and surface roughness in turning AISI-4340 steel. J. Mater. Process. Technol. 2006, 172, 299–304. [Google Scholar] [CrossRef]
  21. Chetan; Behera, B.; Ghosh, S.; Rao, P. Wear behavior of PVD TiN coated carbide inserts during machining of Nimonic 90 and Ti6Al4V superalloys under dry and MQL conditions. Ceram. Int. 2016, 42, 14873–14885. [Google Scholar] [CrossRef]
  22. Said, Z.; Gupta, M.; Hegab, H.; Arora, N.; Khan, A.M.; Jamil, M.; Bellos, E. A comprehensive review on minimum quantity lubrication (MQL) in machining processes using nano-cutting fluids. Int. J. Adv. Manuf. Technol. 2019, 105, 2057–2086. [Google Scholar] [CrossRef]
  23. Carou, D.; Rubio, E.M.; Davim, J.P. A note on the use of the minimum quantity lubrication (MQL) system in turning. Ind. Lubr. Tribol. 2015, 67, 256–261. [Google Scholar] [CrossRef]
  24. Davim, J.P.; Sreejith, P.S.; Silva, J. Turning of Brasses Using Minimum Quantity of Lubricant (MQL) and Flooded Lubricant Conditions. Mater. Manuf. Process. 2007, 22, 45–50. [Google Scholar] [CrossRef]
  25. Sadeghi, M.H.; Haddad, M.J.; Tawakoli, T.; Emami, M. Minimal quantity lubrication-MQL in grinding of Ti–6Al–4V titanium alloy. Int. J. Adv. Manuf. Technol. 2008, 44, 487–500. [Google Scholar] [CrossRef]
  26. Haubner, R.; Kubelka, S.; Lux, B.; Griesser, M.; Grasserbauer, M. Murakami and H2SO4/H2O2 Pretreatment of WC-Co Hard Metal Substrates to Increase the Adhesion of CVD Diamond Coatings. In Proceedings of the Tenth European Conference on Chemical Vapour Deposition, Venice, Italy, 10–15 September 1995; Volume 5, pp. 753–760. [Google Scholar] [CrossRef] [Green Version]
  27. Chakravarthy, G.V.; Chandran, M.; Bhattacharya, S.S.; Ramachandra Rao, M.S.; Kamaraj, M. A comparative study on wear behavior of tin and diamond coated WC–co substrates against hypereutectic Al–Si Alloys. Appl. Surf. Sci. 2012, 261, 520–527. [Google Scholar] [CrossRef]
  28. Sha, L.; Zhiming, Y.; Danqing, Y.; Yongxia, L. Chemical pretreatments at the surface of WC-15 wt% Co for diamond coatings. In Powder Metallurgical High Performance Materials Proceedings. Volume 2: P/M Hard Materials, Proceedings of the 15th International Plansee Seminar, Reutte, Austria, 15–17 May 2001; Kneringer, G., Rodhammer, P., Wildner, H., Eds.; Plansee Holding AG: Reutte, Austria, 2001; Volume 2, p. 896. [Google Scholar]
  29. Jung, S.-W.; Kim, J.; Kang, S.-J.L. Etching for microstructural observation of cemented sub-micrometer-sized carbides. J. Am. Ceram. Soc. 2001, 84, 899–901. [Google Scholar] [CrossRef]
  30. Brujan, E.; Ikeda, T.; Matsumoto, Y. On the pressure of cavitation bubbles. Exp. Therm. Fluid Sci. 2008, 32, 1188–1191. [Google Scholar] [CrossRef]
  31. Pecha, R.; Gompf, B. Microimplosions: Cavitation Collapse and Shock Wave Emission on a Nanosecond Time Scale. Phys. Rev. Lett. 2000, 84, 1328–1330. [Google Scholar] [CrossRef]
  32. AZO Materials. Properties: Tungsten Carbide-An Overview. 2022. Available online: https://www.azom.com/properties.aspx?ArticleID=1203 (accessed on 10 April 2022).
  33. Patil, A.; Raval, J.; Bangma, T.; Edinbarough, I.; Tai, B.; Stephenseon, D.; Suleiman, O.; Hung, W.N. Characterization and Performance of Minimum Quantity Lubricants in Through-Tool Drilling. Int. J. Eng. Mater. Manuf. 2020, 5, 98–115. [Google Scholar] [CrossRef]
  34. Gibbs, J.W. The Scientific Papers in Two Volumes; Wiley: New York, NY, USA, 1961. [Google Scholar]
  35. Park, K.-H.; A Olortegui-Yume, J.; Joshi, S.; Kwon, P.; Yoon, M.-C.; Lee, G.-B.; Park, S.-B. Measurement of droplet size and distribution for minimum quantity lubrication (MQL). In Proceedings of the 2008 International Conference on Smart Manufacturing Application, Goyang-Si, Korea, 9–11 April 2008. [Google Scholar]
Figure 1. Schematic of dual helical lubricant delivery channels on a twist drill.
Dynamics 02 00019 g001
Figure 2. Micro-droplet system. A: Air regulator, B: air flow meter, C: pressure gage, D: MQL Unist Coolubricator, E: output nozzle, F: drop collection plate, and G: jack plate.
Dynamics 02 00019 g002
Figure 3. Test tip assembly and dimensions. (a) Nozzle assembly. (b) Nozzle details.
Dynamics 02 00019 g003aDynamics 02 00019 g003b
Figure 4. Polar coordinate representation of collection zones. The coordinate origin (location #5) is the projection of tip center.
Dynamics 02 00019 g004
Figure 5. Resultant microdroplet images for lubricants LA and LB at location #7 (39.6 mm, 219°) and 690 kPa.
Dynamics 02 00019 g005
Figure 6. Airborne droplet diameter distribution for (A) LA and (B) LB.
Dynamics 02 00019 g006aDynamics 02 00019 g006b
Figure 7. Effect of radial distance and surface roughness on (a) droplet size and (b) droplet density of lubricants LA and LB. S: smooth, PT: partially threaded, FT fully threaded.
Dynamics 02 00019 g007
Figure 8. Effect of channel roughness air flow. (a) Air flow above a smooth channel, 410 kPa pressure. (b) Air flow above partial threaded channel, 410 kPa pressure. (c) Air flow above fully threaded channel, 410 kPa pressure.
Dynamics 02 00019 g008aDynamics 02 00019 g008b
Figure 9. Change in surface roughness of WC–Co with etching time. HA: hand agitation, HA + US: hand and ultrasonic agitation.
Dynamics 02 00019 g009
Figure 10. Surface profile of WC–Co inserts before and after etching. (a) Before etching. Optical image. (b) Before etching. SEM image. (c) Etched 12 min, hand agitation. (d) Etched 12 min, hand agitation and ultrasonic.
Dynamics 02 00019 g010
Table 1. Resultant average droplet diameters (µm). Adapted with permission from [3] Hung, 2018.
Pressure (kPa)Rough Channel (16.2 µm Ra)Polished Channel (3.2 µm Ra)
2759.211.42
4157.259.31
5504.697.6
Table 2. Tested lubricants and properties. Adapted with permission from [33], Hung, 2020.
PropertiesLALB
Oil Type Fatty acid + alcoholVegetable
Kinematic viscosity at 40 °C (mm2/s)14.528
Kinematic viscosity at 100 °C (SUS)Not available148
Flashpoint (°C)93194
Density (kg/L)0.82–0.92 @60 °C0.838 @20 °C
Thermal conductivity at 40 °C (W/m°K)Not available0.1593
Contact angle on glass22°
SolubilityHydrocarbons,
alcohols
Insoluble in water
Table 3. Setup for micro-droplet collection.
ParameterTip to Grid Distance (mm)Air Flow Rate (m3/h)Air Pressure (kPa)Oil Pump
Frequency (Strokes/min)
Collection Time (s)Lubricant Flow Rate (mL/h)
Set Point3560.566 690 40 1 60
Table 4. MQL Boundary Conditions for Flow Simulation.
Total Inlet Pressure (MPa)Static Inlet Pressure (MPa)Outlet Pressure (MPa)Inlet Temperature (°K)Outlet Temperature (°K)Primary PhaseSecondary Phase
0.410.170300300airlubricant
Table 5. Airborne droplet distribution.
Lubricant A (14.5 mm2/s Viscosity)Lubricant B (28.0 mm2/s Viscosity)
Channel SurfaceMean (µm)S. Deviation (µm)Droplet CountMean (µm)S. Deviation (µm)Droplet Count
Fully threaded4.934.20844515.1511.121905
Partially threaded6.715.90698813.5311.642033
Smooth7.056.33613210.4111.752744
Table 6. Surface roughness before and after etching. HA: hand agitation, HA + US: hand agitation and ultrasonic. T1: Trial 1 and T2: Trial 2, each with 4 random measurements.
Before EtchingAfter 5 min EtchingBefore EtchingAfter 12 min EtchingBefore EtchingAfter 20 min Etching
HA
Ra
Average T1, T2 (nm)N/AN/A64, 20267, 46262, 1251001, 997
S. Deviation T1, T2 (nm)N/AN/A10, 189, 1113, 6213, 36
HA
Sa
Average T1, T2 (nm)N/AN/A97, 292129, 636112, 3091207, 1453
S. Deviation T1, T2 (nm)N/AN/A6, 5121, 975, 3949, 139
HA + US
Ra
Average T1, T2 (nm)81, 7088, 7472, 56760, 150107, 1541436, 1166
S. Deviation T1, T2 (nm)32, 931, 715, 3158, 196, 380, 21
HA + US
Sa
Average T1, T2 (nm)233, 277263, 293260, 1061089, 289155, 2421447, 1236
S. Deviation T1, T2 (nm)97, 35108, 3729, 5115, 4031, 19247, 153
Publisher’s Note: MDPI stays neutral with regard to jurisdictional claims in published maps and institutional affiliations.