
Model-Based Optimization of Mannitol Production by Using a Sequence of Batch Reactors for a Coupled Bi-Enzymatic Process—A Dynamic Approach


Abstract
:1. Introduction
- Sequential Batch-to-batch Reactors (SeqBR) (Figure 2) consist of a certain number of (usually identical) BR operated in series. The BR content is transferred from every BR to the next one, with adjusting the reactants and/or biocatalyst(s) amounts (concentrations) at the beginning of each BR, to reach optimal levels (off-line determined in this paper) [13,14];
Paper’s Novelty
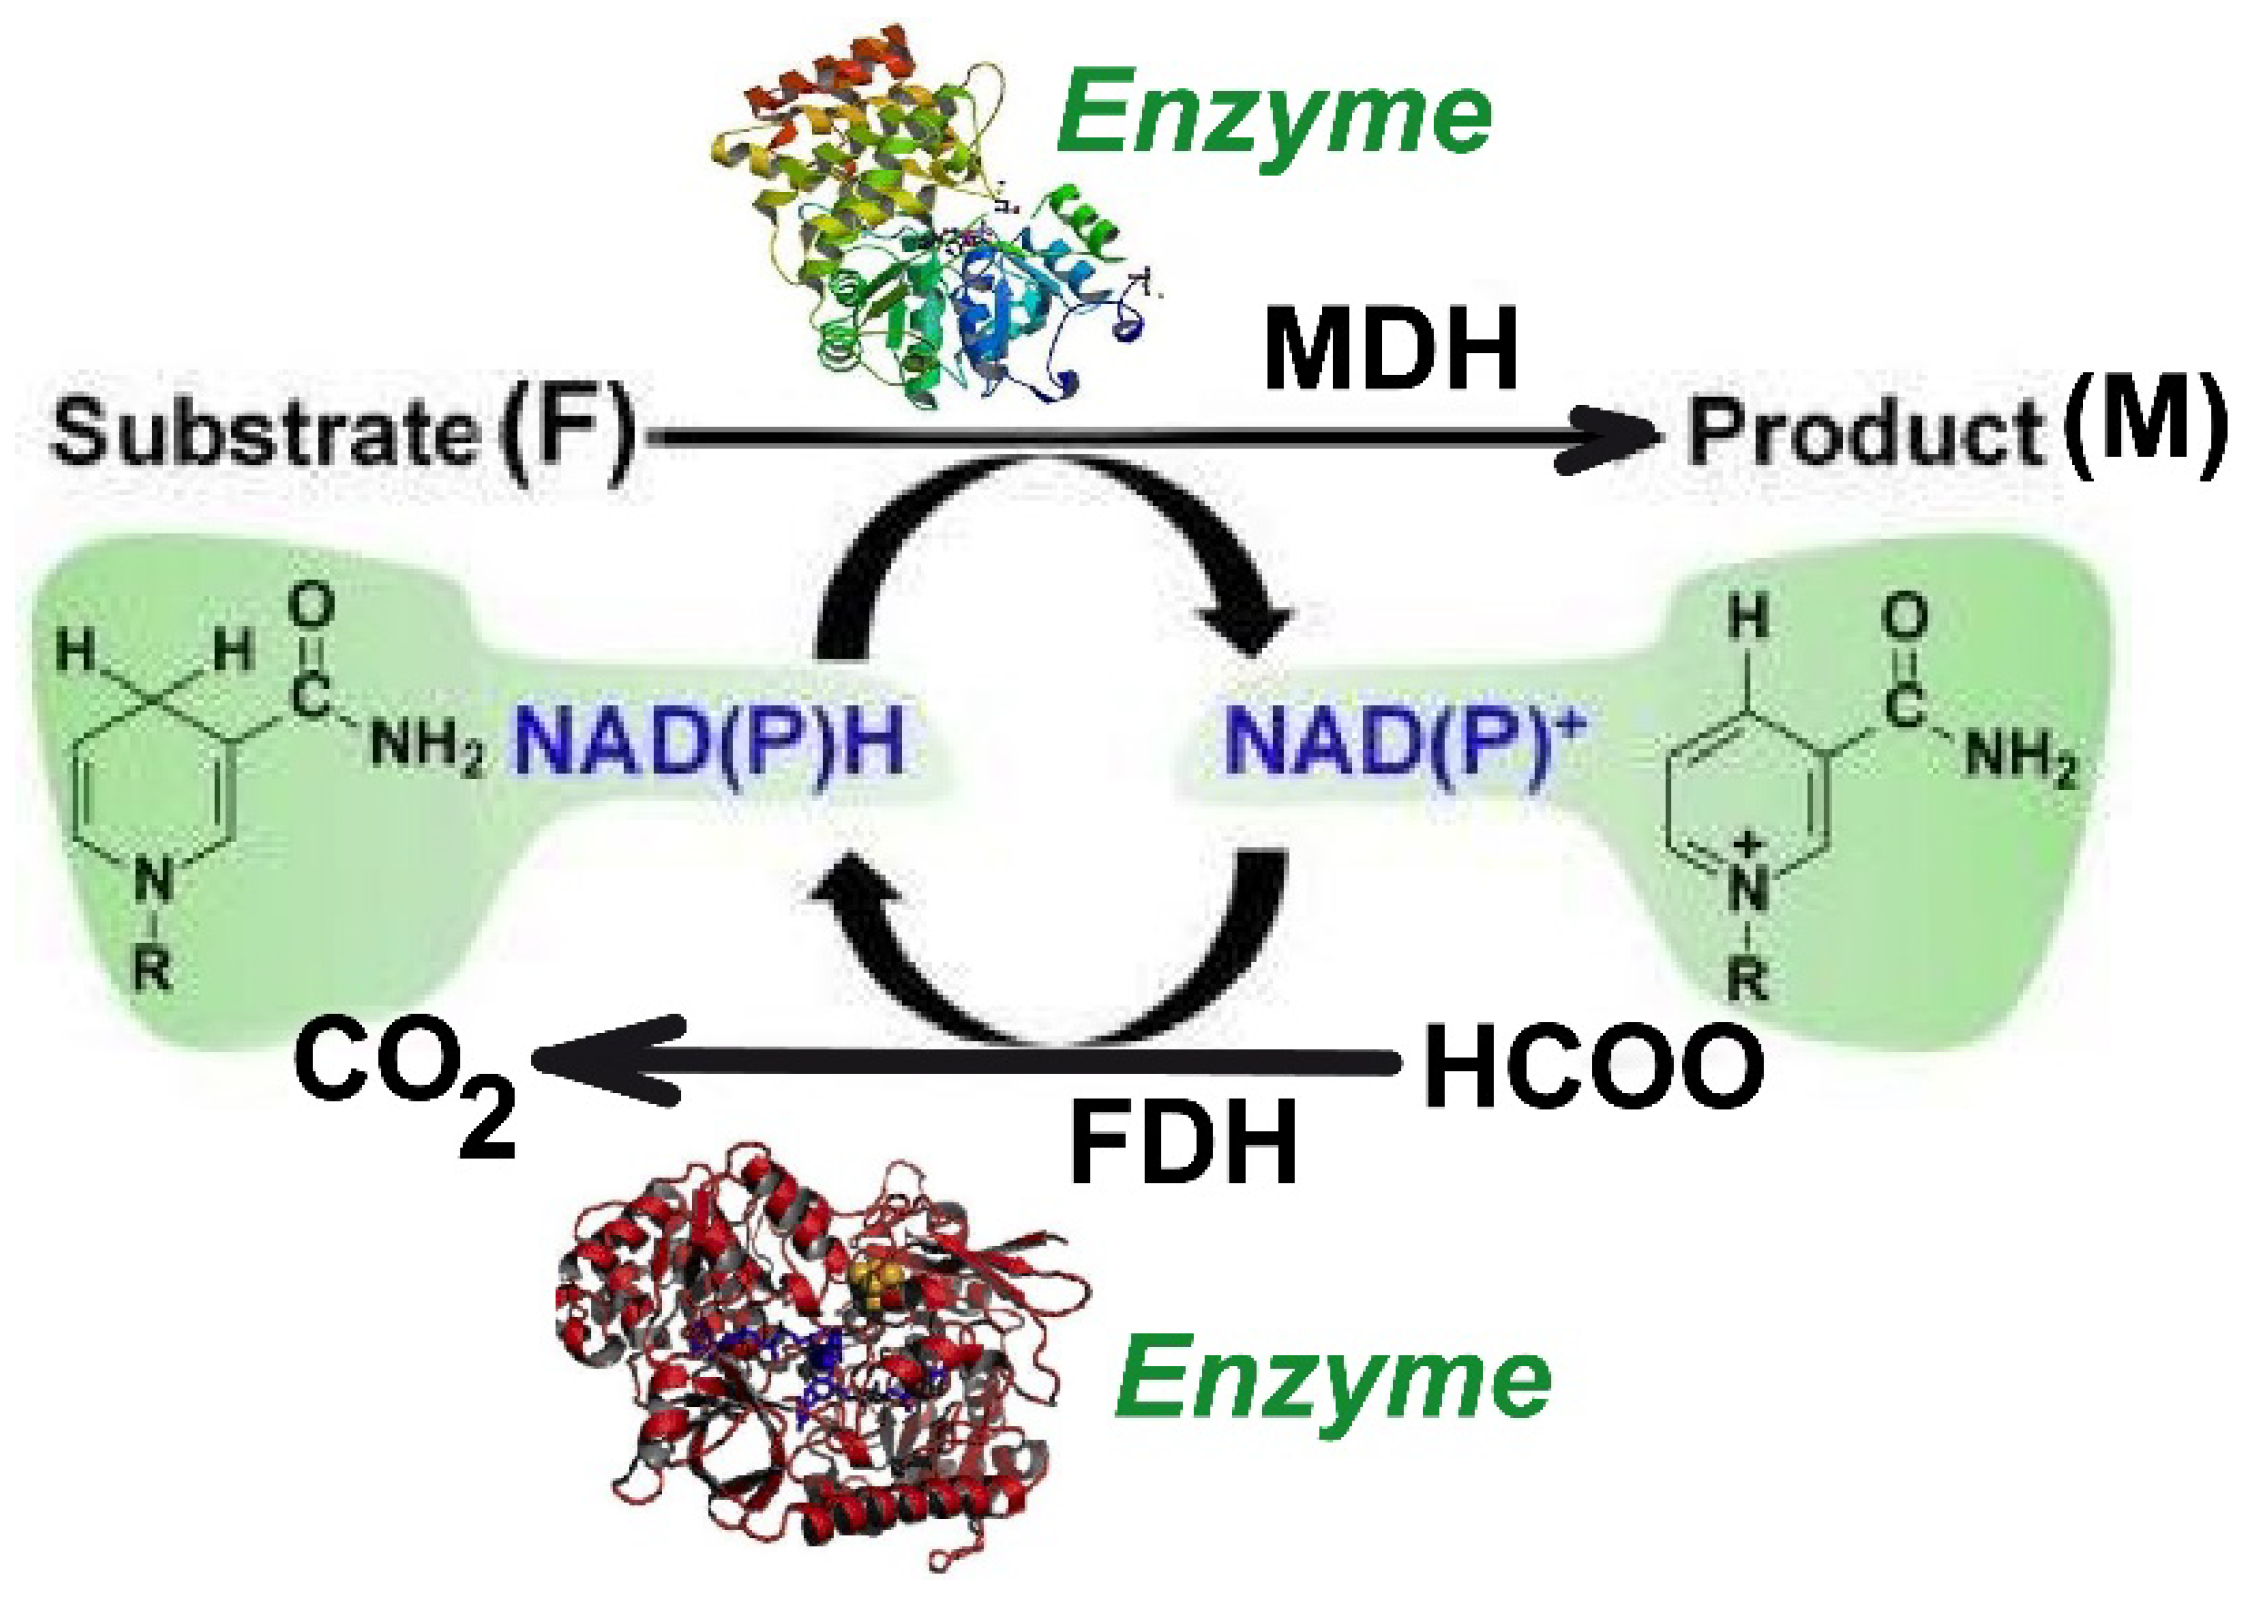
2. Process Kinetics
The Kinetic Model
3. Optimal BR
3.1. Reactor Model
3.2. Optimal BR Operation
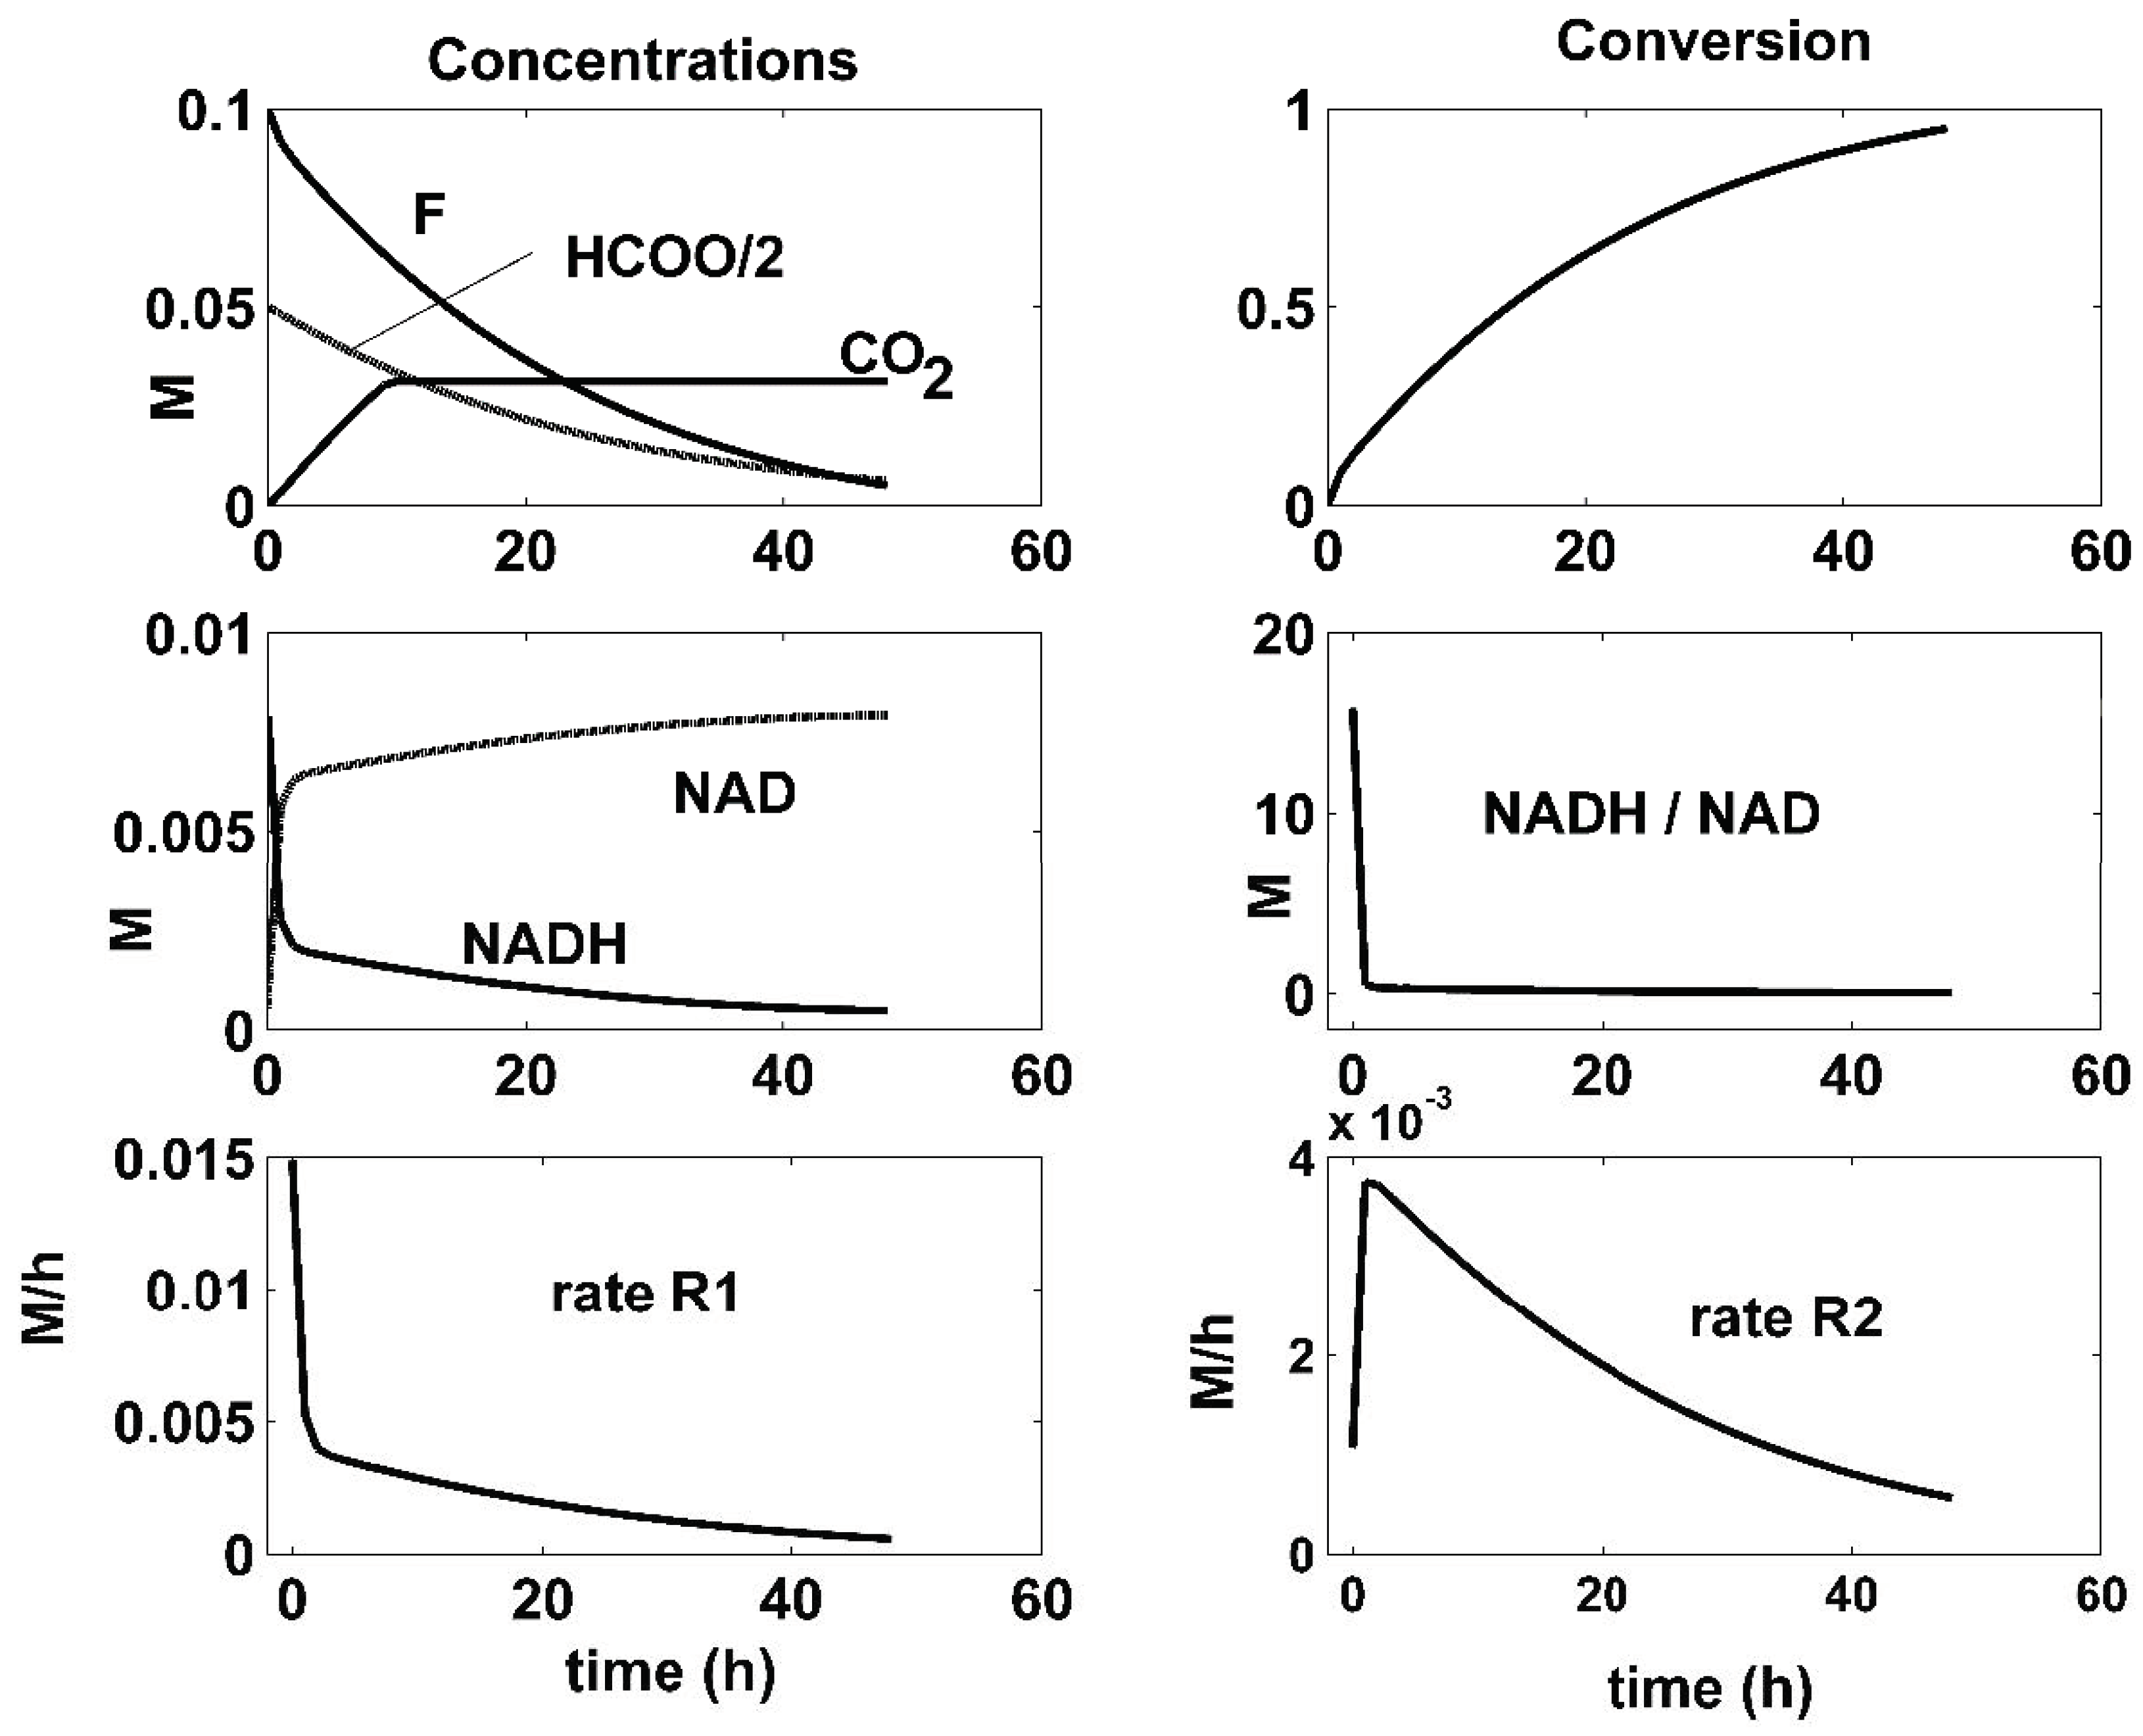
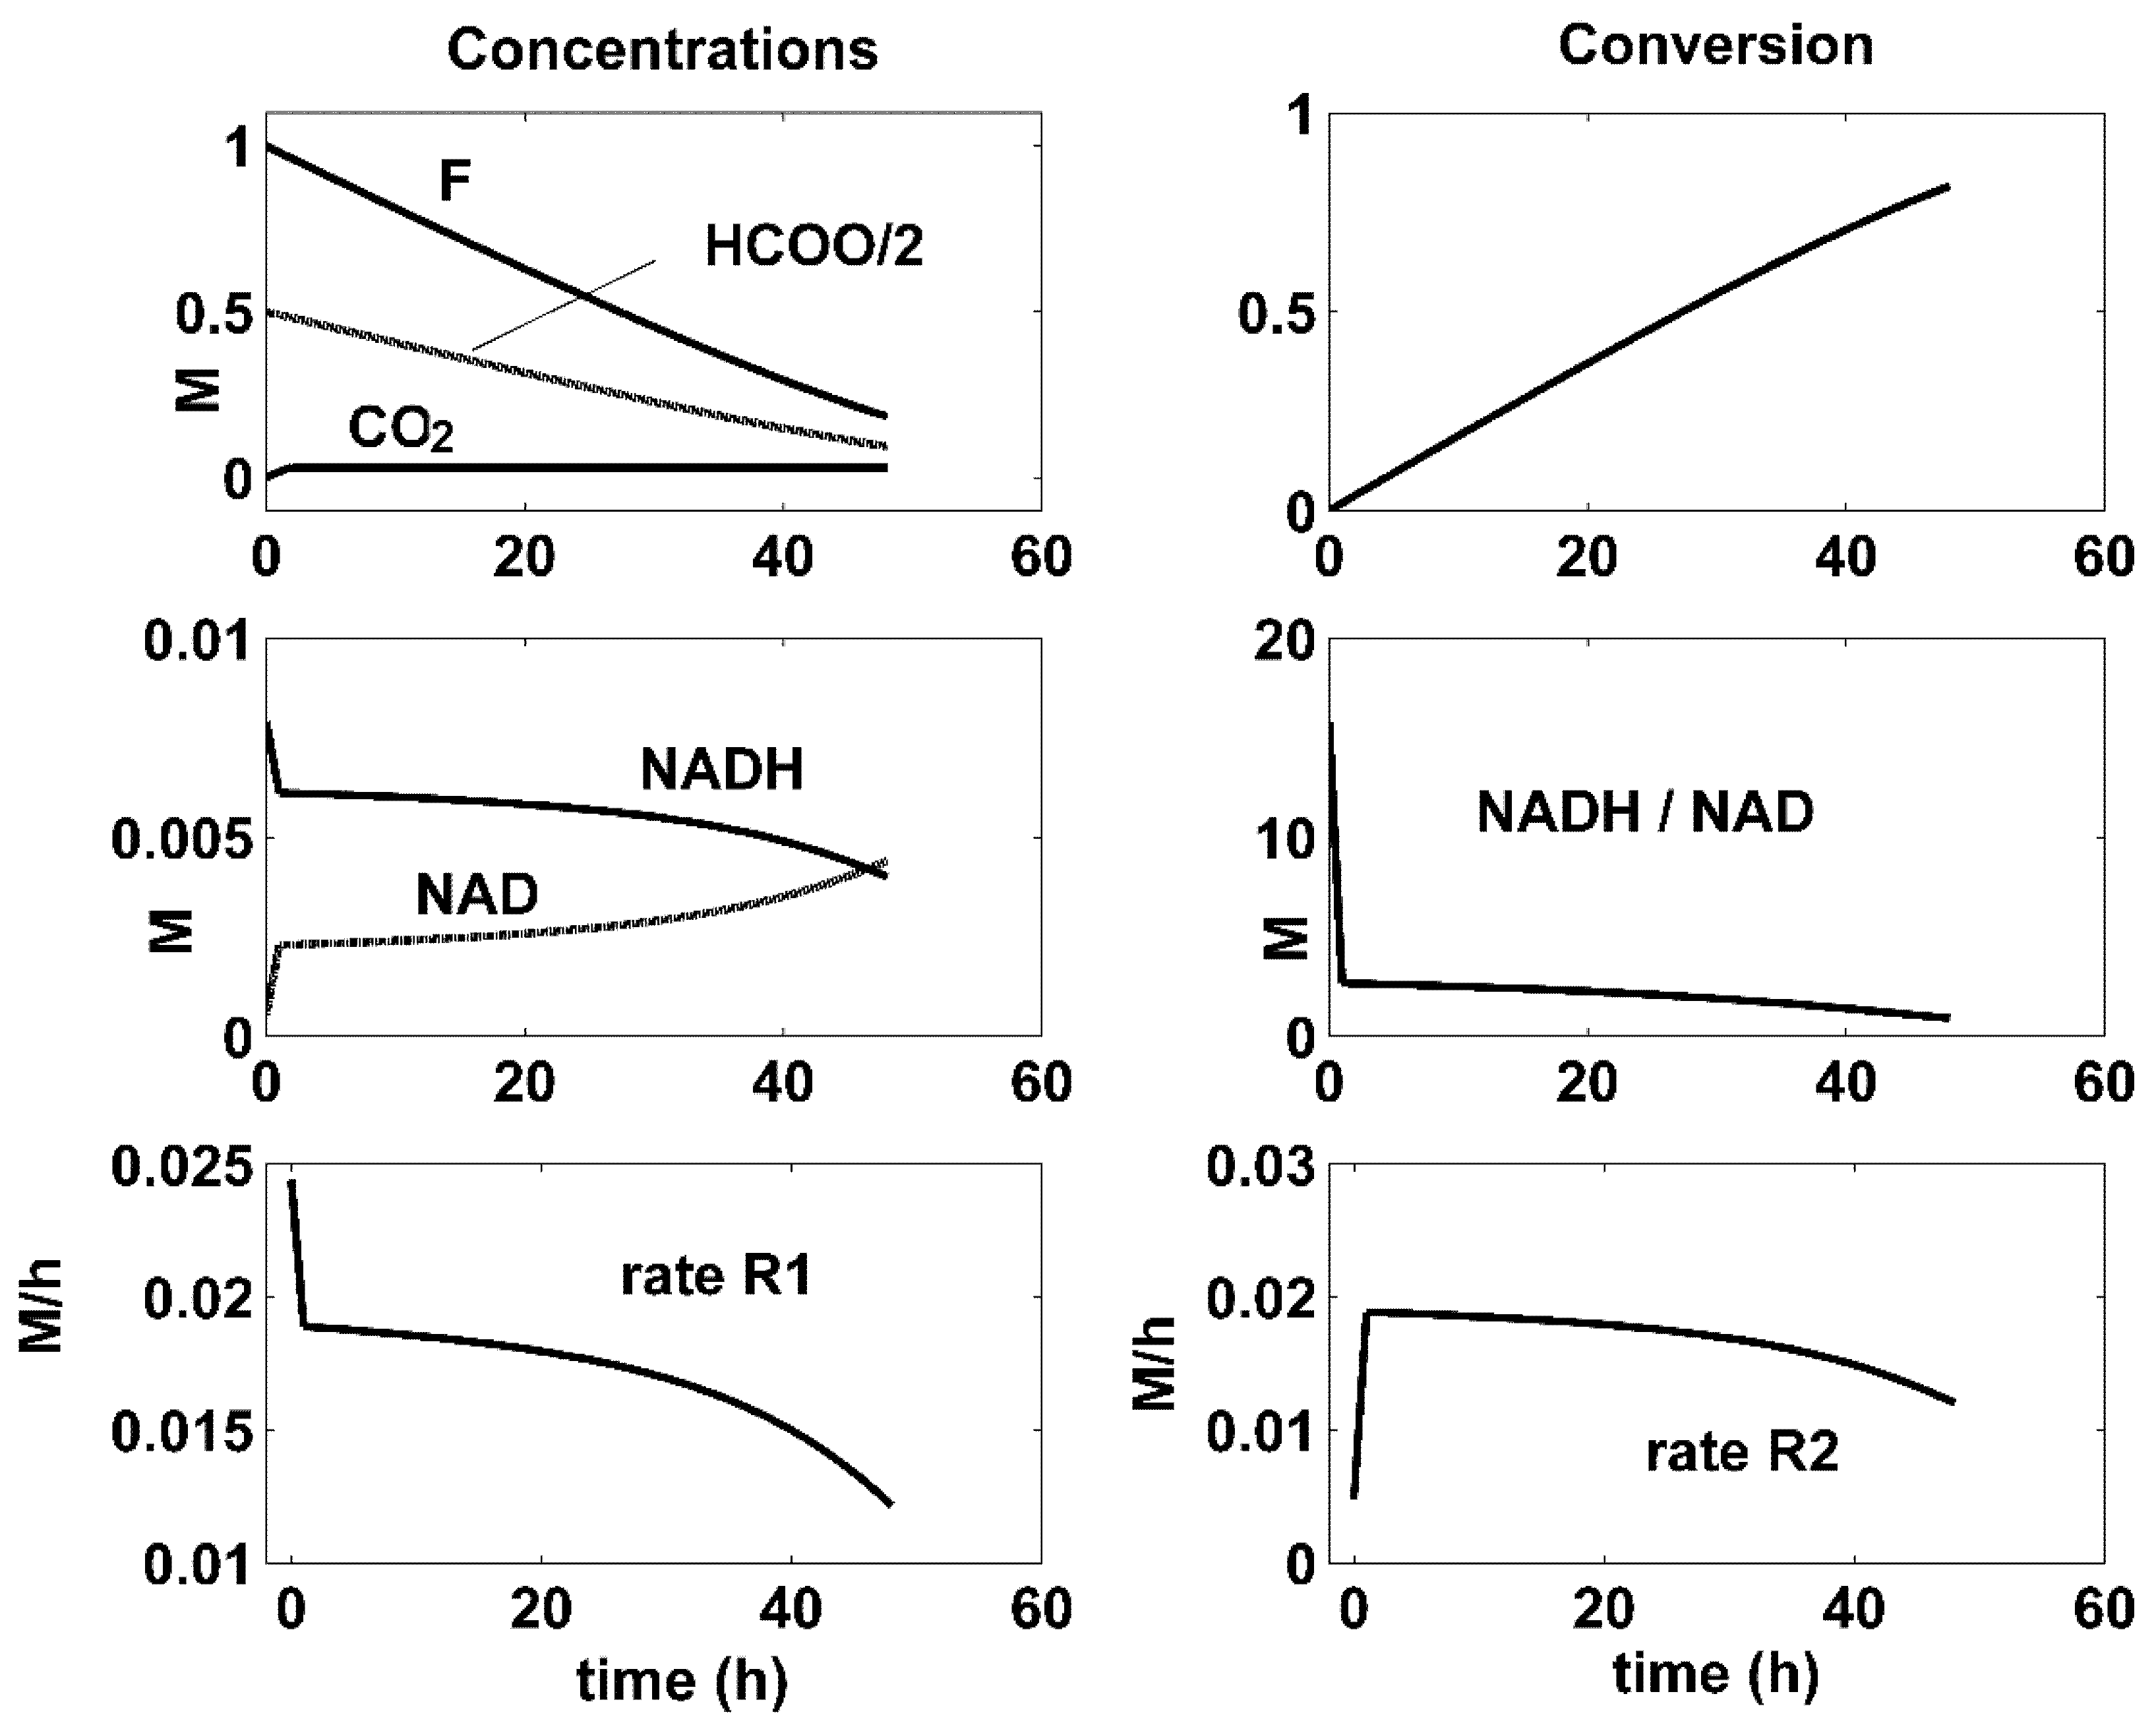
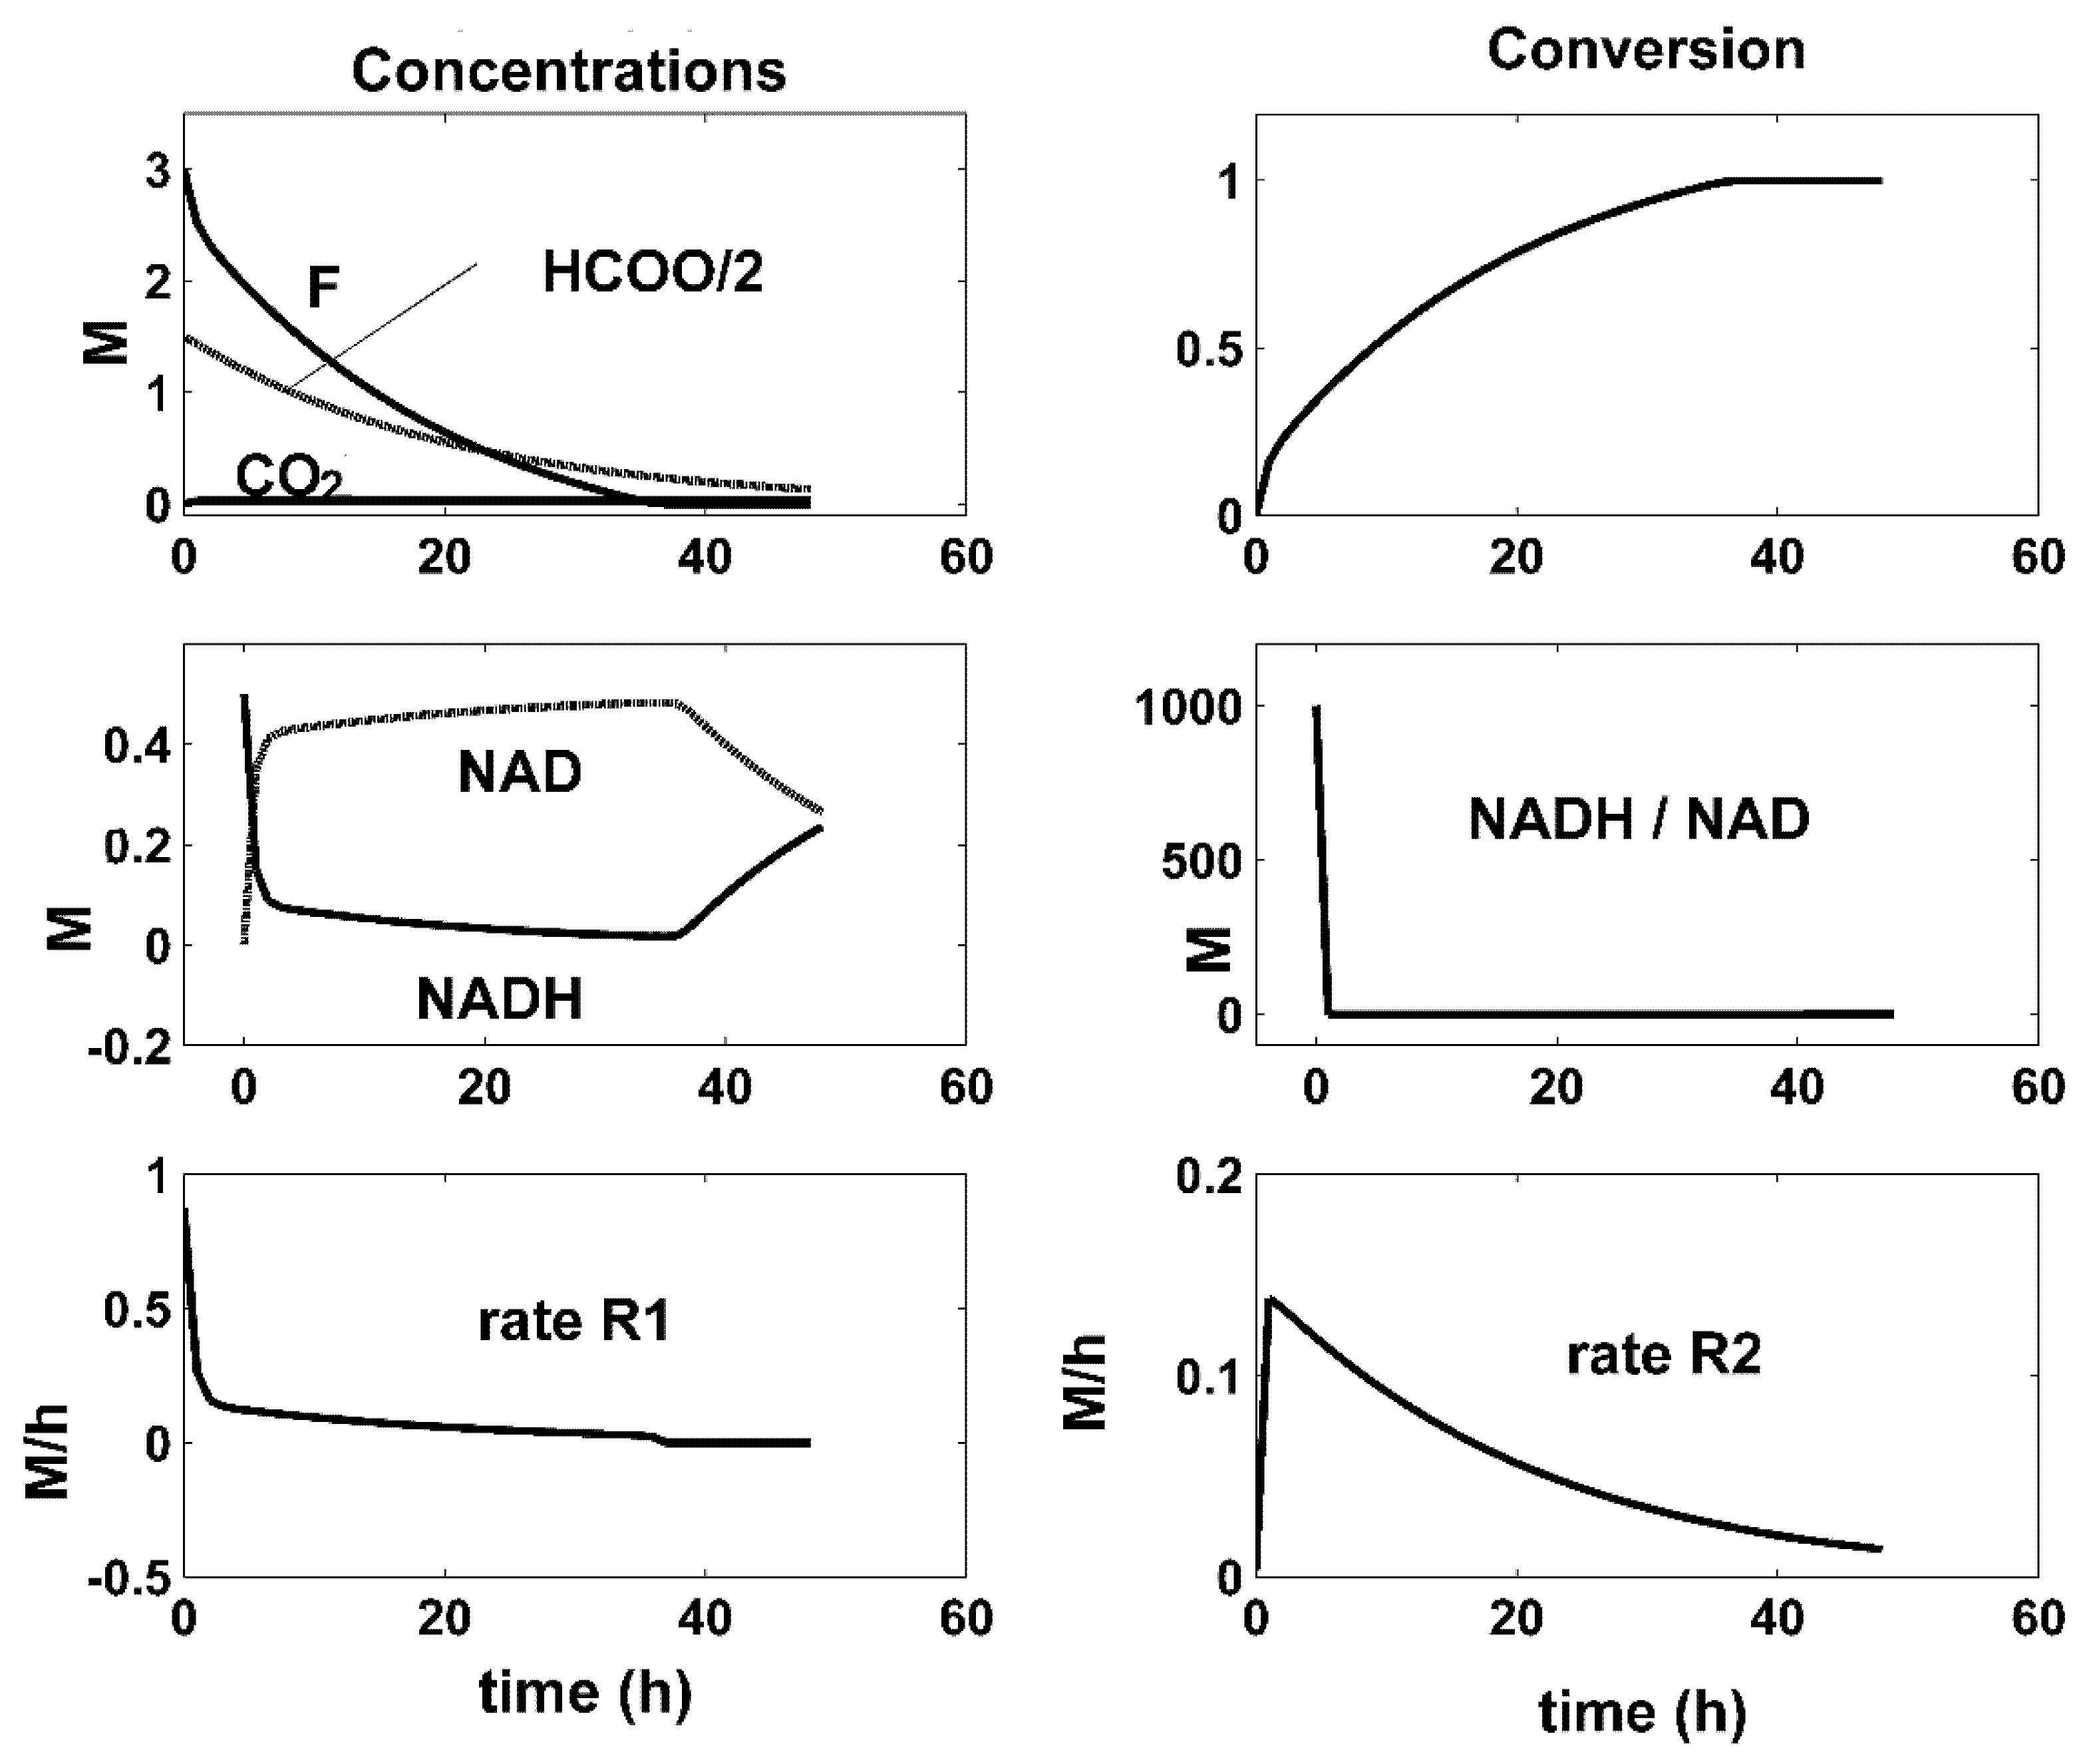
- There is a close connection between the coupling reactions, enzyme concentrations, and the quasi-stationarity of the NADH/NAD ratio over the batch. For all the optimal conditions of Figure 4, Figure 5 and Figure 6, the two enzymatic reactions are well coupled. Thus, the ratio of the high reaction rates R1 and R2 reaches a quasi-stationary level, leading to a quasi-constant NADH/NAD ratio much higher than 10, thus maintaining the process efficiency.
4. Optimal SeqBR
4.1. Control Variable Choice
4.2. The Choice of NBR
4.3. Optimization Problem Formulation for the SeqBR
- Determine the optimal initial conditions for every BR from the series to ensure the highest productivity in mannitol at the SeqBR output, which is the output of the last (NBR)-th BR; and
- Minimize the costly enzymes’ overall consumption (MDH and FDH) while preserving the best connection of the two enzymatic reactions to ensure a quick regeneration of the cofactor and a high fructose reduction rate.
5. Results and Discussion
5.1. Optimization Problem (I), Equations (1+3) of Section 4.3
5.2. Optimization Problem (II), Equations (2+3) of Section 4.3
5.3. Additional Conclusions about the Results of the Optimization Problems (I) and (II)
6. Conclusions
Author Contributions
Funding
Data Availability Statement
Conflicts of Interest
Nomenclature
| species j concentration | |
| species j saturation level | |
| , | rate constants |
| Min/Max | minimum/maximum |
| , R1, R2 | species j reaction rate; reaction rates |
| time | |
| the batch time | |
| V | the BR volume |
| fructose conversion | |
| W | the objective function of the optimization problem |
| Greek Symbols | |
| ε | accepted tolerance to achieve the target conversion |
| stoichiometric coefficient of species j in the reaction i | |
| Index | |
| o | initial |
| f | final |
| Abbreviations | |
| arg | the argument of a function |
| BR | batch reactor |
| BRP | BR with intermittent addition of enzyme solution |
| CSTR | continuous stirred-tank reactor |
| Conv. | conversion |
| DO | dissolved oxygen |
| E | enzyme |
| F | D-fructose |
| FDH | formate dehydrogenase |
| FXBR | fixed-bed solid–liquid continuous reactor |
| GFS | fructose/glucose syrup |
| HCOO- | formate |
| M | mannitol |
| MACR/MASCR | mechanically agitated solid–liquid (semi-)continuous reactor |
| MDH | mannitol dehydrogenase |
| NAD(P)H | nicotinamide adenine dinucleotide (phosphate) |
| NAD, NAD+ | nicotinamide adenine dinucleotide (oxidized form) |
| NLP | nonlinear Programming Problem |
| NBR | number of BR connected in series |
| SeqBR | sequential batch-to-batch reactor |
| SBR | semi-batch reactor |
| [X] | concentration of X |
References
- Liese, A.; Seelbach, K.; Wandrey, C. Industrial Biotransformations. Wiley-VCH: Weinheim, Germany, 2006. [Google Scholar]
- Straathof, A.J.J.; Adlercreutz, P. Applied Biocatalysis; Harwood Academic Publ.: Amsterdam, The Netherlands, 2005. [Google Scholar]
- Xue, R.; Woodley, J.M. Process technology for multi-enzymatic reaction systems. Bioresour. Technol. 2012, 115, 183–195. [Google Scholar] [CrossRef]
- Maria, G. Enzymatic reactor selection and derivation of the optimal operation policy by using a model-based modular simulation platform. Comput. Chem. Eng. 2012, 36, 325–341. [Google Scholar] [CrossRef]
- Maria, G.; Crisan, M. Evaluation of optimal operation alternatives of reactors used for D-glucose oxidation in a bi-enzymatic system with a complex deactivation kinetics. Asia-Pac. J. Chem. Eng. 2014, 10, 22–44. [Google Scholar] [CrossRef]
- Crisan, M.; Maria, G. Modular simulation to determine the optimal operating policy of a batch reactor for the enzymatic fructose reduction to mannitol with the in-situ continuous enzymatic regeneration of the NAD cofactor. Rev. Chimie (Bucharest) 2017, 68, 2196–2203. [Google Scholar] [CrossRef]
- Maria, G.; Crisan, M. Operation of a mechanically agitated semi-continuous multi-enzymatic reactor by using the Pareto-optimal multiple front method. J. Process Control 2017, 53, 95–105. [Google Scholar] [CrossRef]
- Maria, G. Model-based heuristic optimised operating policies for D-glucose oxidation in a batch reactor with pulsate addition of enzyme. Comput. Chem. Eng. 2007, 31, 1231–1241. [Google Scholar] [CrossRef]
- Gajardo, P.; Ramirez, H.C.; Rapaport, A.E. Minimal time sequential batch reactors with bounded and impulse controls for one or more species. SIAM J. Control Optim. 2008, 47, 2827–2856. [Google Scholar] [CrossRef] [Green Version]
- Maria, G. Model-based optimisation of a batch reactor with a coupled bi-enzymatic process for mannitol production. Comput. Chem. Eng. 2020, 133, 106628–106635. [Google Scholar] [CrossRef]
- Wang, C.; Quan, H.; Xu, X. Optimal design of multiproduct batch chemical process using genetic algorithms. Ind. Eng. Chem. Res. 1996, 35, 3560–3566. [Google Scholar] [CrossRef]
- Wang, P. Multi-scale features in recent development of enzymic biocatalyst systems. Appl. Biochem. Biotechnol. 2009, 152, 343–352. [Google Scholar] [CrossRef]
- Martinez, E. Batch-to-batch optimization of batch processes using the STATSIMPLEX search method. In Proceedings of the 2nd Mercosur Congress on Chemical Engineering, Rio de Janeiro, Brazil, 14–18 August 2005. Paper No. 20. [Google Scholar]
- Dewasme, L.; Cote, F.; Filee, P.; Hantson, A.L.; Wouwer, A.V. Macroscopic dynamic modeling of sequential batch cultures of hybridoma cells: An experimental validation. Bioengineering (Basel) 2017, 4, 17. [Google Scholar] [CrossRef] [Green Version]
- Maria, G. Model-based optimization of a fed-batch bioreactor for mAb production using a hybridoma cell culture. Molecules 2020, 25, 5648. [Google Scholar] [CrossRef]
- DiBiasio, D. Introduction to the control of biological reactors. In Chemical Engineering Problems in Biotechnology; Shuler, M.L., Ed.; American Institute of Chemical Engineers: New York, NY, USA, 1989; pp. 351–391. [Google Scholar]
- Smets, I.Y.; Claes, J.E.; November, E.J.; Bastin, G.P.; van Impe, J.F. Optimal adaptive control of (bio)chemical reactors: Past, present and future. J. Process Control. 2004, 14, 795–805. [Google Scholar] [CrossRef]
- Scoban, A.G.; Maria, G. Model-based optimization of the feeding policy of a fluidized bed bioreactor for mercury uptake by immobilized Pseudomonas putida cells. Asia-Pac. J. Chem. Eng. 2016, 11, 721–734. [Google Scholar] [CrossRef]
- Amribt, Z.; Dewasme, L.; Wouwer, A.V.; Bogaerts, P. Optimization and robustness analysis of hybridoma cell fed-batch cultures using the overflow metabolism model. Bioprocess Biosyst. Eng. 2014, 37, 1637–1652. [Google Scholar] [CrossRef] [PubMed]
- Binette, J.C.; Srinivasan, B. On the use of nonlinear model predictive control without parameter adaptation for batch processes. Processes 2016, 4, 27. [Google Scholar] [CrossRef] [Green Version]
- Franco-Lara, E.; Weuster-Botz, D. Estimation of optimal feeding strategies for fed-batch bioprocesses, Estimation of optimal feeding strategies for fed-batch bioprocesses. Bioprocess Biosyst. Eng. 2005, 28, 71–77. [Google Scholar] [CrossRef] [Green Version]
- Maria, G.; Dan, A. Derivation of optimal operating policies under safety and technological constraints for the acetoacetylation of pyrrole in a semi-batch catalytic reactor. Comput. Chem. Eng. 2011, 35, 177–189. [Google Scholar] [CrossRef]
- Logist, F.; Houska, B.; Diehl, M.; Van Impe, J.F. Robust optimal control of a biochemical reactor with multiple objectives. Comput. Aided Chem. Eng. 2011, 29, 1460–1464. [Google Scholar] [CrossRef]
- Enitan, A.M.; Adeyemo, J.; Olofintoye, O.O.; Bux, F.; Swalaha, F.M. Multi-objective Optimization of Methane Producing UASB Reactor Using a Combined Pareto Multi–objective Differential Evolution Algorithm (CPMDE). In EVOLVE—A Bridge between Probability, Set Oriented Numerics, and Evolutionary Computation; Advances in Intelligent Systems and, Computing; Tantar, A.A., Tantar, E., Sun, J.Q., Zhang, W., Ding, Q., Schütze, O., Emmerich, M., Legrand, P., Moral, P.D., Coello, C.A.C., Eds.; Springer: Cham, Switzerland, 2014; Volume 288. [Google Scholar] [CrossRef]
- Rangaiah, G.P.; Petriciolet, A.B. (Eds.) Multi-Objective Optimization in Chemical Engineering: Developments and Applications; Wiley: New York, NY, USA, 2013. [Google Scholar]
- Slatner, M.; Nagl, G.; Haltrich, D.; Kulbe, K.D.; Nidetzky, B. Enzymatic production of pure D-mannitol at high productivity. Biocatal. Biotransform. 1998, 16, 351–363. [Google Scholar] [CrossRef]
- Saha, B.C.; Racine, F.M. Biotechnological production of mannitol and its applications. Appl. Microbiol. Biotechnol. 2011, 89, 879–891. [Google Scholar] [CrossRef]
- Bhatt, S.M.; Mohan, A.; Srinivastava, S.K. Challenges in enzymatic route of mannitol production. ISRN Biotechnol. 2013, 914187. [Google Scholar] [CrossRef] [Green Version]
- Von Weymarn, N. Process Development for Mannitol Production by Lactic Acid Bacteria. Ph.D. Thesis, TU Helsinki, Espoo, Finland, 2002. Available online: http://lib.tkk.fi/Diss/2002/isbn9512258854/isbn9512258854.pdf (accessed on 28 May 2021).
- Chenault, H.K.; Whitesides, G.M. Regeneration of nicotinamide cofactors for use in organic synthesis. Appl. Biochem. Biotechnol. 1987, 14, 147–197. [Google Scholar] [CrossRef]
- Maria, G.; Ene, M.D. Modelling enzymatic reduction of 2-keto-D-glucose by suspended aldose reductase. Chem. Biochem. Eng. Q. 2013, 27, 385–395. [Google Scholar]
- Bäumchen, C.; Roth, A.H.F.J.; Biedendieck, R.; Malten, M.; Follmann, M.; Sahm, H.; Bringer-Meyer, S.; Jahn, D. D-Mannitol production by resting state whole cell biotransformation of D-fructose by heterologous mannitol and formate dehydrogenase gene expression in Bacillus megaterium. Biotechnol. J. 2007, 2, 1408–1416. [Google Scholar] [CrossRef] [PubMed]
- Maria, G.; Ene, M.D.; Jipa, I. Modelling enzymatic oxidation of D-glucose with pyranose 2-oxidase in the presence of catalase. J. Mol. Catal. B Enzym. 2012, 74, 209–218. [Google Scholar] [CrossRef]
- Maria, G. ARS combination with an evolutionary algorithm for solving MINLP optimization problems. In Modelling, Identification and Control; Hamza, M.H., Ed.; IASTED/ACTA Press: Anaheim, CA, USA, 2003; pp. 112–118. Available online: https://www.actapress.com/Content_of_Proceeding.aspx?proceedingID=213 (accessed on 7 March 2021).
- Carroll, J.J.; Mather, A.E. The system carbon dioxide-water and the Krichevsky-Kasarnovsky equation. J. Solut. Chem. 1992, 21, 607–621. [Google Scholar] [CrossRef]
- Reid, R.C.; Prausnitz, J.M.; Poling, B.E. The Properties of Gases and Liquids, 4th ed.; McGraw-Hill: Boston, MA, USA, 1987. [Google Scholar]
- Moser, A. Bioprocess Technology: Kinetics and Reactors; Springer: New York, NY, USA, 1988. [Google Scholar]
- Loeblein, C.; Perkins, J.; Srinivasan, B.; Bonvin, D. Performance analysis of on-line batch optimization systems. Comput. Chem. Eng. 1997, 21, S867–S872. [Google Scholar] [CrossRef] [Green Version]
- Bharat, A. Process Analytical Technology (PAT); Msc-Diss; Padmashree Dr.Vithalrao Vikhe Patil Foundation’s, College of Pharmacy: Ahmed Nagar, India, 2013; Available online: https://www.slideshare.net/anjalibharat19/process-analytical-tchnology (accessed on 28 November 2020).
- Irvine, R.L.; Busch, A.W. Sequencing batch biological reactors—An overview. J. Water Pollut. Control Fed. 1979, 51, 235–243. Available online: http://www.jstor.org/stable/25039819 (accessed on 2 April 2012).
- Shacham, M. Semicontinuous fed-batch and cyclic-fed batch operation. In Proceedings of the Workshop “Modern Problem Solving Techniques in Engineering with POLYMATH, Excel and MATLAB”, Tel-Aviv University, Tel Aviv, Israel, 23 September 2008; pp. 1439–1441, Chapter 14.13. Available online: http://www.eng.tau.ac.il/~brauner/Workshop08Participant/Example-7/Prob-14-13.pdf; http://www.eng.tau.ac.il/~brauner/ (accessed on 23 February 2021).
- US EPA. Wastewater Technology Fact Sheet: Sequencing Batch Reactors; OWM, Water Permits Division, Municipal Branch: Washington, DC, USA, 2012. Available online: https://www3.epa.gov/npdes/pubs/sbr_new.pdf (accessed on 23 February 2021).
- Rätze, K.H.G.; Jokiel, M.; Sundmacher, K. Cyclic Operation of a Semibatch Reactor for the Hydroformylation of Long-Chain Olefins and Integration in a Continuous Production Process. In Proceedings of the ISCRE 25 Symposium (International Symposia on Chemical Reaction Engineering), Florence, Italy, 20–23 May 2018; Elsevier: Amsterdam, The Netherlands, 2018. [Google Scholar]
- Sawatzki, A.; Hans, S.; Narayanan, H.; Haby, B.; Krausch, N.; Sokolov, M.; Glauche, F.; Riedel, S.L.; Neubauer, P.; Bournazou, M.N.C. Accelerated bioprocess development of endopolygalacturonase-production with Saccharomyces cerevisiae using multivariate prediction in a 48 mini-bioreactor automated platform. Bioengineering 2018, 5, 101. [Google Scholar] [CrossRef] [Green Version]
- Hans, S.; Ulmer, C.; Narayanan, H.; Brautaset, T.; Krausch, N.; Neubauer, P.; Schäffl, I.; Sokolov, M.; Bournazou, M.N.C. Monitoring parallel robotic cultivations with online multivariate analysis. Processes 2020, 8, 582. [Google Scholar] [CrossRef]
- Avili, M.G.; Fazaelipoor, M.H.; Jafari, S.A.; Ataei, S.A. Comparison between batch and fed-batch production of rhamnolipid by Pseudomonas aeruginosa. Iran. J. Biotechnol. 2012, 10, 263–269. [Google Scholar]
- Froment, G.F.; Bischoff, K.B. Chemical Reactor Analysis and Design; Wiley: New York, NY, USA, 1990. [Google Scholar]
- Rao, S.S. Engineering Optimization—Theory and Practice; Wiley: New York, NY, USA, 2009; Chapter 14.10. [Google Scholar]
- Maria, G. Adaptive random search and shortcut techniques for process model identification and monitoring. In Proceedings of the FOCAPO Conference, Snowbird, UT, USA, 5–10 July 1998; Pekny, J.F., Blau, G.E., Carnahan, B., Eds.; AIChE Symp. Ser.; No. 320. Volume 94, pp. 351–359. [Google Scholar]
- Dewasme, L.; Amribt, Z.; Santos, L.O.; Hantson, A.L.; Bogaerts, P.; Wouwer, A.V. Hybridoma cell culture optimization using nonlinear model predictive control. In The International Federation of Automatic Control, Proceedings of the 12th IFAC Symposium on Computer Applications in Biotechnology, Mumbai, India, 16–18 December 2013; Elsevier: Amsterdam, The Netherlands, 2013; Volume 46, pp. 60–65. [Google Scholar] [CrossRef] [Green Version]


| Reactions | Rate Expressions |
|---|---|
| Species rate stoichiometry ; | |
| Rate constants kc1 = 2 × 10⁻³; kc2 = 8.3259 × 10⁻³; 1/h//(U/L) KM1 = 7.2367 × 10⁻² M; KM2 = 8.8047 × 10⁻² M; KF = 1; KNH = 1; KHC = 5.0061 × 10⁻²; KNAD = 90.181 | |
| Parameter | Value [26] |
|---|---|
| Temperature | 25 °C |
| Pressure/pH (buffer solution) | Normal/7 |
| Molar initial concentrations | |
| Fructose, [F]o ** | 0.1–1 M (tested by [26]) 0.1–3 M (this paper) |
| Formate [HCOO]o | [HCOO]o = [F]o |
| [NADH]o | 0.008 M (0.1–0.5 M) (this paper) |
| [NAD]o | 0.0005 M |
| Others: [M]o = [CO2]o = 0 | none |
| = CO2 saturation level at 25 °C and pH= 7 | 0.0313 M [35,36] |
| Reaction time | 48 h |
| Initial FDH (referred to the reactor liquid) | 0.1–2 kU/L (to be optimized) |
| Initial MDH (referred to the reactor liquid) | 0.1–2 kU/L (to be optimized) |
| One Simple BR ; j = species index (F, M, HCOO, NADH, NAD, CO2). Reaction stoichiometry is given in Table 1. 48 h (batch time, this paper). Initial conditions are given in Table 2. , (negligible inactivation of MDH and FDH); E = enzymes (MDH and FDH); If , then ≈ (excess being removed from the liquid phase). |
| SeqBR, that is a Series of (k = 1,…,NBR ) Simple BR ; j = species index (F, M, HCOO, NADH, NAD, CO2). Reaction stoichiometry is given in (Table 1); 40 h (batch time; this paper). Initial conditions: ; ; k = 1,…, NBR; variables to be optimized ; ; ; k = 1,…, NBR; variables to be optimized = 0.0005 M (for the first BR, as recommended in Table 2). The condition of reactors connected in series leads to the following constraints: ; k = 2,…, NBR; = 0 (for the first BR); ; k = 2,…, NBR; = 0 (for the first BR); ; k = 2,…, NBR; Other adopted hypotheses: , (negligible inactivation of MDH and FDH); E = enzymes (MDH and FDH); If , then ≈ (excess being removed from the liquid phase). |
| Variable | Model Validation by [10] [F]o = 0.1−1 M | ||
|---|---|---|---|
| [F]o | 0.1 M | 0.5 M | 1 M |
| FDH (U/L) | 1000 | 1000 | 1000 |
| MDH (U/L) | 1000 | 1000 | 1000 |
| F conversion Model [10] | 1 | 0.95 | 0.68 |
| F conversion Experimental [26] | 0.99 | 0.95 | 0.68 |
| Enzyme | Optimal BR [F]o = 0.1M [NADH]o = 0.008 M | Experimental [26] | ||||||
| FDH (U/L) | 500 | 500 | 500 | 1000 | ||||
| MDH (U/L) | 214 | 385 | 879 | 1000 | ||||
| F conv. | 0.89 | 0.93 | 0.95 | 0.98 | ||||
| Enzyme | Optimal BR [F]o = 1 M [NADH]o = 0.008 M | Experimental [26] | ||||||
| FDH (U/L) | 500 | 1000 | 500 | 1000 | 500 | 1000 | 1000 | 1000 |
| MDH (U/L) | 1192 | 1192 | 1248 | 1246 | 1388 | 1388 | 1000 | 1000 |
| F conv. | 0.58 | 0.76 | 0.59 | 0.78 | 0.61 | 0.82 | 0.68 | 0.68 |
| Enzyme | Optimal BR [F]o = 3 M [NADH]o = 0.5 M; | Experimental [26] | ||||||
| FDH (U/L) | 500 | 500 | 500 | 300 | 100 | No data | ||
| MDH (U/L) | 500 | 100 | 50 | 100 | 100 | |||
| F conv. | 1 | 0.99 | 0.80 | 0.87 | 0.50 | |||
| Initial Conditions (Maximum Amount) | Mannitol Production (Total Operating Time) (M/h) | MDH Total Consumption (kU/L) | FDH Total Consumption (kU/L) |
|---|---|---|---|
| max[F]o = 1 M [Alternative (a)] | |||
| SeqBR (10 BR) max [NADH]o = 0.1 M | 5.059/400 | 1.112 | 1.755 |
| 10 repeated runs of the optimal BR [F]o = 1 M; [NADH]o = 0.008 M (from Table 5) | 8.2/480 | 13.88 | 10 |
| 10 repeated runs of the experimental BR of [26] [F]o = 1 M; [NADH]o = 0.008 M (from Table 5) | 6.8/480 | 10 | 10 |
| max[F]o = 3 M [Alternative (b)] | |||
| SeqBR (10 BR) max [NADH]o = 0.5 M | 17.692/400 | 1.112 | 1.755 |
| 10 repeated runs of the optimal BR [F]o = 3 M; max [NADH]o = 0.5 M (from Table 5) | 26.1/480 | 1 | 3 |
| Initial Conditions (Maximum Amount) | Manitol Production (Total Operating Time) (M/h) | MDH Total Consumption (kU/L) | FDH Total Consumption (kU/L) |
|---|---|---|---|
| max[F]o = 1 M [Alternative (a)] | |||
| SeqBR (10 BR) max [NADH]o = 0.1 M | 6.79/400 | 1.12 | 3 |
| 10 repeated runs of the optimal BR [F]o = 1 M; [NADH]o = 0.008 M (from Table 5) | 8.2/480 | 13.88 | 10 |
| 10 repeated runs of the experimental BR of [26] [F]o = 1 M; [NADH]o = 0.008 M (from Table 5) | 6.8/480 | 10 | 10 |
| max[F]o = 3 M [Alternative (b)] | |||
| SeqBR (10 BR) max [NADH]o = 0.5 M | 28.93/400 | 1.72 | 5.34 |
| 10 repeated runs of the optimal BR [F]o = 3 M; max [NADH]o = 0.5 M (from Table 5) | 26.1/480 | 1 | 3 |
Publisher’s Note: MDPI stays neutral with regard to jurisdictional claims in published maps and institutional affiliations. |
© 2021 by the authors. Licensee MDPI, Basel, Switzerland. This article is an open access article distributed under the terms and conditions of the Creative Commons Attribution (CC BY) license (https://creativecommons.org/licenses/by/4.0/).
Share and Cite
Maria, G.; Peptănaru, I.M. Model-Based Optimization of Mannitol Production by Using a Sequence of Batch Reactors for a Coupled Bi-Enzymatic Process—A Dynamic Approach. Dynamics 2021, 1, 134-154. https://doi.org/10.3390/dynamics1010008
Maria G, Peptănaru IM. Model-Based Optimization of Mannitol Production by Using a Sequence of Batch Reactors for a Coupled Bi-Enzymatic Process—A Dynamic Approach. Dynamics. 2021; 1(1):134-154. https://doi.org/10.3390/dynamics1010008
Chicago/Turabian StyleMaria, Gheorghe, and Ioana Mirela Peptănaru. 2021. "Model-Based Optimization of Mannitol Production by Using a Sequence of Batch Reactors for a Coupled Bi-Enzymatic Process—A Dynamic Approach" Dynamics 1, no. 1: 134-154. https://doi.org/10.3390/dynamics1010008
APA StyleMaria, G., & Peptănaru, I. M. (2021). Model-Based Optimization of Mannitol Production by Using a Sequence of Batch Reactors for a Coupled Bi-Enzymatic Process—A Dynamic Approach. Dynamics, 1(1), 134-154. https://doi.org/10.3390/dynamics1010008