Article

Latent Class Analysis of Aeroallergen Sensitization Profiles: Correlations with Sex, Age, and Seasonal Variation in Serum-Specific IgE—Cross-Sectional Study

by
Michelle Silva Szekut
1,
Tatiana Jung
1,
Ágatha Kniphoff da Cruz
2,
Laura Marina Ohlweiler
2,
Luiza Pedralli
2,
Rafaela Wickert Witz
2,
Fernanda Majolo
1,2 and
Guilherme Liberato da Silva
1,2,*
1
Graduate Program in Medical Sciences, University of Taquari Valley—Univates, Lajeado 95914-014, RS, Brazil
2
Medical Sciences Center, University of Taquari Valley—Univates, Lajeado 95914-014, RS, Brazil
*
Author to whom correspondence should be addressed.
BioMed 2025, 5(4), 24; https://doi.org/10.3390/biomed5040024
Submission received: 9 July 2025 / Revised: 26 September 2025 / Accepted: 26 September 2025 / Published: 2 October 2025

Abstract

Background and objectives: Clinical laboratory analyses are essential for diagnosing and treating allergic diseases mediated by immunoglobulin E (IgE). Identifying the sources of sensitivity, subject to regional variations, enables the implementation of effective management strategies, such as prevention and immunotherapy. Through a cross-sectional study, this study aimed to determine the sensitivity profile to aeroallergens (latent class) and their correlation with age, sex, and season in the population sampled. Methods: The purpose was to map the concentrations of specific IgE serum levels linked to the most prevalent allergens, considering variations related to age, specific IgE levels, and seasons of the year through a cross-sectional study. Results: The 995 reports of specific IgE tests analyzed were clustered into six aeroallergen categories and were predominantly composed of female individuals (57.1%). The most prevalent age group was younger than 18 (56.5%), and most exams were performed in the spring (27.7%). The aeroallergen category ‘grass’ significantly correlated with sex and age, indicating that men have a 65% greater probability of having high levels of specific IgE as a response to this allergen, and age is related to higher IgE levels. Latent class analysis identified an optimal three-class solution for specific IgE sensitization patterns: Class 1: Moderate Sensitization; Class 2: Low Sensitization; and Class 3: High Sensitization. Conclusion: The present study highlights the importance of knowing the local aeroallergen profile for early diagnosis and prevention of allergic diseases, emphasizing the relevance of the allergen category related to the age and sex of the individuals.

1. Introduction

The White Book on Allergy stated that approximately 35% of the global population had respiratory allergic diseases [1]. The increasing prevalence of these illnesses globally characterizes allergies as a widespread phenomenon [2], emphasizing conditions such as allergic rhinitis and asthma. These diseases significantly impact the quality of life of individuals and their families, with negative consequences for social and economic well-being [2,3].
Allergic ailments comprise a group of intrinsic diseases characterized by an inadequate or exacerbated immune response of the organism to common environmental agents known as allergens. Although many of these agents (e.g., mites, pollen, and fungal spores) are usually harmless, some predisposed individuals develop hypersensitivity after contact with them, producing reaginic antibodies. Based on etiology, which refers to the type of exposure to the allergen, several clinical conditions are identified, e.g., allergic manifestations in the respiratory tract, allergic rhinitis related to conjunctivitis, and asthma characterized by wheezing, cough, and dyspnea [4,5,6,7]. Studies such as that by Soares et al. [8] indicate that the sensitization profile of patients is affected by environmental factors, including climatic conditions and flora. Climate changes, industrialization, extensive urbanization, changes in the domestic setting, and genetic predisposition contribute to the increase in allergic diseases. Environmental pollutants, therefore, can maximize IgE-mediated responses [9].
Diagnosing and treating respiratory allergic diseases depend on identifying the causative or triggering allergens; asthma is a prevalent global condition, affecting approximately 339 million people, and it is associated with significant impacts on health, disability, and early mortality [10]. The association between atopy and asthma seems specific to allergen sensitization, and airborne allergens have higher clinical relevance in both rhinitis and asthma. In the Brazilian context, allergens derived from mites, cockroaches, fungi, animal epithelium, and pollen are the most relevant [11].
The Guidelines for the Diagnosis and Management of Asthma of 2007 provide evidence of using multiple approaches to limit exposure to aeroallergens and other substances that might worsen asthma. However, Gleeson et al. [12] emphasized that a reduced proportion of individuals diagnosed with asthma are tested for allergies. In Brazil, according to the Clinical Protocol and Therapeutic Guidelines for Asthma, published by the Ministry of Health in 2021 [13], asthma is currently diagnosed by the identification of clinical and functional criteria obtained through anamnesis, physical examination, and pulmonary function exams (spirometry). The guidelines for treating asthma determine that allergens are identified through specific IgE tests after the diagnosis [14]. According to the current Asthma PCDT document, investigation of specific IgE sensitization is suggested as a supplementary exam, and it is recommended in the treatment selection stages when the immunobiological medication to be prescribed is chosen.
Once the symptoms indicating a potential allergic condition are identified, sensitization is confirmed through skin tests, blood tests, or a combination of both. These tests evaluate allergen-specific IgE antibodies, thus furthering the diagnosis [15].
Skin tests offer an immediate and biologically relevant response, with papule reactions and eruptions up to 15 min after applying the allergen. In turn, allergen-specific IgE antibodies in the serum are quantified through three laboratory analyzers (ImmunoCAP, Immulite, and HYTEC-288), new microarrays, and lateral-flow immunoassays. This highlights the increasing role of clinical laboratories in diagnosing and treating allergic diseases, thus strengthening the likelihood of an accurate allergic diagnosis [16]. If specific IgE results are not in accordance with clinical history, confirming them is recommended through repeated and alternative analyses. Ultimately, the patient’s clinical history is still the primary determining factor in the final diagnosis of allergic diseases [17].
A conclusive allergic disease diagnosis paves the way for therapeutic interventions, including prevention, pharmacotherapy, immunotherapy, and anti-IgE treatment measures [18]. Our main questions in this study were as follows: (1) What are the major aeroallergens diagnosed in the population under study? (2) Is there an association between the results of sensitization expressed in serum-specific IgE concentrations and age groups in the population, and is there higher sensitivity in specific seasons of the year? Among the patients who took the specific IgE test, over 70% are estimated to show sensitization to aeroallergens, most of whom are children. In analyzing the four climatic seasons, summer is expected to have the highest sensitization rate. Polysensitization is estimated to be present in at least 75% of the patients. Therefore, the present study will determine the sensitization profile of the most common aeroallergens in Vale do Taquari (Taquari Valley) in Rio Grande do Sul. The aim is to identify and analyze, in an in-depth manner, how different age groups—youngsters, adults, and the elderly—respond to exposure to these specific aeroallergens.
By examining the relationship between sensitization and age groups, the present study aims to understand the nuances and variations that might exist in different population groups. Moreover, by considering the year’s seasons, this study aims to map seasonal patterns, identifying how aeroallergen concentrations vary throughout the year. This detailed and encompassing approach will allow a more refined interpretation of the clinical–epidemiological profile of the region. An innovative and crucial aspect of the present study is its objective of offering practical and applicable indicators for local healthcare entities. By identifying the most frequent aeroallergens, such as mites, pollen, and fungi, according to age group and the year’s seasons, the present study aims to provide information that might be used to promote health. These indicators have the potential to apprise professionals of prevention strategies and treatments and contribute to more effective healthcare initiatives.

2. Methods

2.1. Study Design

This study is characterized as observational, descriptive, analytic, retrospective, and cross-sectional research, and its results were obtained using the database of the Clinical Analysis Laboratories located in the cities of Lajeado, Estrela, and Muçum in Vale do Taquari (Taquari Valley). This study was compiled using a convenience sampling approach, including all eligible specific IgE test reports from the laboratory databases that met the inclusion criteria for the study period (1 January 2020 to 31 July 2022). Therefore, the reports were obtained from individuals derived from the cities of Arroio do Meio, Bom Retiro do Sul, Colinas, Cruzeiro do Sul, Estrela, Fazenda Vilanova, Imigrante, Lajeado, Marques de Souza, Muçum, Santa Clara do Sul, Teutônia, and Travesseiro, belonging to Vale do Taquari (Taquari Valley) in the state of Rio Grande do Sul.

2.2. Inclusion Criteria

Reports of airborne allergen (aeroallergen)-specific IgE exams performed in the period ranging from 1 January 2020 to 31 July 2022 were included in the present study. In addition, reports of patients who provided complete information in their registrations, including municipality of residence, date of birth, sampling date, and sex, were selected.
In order to ensure data quality, only aeroallergen-specific IgE exam reports that allowed for quantification were included in the analysis. Specific immunoglobulin E (sIgE) quantification was performed using the ImmunoCAP® (Phadia AB, Uppsala, Sweden) fluorescence enzyme immunoassay, generating standardized quantitative results for allergen-specific antibodies. Given that the data were sourced solely from clinical laboratory repositories, this analysis was restricted to specific IgE measurements and did not incorporate clinical symptom documentation from medical records.

2.3. Exclusion Criteria

To ensure data accuracy, reports in which the sample was collected before 1 January 2020 or after 31 July 2022 were excluded.
Moreover, reports without some of the information essential to the patient’s registration, such as municipality of residence, date of birth, sampling date, and sex, were discarded.

2.4. Data Collection

A total of 1342 specific IgE reports were collected, covering the period from 1 January 2020 to 31 July 2022, using the registrations of the study participants. These results were obtained from the database of four Clinical Analysis Laboratories, and the data were derived from 13 cities in the valley, including Arroio do Meio, Bom Retiro do Sul, Colinas, Cruzeiro do Sul, Estrela, Fazenda Vilanova, Imigrante, Lajeado, Marques de Souza, Muçum, Santa Clara do Sul, Teutônia, and Travesseiro. These laboratories provide services to all Vale do Taquari (Taquari Valley) inhabitants in Rio Grande do Sul, Brazil. However, only approximately 995 reports were considered after applying the exclusion criteria. Aside from specific IgE exam results, variables such as the municipality of residence, date of birth, sampling date, and sex of the patients were investigated.

2.5. Data Analysis

The data collected were stored in an Excel spreadsheet. The statistical analysis was performed using the statistical programs JAMOVI [19], R Core Team [20], and SPSS version 20.0.0 [21]. Kolmogorov–Smirnov and Shapiro–Wilk tests were used to check data normality. Non-parametric samples analyzed in the independent groups were expressed as mean ± standard deviation using the Brunner–Munzel Test.
Numbers and percentages were expressed as n (%), and categorical variables were analyzed using the Chi-square test (χ2) and expressed as percentages. Specific IgE values in the analyses were categorized as follows: Undetectable: lower than 0.35 kU/L; Low: values > or equal to 0.35 kU/L and <0.7 kU/L; Moderate: values > or equal to 0.7 kU/L and <3.5 kU/L; High: values > or equal to 3.5 kU/L and <17.5 kU/L; Very High: values > or equal to 17.5 kU/L. Given the inherent analytical complexity arising from the high specificity of IgE responses to individual allergens, test results were grouped into six major categories reflecting common biological sources: mites, dust, grass, epithelial cells, fungi, and pollen. This biologically informed aggregation strategy was imperative to facilitate statistically robust data analysis.
On the other hand, a Multinomial Regression was used for dust, grass, and pollen categories, as the parallel lines tests did not converge in the Ordinal Regression (the p-value was significant, i.e., chances are not proportional). Thus, the Generalized Linear Model method (GLzM) was used for cross-sectional analyses, and the lowest value of the Akaike Information Criterion level was used to determine the most suitable model.
The multivariate technique of Principal Coordinate Analysis was used to analyze the intercorrelations of quantitative variables (mites, dust, grass, epithelial cells, fungi, and pollen). The Expectation–Maximization technique was used for the missing data, checking the Little MCAR assumption (p = 0.242), i.e., that missing data are random. However, to avoid biases due to the low number of cases, the variable ‘Fungi’ was not considered for this technique, as it did not allow model convergence. The Bartlett sphericity and Kaiser–Meyer–Olkin (KMO) tests were used to assume the model is fit. The “varimax” rotation was used, and factorial weights lower than 0.4 were suppressed. p < 0.05 was considered statistically significant for all analyses, and odds ratio and confidence interval (CI) were reported at 95%.

2.6. Latent Class Analysis

Latent Class Analysis (LCA) was conducted to identify data-driven subgroups using the six major categories designed for this study (mites, dust, grass, epithelial cells, fungi, and pollen). Analyses were performed using JAMOVI version 2.3 and R version 4.1 (R Core Team). LCA addresses limitations inherent in factor analysis and structural equation modeling, which exclusively accommodate continuous latent variables. This method identifies latent classes based on a set of ordinal categorical indicators, positing that an underlying categorical latent variable explains associations among observed variables. For this study, latent class models ranging from one to three classes were estimated to determine the optimal number of latent classes. Model fit indices included information criteria, the Bootstrap Likelihood Ratio Test (BLRT), and entropy. Information criteria comprised the Akaike Information Criterion (AIC), Bayesian Information Criterion (BIC), and Consistent Akaike Information Criterion (CAIC). Optimal model selection prioritized higher entropy values and lower AIC/BIC values. Entropy quantifies classification accuracy, with values approaching 1 indicating superior precision. Lower AIC and BIC values denote enhanced model parsimony and data representation.
The BLRT statistically compared fit improvement between models with κ classes versus κ-1 classes. Statistically significant p-values (BLRT) indicated superior fit for the κ-class model relative to the κ-1 class solution.

2.7. Ethical Aspects

The project was approved under number 6.056.534 (approved on 12 May 2023) by the Research Ethics Committee of Univates (COEP/Univates), following the guidelines of Resolution No. 466 of 12 December 2012 of the National Council of Health. The clinical analysis laboratories of Vale do Taquari (Taquari Valley) that participated in this study agreed to provide the required information upon signing the Term of Agreement and the Data Use Commitment Term. These terms were adequately explained to the technical professionals in charge. The researchers, in turn, undertook to maintain the confidentiality of the information collected. At all research stages, the ethical principles outlined in Resolution No. 466/2012 of the Ministry of Health were observed (2012).

3. Results

3.1. Characteristics of the Studied Population

Nine hundred ninety-five reports of specific IgE tests from individuals meeting the selection criteria were analyzed. The most prevalent municipalities were Lajeado, with 606 individuals sampled (60.90%), followed by Estrela, with 149 (15%), Arroio do Meio, with 41 (4.1%), and Bom Retiro do Sul, with 34 (3.4%). The mean age of the population sampled was 21.49 ± 21.57 (median 12), with females 25.0 ± 22.4 (median 22) and males 16.8 ± 19.6 (median 8). The prevalence was 568 (57.1%) females and 427 (42.9%) males, with a significant difference in the sex ratio (p < 0.001). The largest population tested was between zero and five years old. Additionally, there were 562 individuals younger than 18 years of age (56.2%).

3.2. Sensitization and Aeroallergens: Variation According to IgE Levels

Table 1 shows the pattern of IgE-level frequency. In all aeroallergen categories, the most common level was “Undetectable.” However, in the case of mites and dust, the second most frequent level was “Very High” (Table 1).

3.3. Sensitization: Exploiting the Age–Sex Pyramid

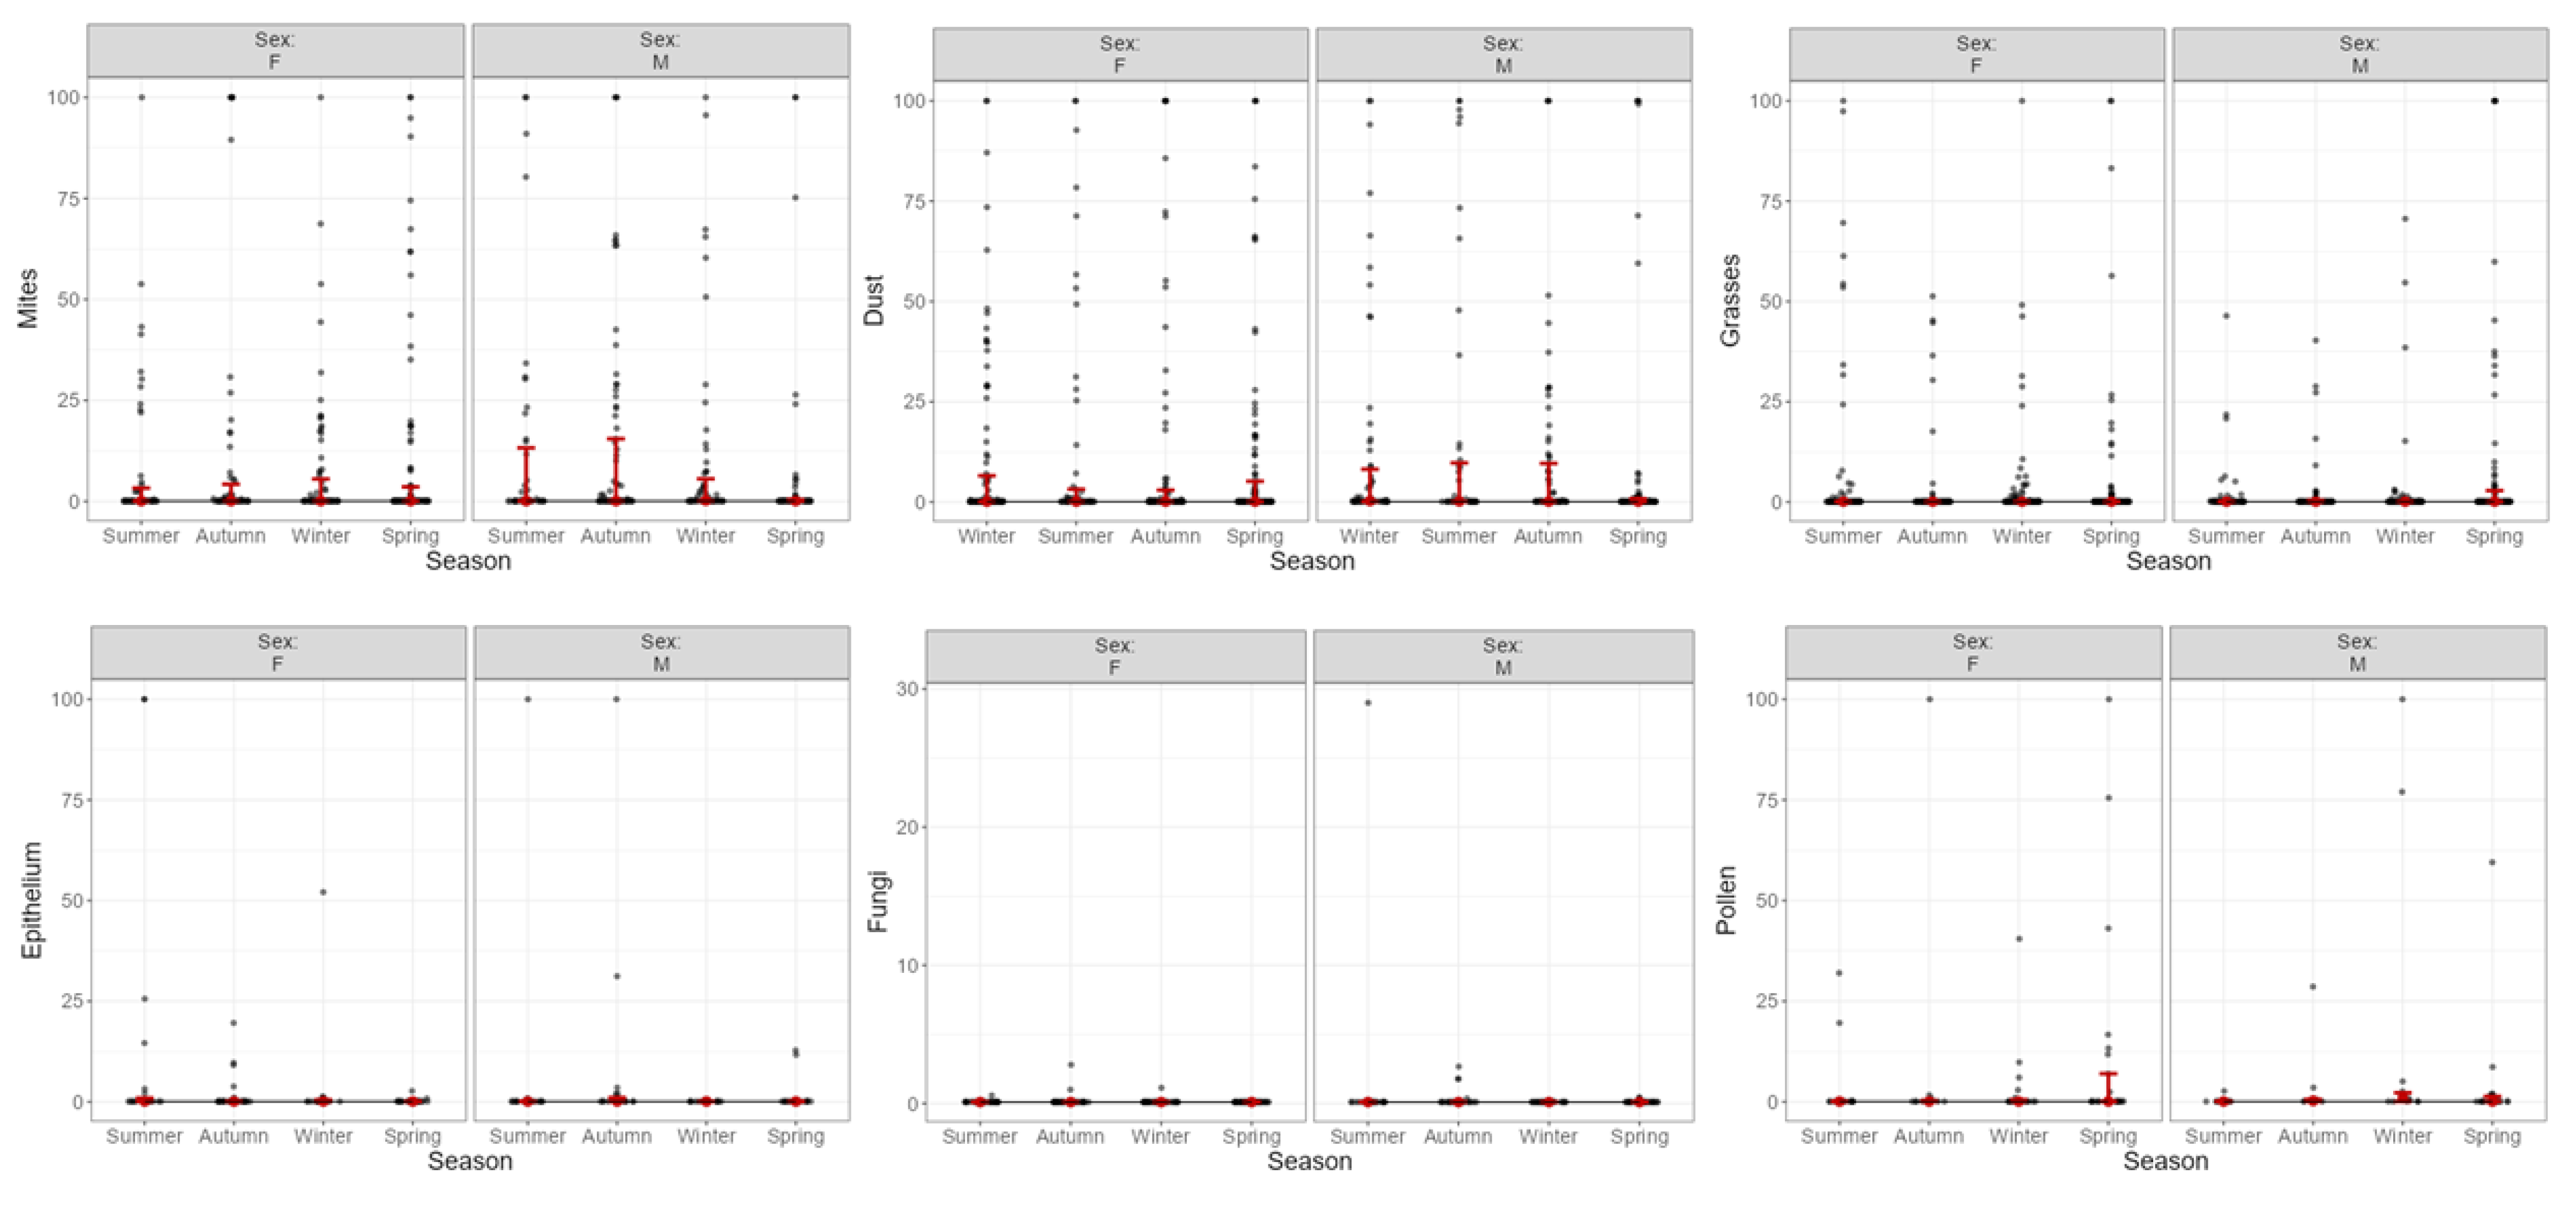
The Brunner–Munzel statistical test identified a significant difference in age between sexes (Statistic = −6.49; df = 922; p < 0.001) (Figure 1), indicating that the difference in age between sexes is statistically significant. Once four age groups were established for the study (younger than 18 years old, young-adults (>18 to 35), adults (>35 to <65), and elderly (65+) (Supplementary File)), it was possible to observe a significant difference in the ratios between age groups, as those younger than 18 had 562 individuals (56.2%), followed by adults, with 193 (19.4%), young-adults, with 183 (18.4%), and elderly, with 57 (5.7%) (X2 = 572.16; df = 3; p < 0.0001). Regarding the seasons of the year, there was a significant difference in the ratio of reports, with spring having the highest number of exams performed, 276 (27.7%), followed by autumn, with 256 (25.7%), winter, with 250 (25.1%), and summer, with 213 (21.4%) (X2 = 8.34; df = 3; p = 0.039) (Figure 2).
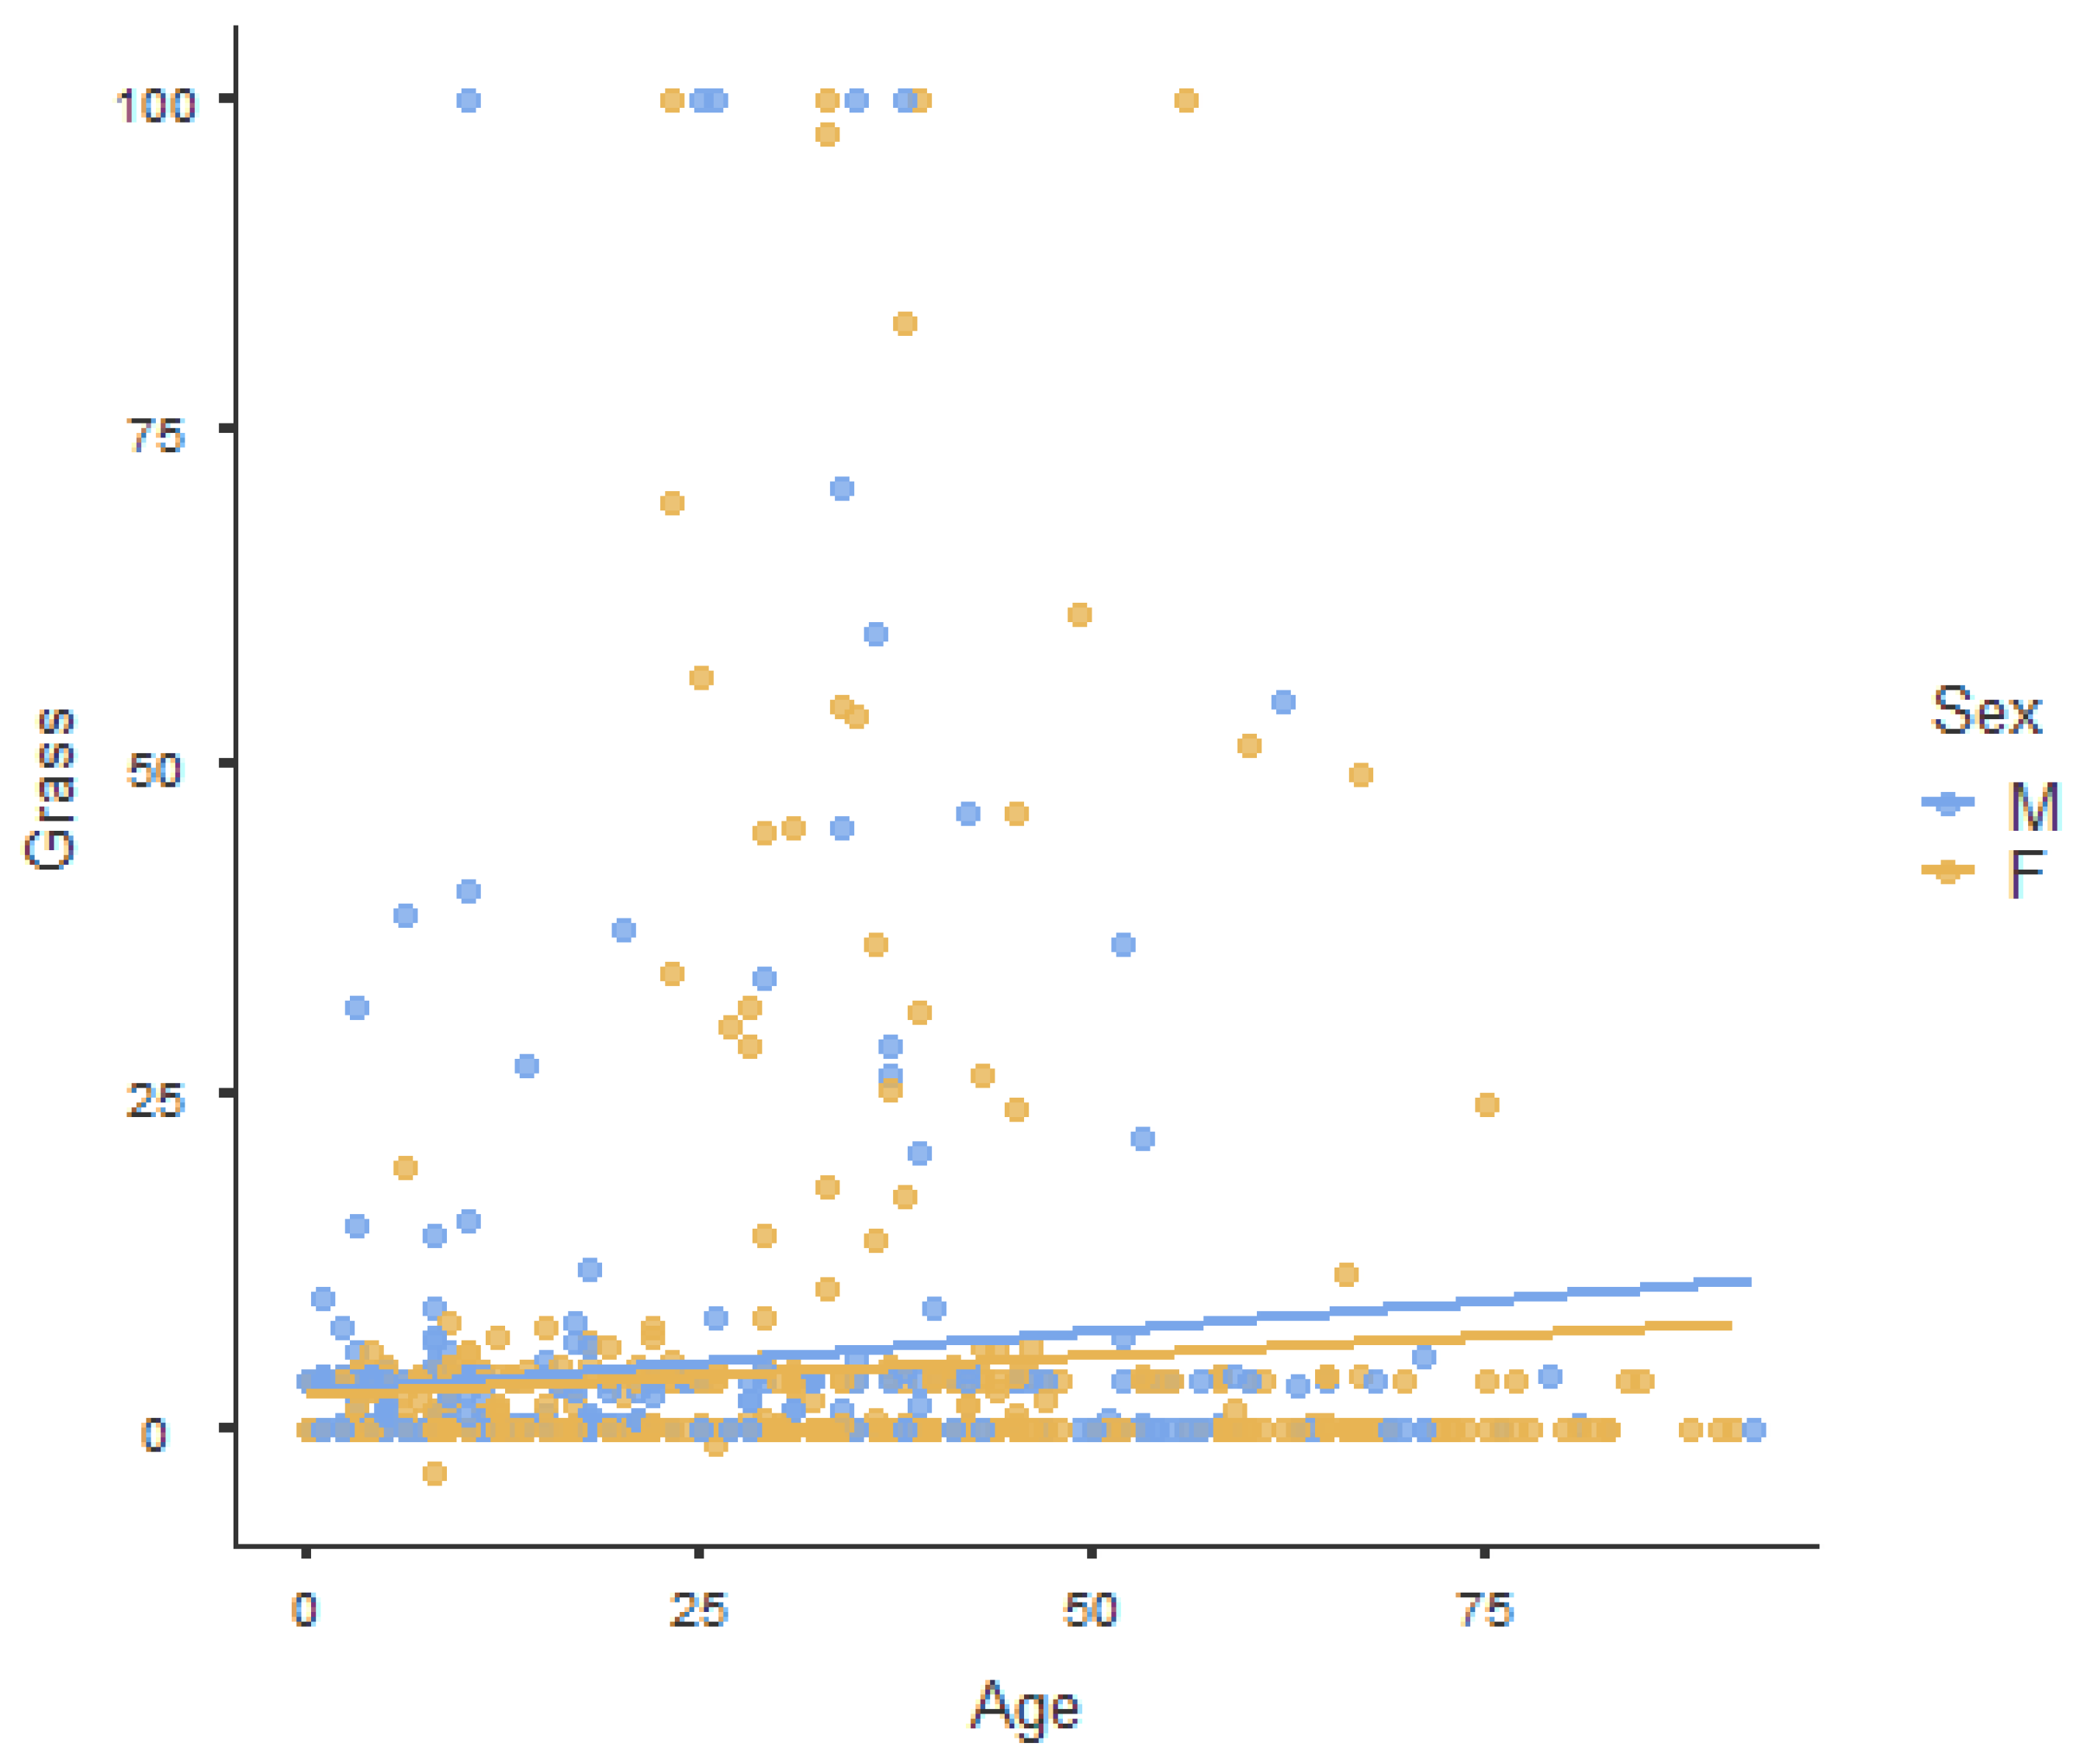
The GLzM technique was used to check the effects of ‘Epithelial,’ with the predictor variables ’Sex,’ ‘Season,’ and ‘Age.’ It is noticeable that the categories ‘Mite,’ ‘Pollen,’ and ‘Fungi’ did not have a significant association with predictors. However, the aeroallergen category ‘Grass’ had a significant relationship with the variables ‘Sex’ (X2 = 7.18; df = 1; p = 0.007) and ‘Age’ (X2 = 12.06; df = 1; p = 0.001); male individuals had a 65% chance of having higher specific IgE values for this aeroallergen (OD: 1.65; CI95%: 1.14–2.39) (Figure 3) and the higher the age, there is a trend towards higher immunoglobulin E levels (OD: 1.01; CI95%: 1.006–1.022).
The aeroallergen category ‘Dust,’ on the other hand, only had a significant relationship with the variable ‘Age’ (X2 = 4.37; df = 1; p = 0.036), as younger individuals tend to have lower IgE values in response to this aeroallergen (OD: 1.008; CI95%: 1.001–1.017).

3.4. Principal Component Analysis

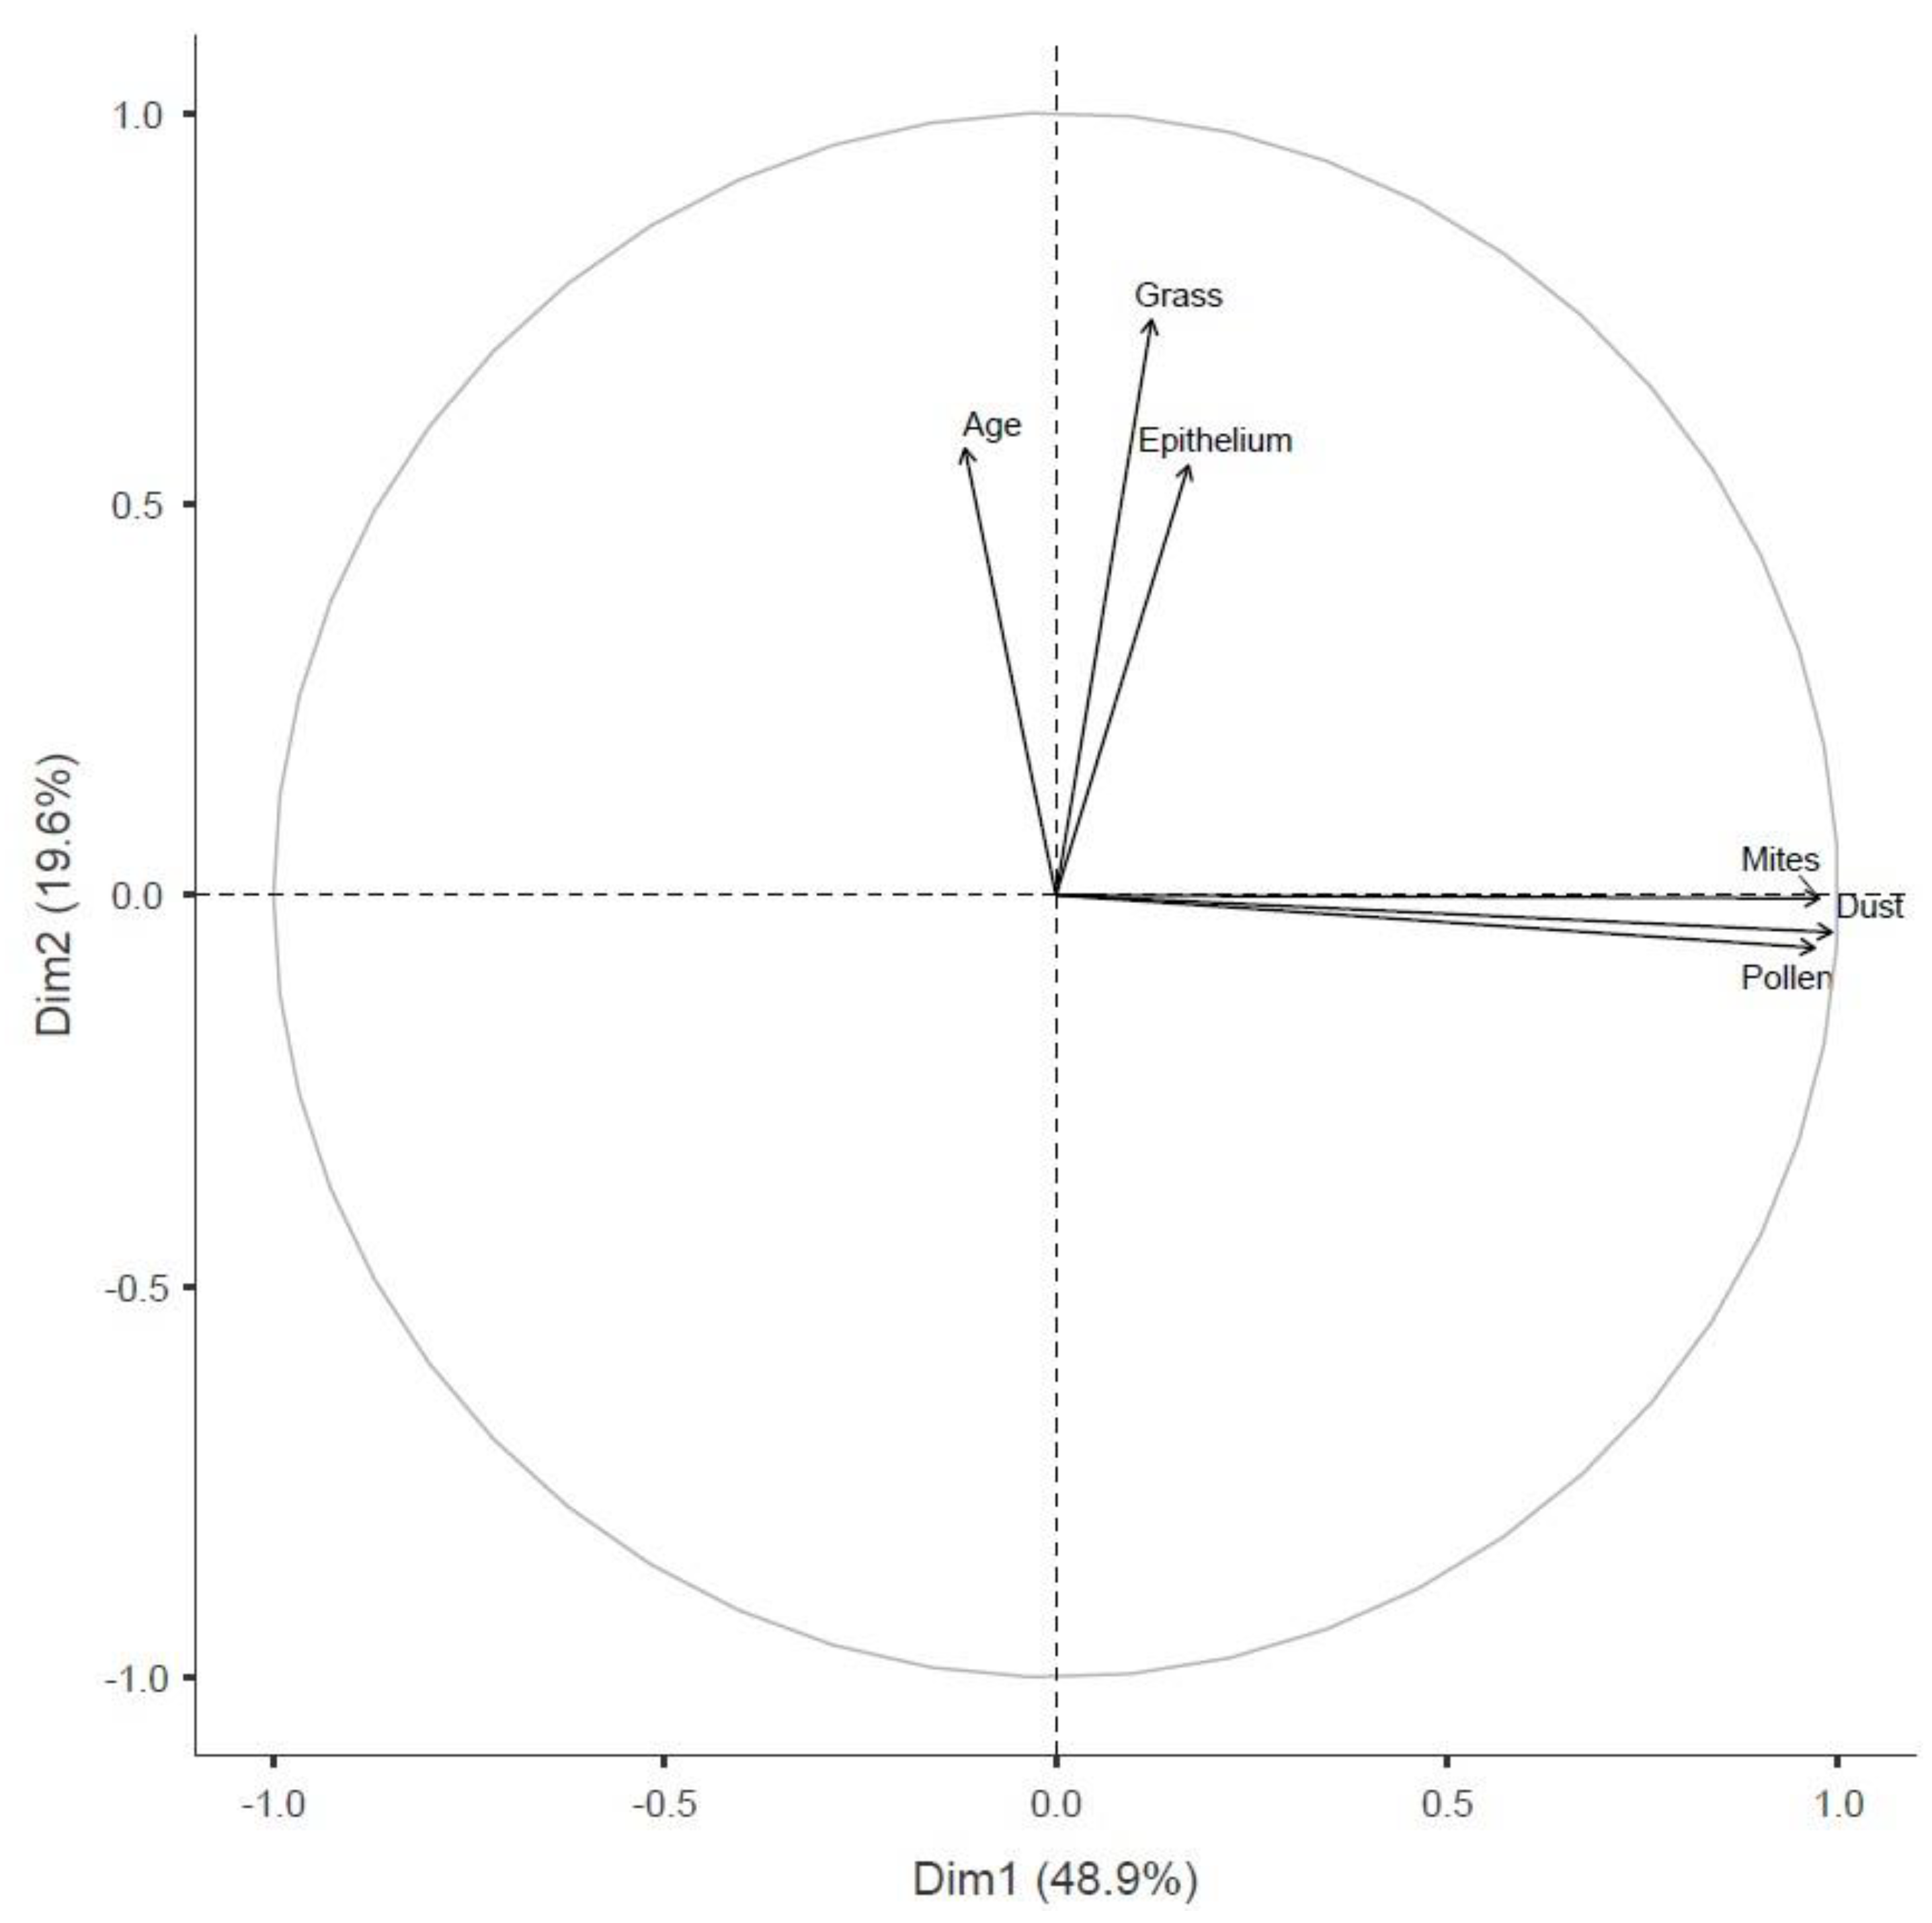
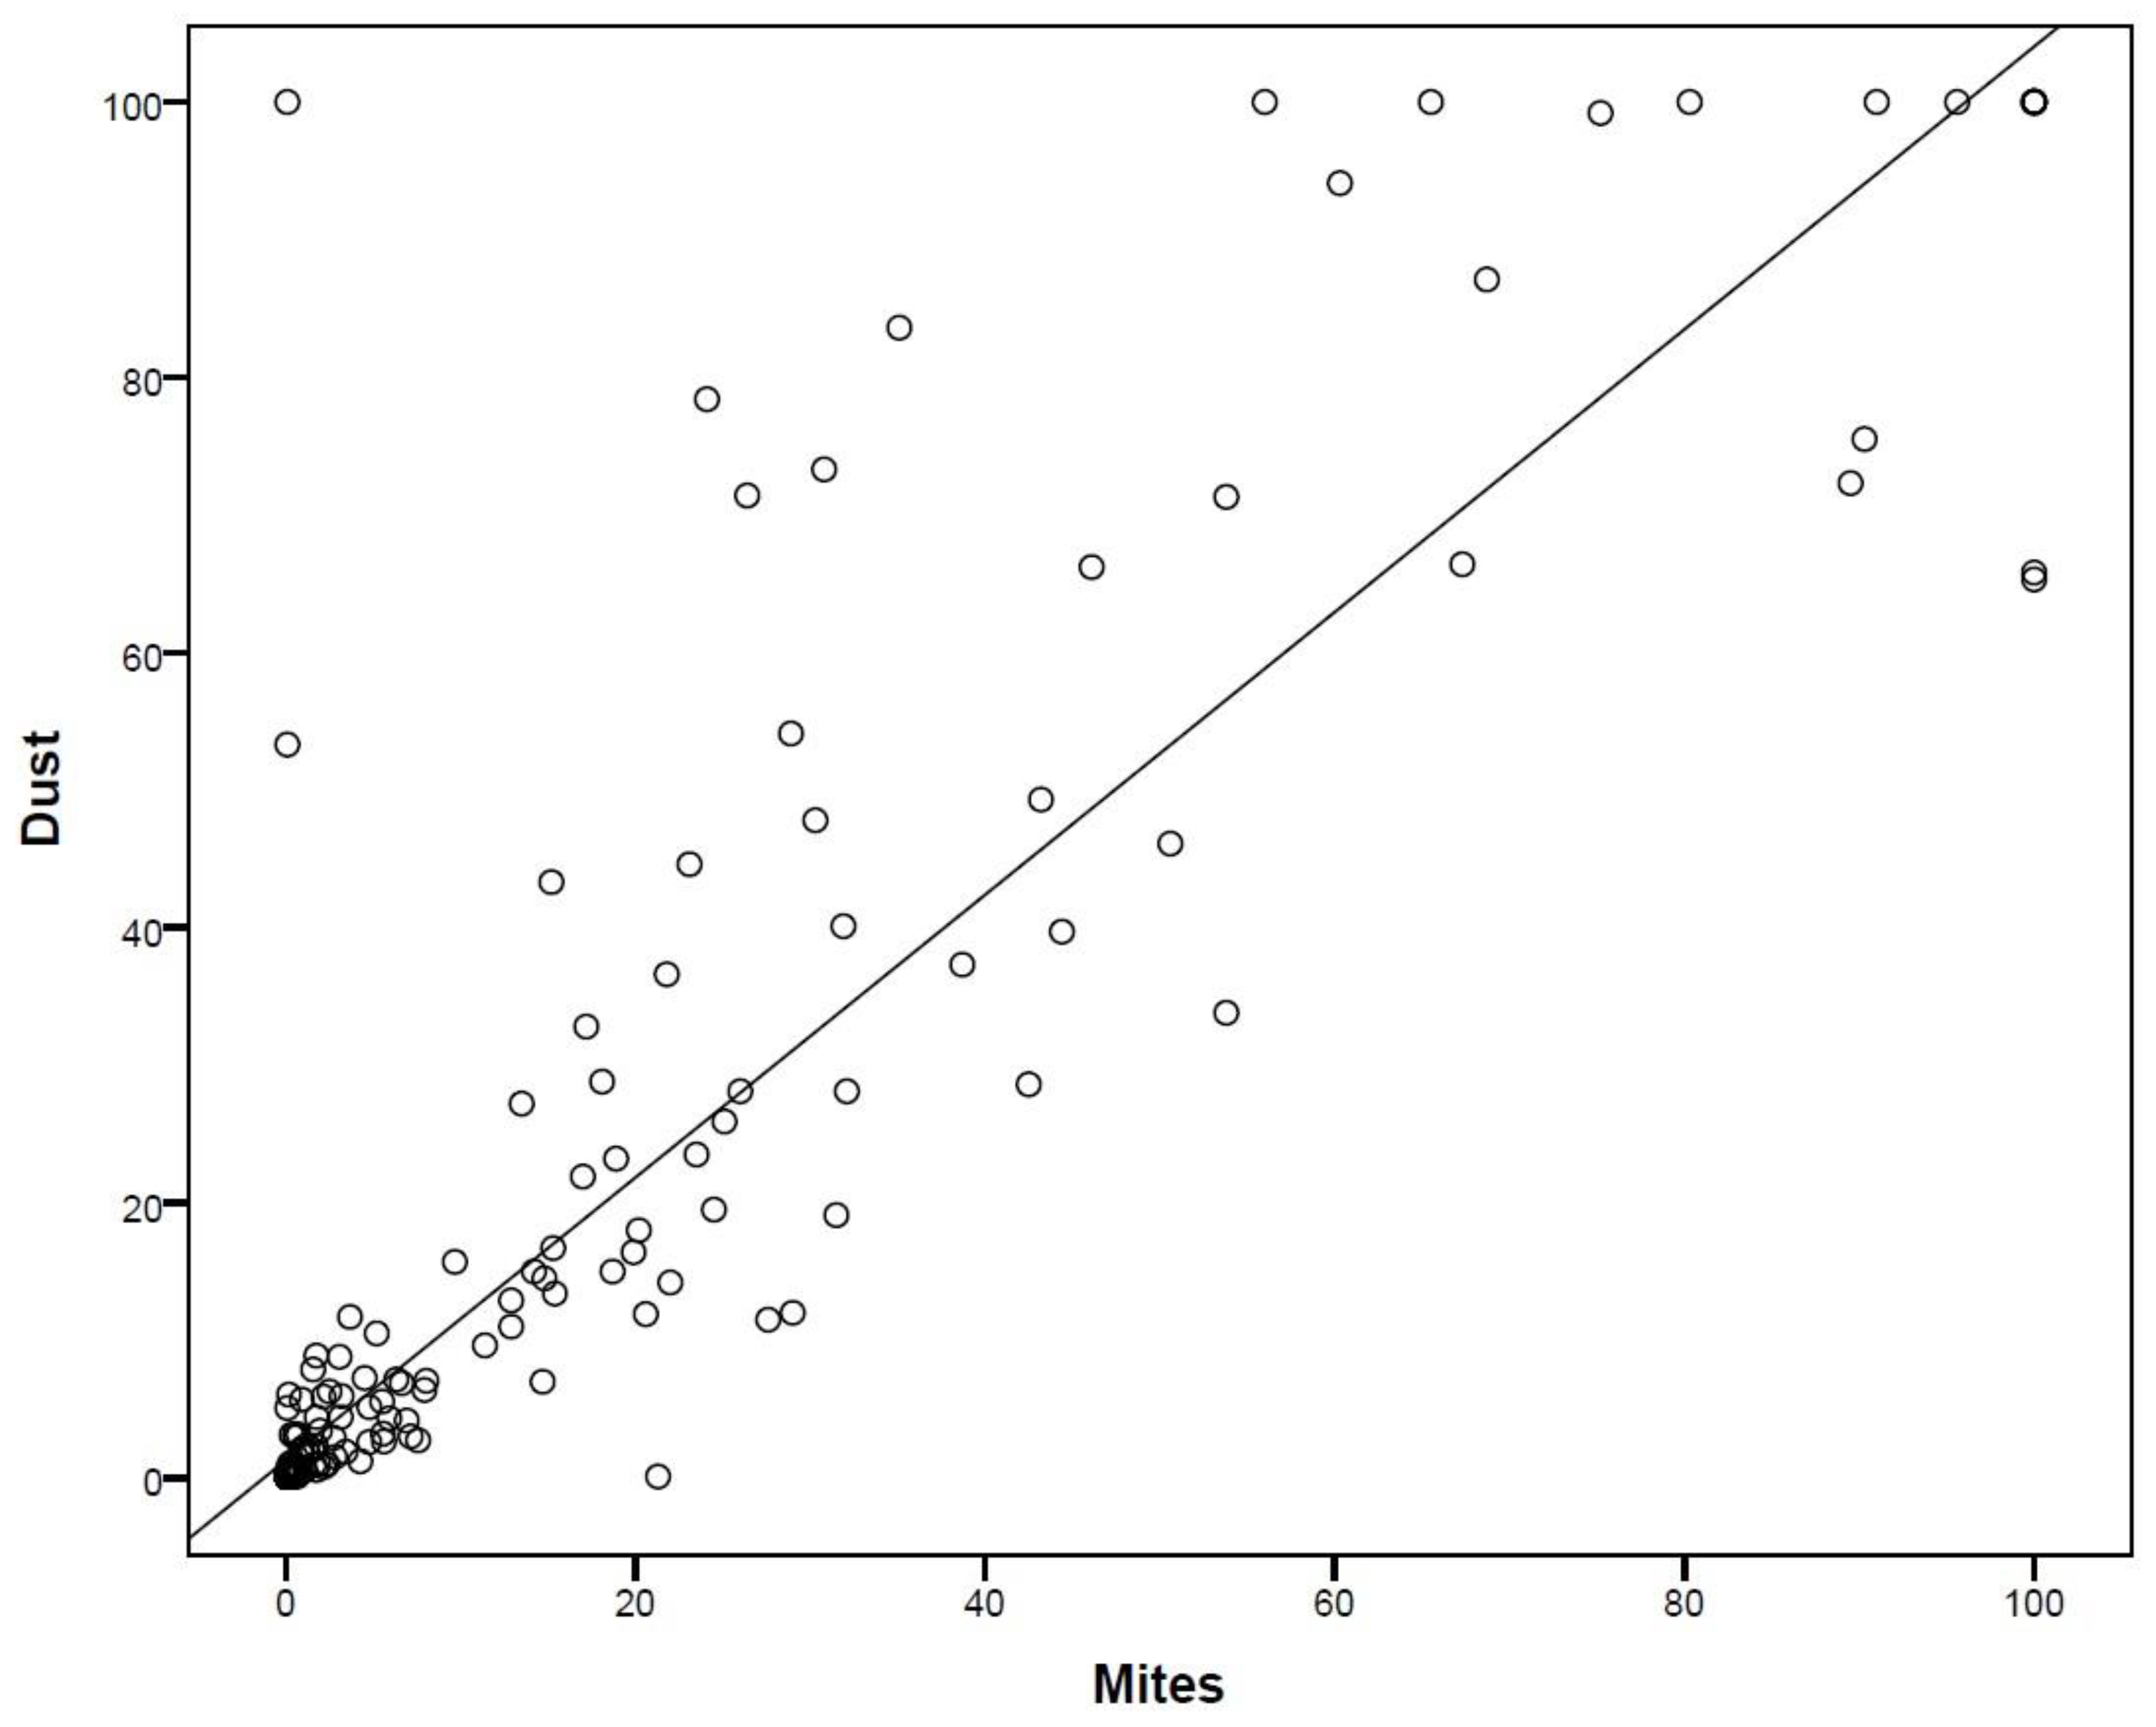
In order to check the intercorrelations between variables, the principal assumption of PCA was accepted: the Bartlett sphericity test, which had a significant value (X2 = 5931.57; df = 15; p < 0.001), and KMO of 0.537, considered a weak fit. Therefore, the Principal Component Analysis (PCA) showed that there are two principal components, and the first component encompasses the categories ‘Mites,’ ‘Dust,’ and ‘Pollen’ (Figure 4). According to the correlation matrix, there was a strong correlation among the three categories mentioned above. In the bivariate correlation, the categories ‘Mites’ and ‘Dust’ had a positive, strong, and significant correlation (r = 0.967; p < 0001) (Figure 5). Component 2 comprises the categories ‘Grass,’ ‘Epithelial,’ and ‘Age.’ However, the correlation among them was weak according to the correlation matrix. The first component can explain 48.86% of the variance, while the second component can explain 19.57% of the model variance.

3.5. Model Fit Indices for LCA

Model fit indices for latent class models with varying class numbers are presented in Table 2 for ordinal specific IgE values. Analyses were conducted for two- and three-class models. Results indicated monotonic decreases in AIC, BIC, and CAIC with increasing class enumeration. While the three-class solution demonstrated higher entropy, it yielded elevated AIC, BIC, and CAIC values. For the three-class model, Bootstrap Likelihood Ratio Test (BLRT) values reached statistical significance (p < 0.001), indicating superior fit relative to lower-class solutions. Following comparative model fit assessment, the three-class model was selected due to its parsimony and enhanced class separation compared to alternative solutions (Table 2).

3.6. Latent Class Definitions for Specific IgE Sensitization

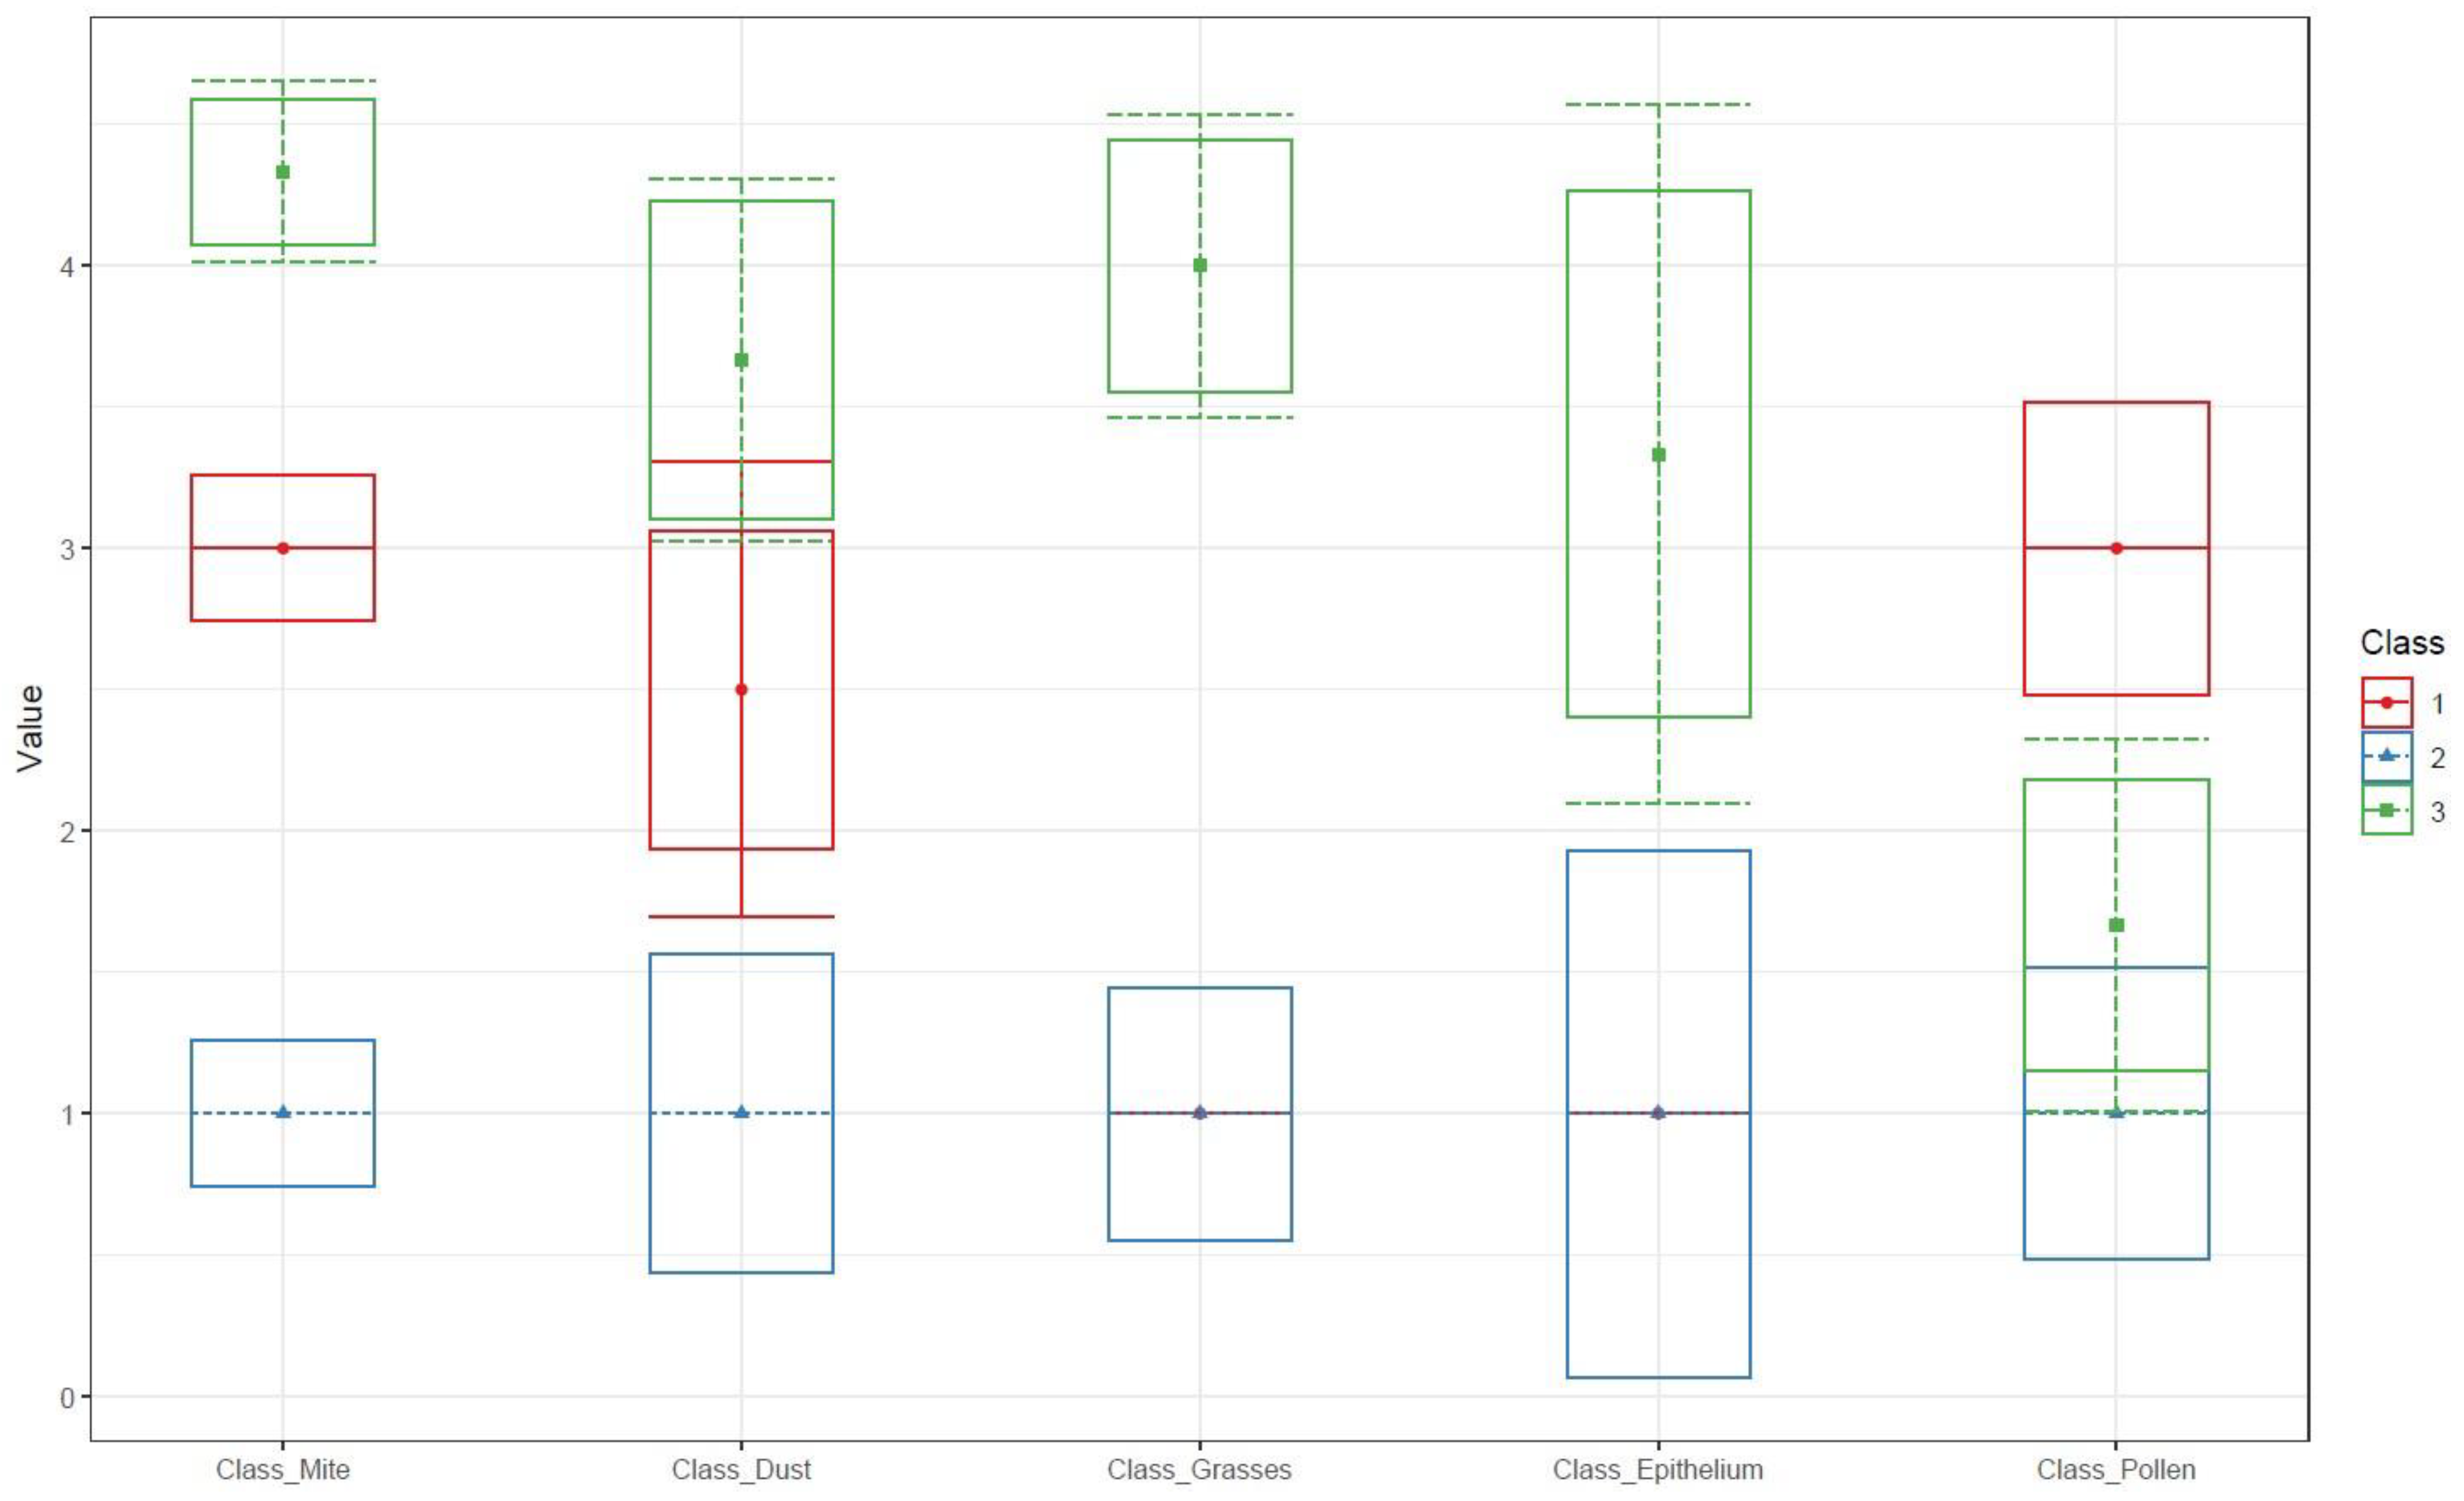
The least prevalent latent class (Class 1; N = 320, 30.8%) demonstrated intermediate specific IgE counts relative to other classes, thus designated “Moderate Sensitization”. Class 2 (N = 313, 31.8%) exhibited low probabilities of moderate/high specific IgE counts, warranting the “Low Sensitization” classification. The most prevalent class (Class 3; N = 362, 37.4%) showed the highest probability of elevated specific IgE counts, establishing the “High Sensitization” profile. Age and sex were incorporated as covariates to ensure model convergence.
Figure 6 illustrates sensitization profiles for the three-class solution. Ordinal specific IgE scores (y-axis) are plotted against biological allergy categories (x-axis). Substantial profile overlap, particularly between Classes 1 and 2, indicates shared latent characteristics across subtypes.
To quantify inter-class transition probabilities, we performed age- and sex-adjusted logistic regression. Results confirmed statistically significant associations between latent class membership and probability of profile reassignment (Table 3).
Logistic regression analysis revealed that males in Class 1 (“Moderate Sensitization”) had 37% higher odds of retaining class membership compared to individuals of Class 3 within the same class (OR = 1.37). For age, each additional year was associated with a 37% increased probability of transition from Class 1 to Class 3 (“High Sensitization”) (OR = 0.63).
No statistically significant sex-based differences were observed between Classes 2 and 3 (p = 0.13). Regarding age effects in Class 2 (“Low Sensitization”), older individuals demonstrated an 8% chance of class retention per year of age in relation to Class 3 (OR = 1.08).

4. Discussion

The results partially confirmed the hypothesis of the present study. There was a significant association between age group and sensitivity to ‘Grass,’ while the other categories showed no clear associations. Regarding seasons of the year, although spring was identified as the season with the highest incidence of exams, no significant association was found with the aeroallergen categories evaluated. On the other hand, the study emphasized important intercorrelations among mites, dust, and pollen.
The identification of three distinct latent sensitization profiles—Low (31.8%), Moderate (30.8%), and High (37.4%) sensitization—represents a critical advancement in stratifying specific IgE-mediated allergy phenotypes. This empirically derived taxonomy overcomes limitations of conventional continuous-variable approaches by capturing clinically meaningful heterogeneity in the Taquari Valley cohort. The model’s robustness (entropy = 0.82, BLRT p < 0.001) and clear inter-class transition dynamics (e.g., 37% increased annual progression probability from Moderate to High Sensitization; OR = 0.63, p < 0.001) provide a probabilistic framework for predicting allergy evolution. Substantial profile overlap between Moderate and Low Sensitization groups reflects real-world immunological complexity, suggesting shared environmental or genetic sensitization pathways. These data-driven profiles enable precision diagnostics by delineating subgroups with differential clinical trajectories, ultimately informing targeted prevention strategies for at-risk populations.
In the present study, the frequency of IgE levels, with emphasis on the most frequent level (“Very High”), in the groups of mite and dust is in line with a study by Yan conducted in 2023 with adults in Shanghai. Previous epidemiological studies corroborate the findings that these two types are the main aeroallergens [22,23]. In the study by Shikha et al. [24] in Bangalore, the reactivity to aeroallergens was examined in individuals with nasal allergy or asthma, and the results showed that mites are the most prevalent allergens, affecting 41% of the 400 patients evaluated, followed by pollen and fungi. This study also shows an intercorrelation that suggests that the presence of or exposure to one of these aeroallergens might be related to the presence of or exposure to the other aeroallergen. This happens due to the similarities of their sources, seasonal cycles, and dispersal methods. This interconnection increases the risk of sensitization or allergic reactions in specific individuals. For instance, mites, commonly found in dusty environments, are frequently associated with domestic dust.
The population studied showed a significant difference in sex ratio, with most female individuals. However, another study indicated that males are more sensitive to several aeroallergens, including mites, dust, epithelial cells, and pollen [23]. This disparity might result from the fact that, in Brazil, women tend to seek healthcare services more frequently than men do. According to data from the National Health Program (PNS) of 2019, the proportion of women who had an appointment with a physician (82.3%) is higher than that of men (69.4%). This discrepancy is observed in all age groups, except those from 0 to 4 years old, where the ratio of men is slightly higher. As people undergo hormonal changes throughout their life cycle, this can affect the immune system and susceptibility to allergens. With aging, there is a tendency for the immune system to become less reactive to allergens.
On the other hand, children whose immune systems are still under development can have a higher sensitivity to these substances. Sensitization peaks in young adults and decreases as age advances [25]. Results of a study conducted by Ahmed et al. [26] indicated a higher proportion of men with allergies to several substances compared to women. These hypersensitivities can be multifactorial, involving genetic, lifestyle, and environmental elements. These interactions start at the early stages of life, progress during early childhood and infancy, and might persist throughout life [27]. According to Zhao et al. [28], older age and female are associated with lower total IgE in allergic populations.
A study offered a detailed description of IgE response patterns to multiple components from infancy to adolescence. It highlighted that the moment when specific sensitization patterns begin might be an essential indicator of the risk of subsequent allergic disease. In addition, seemingly similar cross-sectional patterns of specific IgE responses to components might have different clinical associations depending on which development stage they manifest [29]. As shown by Dai et al. [30], many children with allergic rhinitis and/or asthma are sensitive to airborne allergens, typically reacting to more than one, and mites are the most common. Ying et al. [23] suggest that sensitivity to aeroallergens in men differs from that in women. Globally, a higher prevalence of sensitivity to domestic mites was observed in men (37.1%) than in women (32.0%), while the presence of cat epithelial cells reached an overall prevalence of 8.6%, with higher rates in men (9.2%) than in women (7.6%) [23]. Men seem to be more prone to aeroallergic sensitivities than women [25].
IgE-mediated sensitization must be considered under two aspects: qualitative, represented by IgE response, and quantitative, expressed through the categories ‘monosensitization’ and ‘polysensitization.’ This approach is essential due to the substantial clinical and immunological differences between individuals with a single sensitization and those with multiple sensitizations [31]. In their conclusion, Yong-Rodriguez et al. [32] highlight that polysensitization is frequently observed, and its association with airway allergies manifests early in life.
According to a study conducted by Zhaobin et al. [33], allergens associated with domestic dust mites, allergens related to mold, and allergens derived from pollen and grass were the most frequent among children who are sensitive to a single type of allergen (monosensitized). On the other hand, mites and mold-related allergens in combination were the most frequently found in children sensitive to multiple allergens (polysensitized). Sensitization to multiple allergens was associated with higher specific IgE levels [33].
According to Karadoğan et al. [34], 75.6% of asthma patients manifested sensitivity to at least one airborne allergen. Among the most common allergens, mites were the most prevalent, affecting 56.2% of patients, followed by fungi (37.4%) and grass (32.9%). The results of the study conducted by Souza et al. [35] show significant aeroallergic sensitization patterns in patients with chronic rhinitis and asthma at different severity levels. Among the participants who had chronic rhinitis and light asthma, 66% tested positive for at least one aeroallergen, while this rate was 59.4% in cases of moderate to severe asthma. Patients with isolated chronic rhinitis had a sensitization rate of 41% for at least one aeroallergen.
The aeroallergen category ‘Grass’ in the present study showed a significant relationship with the variables ‘Sex’ and ‘Age,’ as male individuals had 65% higher odds of having high specific IgE values for this aeroallergen. Sensitization to at least one grass allergen was found in 30.79% of the population studied by Rodinkova et al. [36]. The percentage of sensitized individuals younger than 18 years of age (62.21%) was 1.65 times higher than that of adults (37.79%) [36]. Grasses are potential aeroallergens worldwide, with sensitization rates of up to 30% depending on climate and region [37,38]. In Austria, grasses are responsible for the highest sensitization rates, affecting half of the individuals with allergies [39]. It is known that there is cross-reactivity among allergens of different types of grass [40], as well as differences in the allergenic profile between individual grass species [41]. One study involving three groups born in different countries by Susanto et al. [42] revealed indications of a connection between birth during grass pollen seasons and high IgE levels in the umbilical cord’s blood. This study concluded that being born during the grass pollen seasons was associated with higher IgE levels in the umbilical cord’s blood. As IgE responses develop in the first months of life, the results of the present study provide new perspectives on the mechanisms of exposure to grass pollen during pregnancy and immediately afterward, as well as its potential relations with allergic respiratory diseases [32].
Regarding seasons of the year, the present study collected a higher number of exams performed in spring, totaling 276 (27.7%), followed by those conducted in autumn. Allergic tests must be conducted considering regional variations in the prevailing aeroallergens, and it is recommended to use an encompassing panel of aeroallergens, especially when analyzing adolescents, as emphasized by Kim et al. [43]. The variation in common allergens of different areas is attributed to climate differences that affect allergen-producing flora and fauna [44]. Climate changes might affect the production of pollen and the flowering of plants, resulting in significant changes in aeroallergen dispersal. According to Levitin et al. [45], the spring pollen seasons of trees and grasses are starting earlier, possibly due to increased temperatures. This climate change is related to a global increase in pollen production, which contributes to the change in the plant-flowering calendar in Tulsa (USA).
The study by Oh [46] indicates an increase in sensitization rates to pollen attributed to climate change. Sensitization patterns significantly vary according to age and region [43,47]. It is vital to select adequate allergens because failing to include the correct allergens might lead to false-negative results, even in allergic people. The specific IgE test might not detect an allergy if the allergen responsible for the symptoms is not included in the test panel. Since different regions have different common allergens due to variations in climate, vegetation, and local fauna, it is essential to include the appropriate allergens in the tests to reflect the area of residence of the individual [44].
The need for specific allergens in the tests is driven by the diversity of allergens common in different areas, which is affected by local climate, vegetation, and fauna. The absence of local allergens in the tests might fail to identify the underlying cause of the allergy. Including the correct allergens aims to ensure the test can accurately identify the source of the allergy in a given individual.
As Gleeson et al. [12] point out, performing aeroallergen tests in asthmatic adults is not widespread. The probability of taking these tests is substantially increased when consulting with a specialist in allergies, and younger adults tend to take the test more frequently than older adults do. Although the recommendation is that asthmatic individuals take allergy tests, professionals’ adherence is limited. The study suggests that asthmatic older adults might neglect tests that could benefit them. Performing allergy tests might mitigate asthma-related problems, such as emergency visits.
This study emphasizes the importance of knowing the profile of local aeroallergens as an invaluable tool for healthcare professionals. A thorough selection of specific IgE tests based on this profile emerges as a practical approach to accurately identifying a patient’s sensitivity to specific allergens. This approach increases diagnostic accuracy and contributes significantly to a more encompassing understanding of the complexities of individual allergies. Finally, by customizing diagnostic methods, healthcare professionals can optimize management strategies, providing more effective and personalized care to allergic patients.

5. Limitations and Future Research

One of the significant limitations was that the sample was based on the results of specific IgE reports obtained from laboratories. This means that the results of the exams were accounted for individually for each person, without a defined pattern of tested aeroallergens for all participants in the sample. It is worth noting that some health plans might not cover all these exams and that some patients might have chosen to take only part of a list of specific immunoglobulin tests prescribed by doctors. To diagnose allergies accurately, doctors must analyze symptoms, medical history, and laboratory exams, all in combination. Specific immunoglobulin test results can potentially improve asthma management in primary care and might serve as a basis for referral to specialists in asthma/allergies when the symptoms persist or when advanced treatments are required. Therefore, understanding the prevalence of sensitization to aeroallergens in different age groups might help in the early diagnosis and intervention of allergic diseases in this vast geographical region [35]. However, the present study only approaches IgE-mediated hypersensitivities. Several allergic patients develop non-IgE-mediated hypersensitivities to aeroallergens, producing respiratory conditions such as non-IgE-mediated allergic rhinitis and/or non-IgE-mediated allergic bronchitis (intrinsic asthma) [48,49]. Furthermore, our results may have been influenced by the age distribution of the sample, as it was predominantly composed of individuals under 18 years. However, our results may be more representative of pediatric and young adult populations, considering that sensitization profiles can vary significantly throughout the lifespan. Consequently, we must be careful when validating the applicability of these findings to older adult populations or to different regions with different demographic distributions.
We suggest that future studies aim for a more balanced age distribution, especially through stratified sampling, to allow more reliable comparisons across age groups. Additionally, the use of a standardized aeroallergen panel for the entire cohort, complemented by clinical data on symptoms and diagnoses collected via interviews, would help overcome limitations inherent in laboratory data.

6. Conclusions

Considering the results obtained in the present study, it is evident that the relationship between age group and sensitization to grass was significant, partially corroborating the initial hypothesis. The other aeroallergen categories, however, did not show any evident associations. Regarding seasons of the year, although spring was identified as the period with the highest incidence of exams, no significant associations were found with the aeroallergen categories analyzed. Being male was associated with higher odds of elevated specific IgE levels for the ‘Grass’ category, while increased age was correlated with higher total IgE levels.
The study revealed relevant intercorrelations between mites, dust, and pollen, with a predominance of mites and dust in patients classified as having “very high” IgE levels. This association emphasizes the importance of considering multiple aeroallergens when analyzing patients, as the presence of or exposure to one allergen might be associated with the presence of, or exposure to, another allergen due to similarities in their sources, seasonal cycles, and dispersal methods.
The predominance of the female sex in the studied population might have been affected by behavioral patterns in the search for healthcare services, as shown by data from the National Health Program. Hormonal variations throughout the life cycle were also discussed as factors that might affect sensitivity to allergens, highlighting the importance of considering the age group when interpreting the results of allergic tests [50]. Allergic conditions in children may be associated with a genetic predisposition, early exposure to formula feeding, and prenatal maternal stress. The importance of early environmental and psychosocial influences, which may be mediated by epigenetic mechanisms, in shaping allergic outcomes [51] is highlighted.
The study emphasizes that polysensitization is common, especially in young adults, and highlights the association between this polysensitization and airway allergy, emphasizing the need for an encompassing approach when analyzing IgE-mediated sensitization. Despite the contributions of the present study, it is crucial to recognize its limitations, such as the dependence on results of IgE exams obtained from laboratories, which cannot cover all cases. One suggestion is to perform a battery of serological tests of aeroallergens in a specific population sample distributed across the regions of Vale do Taquari (Taquari Valley). Additionally, interviews are recommended to collect information on diagnoses and symptoms.
In conclusion, the present study emphasizes the relevance of understanding the profile of local aeroallergens as a critical tool for healthcare professionals, aiming at a more accurate approach to diagnosing and treating allergic diseases. Customizing diagnostic methods, considering the particulars of each region and each patient, emerges as an effective strategy to provide more effective care adapted to sensitive patients’ individual needs.

Supplementary Materials

The following supporting information can be downloaded at: https://www.mdpi.com/article/10.3390/biomed5040024/s1, Figure S1: Age-Sex Pyramid between the factor ‘Sex’ (F = Female and M = Male) and the variable “Age” in individuals residing in Vale do Taquari/RS municipalities.

Author Contributions

Conceptualization, M.S.S. and T.J.; Writing—original draft, M.S.S., T.J. and G.L.d.S.; Methodology, M.S.S., T.J., Á.K.d.C., L.M.O., L.P. and R.W.W.; Investigation, Á.K.d.C., L.M.O., L.P. and R.W.W.; Formal analysis, G.L.d.S.; Validation; F.M.; Writing—review & editing, F.M. and G.L.d.S.; Supervision, G.L.d.S.; Project administration, F.M. and G.L.d.S. All authors have read and agreed to the published version of the manuscript.

Funding

This research received no external funding.

Institutional Review Board Statement

The study was conducted in accordance with the Declaration of Helsinki, and approved by the Research Ethics Committee of University of Taquari Valley—Univates (COEP/Univates) (protocol code 6.056.534 and date of approval 12 May 2023).

Informed Consent Statement

Due to the retrospective nature of the study, the ethics committee waived the requirement for informed consent.

Data Availability Statement

All data will be made available upon request to the authors.

Acknowledgments

The authors are grateful to Universidade do Vale do Taquari—Univates for its financial support and for providing the material required to conduct this study. We thank Daniela Tannus for improving the manuscript’s English.

Conflicts of Interest

The authors declare no conflicts of interest.

References

  1. Pawankar, R.; Canonica, G.W.; Holgate, S.T.; Lockey, R.F.; Blaiss, M. The WAO White Book on Allergy (Update 2013); WAO: Mindanao, Philippines, 2013. [Google Scholar]
  2. Bousquet, J.; Schunemann, H.J.; Togias, A.; Bachert, C.; Erhola, M.; Hellings, P.W.; Klimek, L.; Pfaar, O.; Wallace, D.; Ansotegui, I.; et al. Next-generation Allergic Rhinitis and Its Impact on Asthma (ARIA) guidelines for allergic rhinitis based on Grading of Recommendations Assessment, Development and Evaluation (GRADE) and real-world evidence. J. Allergy Clin. Immunol. 2019, 145, 70–80.e3. [Google Scholar] [CrossRef]
  3. Sztandera-Tymoczek, M.; Szuster-Ciesielska, A. Fungal Aeroallergens—The Impact of Climate Change. J. Fungi 2023, 9, 544. [Google Scholar] [CrossRef] [PubMed]
  4. Del Moral, M.G.; Martínez-Naves, E. The Role of Lipids in Development of Allergic Responses. Immune Netw. 2017, 17, 133–143. [Google Scholar] [CrossRef] [PubMed]
  5. Justiz-Vaillant, A.A.; Vashisht, R.; Zito, P.M. Immediate Hypersensitivity Reactions. In StatPearls [Internet]; StatPearls Publishing: Treasure Island, FL, USA, 2024. [Google Scholar]
  6. Xu, G.; Liu, B.; Yang, W.; Snetselaar, L.G.; Chen, M.; Bao, W.; Strathearn, L. Association of Food Allergy, Respiratory Allergy, and Skin Allergy with Attention Deficit/Hyperactivity Disorder among Children. Nutrients 2022, 14, 474. [Google Scholar] [CrossRef] [PubMed]
  7. Katoch, C.D.S.; Kumar, K.; Marwah, V.; Bhatti, G. Pattern of skin sensitivity to various aeroallergens by skin prick test in patients of allergic airway disease in South Western Maharashtra. Med. J. Armed Forces India 2022, 78, 400–404. [Google Scholar] [CrossRef]
  8. Soares, F.A.A.S.; Segundo, G.R.S.; Alves, R.; Ynoue, L.H.; Resende, R.O.; Sopelete, M.C.; Silva, D.A.O.; Sung, S.J.; Taketomi, E.A. Perfil de sensibilização a alérgenos domiciliares em pacientes ambulatoriais. Rev. Assoc. Med. Bras. 2007, 53, 25–28. [Google Scholar] [CrossRef]
  9. Bakonyi, S.M.C.; Oliveira, I.M.D.; Martins, L.C.; Braga, A.L. Poluição atmosférica e doenças respiratórias em crianças na cidade de Curitiba, PR. Rev. Saúde Pública 2004, 38, 695–700. [Google Scholar] [CrossRef]
  10. Aldakheel, F.M. Allergic Diseases: A Comprehensive Review on Risk Factors, Immunological Mechanisms, Link with COVID-19, Potential Treatments, and Role of Allergen Bioinformatics. Int. J. Environ. Res. Public Health 2021, 18, 12105. [Google Scholar] [CrossRef]
  11. Sakano, E.; Sarinho, E.S.C.; Cruz, A.A.; Pastorino, A.C.; Tamashiro, E.; Kuschnir, F.; Castro, F.F.M.; Romano, F.R.; Wandalsen, G.F.; Chong-Neto, H.J.; et al. IV Brazilian Consensus on Rhinitis—An update on allergic rhinitis. Braz. J. Otorhinolaryngol. 2018, 84, 3–14. [Google Scholar] [CrossRef]
  12. BRASIL. Protocolo Clínico e Diretrizes Terapêuticas da Asma; Ministério da Saúde: Brasília, Brazil, 2021. [Google Scholar]
  13. Demoly, P.; Liu, A.H.; Rodriguez Del Rio, P.; Pedersen, S.; Casale, T.B.; Price, D. A Pragmatic Primary Practice Approach to Using Specific IgE in Allergy Testing in Asthma Diagnosis, Management, and Referral. J. Asthma Allergy 2022, 15, 1069–1080. [Google Scholar] [CrossRef]
  14. Eiringhaus, K.; Renz, H.; Matricardi, P.; Skevaki, C. Component-Resolved Diagnosis in Allergic Rhinitis and Asthma. J. Appl. Lab. Med. 2019, 3, 883–898. [Google Scholar] [CrossRef]
  15. Sonntag, H.J.; Filippi, S.; Pipis, S.; Custovic, A. Blood Biomarkers of Sensitization and Asthma. Front. Pediatr. 2019, 7, 251. [Google Scholar] [CrossRef] [PubMed]
  16. Hamilton, R.G. Clinical laboratory assessment of immediate-type hypersensitivity. J. Allergy Clin. Immunol. 2010, 125, S284–S296. [Google Scholar] [CrossRef] [PubMed]
  17. Hamilton, R.G.; Adkinson, N.F. In vitro assays for the diagnosis of IgE-mediateddisorders. J. Allergy Clin. Immunol. 2004, 114, 213–225. [Google Scholar] [CrossRef] [PubMed]
  18. JAMOVI. Version 2.3; The Jamovi Project. 2022. Available online: https://www.jamovi.org (accessed on 1 December 2022).
  19. R Core Team. R: A Language and Environment for Statistical Computing, Version 4.1; R Packages Retrieved from MRAN Snapshot 2022-01-01; R Foundation for Statistical Computing: Vienna, Austria, 2021; Available online: https://cran.r-project.org (accessed on 1 December 2022).
  20. SPSS Inc. IBM SPSS Statistics Base 20; SPSS Inc.: Chicago, IL, USA, 2011. [Google Scholar]
  21. Yan, T.; Zheng, R.; Li, Y.; Sun, S.; Zeng, X.; Yue, Z.; Liao, Y.; Hu, Q.; Xu, Y.; Li, Q. Epidemiological Insights into the Omicron Outbreak via MeltArray-Assisted Real-Time Tracking of SARS-CoV-2 Variants. Viruses 2023, 15, 2397. [Google Scholar] [CrossRef]
  22. Ying, X.; Qi, X.; Yin, Y.; Wang, H.; Zhang, H.; Jiang, H.; Yang, L.; Wu, J. Allergens sensitization among children with allergic diseases in Shanghai, China: Age and sex difference. Respir. Res. 2022, 23, 95. [Google Scholar] [CrossRef]
  23. Shikha, G.; Swami, H. Trends of sensitization pattern to aeroallergens among the patients with allergic rhinitis and/or bronchial asthma in Bangalore: A cross sectional study. Med. J. Armed Forces India 2022, 78, 430–436. [Google Scholar] [CrossRef]
  24. Wang, X.; Zhou, L.; Wei, G.; Zhang, H.; Yang, B. Prevalence of allergen-specific IgE in southern China: A multicenter research. Aging 2021, 13, 18894–18911. [Google Scholar] [CrossRef]
  25. Ahmed, H.; Ospina, M.B.; Sideri, K.; Vliagoftis, H. Retrospective analysis of aeroallergen’s sensitization patterns in Edmonton, Canada. Allergy Asthma Clin. Immunol. 2019, 15, 6. [Google Scholar] [CrossRef]
  26. Bousquet, J.; Anto, J.M.; Wickman, M.; Keil, T.; Valenta, R.; Haahtela, T.; Lodrup Carlsen, K.; van Hage, M.; Akdis, C.; Bachert, C.; et al. Are allergic multimorbidities and IgE polysensitization associated with the persistence or re-occurrence of foetal type 2 signalling? The MeDALL hypothesis. Allergy 2015, 70, 1062–1078. [Google Scholar] [CrossRef]
  27. Zhao, L.; Wu, Y.; Zhu, H.; Lin, Y.; Su, H.; Hu, J.; Zhang, M.; Bao, W. Age, Sex, and Symptom-Dependent Variations in Total IgE and Eosinophils in Atopic Patients: A Five-Year Retrospective Study. J. Asthma Allergy 2025, 18, 915–926. [Google Scholar] [CrossRef] [PubMed]
  28. Howard, R.; Belgrave, D.; Papastamoulis, P.; Simpson, A.; Rattray, M.; Custovic, A. Evolution of IgE responses to multiple allergen components throughout childhood. J. Allergy Clin. Immunol. 2018, 142, 1322–1330. [Google Scholar] [CrossRef] [PubMed]
  29. Dai, L.; Liu, J.; Zhao, Q.; Li, M.; Zhou, Y.; Chen, Z.; Zhang, Y. Investigation of Allergic Sensitizations in Children with Allergic Rhinitis and/or Asthma. Front. Pediatr. 2022, 10, 842293. [Google Scholar] [CrossRef] [PubMed]
  30. Bousquet, J.; Anto, J.M.; Akdis, M.; Auffray, C.; Keil, T.; Momas, I.; Postma, D.S.; Valenta, R.; Wickman, M.; Cambon-Thomsen, A.; et al. Paving the way of systems biology and precision medicine in allergic diseases: The MeDALL success story: Mechanisms of the Development of ALLergy; EU FP7-CP-IP; Project No: 261357; 2010–2015. Allergy 2016, 71, 1513–1525. [Google Scholar] [CrossRef]
  31. Yong Rodríguez, A.; Macías Weinmann, A.; Palma Gomez, S.; Arias Cruz, A.; Pérez Vanzzini, R.; Gutiérrez Mujica, J.J.; González Díaz, S.N. Perfil de sensibilización a alergenos en niños con dermatitis atópica atendidos en el Servicio de Alergología del Hospital Universitario de la Universidad Autónoma de Nuevo León, México. Rev. Alerg. México 2015, 62, 98–106. [Google Scholar] [CrossRef]
  32. Sun, Z.; Zhao, Y.; An, X.; Gao, N.; Li, Z.; Zhang, S.; Liang, Y.; Ruan, W.; Bu, Y.; Xin, J.; et al. Effects of airborne pollen on allergic rhinitis and asthma across different age groups in Beijing, China. Sci. Total Environ. 2024, 912, 169215. [Google Scholar] [CrossRef]
  33. Karadoğan, D.; Telatar, T.G.; Dönmez, H.; Dursun, A.B. Relationship between aeroallergen sensitization pattern and clinical features in adult asthmatics. Heliyon 2023, 9, e15708. [Google Scholar] [CrossRef]
  34. Souza, T.M.O.; Fernandes, J.S.; Santana, C.V.N.; Lessa, M.M.; Cruz, Á.A. Aeroallergen sensitization patterns among patients with chronic rhinitis with or without concomitant asthma. Braz. J. Otorhinolaryngol. 2023, 90, 101351. [Google Scholar] [CrossRef]
  35. Rodinkova, V.; Grewling, Ł.; Ribeiro, H.; Antunes, C.; Apangu, G.P.; Çelenk, S.; Costa, A.; Eguiluz-Gracia, I.; Galveias, A.; Gonzalez Roldan, N.; et al. Outdoor airborne allergens: Characterization, behavior and monitoring in Europe. Sci. Total Environ. 2023, 905, 167042. [Google Scholar] [CrossRef]
  36. Andersson, K.; Lidholm, J. Characteristics and immunobiology of grass pollen allergens. Int. Arch. Allergy Immunol. 2003, 130, 87–107. [Google Scholar] [CrossRef]
  37. Kleine-Tebbe, J.; Davies, J. Grass pollen allergens. In Global Atlas of Allergy; Akdis, C.A., Agache, I., Eds.; European Academy of Allergy and Clinical Immunology: Zurich, Switzerland, 2014; pp. 22–26. [Google Scholar]
  38. Hemmer, W.; Schauer, U.; Trinca, A.M.; Neumann, C. Endbericht 2009 zur Studie: Prävalenz der Ragweedpollen-Allergie in Ostösterreich; Amt der NÖ Landesregierung, Landesamtsdirektion, Abteilung Gebäudeverwaltung, Amtsdruckerei: St. Pölten, Austria, 2010. [Google Scholar]
  39. Johansen, N.; Weber, R.W.; Ipsen, H.; Barber, D.; Broge, L.; Hejl, C. Extensive IgE cross-reactivity towards the Pooideae grasses substantiated for a large number of grass-pollen-sensitized subjects. Int. Arch. Allergy Immunol. 2009, 150, 325–334. [Google Scholar] [CrossRef] [PubMed]
  40. Bullimore, A.; Batten, T.; Hewings, S.; Fischer von Weikersthal-Drachenberg, K.J.; Skinner, M. Cross-reactivity in Grasses: Biochemical Attributes Define Exemplar Relevance. World Allergy Organ. J. 2012, 5, 111–119. [Google Scholar] [CrossRef] [PubMed]
  41. Susanto, N.H.; Schoos, A.-M.M.; Standl, M.; Lowe, A.J.; Dharmage, S.C.; Svanes, C.; Salim, A.; von Berg, A.; Lehmann, I.; Rasmussen, M.A.; et al. Environmental grass pollen levels in utero and at birth and cord blood IgE: Analysis of three birth cohorts. Environ. Int. 2018, 119, 295–301. [Google Scholar] [CrossRef] [PubMed]
  42. Kim, I.; Minn, D.; Kim, S.; Kim, J.K.; Cho, J.H. Aeroallergen Sensitization Status in South Korea from 2018 to 2021. Clin. Exp. Otorhinolaryngol. 2022, 15, 254–263. [Google Scholar] [CrossRef]
  43. Khasawneh, R.; Al-Hiary, M.; Al-Abadi, B.; Bani-Salameh, A.; Al-Momani, S. Total and Specific Immunoglobulin E for Detection of Most Prevalent Aeroallergens in a Jordanian Cohort. Med. Arch. 2019, 73, 272–275. [Google Scholar] [CrossRef]
  44. Levetin, E. Aeroallergens and Climate Change in Tulsa, Oklahoma: Long-Term Trends in the South Central United States. Front. Allergy 2021, 2, 726445. [Google Scholar] [CrossRef]
  45. Oh, J.W. Pollen Allergy in a Changing Planetary Environment. Allergy Asthma Immunol. Res. 2022, 14, 168–181. [Google Scholar] [CrossRef]
  46. Meher, B.K.; Pradhan, D.D.; Mahar, J.; Sahu, S.K. Prevalence of Allergic Sensitization in Childhood Asthma. Cureus 2021, 13, e15311. [Google Scholar] [CrossRef]
  47. Gleeson, P.K.; Morales, K.H.; Buckey, T.M.; Fadugba, O.O.; Apter, A.J.; Christie, J.D.; Himes, B.E. Factors associated with aeroallergen testing among adults with asthma in a large health system. J. Allergy Clin. Immunol. Glob. 2023, 2, 100167. [Google Scholar] [CrossRef]
  48. Olivier, C.E.; Pinto, D.G.; Teixeira, A.P.M.; Santana, J.L.S.; Santos, R.A.P.G.S.; Lima, R.P.S.; Monteiro, E.S. Evaluating Non-IgE-Mediated Allergens’ Immunoreactivity in Patients Formerly Classified as “Intrinsic” Asthmatics with Help of the Leukocyte Adherence Inhibition Test. Eur. J. Clin. Med. 2023, 4, 1–7. [Google Scholar] [CrossRef]
  49. Olivier, C.E.; Pinto, D.G.; Teixeira, A.P.M.; Santana, J.L.S.; Santos, R.A.P.G.S.; Lima, R.P.S.; Monteiro, E.S. Evaluating Non-IgE-mediated Allergens’ Immunoreactivity in Patients with “Intrinsic” Persistent Rhinitis with Help of the Leukocyte Adherence Inhibition Test. Eur. J. Med. Health Sci. 2023, 5, 17–22. [Google Scholar] [CrossRef]
  50. Bouman, A.; Heineman, M.J.; Faas, M.M. Sex hormones and the immune response in humans. Hum. Reprod. Update 2005, 11, 411–423. [Google Scholar] [CrossRef]
  51. Hachmeriyan, A.; Toneva, A.; Marinova-Achkar, M.; Pancheva, R. Early-Life Environmental Determinants of Allergic Conditions in Children with Atopic Heredity: A Single Center Cross-Sectional Study from Bulgaria. Med. Sci. 2025, 13, 198. [Google Scholar] [CrossRef]
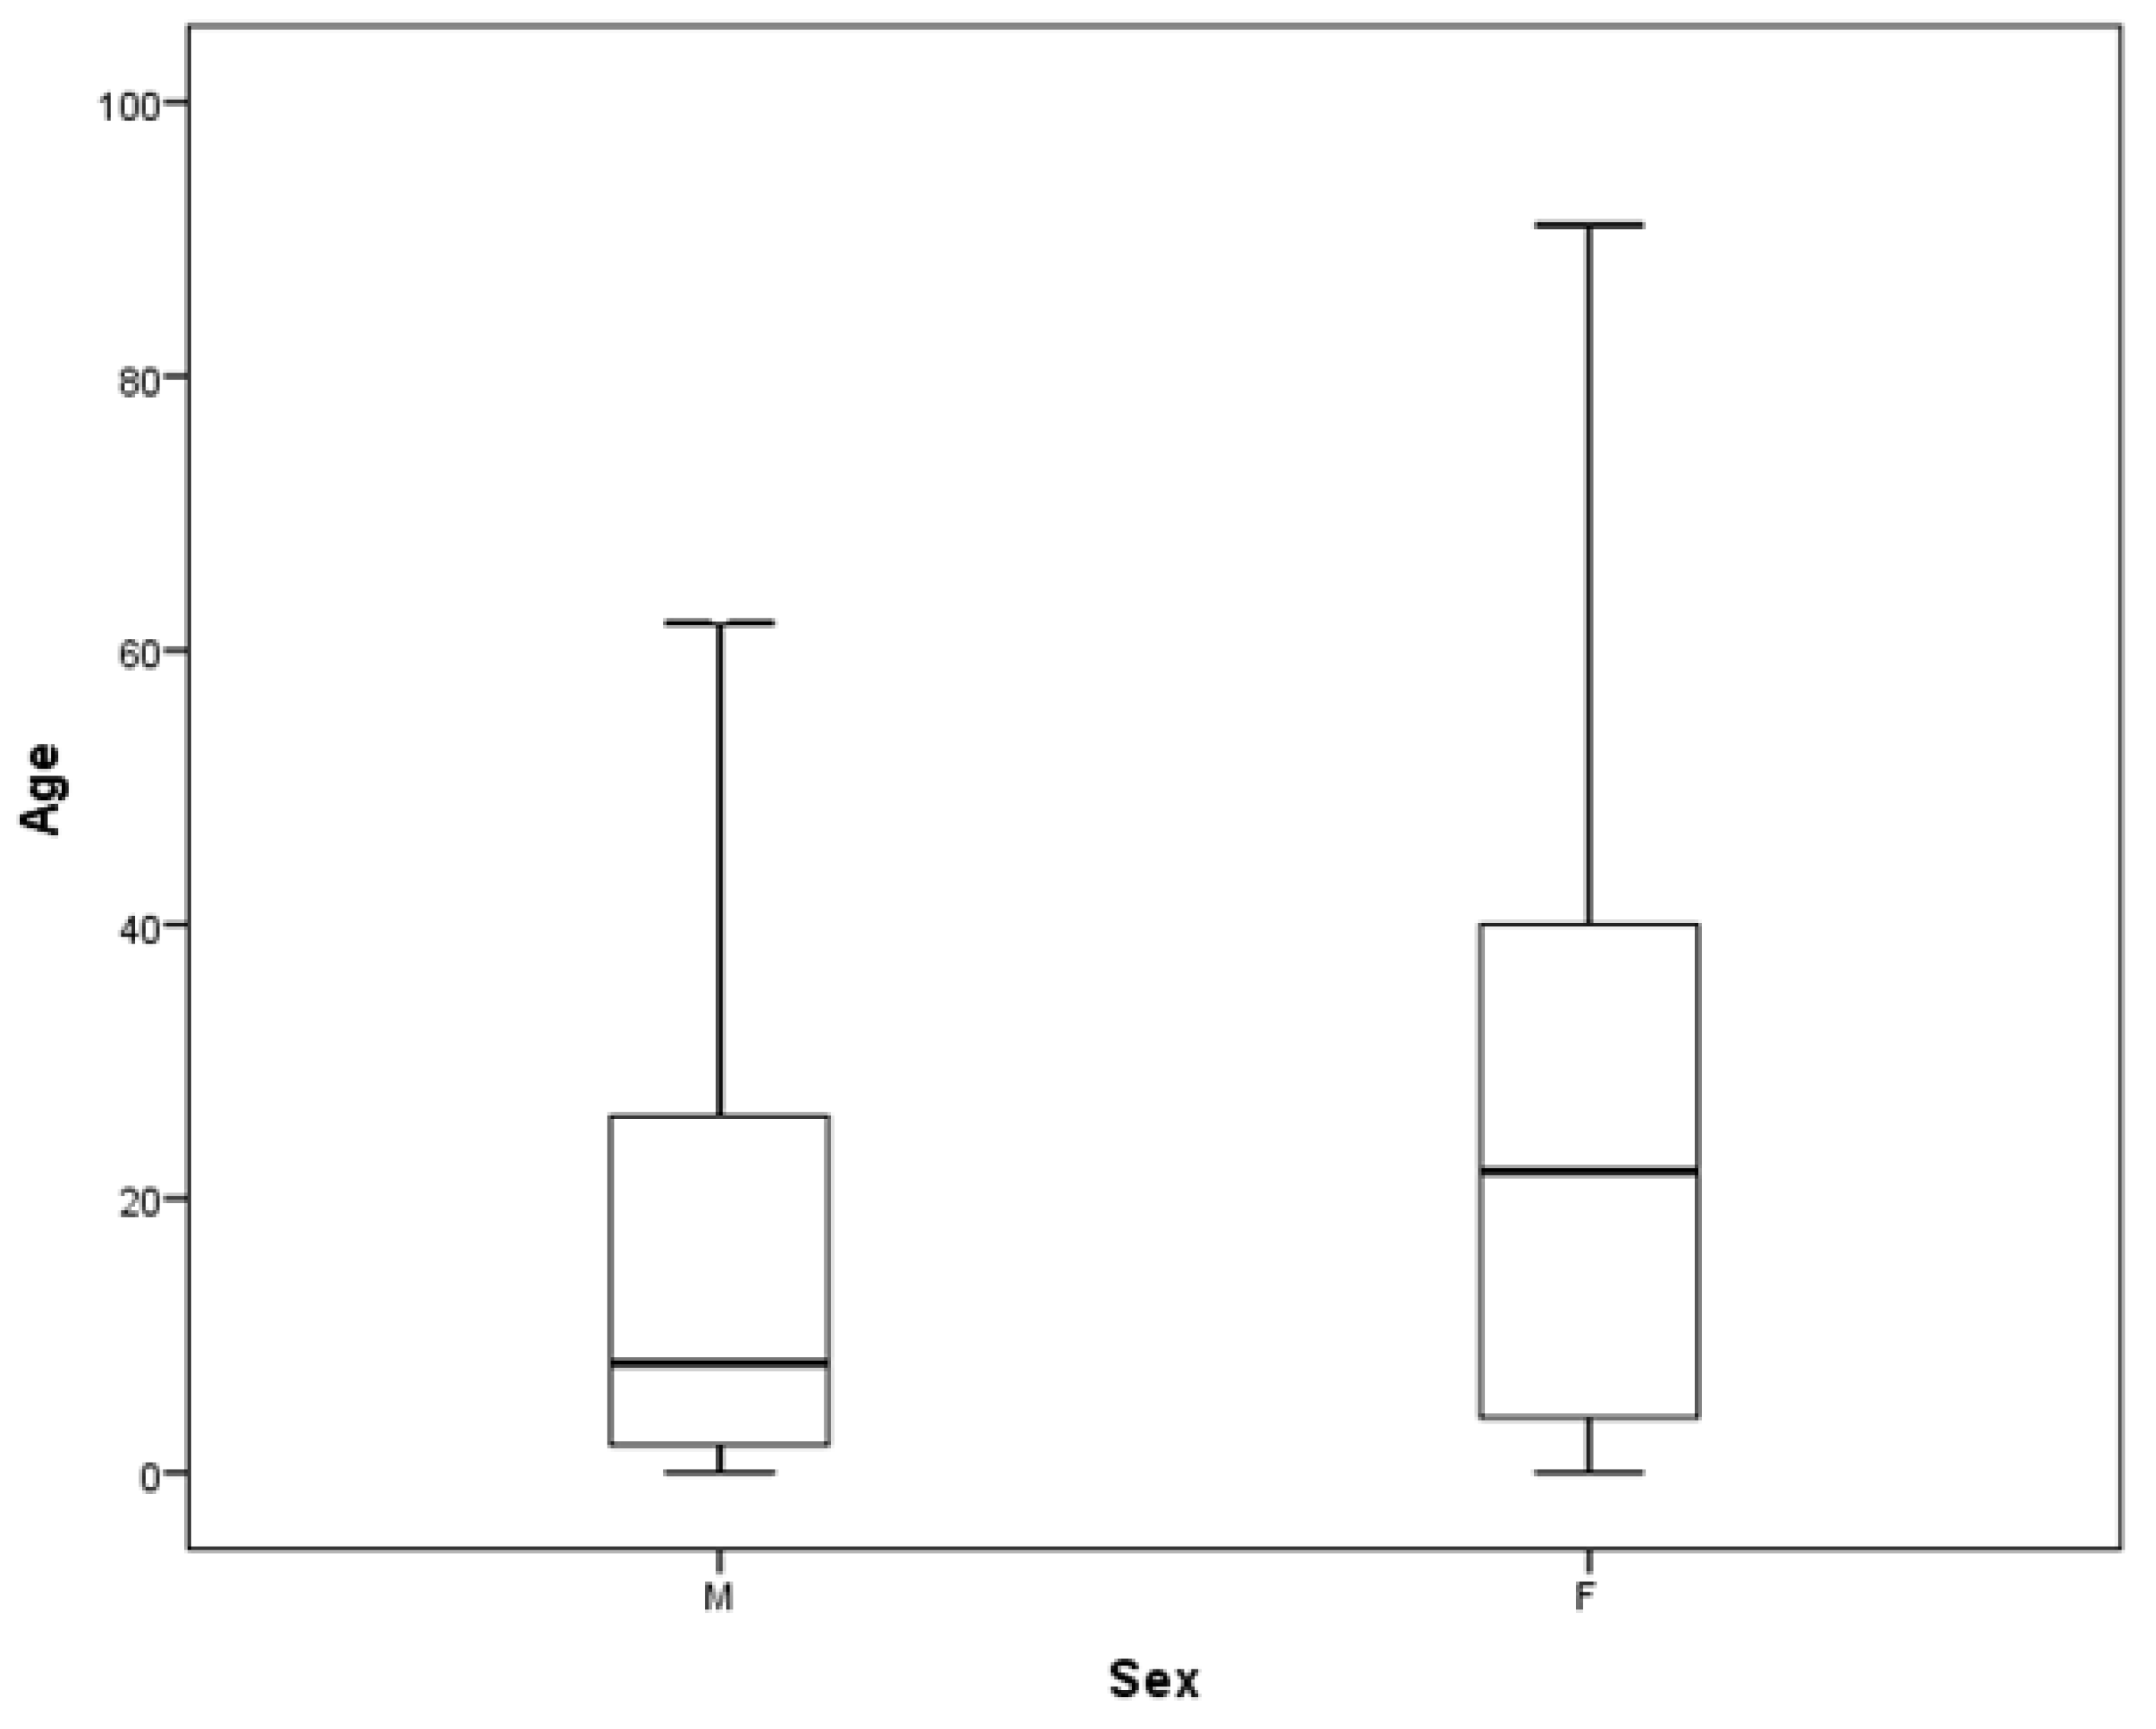
Figure 1. Age data per sex in a box-plot graph of the individuals residing in the Vale do Taquari/RS municipalities who took the specific IgE test for airborne allergens (aeroallergens).
Biomed 05 00024 g001
Figure 2. Dispersal graph of E immunoglobulin values in each category evaluated, distributed through the seasons of the year and segmented by sex (F = Female and M = Male), derived from individuals residing in the municipalities of Vale do Taquari/RS (Taquari Valley).
Biomed 05 00024 g002
Figure 3. Data dispersal graph between the factor ‘Sex’ (F = Female and M = Male) and the aeroallergen category ‘Grass’, derived from individuals residing in the municipalities of Vale do Taquari/RS (Taquari Valley).
Biomed 05 00024 g003
Figure 4. Biplot graph generated by the Principal Component Analysis of the aeroallergen categories (‘Mites,’ ‘Dust,’ ‘Grass,’ ‘Epithelial,’ ‘Fungi,’ and ‘Pollen’) and the variable ‘Age’ in individuals residing in the municipalities of Vale do Taquari/RS.
Biomed 05 00024 g004
Figure 5. Dispersal graph considering the IgE counts between ‘Mites’ (x-axis) and ‘Dust’ (y-axis), derived from individuals residing in the municipalities of Vale do Taquari/RS (Taquari Valley).
Biomed 05 00024 g005
Figure 6. Box plot visualization illustrating latent class profiles of specific IgE sensitization patterns from individuals residing in the municipalities of Vale do Taquari/RS (Taquari Valley). Red (Class 1), Blue (Class 2), and Green (Class3) boxes represent distinct sensitization profiles: mites (Class_Mite), dust (Class_Dust), grasses (Class_Grasses), epithelium (Class_Epithelium), and pollen (Class_Pollen).
Biomed 05 00024 g006
Table 1. IgE-level frequency (Undetectable, Low, Moderate, High, Very High) according to aeroallergen categories.
Categories Undetectable (<0.35 kU/L) Low
(≥0.35 kU/L–<0.7 kU/L)
Moderate
(≥0.7 kU/L–<3.5 kU/L)
High
(≥3.5 kU/L–<17.5 kU/L)
Very High
(≥17.5 kU/L)
Mites334 (62.2) *17 (3.2)40 (7.4)57 (10.6)89 (16.6)
Dust368 (62.3)15 (2.5)46 (7.8)64 (10.8)98 (16.6)
Grass587 (79.2)21 (2.8)51 (6.9)32 (4.3)50 (6.7)
Epithelial cells143 (79.9)9 (5)12 (6.7)7 (3.9)8 (4.5)
Fungi266 (96)4 (1.4)6 (2.2)0 (0)1 (0.4)
Pollen85 (68.5)5 (4)14 (11.3)9 (7.3)11 (8.9)
* N (%)—The values expressed as percentages are presented in rows.
Table 2. Fit indices for latent class models of specific IgE ordinal scales.
ClassAICBICCAICEntropyp-Value
23907414741960.77-
33733410141760.82<0.001
Table 3. Logistic regression coefficients and odds ratios (OR) adjusted for age and sex for latent class profiles of specific IgE sensitization in the Taquari Valley/RS.
ORCoefficientStandard Errortp-Value
Class1/3. (Intercept)8.112.090.494.19<0.001
Class1/3.Sex1.370.310.281.120.26
Class1/3.Age0.63−0.440.06−6.53<0.001
Class2/3. (Intercept)0.04−3.070.59−5.19<0.001
Class2/3.Sex1.480.390.261.490.13
Class2/3.Age1.080.070.017.06<0.001
Disclaimer/Publisher’s Note: The statements, opinions and data contained in all publications are solely those of the individual author(s) and contributor(s) and not of MDPI and/or the editor(s). MDPI and/or the editor(s) disclaim responsibility for any injury to people or property resulting from any ideas, methods, instructions or products referred to in the content.