
Advancing Brain MRI Image Classification: Integrating VGG16 and ResNet50 with a Multi-Verse Optimization Method

 , ,
, ,  and
and
Abstract
1. Introduction
2. Literature Review
3. Materials and Methods
3.1. Data Preprocessing
- Image Resizing: Each image was resized to a standard dimension, certifying uniformity across the dataset. This was important for consistency when feeding the images into the neural network models.
- Grayscale Conversion: The resized images were converted to grayscale to moderate computational complexity. Color information was typically redundant for the task at hand, as the focus was on texture and shape within the images.
- Gaussian Blurring: To reduce high-frequency noise, a Gaussian blur was applied to the grayscale images. This smoothing technique aided in highlighting the more significant structures within the brain by softening edges and details.
- Otsu’s Thresholding: We implemented Otsu’s thresholding to separate the brain tissue from the background. This method automatically computed a threshold value for image binarization, which was employed to detect contours.
- Contour Detection and Selection: By applying contour detection, we identified the boundaries of all the objects in the binary image. We assumed the largest contour to be the brain’s boundary, a reasonable assumption in a typical MRI scan.
- Extreme Points and Cropping: Once the largest contour was identified, we verified its extreme points. These points represented the furthest pixels in the horizontal and vertical directions within the contour, which we employed to define a cropping boundary.
- Image Cropping: The image was cropped using the extreme points as vertices, with an optional padding added to ensure no part of the brain was excluded.
- Displaying the Process: We visualized the preprocessing steps, displaying the original image, the contour of the largest detected region, the extreme points, and finally, the cropped brain region.
3.2. Optimization Method
- Optimization of Data Augmentation Parameters: MVO was utilized to uncover the best data augmentation techniques and their respective parameter values. This step was crucial to enhance the dataset variability without deviating from the realistic transformations applicable to MRI images. By doing so, we aimed to maximize the performance of the classification models while avoiding overfitting.
- Layer-wise Trainability in CNNs: We also applied the MVO strategy to find the optimal configuration of trainable layers within VGG16 and ResNet50 architectures. The method helped in identifying which layers should be frozen (weights not updated during training) and which should be trainable (weights updated during training) to improve the models’ accuracy and efficiency. This is particularly important, as deep neural networks can be computationally expensive to train, and freezing certain layers can significantly diminish the number of parameters that are essential to be updated, thus speeding up the training process and potentially improving generalization.
- Universe Size (Population Size): This parameter defines the number of potential solutions (universes) that the algorithm will consider simultaneously. A larger universe size allows for greater exploration of the solution space. A universe size of 30 achieves a compromise between computing efficiency and diversity within the search space. More extensive populations enhance diversity but may impede the optimization process, whereas smaller populations might converge rapidly yet risk overlooking ideal solutions due to inadequate research. A universe size of 30 facilitates a sufficiently diversified population to investigate many solutions while minimizing computational expenses.
- Wormhole Existence Probability (WEP): This probability controls the creation of wormholes, which are mechanisms for sharing information between universes. A value of 0.6 signifies a considerable probability of the formation of these wormholes. This likelihood facilitates an effective combination of exploration (investigating new regions of the solution space) and exploitation (enhancing current solutions). A high WEP (approaching 1) may result in premature convergence due to excessive emphasis on exploitation, whereas a low WEP (approaching 0) restricts exploitation, hence obstructing convergence to an ideal solution. A WEP of 0.6 guarantees that the MVO algorithm can efficiently navigate the solution space while simultaneously enhancing viable solutions.
- Travelling Distance Rate (TDR): This rate determines how much a solution can be altered when a wormhole event occurs. A value of 0.4 signifies that alterations to the solutions are moderate. If the TDR is overly elevated, solutions may be excessively disturbed, resulting in irregular exploration that could overlook excellent solutions. If TDR is excessively low, the algorithm may adopt an overly conservative approach and become trapped in local optima. A TDR of 0.4 offers a balanced methodology, enabling the algorithm to implement significant modifications to solutions while remaining close to attractive regions.
- Maximum/Minimum WEP: These parameters set the lower and upper bounds for the wormhole existence probability, introducing dynamic variability in the algorithm. The interval [0.2, 1.0] guarantees that during the initial phases of optimization, the method prioritizes exploration (with a reduced WEP at 0.2), thus avoiding premature convergence. As the algorithm advances, WEP approaches 1.0, highlighting exploitation in the latter phases to optimize the results. The incremental rise in WEP enables the early investigation of several options while refining the search in the concluding iterations for enhanced precision.
- Maximum/Minimum TDR: Similar to WEP, these parameters set the boundaries for the traveling distance rate, controlling the extent of solution alterations through the optimization process. Commencing with a minimum TDR of 0.4 guarantees that initial exploration remains closely aligned with the existing optimal solutions. As optimization progresses, the TDR may rise to 1.0, facilitating more substantial alterations in subsequent phases. This adaptive modification allows the method to maintain flexibility throughout the initial phases of optimization while intensifying solution refinement as it nears convergence.
3.3. Data Augmentation
- Mitigates Overfitting: Augmentation spreads the variety of the training samples, which helps prevent the model from memorizing specific images and overfitting.
- Improves Generalization: By simulating various scenarios, data augmentation allows the model to generalize better to new, unseen data.
- Compensates for Imbalanced Datasets: In cases where some classes are underrepresented, augmentation can help to balance the samples without the need to collect more data.
- Enhances Model Robustness: Augmented data aid the model in learning more robust features that are invariant to certain transformations, which is significant for real-world applications.
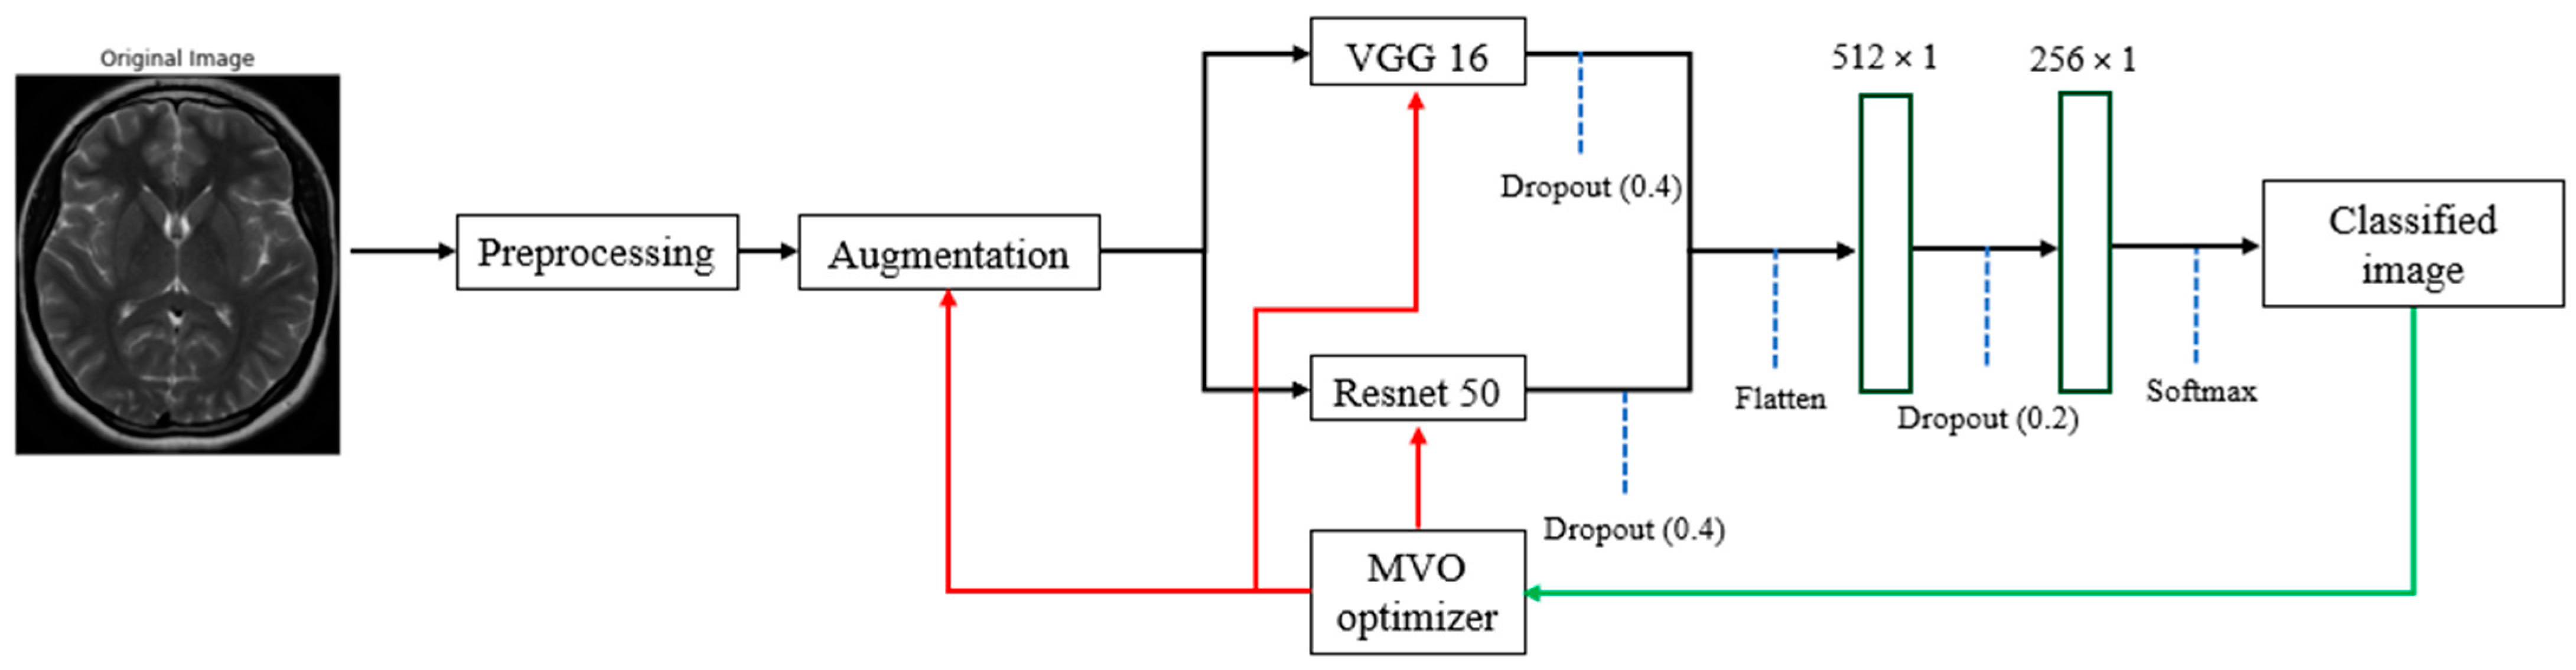
3.4. Model Building with VGG16 and ResNet50
3.5. Model Training
3.6. Dataset
- 1.
- No Tumor:
- This class encompasses brain MRI scans attained from individuals who do not demonstrate any detectable brain tumors. These scans serve as a crucial baseline for comparative analysis against scans that do depict tumors.
- Individuals within this class are typically those seeking routine brain examinations or experiencing neurological symptoms unrelated to tumor presence.
- 2.
- Tumor:
- The “Tumor” class comprises brain MRI scans from individuals who have been clinically diagnosed with brain tumors. Brain tumors are marked in various locations, sizes, and types, making their accurate finding and grouping a formidable challenge in the field of medical imaging.
- The tumors within this class may include metastatic tumors, gliomas, meningiomas, and other forms of abnormal growth within the brain.
3.7. Model Evaluation
- 1.
- Precision (Equation (1)):
- Description: Precision assesses the accuracy of the positive predictions made by the structure. In simpler terms, it answers the following question: of all the instances where the model predicted ‘positive’, how many were actually positive?
- Components:
- True Positives (TP): These are the instances where the model precisely predicts the positive class.
- False Positives (FP): These are the instances where the model wrongly predicts the positive class.
- Usage: Precision is particularly essential in situations where the cost of a false positive is high. For example, in medical diagnostics, falsely recognizing a healthy patient as having a tumor can lead to unnecessary stress and treatment.
- 2.
- Accuracy (Equation (2)):
- Description: Accuracy measures the proportion of true outcomes (both true negatives and positives) among the total number of cases examined. It essentially quantifies how often the model is correct.
- Components:
- True Negatives (TN): These are the instances where the model properly predicts the negative class.
- False Negatives (FN): These are the instances where the model mistakenly predicts the negative class.
- Usage: Accuracy is a valuable measure when the classes in the dataset are balanced. However, its usefulness is reduced when dealing with imbalanced datasets, as it can be misleadingly high in cases where the model mostly predicts the majority class correctly.
- 3.
- Recall (Sensitivity) (Equation (3)):
- Description: Recall measures the proportion of actual positives that were accurately recognized by the model. It answers the following question: of all the instances that were actually positive, how many did the model identify?
- Usage: Recall is critical in contexts where missing a positive instance is significantly worse than falsely detecting a negative instance as positive. For example, in medical diagnostics, a false negative (failing to detect a tumor) can be more dangerous than a false positive.
4. Results and Discussion
5. Conclusions and Outlook
Author Contributions
Funding
Institutional Review Board Statement
Informed Consent Statement
Data Availability Statement
Conflicts of Interest
References
- Badža, M.M.; Barjaktarović, M. Segmentation of Brain Tumors from MRI Images Using Convolutional Autoencoder. Appl. Sci. 2021, 11, 4317. [Google Scholar] [CrossRef]
- Choi, S.-G.; Sohn, C.-B. Detection of HGG and LGG Brain Tumors using U-Net. Medico-Legal Updat. 2019, 19, 560–565. [Google Scholar] [CrossRef]
- Wijethilake, N.; Meedeniya, D.; Chitraranjan, C.; Perera, I.; Islam, M.; Ren, H. Glioma Survival Analysis Empowered With Data Engineering—A Survey. IEEE Access 2021, 9, 43168–43191. [Google Scholar] [CrossRef]
- Ranjbarzadeh, R.; Caputo, A.; Tirkolaee, E.B.; Ghoushchi, S.J.; Bendechache, M. Brain tumor segmentation of MRI images: A comprehensive review on the application of artificial intelligence tools. Comput. Biol. Med. 2022, 152, 106405. [Google Scholar] [CrossRef]
- Dasanayaka, S.; Silva, S.; Shantha, V.; Meedeniya, D.; Ambegoda, T. Interpretable Machine Learning for Brain Tumor Analysis Using MRI. In Proceedings of the ICARC 2022—2nd International Conference on Advanced Research in Computing: Towards a Digitally Empowered Society, Belihuloya, Sri Lanka, 23–24 February 2022; pp. 212–217. [Google Scholar] [CrossRef]
- Raj, R.; Luostarinen, T.; Pursiainen, E.; Posti, J.P.; Takala, R.S.K.; Bendel, S.; Konttila, T.; Korja, M. Machine learning-based dynamic mortality prediction after traumatic brain injury. Sci. Rep. 2019, 9, 17672. [Google Scholar] [CrossRef]
- Karkehabadi, A.; Bakhshi, M.; Razavian, S.B. Optimizing Underwater IoT Routing with Multi-Criteria Decision Making and Uncertainty Weights. May 2024. Available online: https://arxiv.org/abs/2405.11513v1 (accessed on 6 June 2024).
- Karkehabadi, A.; Homayoun, H.; Sasan, A. FFCL: Forward-Forward Net with Cortical Loops, Training and Inference on Edge Without Backpropagation. arXiv 2024, arXiv:2405.12443. [Google Scholar] [CrossRef]
- Zhang, L.; Tan, J.; Han, D.; Zhu, H. From machine learning to deep learning: Progress in machine intelligence for rational drug discovery. Drug Discov. Today 2017, 22, 1680–1685. [Google Scholar] [CrossRef]
- Saryazdi, S.M.E.; Etemad, A.; Shafaat, A.; Bahman, A.M. Data-driven performance analysis of a residential building applying artificial neural network (ANN) and multi-objective genetic algorithm (GA). Build. Environ. 2022, 225, 109633. [Google Scholar] [CrossRef]
- Anari, S.; Sarshar, N.T.; Mahjoori, N.; Dorosti, S.; Rezaie, A. Review of Deep Learning Approaches for Thyroid Cancer Diagnosis. Math. Probl. Eng. 2022, 2022, 5052435. [Google Scholar] [CrossRef]
- Ranjbarzadeh, R.; Keles, A.; Crane, M.; Anari, S.; Bendechache, M. Secure and Decentralized Collaboration in Oncology: A Blockchain Approach to Tumor Segmentation. In Proceedings of the 2024 IEEE 48th Annual Computers, Software, and Applications Conference (COMPSAC), Osaka, Japan, 2–4 July 2024; pp. 1681–1686. [Google Scholar] [CrossRef]
- Pandey, B.; Pandey, D.K.; Mishra, B.P.; Rhmann, W. A comprehensive survey of deep learning in the field of medical imaging and medical natural language processing: Challenges and research directions. J. King Saud Univ. Comput. Inf. Sci. 2022, 34, 5083–5099. [Google Scholar] [CrossRef]
- Conneau, A.; Kiela, D.; Schwenk, H.; Barrault, L.; Bordes, A. Supervised Learning of Universal Sentence Representations from Natural Language Inference Data. EMNLP 2017—Conference on Empirical Methods in Natural Language Processing, Proceedings, pp. 670–680. May 2017. Available online: http://arxiv.org/abs/1705.02364 (accessed on 15 June 2020).
- Sarshar, N.T.; Mirzaei, M. Premature Ventricular Contraction Recognition Based on a Deep Learning Approach. J. Heal. Eng. 2022, 2022, 1450723. [Google Scholar] [CrossRef] [PubMed]
- Sarshar, N.T.; Abdossalehi, M. Automated Cardiovascular Arrhythmia Classification Based on Through Nonlinear Features and Tunable-Q Wavelet Transform (TQWT) Based Decomposition. Rev. Comput. Eng. Stud. 2021, 8, 35–41. [Google Scholar] [CrossRef]
- Gambella, C.; Ghaddar, B.; Naoum-Sawaya, J. Optimization problems for machine learning: A survey. Eur. J. Oper. Res. 2021, 290, 807–828. [Google Scholar] [CrossRef]
- Ver Berne, J.; Saadi, S.B.; Politis, C.; Jacobs, R. A deep learning approach for radiological detection and classification of radicular cysts and periapical granulomas. J. Dent. 2023, 135, 104581. [Google Scholar] [CrossRef]
- Liu, Z.; Tong, L.; Chen, L.; Jiang, Z.; Zhou, F.; Zhang, Q.; Zhang, X.; Jin, Y.; Zhou, H. Deep learning based brain tumor segmentation: A survey. Complex Intell. Syst. 2022, 9, 1001–1026. [Google Scholar] [CrossRef]
- Sailunaz, K.; Alhajj, S.; Özyer, T.; Rokne, J.; Alhajj, R. A survey on brain tumor image analysis. Med. Biol. Eng. Comput. 2024, 62, 1–45. [Google Scholar] [CrossRef]
- Chahal, P.K.; Pandey, S.; Goel, S. A survey on brain tumor detection techniques for MR images. Multimedia Tools Appl. 2020, 79, 21771–21814. [Google Scholar] [CrossRef]
- Dasanayaka, S.; Shantha, V.; Silva, S.; Meedeniya, D.; Ambegoda, T. Interpretable machine learning for brain tumour analysis using MRI and whole slide images. Softw. Impacts 2022, 13, 100340. [Google Scholar] [CrossRef]
- Vadhnani, S.; Singh, N. Brain tumor segmentation and classification in MRI using SVM and its variants: A survey. Multimedia Tools Appl. 2022, 81, 31631–31656. [Google Scholar] [CrossRef]
- Raza, R.; Bajwa, U.I.; Mehmood, Y.; Anwar, M.W.; Jamal, M.H. dResU-Net: 3D deep residual U-Net based brain tumor segmentation from multimodal MRI. Biomed. Signal Process. Control. 2022, 79, 103861. [Google Scholar] [CrossRef]
- Zhu, Z.; He, X.; Qi, G.; Li, Y.; Cong, B.; Liu, Y. Brain tumor segmentation based on the fusion of deep semantics and edge information in multimodal MRI. Inf. Fusion 2022, 91, 376–387. [Google Scholar] [CrossRef]
- Parhizkar, M.; Amirfakhrian, M. Car detection and damage segmentation in the real scene using a deep learning approach. Int. J. Intell. Robot. Appl. 2022, 6, 231–245. [Google Scholar] [CrossRef]
- Safavi, S.; Jalali, M. RecPOID: POI Recommendation with Friendship Aware and Deep CNN. Futur. Internet 2021, 13, 79. [Google Scholar] [CrossRef]
- Ranjbarzadeh, R.; Crane, M.; Bendechache, M. The Impact of Backbone Selection in Yolov8 Models on Brain Tumor Localization. 2024; preprint. [Google Scholar] [CrossRef]
- Vankdothu, R.; Hameed, M.A. Brain tumor MRI images identification and classification based on the recurrent convolutional neural network. Meas. Sensors 2022, 24, 100412. [Google Scholar] [CrossRef]
- Siddiqi, M.H.; Alsayat, A.; Alhwaiti, Y.; Azad, M.; Alruwaili, M.; Alanazi, S.; Kamruzzaman, M.M.; Khan, A. A Precise Medical Imaging Approach for Brain MRI Image Classification. Comput. Intell. Neurosci. 2022, 2022, 6447769. [Google Scholar] [CrossRef]
- Ullah, Z.; Farooq, M.U.; Lee, S.-H.; An, D. A hybrid image enhancement based brain MRI images classification technique. Med. Hypotheses 2020, 143, 109922. [Google Scholar] [CrossRef]
- Alrashedy, H.H.N.; Almansour, A.F.; Ibrahim, D.M.; Hammoudeh, M.A.A. BrainGAN: Brain MRI Image Generation and Classification Framework Using GAN Architectures and CNN Models. Sensors 2022, 22, 4297. [Google Scholar] [CrossRef]
- Khan, M.A.; Khan, A.; Alhaisoni, M.; Alqahtani, A.; Alsubai, S.; Alharbi, M.; Malik, N.A.; Damaševičius, R. Multimodal brain tumor detection and classification using deep saliency map and improved dragonfly optimization algorithm. Int. J. Imaging Syst. Technol. 2022, 33, 572–587. [Google Scholar] [CrossRef]
- Balaha, H.M.; Hassan, A.E.S. A variate brain tumor segmentation, optimization, and recognition framework. Artif. Intell. Rev. 2023, 56, 7403–7456. [Google Scholar] [CrossRef]
- Deepa, S.; Janet, J.; Sumathi, S.; Ananth, J.P. Hybrid Optimization Algorithm Enabled Deep Learning Approach Brain Tumor Segmentation and Classification Using MRI. J. Digit. Imaging 2023, 36, 847–868. [Google Scholar] [CrossRef] [PubMed]
- Ezugwu, A.E.; Shukla, A.K.; Nath, R.; Akinyelu, A.A.; Agushaka, J.O.; Chiroma, H.; Muhuri, P.K. Metaheuristics: A comprehensive overview and classification along with bibliometric analysis. Artif. Intell. Rev. 2021, 54, 4237–4316. [Google Scholar] [CrossRef]
- França, R.P.; Monteiro, A.C.B.; Estrela, V.V.; Razmjooy, N. Using Metaheuristics in Discrete-Event Simulation. In Lecture Notes in Electrical Engineering; Springer Science and Business Media Deutschland GmbH: Cham, Switzerland, 2021; Volume 696, pp. 275–292. [Google Scholar] [CrossRef]
- Razmjooy, N.; Ashourian, M.; Foroozandeh, Z. (Eds.) Metaheuristics and Optimization in Computer and Electrical Engineering. In Lecture Notes in Electrical Engineering; Springer International Publishing: Cham, Switzerland, 2021; Volume 696. [Google Scholar] [CrossRef]
- Hu, A.; Razmjooy, N. Brain tumor diagnosis based on metaheuristics and deep learning. Int. J. Imaging Syst. Technol. 2020, 31, 657–669. [Google Scholar] [CrossRef]
- Mirjalili, S.; Mirjalili, S.M.; Hatamlou, A. Multi-Verse Optimizer: A nature-inspired algorithm for global optimization. Neural Comput. Appl. 2015, 27, 495–513. [Google Scholar] [CrossRef]
- Son, P.V.H.; Dang, N.T.N. Solving large-scale discrete time–cost trade-off problem using hybrid multi-verse optimizer model. Sci. Rep. 2023, 13, 1987. [Google Scholar] [CrossRef]
- Han, Y.; Chen, W.; Heidari, A.A.; Chen, H.; Zhang, X. A solution to the stagnation of multi-verse optimization: An efficient method for breast cancer pathologic images segmentation. Biomed. Signal Process. Control. 2023, 86, 105208. [Google Scholar] [CrossRef]
- Haseeb, A.; Waleed, U.; Ashraf, M.M.; Siddiq, F.; Rafiq, M.; Shafique, M. Hybrid Weighted Least Square Multi-Verse Optimizer (WLS–MVO) Framework for Real-Time Estimation of Harmonics in Non-Linear Loads. Energies 2023, 16, 609. [Google Scholar] [CrossRef]
- Xu, W.; Yu, X. A multi-objective multi-verse optimizer algorithm to solve environmental and economic dispatch. Appl. Soft Comput. 2023, 146, 110650. [Google Scholar] [CrossRef]
- Shorten, C.; Khoshgoftaar, T.M. A survey on Image Data Augmentation for Deep Learning. J. Big Data 2019, 6, 60. [Google Scholar] [CrossRef]
- Nalepa, J.; Marcinkiewicz, M.; Kawulok, M. Data Augmentation for Brain-Tumor Segmentation: A Review. Front. Comput. Neurosci. 2019, 13, 83. [Google Scholar] [CrossRef]
- Zeiser, F.A.; da Costa, C.A.; Zonta, T.; Marques, N.M.C.; Roehe, A.V.; Moreno, M.; Righi, R.d.R. Segmentation of Masses on Mammograms Using Data Augmentation and Deep Learning. J. Digit. Imaging 2020, 33, 858–868. [Google Scholar] [CrossRef] [PubMed]
- de la Rosa, F.L.; Gómez-Sirvent, J.L.; Sánchez-Reolid, R.; Morales, R.; Fernández-Caballero, A. Geometric transformation-based data augmentation on defect classification of segmented images of semiconductor materials using a ResNet50 convolutional neural network. Expert Syst. Appl. 2022, 206, 117731. [Google Scholar] [CrossRef]
- Deepa, N.; Chokkalingam, S. Optimization of VGG16 utilizing the Arithmetic Optimization Algorithm for early detection of Alzheimer’s disease. Biomed. Signal Process. Control. 2022, 74, 103455. [Google Scholar] [CrossRef]
- Zhu, F.; Li, J.; Zhu, B.; Li, H.; Liu, G. UAV remote sensing image stitching via improved VGG16 Siamese feature extraction network. Expert Syst. Appl. 2023, 229, 120525. [Google Scholar] [CrossRef]
- Bakasa, W.; Viriri, S. VGG16 Feature Extractor with Extreme Gradient Boost Classifier for Pancreas Cancer Prediction. J. Imaging 2023, 9, 138. [Google Scholar] [CrossRef]
- Sarker, S.; Tushar, S.N.B.; Chen, H. High accuracy keyway angle identification using VGG16-based learning method. J. Manuf. Process. 2023, 98, 223–233. [Google Scholar] [CrossRef]
- Mpova, L.; Shongwe, T.C.; Hasan, A. The Classification and Detection of Cyanosis Images on Lightly and Darkly Pigmented Individual Human Skins Applying Simple CNN and Fine-Tuned VGG16 Models in TensorFlow’s Keras API. In Proceedings of the 2023 IEEE International Conference on Computational Intelligence and Virtual Environments for Measurement Systems and Applications (CIVEMSA), Gammarth, Tunisia, 12 June 2023; pp. 1–6. [Google Scholar] [CrossRef]
- Zhang, Y.; Liu, Y.-L.; Nie, K.; Zhou, J.; Chen, Z.; Chen, J.-H.; Wang, X.; Kim, B.; Parajuli, R.; Mehta, R.S.; et al. Deep Learning-based Automatic Diagnosis of Breast Cancer on MRI Using Mask R-CNN for Detection Followed by ResNet50 for Classification. Acad. Radiol. 2023, 30, S161–S171. [Google Scholar] [CrossRef]
- Sharma, A.K.; Nandal, A.; Dhaka, A.; Zhou, L.; Alhudhaif, A.; Alenezi, F.; Polat, K. Brain tumor classification using the modified ResNet50 model based on transfer learning. Biomed. Signal Process. Control. 2023, 86, 105299. [Google Scholar] [CrossRef]
- Lee, J.-R.; Ng, K.-W.; Yoong, Y.-J. Face and Facial Expressions Recognition System for Blind People Using ResNet50 Architecture and CNN. J. Informatics Web Eng. 2023, 2, 284–298. [Google Scholar] [CrossRef]
- Hossain, B.; Iqbal, S.H.S.; Islam, M.; Akhtar, N.; Sarker, I.H. Transfer learning with fine-tuned deep CNN ResNet50 model for classifying COVID-19 from chest X-ray images. Informatics Med. Unlocked 2022, 30, 100916. [Google Scholar] [CrossRef]
- Brain Tumor Classification (MRI). Available online: https://www.kaggle.com/datasets/sartajbhuvaji/brain-tumor-classification-mri/data (accessed on 4 May 2024).
- Krishnapriya, S.; Karuna, Y. Pre-trained deep learning models for brain MRI image classification. Front. Hum. Neurosci. 2023, 17, 1150120. [Google Scholar] [CrossRef] [PubMed]
- Gore, D.V.; Sinha, A.K.; Deshpande, V. Automatic CAD System for Brain Diseases Classification Using CNN-LSTM Model. In Proceedings of the Emerging Technologies in Data Mining and Information Security. Advances in Intelligent Systems and Computing; Springer: Singapore, 2023; pp. 623–634. [Google Scholar] [CrossRef]
- Saadi, S.B.; Sarshar, N.T.; Ranjbarzadeh, R.; Forooshani, M.K.; Bendechache, M. Investigation of Effectiveness of Shuffled Frog-Leaping Optimizer in Training a Convolution Neural Network. J. Heal. Eng. 2022, 2022, 1–11. [Google Scholar] [CrossRef] [PubMed]
- Mirjalili, S.; Lewis, A. The Whale Optimization Algorithm. Adv. Eng. Softw. 2016, 95, 51–67. [Google Scholar] [CrossRef]
- Fathollahi-Fard, A.M.; Hajiaghaei-Keshteli, M.; Tavakkoli-Moghaddam, R. Red deer algorithm (RDA): A new nature-inspired meta-heuristic. Soft Comput. 2020, 24, 14637–14665. [Google Scholar] [CrossRef]


| Hyperparameters | Description | Best Value |
|---|---|---|
| Universe Size | Number of solutions in the population | 30 |
| Wormhole Existence Probability (WEP) | Probability of wormholes’ appearance | 0.6 |
| Travelling Distance Rate (TDR) | How far a wormhole can alter a solution | 0.4 |
| Max/Min WEP | Bounds the occurrence of wormholes | Max: 1.0, Min: 0.2 |
| Max/Min TDR | Limits the modification extent by the wormholes | Max: 1.0, Min: 0.4 |
| Index | Augmentation Method | Description | Used in Study | Suggested Values by MVO Optimizer |
|---|---|---|---|---|
| 1 | Rotation range | Random rotation within a specified range of degrees. | Yes | 10 |
| 2 | Width Shifting range | Random horizontal shift. | Yes | 0.1 |
| 3 | Height Shifting range | Random vertical shift. | Yes | 0.1 |
| 4 | Shear range | Random shearing. | Yes | 0.1 |
| 5 | Brightness range | Random brightness adjustments. | Yes | [0.5…1.5] |
| 6 | Horizontal Flip | Random horizontal flipping. | Yes | True |
| 7 | Vertical Flip | Random vertical flipping. | Yes | True |
| 8 | Zoom range | Random zooming into the images. | Yes | 0.1 |
| 9 | Channel Shift * | Random channel shifting. | No | - |
| 10 | Fill Mode * | Method for filling points outside the boundaries of the input. | No | - |
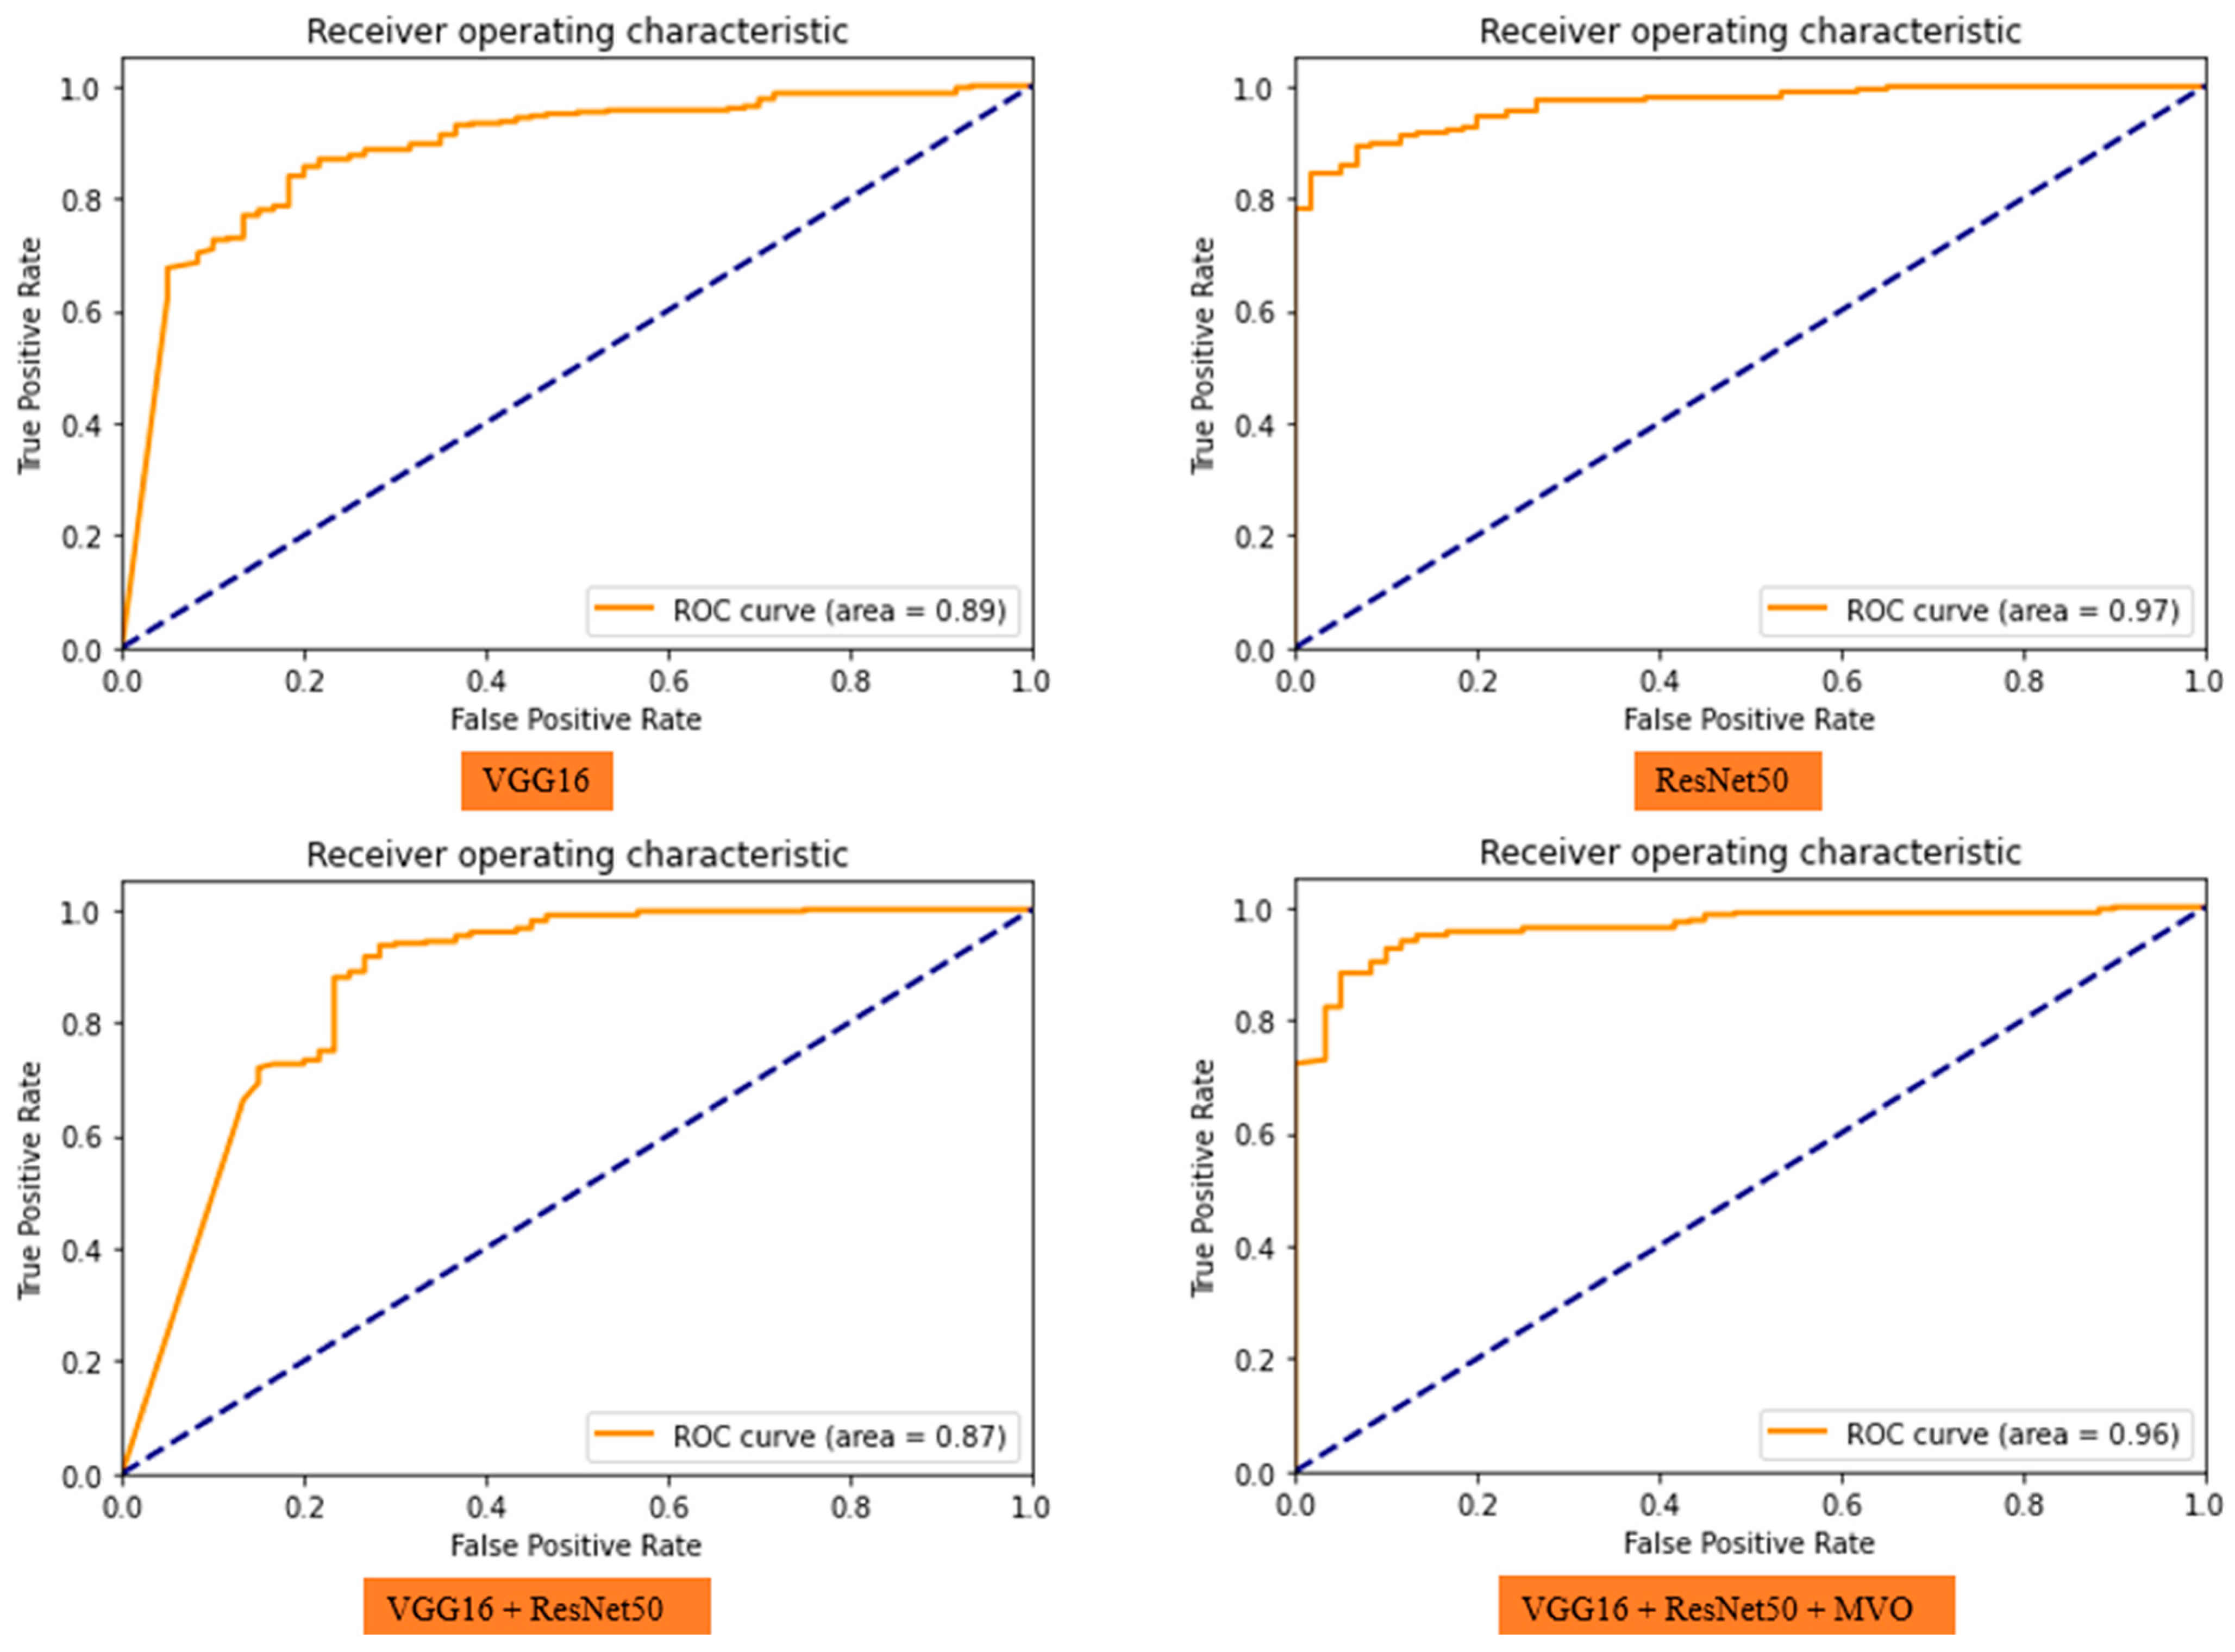
| Data | Model | Accuracy (%) | Precision (%) | Recall (%) | Run Results |
|---|---|---|---|---|---|
| Validation | VGG16 | 89 | 91 | 96 |  |
| Test | 88 | 92 | 94 | ||
| Validation | ResNet50 | 92 | 95 | 96 |  |
| Test | 92 | 96 | 94 | ||
| Validation | VGG16 + ResNet50 | 92 | 93 | 98 |  |
| Test | 89 | 92 | 96 | ||
| Validation | VGG16 + ResNet50 + MVO | 93 | 97 | 95 |  |
| Test | 94 | 97 | 96 |


Disclaimer/Publisher’s Note: The statements, opinions and data contained in all publications are solely those of the individual author(s) and contributor(s) and not of MDPI and/or the editor(s). MDPI and/or the editor(s) disclaim responsibility for any injury to people or property resulting from any ideas, methods, instructions or products referred to in the content. |
© 2024 by the authors. Licensee MDPI, Basel, Switzerland. This article is an open access article distributed under the terms and conditions of the Creative Commons Attribution (CC BY) license (https://creativecommons.org/licenses/by/4.0/).
Share and Cite
Sarshar, N.T.; Sadeghi, S.; Kamsari, M.; Avazpour, M.; Ghoushchi, S.J.; Ranjbarzadeh, R. Advancing Brain MRI Image Classification: Integrating VGG16 and ResNet50 with a Multi-Verse Optimization Method. BioMed 2024, 4, 499-523. https://doi.org/10.3390/biomed4040038
Sarshar NT, Sadeghi S, Kamsari M, Avazpour M, Ghoushchi SJ, Ranjbarzadeh R. Advancing Brain MRI Image Classification: Integrating VGG16 and ResNet50 with a Multi-Verse Optimization Method. BioMed. 2024; 4(4):499-523. https://doi.org/10.3390/biomed4040038
Chicago/Turabian StyleSarshar, Nazanin Tataei, Soroush Sadeghi, Mohammadreza Kamsari, Mahrokh Avazpour, Saeid Jafarzadeh Ghoushchi, and Ramin Ranjbarzadeh. 2024. "Advancing Brain MRI Image Classification: Integrating VGG16 and ResNet50 with a Multi-Verse Optimization Method" BioMed 4, no. 4: 499-523. https://doi.org/10.3390/biomed4040038
APA StyleSarshar, N. T., Sadeghi, S., Kamsari, M., Avazpour, M., Ghoushchi, S. J., & Ranjbarzadeh, R. (2024). Advancing Brain MRI Image Classification: Integrating VGG16 and ResNet50 with a Multi-Verse Optimization Method. BioMed, 4(4), 499-523. https://doi.org/10.3390/biomed4040038