Abstract
The coronavirus pandemic overwhelmed many countries and their healthcare systems. Shortage of testing kits and Intensive-Care-Unit (ICU) beds for critical patients have become a norm in most developing countries. This has prompted the need to rapidly identify the COVID-19 patients to stop the spread of the virus and also to find critical patients. The latter is imperative for determining the state of critically ill patients as quickly as possible. This will lower the number of deaths from the infection. In this paper, we propose a cloud-based smartphone application for the early prognosis of COVID-19 infected patients and also predict their mortality risk using their symptoms. Moreover, we heuristically identified the most important symptoms necessary for making such predictions. We have successfully reduced the number of features by almost half for the prognosis and by more than a third for forecasting the mortality risk, compared to the contemporary studies. The application makes the real-time analysis using machine learning models, designed and stored in the cloud. Our machine learning model demonstrates an accuracy, precision, recall, and F1 score of 97.72%, 100%, 95.55%, and 97.70%, respectively, in identifying the COVID-19 infected patients and with an accuracy, precision, recall, and F1 score of 90.83%, 88.47%, 92.94%, and 90.65%, respectively, in forecasting the mortality risk from the infection. The real-time cloud-based approach yields faster responses, which is critical in the time of pandemic for mitigating the infection spread and aiding in the efficient management of the limited ICU resources.
Keywords:
COVID-19; SARS-CoV-2; symptoms; machine learning; smartphone application; telehealthcare; prognosis; mortality; ICU 1. Introduction
After being first reported in December 2019, severe acute respiratory syndrome coronavirus 2 (SARS-CoV-2) has claimed over 4.9 million lives as of 1 November 2021 [1]. The primary spread of SARS-CoV-2 occurs from droplets of saliva or the discharge from the nose when an infected person coughs. The symptoms in SARS-CoV-2 patients range from mild to severe, while individuals with comorbidities show a higher likelihood of having severe symptoms [2]. Early testing and subsequent isolations are of immense importance to stop the spread of SARS-CoV-2 and to lower the number of deaths from the infection. With the lockdown in place, a massive increase in telehealth services has been observed [3].
With a scarcity of costly testing kits, especially in developing countries, there is an immediate need for a low-cost solution, which must be easily scalable and deployable for widespread diagnostics. Machine Learning (ML)-based solution promises to bridge this gap by providing accurate predictions which can be made available remotely. From the onset of the pandemic, researchers focused on identifying positive COVID-19 patients from the XRay images [4,5,6,7]. Unfortunately, a recent extensive study demonstrated the lacking potential of this technique for clinical use, ascribing methodological flaws and/or underlying biases [8]. Alternatively, COVID-19 detection from the parametric deviations in the immunological and hematological profile of an infected patient is also explored using communally available routine blood tests. Nonetheless, a rapid, low-cost, and scalable option would be ideal in the time of a pandemic [9].
Once infected, the initial symptoms, a direct manifestation of the infection, begin to appear as early as a few days. The symptoms range from fever, which is general for many respiratory viral infections, to some very distinct signatures of the coronavirus infection, such as dry cough. An early prognosis of the infection is crucial for limiting the communal spread and keeping the number of infected to a minimum. This inspired many research works in diagnosing the COVID-19 infected patients using the symptoms [10,11,12]. Moreover, this idea extended into predicting the mortality risk of critically infected patients from their symptoms [13,14]. This can significantly reduce the number of deaths from the infection by providing the necessary healthcare beforehand. Additionally, it aims to efficiently utilize the ICU resources for patients who need them, especially in the limited hospitalized settings. Despite numerous researches using multiple symptoms, the important ones for successful predictions are not yet narrowed down, and, more crucially, these concepts need to be translated into practical applications, available to the end-user.
To stop the spread of COVID-19, early identification of COVID-19 patients is crucial. That is why we considered patient symptoms as the learning attributes for our machine learning algorithms. Using a machine learning-based smartphone application, patients can easily do an early self- prognosis before receiving the actual test results. This might lead to early quarantine measures and an overall decrease in COVID-19 spread. A smartphone application also provides a more cost-effective and scalable method for the initial prognosis of COVID-19 patients.
In many parts of the globe, shortages in hospital beds for COVID-19 patients are a massive cause for concern. To alleviate some of this concern, we can predict the probable mortality risk of a patient, giving a doctor some idea of which patients are more likely to develop critical symptoms down the line. Using symptoms in this regard also allows a quick non-invasive way to allow early identification of high-risk COVID-19 patients.
In this study, we propose and present a cloud-based smartphone application platform that uses ML, with symptoms as inputs, to predict if a patient is SARS-CoV-2 positive or negative. This can be used by the users immediately when the initial symptoms appear. The smartphone application can also forecast the mortality risk of critically ill patients, which will help identify beforehand which patients might need ICU care. Moreover, we have heuristically identified the most important symptoms necessary for making such predictions. The application makes this real-time analysis using machine learning models, designed and stored in the cloud. The communication between the cloud server and the smartphone application takes place over the internet. The real-time cloud-based self-diagnostic approach provides a potential telehealthcare solution for mitigating the infection spread and aid in efficient ICU resource management. The smartphone approach provides scalability, and the symptoms dependency presents a cost-free prognosis for people to get an initial idea of their condition, which is ideal in the time of a pandemic.
Literature Review
Here, we summarize the studies that obtained relatively high prediction accuracies. Related work using symptoms to identify COVID-19 patients is given in Table 1, and Table 2 presents the research works for mortality risk prediction using symptoms. The studies conducted used separate datasets with varying symptoms. It can be observed that the prediction quality significantly varies over the studies reported here, which is a reflection of the list of symptoms considered in the studies. Therefore, it is essential to narrow down the most important set of symptoms for making successful diagnostic and mortality risks predictions. SVM seems to be a popular algorithm in this theme of study, while age and sex are the most common features available in all the datasets. We tried to find related works with the highest model performance primarily based on accuracy which used patient symptoms as their input. It is important to note that none of the studies mentioned here considered both prognosis and mortality risk predictions at the same time.

Table 1.
Summary of research works for COVID-19 prognosis using symptoms.
Villavicencio et al. [10] using 20 features achieved an accuracy of 98.81% in predicting if a patient is COVID-19 positive or negative. Zoabi et al. [11], using data from the Israeli ministry of health which contained 99,232 samples, proposed a model to detect COVID-19 patients from 8 symptom-based features. The model had an AUC score of 0.90 and a confidence interval of 95%, with sensitivity around, 86% and specificity around 79%. Shams et al. [12], using 5 symptom-based features, obtained an accuracy of 77.59%, with precision and recall being 74% and 84%, respectively. Martinez-Velazquez et al. [13] obtained an accuracy of 68.4% from 14 symptom-based features.
For mortality prediction, Doyle et al. [14] achieved an accuracy of 92% using a Random Forest Classifier from 212 samples. Pourhomayoun et al. [15], using 57 features from 307,382 samples, achieved a maximum accuracy of 90%. The attributes used were primarily symptoms and some pre-existing conditions of the patients. Wollenstein-Betech et al. [16], from 20,737 samples (COVID-19 positive cases), using patient symptoms, predicted the mortality with an accuracy of 79% and an AUC score of 0.63. Adib et al [17] predicted Covid-19 mortality among pregnant women with an accuracy of 95%.
COVID-19 prediction and patient mortality prediction have been made on many specific biomarkers and blood tests [18,19,20]. However, our focus in this study is to provide an instant and easy method to give an early result for both cases. Thus, contemporary studies based primarily on the non-invasive patient symptoms are discussed above.
Table 2.
Summary of research works for mortality risk prediction using symptoms.
Table 2.
Summary of research works for mortality risk prediction using symptoms.
| Dataset | Algorithms | Features | Samples | Accuracy |
|---|---|---|---|---|
| [14] | Random Forest | 7 | 212 | 92% |
| [15] | ANN, KNN, SVM RF, LR, and DT | 57 | 307,382 | 90–87% |
| [16] | LR | 13 | 20,737 | 79% |
| [21] | GB, Coxnet, CoxPh, and SVM (radial kernel) | 2 (Age and Sex) | 1182 | 71% |
| [21] | IPCRidge | 2 (Age and Sex) | 1182 | 49.05% |
2. Materials and Methods
This section presents the chronological sequence of our study to design the ML algorithms and also describes the working principle of the smartphone application for successful COVID-19 test and mortality risk predictions. Figure 1 gives an overview of the study.
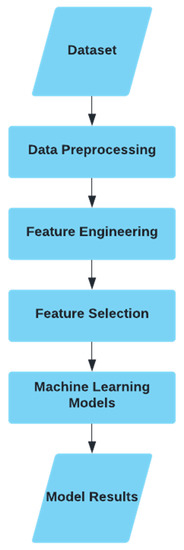
Figure 1.
Workflow of the study.
2.1. Dataset
In this study, two separate datasets were used. We predicted the COVID-19 infection possibility using the dataset available at Kaggle [22], and the mortality risk was forecasted using the Martinez-Velazquez et al. dataset [13].
The Kaggle dataset contains 5434 samples collected from 17 April 2020 to 29 August 2020. Its sources are the World Health Organization and the All India Institute of Medical Sciences (AIIMS). The dataset contains 20 different symptom-based attributes, from which we have heuristically selected 12.
The Martinez-Velazquez et al. dataset was collected from the public health systems in Mexico. In the original study, the authors predicted the possibility of COVID-19 patients. However, we used the same dataset to predict the mortality risk of COVID-19 infected patients using the time of death attribute available in the dataset. The initial dataset contains 10,722 samples, with each sample representing a particular patient.
We dropped all irrelevant features and unlabeled data points from both datasets. To create a reliable ML model, we replaced the missing inputs using the K-Nearest Neighbors (KNN) imputation technique. KNN imputes the missing value with the mean value of K nearest neighbors from the training set and uses the Euclidean distance metric. Categorical features present in the datasets, e.g., textual data, were converted into numeric values using the one-hot encoding, which assumes no natural ordering between the categories. All the features were scaled using the standard scalar method. Both the datasets had some sort of imbalance in the target class. The equilibrium was reached using the well-known Synthetic Minority Oversampling Technique (SMOTE), which synthetically generates samples from the minority class to create the balance.
2.2. Feature Extraction
The presence of multicollinearity in the datasets makes it difficult to differentiate the impact of individual features. This significantly reduces the performance of machine learning algorithms. To circumvent the multicollinearity problem and identify the essential symptoms, we heuristically selected a list of 12 and 13 features for predicting the COVID-19 infection and mortality risk, respectively. These are illustrated in Table 3.
Table 3.
Essential symptoms used in this study.
2.3. Algorithms and Evaluation Methods
In our study, we have used Xgboost, KNN, Random Forest, and an artificial neural network.
2.3.1. Random Forest (RF)
The Random Forest classifier is an ensemble of decision trees. Each decision tree individually comes to a conclusion using a divide and conquer approach. The decision trees combined provide the final output for the Random Forest classifier [23].
2.3.2. K-Nearest Neighbor (KNN)
K-nearest neighbor works on the principle that data points on a class will fall in close proximity to each other. The Euclidian distance is a common metric to identify this proximity between data points. By setting the value of K, which is the number of nearest neighbors, the algorithm can classify an unknown data point with its intended class [24].
2.3.3. Extreme Gradient Boosting (XGBoost)
Extreme Gradient Boosting or XGBoost is a generalized tree boosting ensemble method built on combining weak learners. XGBoost iteratively builds on the errors of its previous weak learner by minimizing its loss function using gradient descent [25].
2.3.4. Artificial Neural Network (ANN)
Artificial neural networks try to find patterns in the training data by backpropagation. The neurons in an artificial neural network change their weights, update their loss function by comparing its initial output and the labeled data, and try to find a solid pattern between the input and output data [26].
2.3.5. Evaluation Metrics
To evaluate our machine learning models, we have used accuracy, precision, recall, F1 score, and the ROC curve. Accuracy gives us the rate of correct predictions given by our model, the precision scores true positive rate compared with the total positive identified by our model, and the recall score gives us the true positive rate against the total number of positive instances, while the F1 score gives us a balance between precision and recall. Equations (1)–(4) gives us the equations for accuracy, precision, recall and F1 score respectively
ROC gives us the tradeoff between sensitivity and specificity, while AUC gives us an aggregate between all performance measures [27]:
2.4. Machine Learning Models
In this paper, we proposed two separate blending ensemble models, capable of diagnosing COVID-19 infection and forecasting mortality risk with high accuracy. Blending ensemble learning works by using the dataset as the input to the base learners. The base learners separately provide outputs that act as inputs to the meta learner. The output provided by the meta learner is the final outcome of the model. Blending ensemble learning is fitted with the holdout dataset rather than the out-of-fold predictions made by the base learners [28]. The integrated approach can provide a gain in the performance metrics.
Our models have a 2-layer architecture with the initial layer made of 3 base learners: KNN, Random Forest, and XGBoost. In the second layer, one model uses the Random Forest classifier as the meta learner, and the other uses the Artificial Neural Network (ANN). The ensemble architectures is illustrated by Figure 2a.

Figure 2.
(a) Proposed blending ensemble ML model for both the datasets. (b) Implementation of the proposed ANN for both datasets.
Hyperparameter Tunning on Our Models
Each of our base learners was tuned using the Bayesian hyperparameter optimization technique, which is extremely fast and is based on the Bayes theorem [29].
Using the Bayesian hyperparameter technique for the COVID-19 prognosis dataset, we calibrated the KNN algorithm, with n neighbors = 10, metric = “minkowski”. For the Random Forest, base learner criterion was set to ‘gini’, max depth = 910, Min Sample leaf = 0.005866085931968656, min samples split = 0.1093978469162935, with n estimators = 10. The XGboost Base learner parameters are as follows with n estimators = 15, max depth = 15, subsample = 0.7, gamma = 6.951458033961313, min child weight = 9, reg alpha = 136, reg lambda = 0.8971111363810979, and colsample bytree = 0.5151996087567898.
For the mortality risk dataset, we tuned the KNN with KNN with n neighbors = 5 and metric = “Minkowski”. The Random Forest base learner criterion was set to ‘entropy’, max depth = 1000, Min Sample leaf = 2, min samples split = 3, with n estimators = 100. For the XGboost Base learner, the parameters are as follows: booster = ‘gbtree’, n estimators = 28, max depth = 6, subsample = 0.7,gamma = 0.25, min_child_weight = 1,reg alpha = 0, reg lambda = 45, and colsample bytree = 0.9.
For both of our datasets, we propose a random forest meta learner and an ANN meta learner. The model with the meta learner as Random Forest has parameters n estimators = 250, criterion = ‘gini’. The ANN in our implementation has 2 hidden layers, with 8 neurons in the first hidden layer and 4 neurons in the second hidden layer, as shown in Figure 2b. The activation function is set as ‘relu’ in both of the hidden layers, with ‘sigmoid’ set as the activation function in the output layer.
2.5. Working Procedure of the Smartphone Application
The possible options are given in the application user interface, where users may use checkboxes to select the symptoms they have. The age parameter has to be typed in. The values are then compiled in a list of binary values. After the user inputs all the symptoms and presses the predict button, the application converts the binary inputs into a JSON file. The JSON file is sent to the cloud where our pre-trained ML model is stored. The ML model predicts using the inputs and sends the answer back to the smartphone application. Depending on whether the user wants to predict the mortality or the COVID-19 status, the corresponding machine learning model will be used in the cloud. The entire procedure happens in real-time.
3. Results and Discussions
Once all the data is preprocessed and the essential features identified, it is then served as the input into the designed ensemble algorithms. By heuristic optimization, we report here the minimum parameters essential for predicting the COVID-19 infection and mortality risk with accuracies beyond 90%. We have successfully reduced the number of features by almost half for the prognosis and by more than a third for forecasting the mortality risk, compared to the contemporary studies.
The symptoms importance for the COVID-19 infection and mortality risk predictions are illustrated by Figure 3a,b, respectively. It can be observed that sore throat, breathing problem, dry cough, and fever are among the most significant symptoms in the prognosis of the disease. Other important parameters are related to the possible level of close proximity exposure with other human beings, such as traveling abroad, public gathering, etc. For mortality, there are additional parameters associated with other diseases, e.g., diabetes, chronic kidney disease, etc. The most important feature is the type of patient (ambulatory or hospitalized), which suggests that the mortality risk is high when patients are hospitalized with symptoms that are also common for detecting the viral infection. Age, pneumonia, and dyspnea also show a high correlation with mortality. Both pneumonia and dyspnea occur due to problems with the lungs, so, from our study, we can imply that patients who are COVID-19 positive with breathing-related issues are more likely to be in a life-threatening position. In this case, also, possible contact with a COVID-19 infected person is one of the essential parameters.
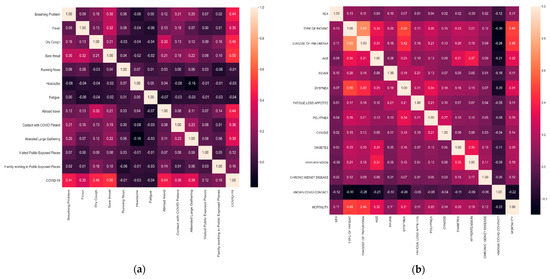
Figure 3.
(a) Correlation matrix of the selected features for COVID-19 prognosis. (b) Correlation matrix of the selected features for mortality risk prediction.
We have proposed a single model which can be used for both COVID-19 prognosis and mortality risk prediction. This shows certain robustness in our model to cope with different datasets in the future. The performance of the base learners and meta learners in our model differ only slightly but show minor improvements in terms of accuracy. Using the 5*2 Cross-validation paired t-test we have statistically significant improvement in the mortality prediction from the performance of the base learners to the entire ensemble learning model. The 5*2 Cross-validation paired t-test [30] works by splitting the dataset into two (training and testing) and repeating the split 5 times; we then compute the performance in each of the 5 iterations. The training and testing data are also switched with each other, which gives us two different performance results. From this, the variance of difference is measured, and the t-statistic value is computed. Comparing the KNN base learner and the entire ensemble model, we get a p-value of 0.002 and a t-statistic score of 5.6. Furthermore, comparing the Random Forest base learner with the entire ensemble learning model, we get a p-value of 0.012 and a t-statistic score of 3.82. Finally, comparing the XGboost model with the entire ensemble model, we have a p-value of 0.001 and a t-statistic score of 7.70. However, in the COVID-19 prognosis dataset, the p-values are all over 0.05, which leads us to conclude that there is no statistically significant improvement from the base learners compared to the entire ensemble model in terms of performance.
The prediction performances for COVID-19 prognosis and mortality risk are illustrated in Table 4. We have used Accuracy, Precision, Recall, F1 score, and AUC as our primary indicators in selecting which algorithms to use. Our designed ensemble architectures perform the same with the RF and ANN meta learners. This highlights the importance of the algorithm combinations as the base learner. With an appropriate selection, the blended ensemble ML structure performs with the same quality of outcome under various meta learner algorithms, which shows the immense flexibility of our approach.
Table 4.
Prediction performance of the designed ensemble ML models.
From Table 4, we see that our algorithm can diagnose COVID-19 infection with an accuracy, precision, recall, and F1 score of 97.72%, 100%, 95.55%, and 97.72%, respectively. In addition, the ML classifier can distinguish between the positive and negative cases with an accuracy of 98%, which is computed from the area under the sensitivity versus recall curve. Moreover, the perfect precision score signifies the fact that our algorithm can successfully identify all the positive cases. This is imperative in reducing the spread of the virus. Our model can forecast the mortality risk with an accuracy, precision, recall, and F1 score of 90.83%, 88.47%, 92.94%, and 90.65%, respectively. The ML classifier can distinguish between the survival and fatality cases with an accuracy of 89%.
For COVID-19 prognosis, our model performance is only surpassed by the model proposed by Villavicencio et al. [10]. Our model used 7 fewer features than the aforementioned study due to its primary premise of use on a smartphone, minimizing the total amount of features required to compensate for the slight decrease in performance.
Comparing our results against other symptom-based mortality prediction studies, we see our model performance is superior to the majority of studies. Doyle et al. [14] proposed a model which beats our accuracy of 90.83% by a slight margin, but that study was conducted on just 212 samples.
Figure 4a shows the user interface of the proposed smartphone application. The application uses the machine learning models uploaded to the cloud and gives real-time predictions to the users. For convenience, most of the options are given in the yes/no pattern, meaning users can select the available symptoms. Figure 4b illustrates the output interface of our application, which shows the possibility of contracting the COVID-19 infection and the mortality chances.

Figure 4.
(a) User input interface of the smartphone application for COVID-19 infection and mortality risk predictions. (b) Output interface of the smartphone application.
Our study is based on fixed datasets, meaning the machine learning models’ effectiveness in other datasets might differ [31]. This is a limitation of our study as it is not incorporating active learning. Further studies are encouraged to try and apply more datasets to generalize the models for COVID-19 detection and mortality prediction.
The primary purpose of our study is to provide a fast and easy method to identify COVID-19 patients and their mortality rates so that initial action can be taken based on these results. Our mobile application is not meant to replace actual prognosis tests, such as RT-PCR tests, but to give users a basic idea so that they can take preventive measures in the meantime before getting actual confirmation. The mortality prediction can only help the healthcare practitioners in sorting ICU care for patients, not override their judgment. Further studies to incorporate more datasets, even active learning, might yield better results in the future. The symptoms selected in our paper can be used as a starting point in identifying which symptoms share a higher correlation with COVID-19 prognosis and mortality in further studies.
4. Conclusions
In this study, we propose and present a cloud-based smartphone application platform that uses ML to predict the COVID-19 infection and forecast the mortality risk using symptoms and other physical parameters. The signs of the infection, which is a direct manifestation of the virus, start to appear within a few days of the contraction. This can be used by the users immediately, once they start to appear. After, thorough heuristic optimization, we identified the most important symptoms necessary for making such predictions. We have successfully reduced the number of features by almost half for the prognosis and by more than a third for forecasting the mortality risk, compared to the contemporary studies. Our machine learning models demonstrate an accuracy, precision, recall, and F1 score of 97.72%, 100%, 95.55%, and 97.70%, respectively, in identifying the COVID-19 infected patients and with an accuracy, precision, recall, and F1 score of 90.83%, 88.47%, 92.94%, and 90.65%, respectively, in forecasting the mortality risk from the infection. The perfect precision score signifies the fact that our algorithm can successfully identify all the positive cases. This is imperative in reducing the spread of the virus. The application makes this real-time analysis using machine learning models, designed and stored in the cloud. The communication between the cloud server and the smartphone application takes place over the internet. The real-time cloud-based self-diagnostic approach provides a potential telehealthcare solution for mitigating the infection spread and can aid beforehand the patients who might need ICU care, lowering the fatality rate. The smartphone approach provides scalability and the symptoms dependency presents a cost-free prognosis in assisting patients and health practitioners, which is ideal in the time of the pandemic.
Author Contributions
Conceptualization, A.B.S.; Data curation, O.M.; Formal analysis, O.M. and A.B.S.; Investigation, M.M.S.R.; Methodology, M.M.S.R.; Project administration, A.B.S.; Software, R.B.P.; Supervision, A.B.S.; Visualization, R.B.P. and F.F.; Writing—original draft, O.M. and A.B.S.; Writing—review & editing, A.B.S. and O.M. All authors have read and agreed to the published version of the manuscript.
Funding
This research received no external funding.
Institutional Review Board Statement
Not applicable.
Informed Consent Statement
Not applicable.
Data Availability Statement
Not applicable.
Conflicts of Interest
The authors declare no conflict of interest.
References
- WHO. Who Coronavirus Disease (COVID-19) Dashboard. Available online: https://COVID19.who.int (accessed on 11 January 2021).
- Ejaz, H.; Alsrhani, A.; Zafar, A.; Javed, H.; Junaid, K.; Abdalla, A.E.; Abosalif, K.O.; Ahmed, Z.; Younas, S. COVID-19 and comorbidities: Deleterious impact on infected patients. J. Infect. Public Health 2020, 13, 1833–1839. [Google Scholar] [CrossRef] [PubMed]
- Davenport, T.; Kalakota, R. The potential for artificial intelligence in healthcare. Future Healthc. J. 2019, 6, 94–98. [Google Scholar] [CrossRef] [PubMed] [Green Version]
- Rousan, L.A.; Elobeid, E.; Karrar, M.; Khader, Y. Chest X-ray findings and temporal lung changes in patients with COVID-19 pneumonia. BMC Pulm. Med. 2020, 20, 1–9. [Google Scholar] [CrossRef] [PubMed]
- Cleverley, J.; Piper, J.; Jones, M.M. The role of chest radiography in confirming COVID-19 pneumonia. BMJ 2020, 370, m2426. [Google Scholar] [CrossRef]
- Rahaman, M.M.; Li, C.; Yao, Y.; Kulwa, F.; Rahman, M.A.; Wang, Q.; Qi, S.; Kong, F.; Zhu, X.; Zhao, X. Identification of COVID-19 samples from chest X-ray images using Deep learning: A comparison of trans-fer learning approaches. J. X-ray Sci. Technol. 2020, 28, 821–839. [Google Scholar] [CrossRef] [PubMed]
- Wang, L.; Lin, Z.Q.; Wong, A. COVID-net: A tailored deep convolutional neural net-work design for detection of COVID-19 cases from chest X-ray images. Sci. Rep. 2020, 10, 19549. [Google Scholar] [CrossRef]
- Roberts, M.; Driggs, D.; Thorpe, M.; Gilbey, J.; Yeung, M.; Ursprung, S.; Aviles-Rivero, A.I.; Etmann, C.; McCague, C.; Beer, L.; et al. Common pitfalls and recommendations for using machine learning to detect and prognosticate for COVID-19 using chest radiographs and CT scans. Nat. Mach. Intel. 2021, 3, 199–217. [Google Scholar] [CrossRef]
- Raihan, M.; Khan, M.; Akter, L.; Shams, A. Development of Risk-Free COVID-19 Screening Algorithm from Routine Blood Test using Ensemble Machine Learning. arXiv 2021, arXiv:2108.05660. [Google Scholar]
- Villavicencio, C.; Macrohon, J.; Inbaraj, X.; Jeng, J.; Hsieh, J. COVID-19 Prediction Applying Supervised Machine Learning Algorithms with Comparative Analysis Using WEKA. Algorithms 2021, 14, 201. [Google Scholar] [CrossRef]
- Zoabi, Y.; Deri-Rozov, S.; Shomron, N. Machine learning-based prediction of COVID-19 diagnosis based on symptoms. Npj Digit. Med. 2021, 4, 1–5. [Google Scholar] [CrossRef] [PubMed]
- Shams, A.; Raihan, M.; Khan, M.; Preo, R.; Monjur, O. Telehealthcare and COVID-19: A Noninvasive & Low Cost Invasive, Scalable and Multimodal Real-Time Smartphone Application for Early Diagnosis of SARS-CoV-2 Infection. arXiv 2021, arXiv:2109.07846. [Google Scholar]
- Martinez-Velazquez, R.; Tobón, V.D.P.; Sanchez, A.; El Saddik, A.; Petriu, E. A Machine Learning Approach as an Aid for Early COVID-19 Detection. Sensors 2021, 21, 4202. [Google Scholar] [CrossRef] [PubMed]
- Doyle, R. Machine Learning–Based Prediction of COVID-19 Mortality With Limited Attributes to Expedite Patient Prognosis and Triage: Retrospective Observational Study. JMIRx Med. 2021, 2, e29392. [Google Scholar] [CrossRef]
- Pourhomayoun, M.; Shakibi, M. Predicting mortality risk in patients with COVID-19 using ML to help medical decision-making. Smart Health 2021, 20, 100178. [Google Scholar] [CrossRef]
- Wollenstein-Betech, S.; Cassandras, C.; Paschalidis, I. Personalized predictive models for symptomatic COVID-19 patients using basic preconditions: Hospitalizations, mortality, and the need for an ICU or ventilator. Int. J. Med. Inform. 2020, 142, 104258. [Google Scholar] [CrossRef]
- Adib, Q.; Tasmi, S.; Bhuiyan, M.; Raihan, M.; Shams, A. Prediction Model for Mortality Analysis of Pregnant Women Affected with COVID-19. Available online: http://arxiv-export-lb.library.cornell.edu/abs/2111.11477 (accessed on 24 November 2021).
- Mahdavi, M.; Choubdar, H.; Zabeh, E.; Rieder, M.; Safavi-Naeini, S.; Jobbagy, Z.; Ghorbani, A.; Abedini, A.; Kiani, A.; Khanlarzadeh, V.; et al. A machine learning based exploration of COVID-19 mortality risk. PLoS ONE 2021, 16, e0252384. [Google Scholar] [CrossRef] [PubMed]
- AlJame, M.; Imtiaz, A.; Ahmad, I.; Mohammed, A. Deep forest model for diagnosing COVID-19 from routine blood tests. Sci. Rep. 2021, 11. [Google Scholar] [CrossRef]
- Du, R.; Tsougenis, E.; Ho, J.; Chan, J.; Chiu, K.; Fang, B.; Ng, M.; Leung, S.; Lo, C.; Wong, H.; et al. Machine learning application for the prediction of SARS-CoV-2 infection using blood tests and chest radiograph. Sci. Rep. 2021, 11, 14250. [Google Scholar] [CrossRef] [PubMed]
- Nemati, M.; Ansary, J.; Nemati, N. Machine-Learning Approaches in COVID-19 Survival Analysis and Discharge-Time Likelihood Prediction Using Clinical Data. Patterns 2020, 1, 100074. [Google Scholar] [CrossRef]
- Kaggle. Symptoms and COVID Presence, 18 August 2020. Available online: https://www.kaggle.com/hemanthhari/symptomsand-covid-presence/metadata (accessed on 27 November 2021).
- Breiman, L. Random Forests. Mach. Learn. 2001, 45, 5–32. [Google Scholar] [CrossRef] [Green Version]
- Peterson, L.E. K-nearest neighbor. Scholarpedia 2009, 4, 1883. [Google Scholar] [CrossRef]
- Chen, T.; Guestrin, C. XGBoost. In Proceedings of the 22nd ACM SIGKDD International Conference on Knowledge Discovery and Data Mining, San Francisco, CA, USA, 13–17 August 2016. [Google Scholar] [CrossRef] [Green Version]
- Chollet, F. Deep Learning with Python; Manning: Shelter Islands, NY, USA, 2018. [Google Scholar]
- Bradley, A. The use of the area under the ROC curve in the evaluation of machine learning algorithms. Pattern Recognit. 1997, 30, 1145–1159. [Google Scholar] [CrossRef] [Green Version]
- Tiwari, A.; Prakash, A. Improving classification of J48 algorithm using bagging, boosting and blending ensemble methods on SONAR dataset using WEKA. Int. J. Eng. Technol. Res. 2014, 2, 207–209. [Google Scholar]
- Snoek, J.; Larochelle, H.; Adams, R.P. Practical bayesian optimization of machine learning algorithms. Adv. Neural Inf. Process. Syst. 2012, 25. [Google Scholar]
- Dietterich, T. Approximate Statistical Tests for Comparing Supervised Classification Learning Algorithms. Neural Comput. 1998, 10, 1895–1923. [Google Scholar] [CrossRef] [PubMed] [Green Version]
- Santosh, K. COVID-19 Prediction Models and Unexploited Data. J. Med. Syst. 2020, 44, 1–4. [Google Scholar] [CrossRef] [PubMed]
Publisher’s Note: MDPI stays neutral with regard to jurisdictional claims in published maps and institutional affiliations. |
© 2021 by the authors. Licensee MDPI, Basel, Switzerland. This article is an open access article distributed under the terms and conditions of the Creative Commons Attribution (CC BY) license (https://creativecommons.org/licenses/by/4.0/).