Article

Effect of Vitamin B2 and Vitamin E on Cancer-Related Sarcopenia in a Mouse Cachexia Model

1
Department of Molecular Pathology, Nara Medical University, 840 Shijo-cho, Kashihara 634-8521, Nara, Japan
2
Department of Rehabilitation Medicine, Nara Medical University, 840 Shijo-cho, Kashihara 634-8522, Nara, Japan
3
Department of Orthopedics, Nara Medical University, 840 Shijo-cho, Kashihara 634-8522, Nara, Japan
*
Author to whom correspondence should be addressed.
These authors contributed equally to this work.
BioMed 2021, 1(1), 50-62; https://doi.org/10.3390/biomed1010004
Submission received: 24 June 2021 / Revised: 5 August 2021 / Accepted: 13 August 2021 / Published: 1 September 2021

Abstract

:
Cancer-related sarcopenia is associated with impaired energy metabolism and increased oxidative stress production in skeletal muscles. With an aim to treat cancer-related sarcopenia using dietary intervention, we investigated the effects of vitamin B2 (VB2) and vitamin E (VE), which are recognized to have antioxidant effects, on CT26 mouse colon cancer cells and skeletal muscles in vitro and in vivo. VB2 suppressed tumor growth by suppressing cell proliferation and inducing more pronounced apoptosis by increasing the production of adenosine triphosphate (ATP) and reactive oxygen species (ROS). VE suppressed tumor growth by suppressing cell proliferation and increasing apoptosis by decreasing the production of ATP and ROS. In C2C12 mouse skeletal myoblast cells, VB2 treatment increased the production of ATP and ROS and VE treatment decreased the production of ATP and ROS; both treatments suppressed skeletal myoblast maturation. In the mouse model, intraperitoneal inoculation (peritoneal model) resulted in marked macrophage infiltration and elevated blood tumor necrosis factor-α and high-mobility group box-1 inflammatory cytokine levels, leading to cachexia. In contrast, subcutaneous inoculation (subcutaneous model) showed poor macrophage infiltration and low inflammatory cytokine levels, without cachexia. VB2 and VE activated macrophages and exacerbated cancer-related sarcopenia in the peritoneal model, whereas VB2 and VE treatment did not exhibit significant changes in sarcopenia in the subcutaneous model. In order to improve cancer-related sarcopenia by dietary intervention, it is important to consider the effect on inflammatory cytokines.

1. Introduction

Cachexia is reportedly present in 40–80% of all patients with advanced cancer [1,2] and accounts for 20–30% of all cancer-related deaths [3]. Sarcopenia, a pathognomonic factor, is one of the most important features of cachexia [4,5]. Malnutrition, increased catabolism, increased inflammatory cytokine levels, and oxidative stress are the main causes of cancer-related cachexia [6]. Furthermore, in recent years, the concept of “gut-muscle axis” has been introduced, suggesting that intestinal bacteria are involved in the development of sarcopenia through inflammation and are also an important key in its treatment [7,8].
There are various reports on the effects of vitamins on sarcopenia. The risk of sarcopenia is known to increase in individuals who do not meet the recommended intake levels of energy, riboflavin, and vitamin C [9]. The effectiveness of vitamin C and vitamin D has been reported in cancer-related sarcopenia [10,11]. In previous studies, we have shown that disorders of skeletal muscles and the myocardium in cachexia are associated with impaired energy metabolism and increased oxidative stress [12,13]. However, there are few studies on the effectiveness of vitamin B2 (VB2) and vitamin E (VE), which exhibit antioxidant effects, against cancer-related sarcopenia.
VB2, vitamin B12, calcium, and essential fatty acids in dairy products have high biological usefulness compared with other nutrients [14,15]. VB2 possesses antioxidant properties and reduces lipid peroxides and reperfusion-related oxidative stress [16]. VB2 is used to improve nutritional levels in individuals with chronic diseases and may be effective against sarcopenia [17]. Moreover, VB2 deficiency leads to increased oxidative stress and promotes carcinogenesis [16]. The VB2 derivative flavin adenine dinucleotide, which is the most commonly used riboflavin nucleotide [18], shows redox activity [19] and plays a role in the epigenetic regulation of gene expression [20,21].
VE acts as a peroxy radical scavenger that protects polyunsaturated fatty acids present in membranes and lipoproteins [22], and there are various forms of VE. α-Tocophenol, which is mainly used clinically, has a certain antioxidant effect; however, its cancer-inhibitory and cancer-preventing effects are debatable [23]. The protective effect of VE on skeletal muscles owing to its antioxidant activity is predicted to be effective in the prevention and treatment of sarcopenia [24].
Thus, VB2 and VE are expected to be effective against sarcopenia, although there is insufficient evidence for this. In a previous study, we showed that the combination of medium-chain fatty acids and glucose is effective in improving cancer-related cachexia, but we did not examine the role of nutrients such as vitamins [12,13]. Therefore, in this study, we investigated the effects of VB2 and VE using the mouse cachexia model that we established previously [12]. While VB2 is hydrophilic, VE is lipophilic, and it was expected that the difference in translocation to intracellular organelles such as mitochondria would differ in their antioxidant activity. Then, the comparison between the two vitamins is expected be relevant.
We established a cachexia model, wherein CT26 mouse colon cancer cells were inoculated into the peritoneal cavity of syngeneic BALB/c mice to study sarcopenia due to cancer-related cachexia [12]. An intraperitoneal inoculation model is often used to generate gastrointestinal and ovarian cancer models [25,26]. However, the mechanism of the effectiveness of the peritoneal inoculation model compared with that of other models in which cancer cells are inoculated into other sites remains clear. In this study, the effect of subcutaneous inoculation of CT26 cells was also examined and compared with that of the peritoneal model.

2. Materials and Methods

2.1. Cell Culture

The CT26 mouse colon cancer cell line was kindly gifted by Professor I.J. Fidler (MD Anderson Cancer Center, Houston, TX, USA). The C2C12 myoblast cell line was purchased from Public Health England (Salisbury, UK). Both cell lines were cultured in Dulbecco’s modified Eagle’s medium (DMEM; Wako Pure Chemical Industries, Ltd., Osaka, Japan) supplemented with 10% fetal bovine serum (Sigma-Aldrich Chemical Co., St. Louis, MO, USA). Cells were treated with VB2 (50 μg/mL) or VE (800 μg/mL) for 48 h. Apoptosis was assessed by staining with ethidium bromide (Sigma). Apoptotic bodies were counted from 200 cells observed using fluorescence microscopy. Proliferation of cells was assessed by 5-bromo-2′-deoxyuridine (BrdU) intake (BrdU Cell Proliferation ELISA kit, CosmoBio, Tokyo, Japan). Myotube formation was induced in C2C12 cells by treatment with insulin (0.5 mg/mL, Sigma) in high-glucose DMEM (450 mg/mL in glucose, WAKO) for 6 days.

2.2. Sphere Assay

Cells (10,000 cells per well) were seeded on uncoated bacteriological 35-mm dishes (Coning Inc., Coning, NY, USA) with 3D Tumorsphere Medium XF (Sigma). Cells were cultured with or without VB2 (50 μg/mL) or VE (800 μg/mL). After 7 d, sphere images were captured using a computer and the sphere size was measured using NIH ImageJ software (version 1.52, Bethesda, MD, USA). We counted the number of all spheres in the culture wells. The designated sphere size was the mean of all spheres in the well.

2.3. Animals

Five-week-old male BALB/c mice were purchased from SLC Japan (Shizuoka, Japan). The animals were maintained in a pathogen-free animal facility under a 12/12-h light/dark cycle at 22 °C in a humidity-controlled environment, in accordance with the institutional guidelines approved by the Committee for Animal Experimentation of Nara Medical University, Kashihara, Japan and as per the current regulations and standards of the Japanese Ministry of Health, Labor and Welfare (approval No. 11813, 25 October 2016). Animals were acclimated to their housing for 7 days before the start of the experiment.
In the subcutaneous model, CT26 cancer cells (1 × 10⁷ in 0.2 mL per mouse) were inoculated into the mouse scapular tissue [12]. In the peritoneal model, CT26 cancer cells (1 × 10⁷ in 0.2 mL per mouse) were inoculated into the mouse peritoneal cavity [12].
To measure tumor weight, mice were euthanized by aortic blood removal under anesthesia with sevoflurane (Maruishi Pharmaceutical Co. Ltd., Osaka, Japan), and the subcutaneous tumors were excised, whereas the peritoneal tumors were dissected from the intestine, mesenterium, diaphragm, and abdominal wall, grossly removing non-tumoral tissues [12].
To prepare skeletal muscles, the quadriceps femoris muscle (QFM) was cut at the muscle end on the upper edge of the patella, peeled off from the femur, and separated at the muscle origin on the frontal surface of the anterior lower iliac spine [12]. The excised QFM was weighed immediately to avoid drying. After measurement, the QFM was frozen at −80 °C.
To prepare serum samples, the blood was obtained by cardiocentesis under anesthesia with sevoflurane (Maruishi) before euthanasia.

2.4. Diet

Mice were fed with a CE-2 diet (containing 5% crude fat, mainly derived from soybean oil; CLEA Japan, Inc., Tokyo, Japan) or experimental diets (VB2 diet (0.02% w/w in CE-2 diet) or VE diet (0.32% w/w in CE-2 diet), which yielded dosages of 50 mg/kg/day of VB2 and 800 mg/kg/day of VE).

2.5. Reverse Transcription-Polymerase Chain Reaction (RT-PCR)

To assess human and murine mRNA expression, RT-PCR was performed using 0.5 µg total RNA extracted using an RNeasy kit from the three cell lines (Qiagen, Germantown, MD, USA). The primer sets are listed in Table 1 and were synthesized by Sigma Genosys (Ishikari, Japan). PCR products were electrophoresed on a 2% agarose gel and stained with ethidium bromide. GAPDH mRNA was also amplified for use as an internal control. Semi-quantification of RT-PCR products was performed using ImageJ software (NIH, Bethesda, MD, USA).

2.6. Protein Extraction

The QFM stored at −80 °C was crushed with a hammer to remove tendons and fascia. Only the muscle tissue was washed with cold phosphate-buffered saline and pelleted with a sonicator (QSONICA, WakenBtech Co. Ltd., Kyoto, Japan). Whole-cell lysates were prepared using 0.1% SDS-added RIPA-buffer, as previously described (Thermo Fisher Scientific, Tokyo, Japan) [12]. Protein assays were performed using a Protein Assay Rapid Kit (Wako Pure Chemical Corporation, Osaka, Japan).

2.7. Enzyme-Linked Immunosorbent Assay (ELISA)

ELISA kits were used to measure the concentrations of MYL1, MYH, mouse CD44 (Cusabio Biotech Co., Ltd., Houston, TX, USA), HMGB1 (Shino-Test Co., Sagamihara, Japan), mouse TNFα, 4-hydroxynonenal (4-HNE), and ATP (Abcam, Cambridge, MA, USA) according to the manufacturer’s instructions. For measurement, whole-cell lysates or serum were used.

2.8. Nitric Oxide (NO)

NO levels were measured according to our previous study [27]. For NO treatment of cells, sodium nitroprusside was used as an NO donor at the concentrations mentioned in the Results section. NO concentration was detected as the nitrite concentration measured by the Griess method. Briefly, the cultured medium was mixed with the same amount of Griess solution (1% sulfanilamide, 0.1% naphthylethylenediamine dihydrochloride, 2.5% phosphoric acid), and OD540 was measured after 10 min of incubation. Nitrite concentration was determined using a standard curve made with various concentrations of sodium nitrite.

2.9. Peritoneal Macrophage

Peritoneal macrophages were collected according to our previous study [28]. Four-week-old male BALB/c mice (Japan SLC, Inc., Shizuoka, Japan) were injected intraperitoneally with 1 mL of 10% thioglycolate (Becton-Dickinson Microbiology Systems, Sparks, MD, USA). On the 4th day, the mice were euthanized, and the peritoneal cavities were washed with cold phosphate-buffered saline to collect infiltrated macrophages. The lavages were centrifuged, and the pellets were resuspended in 10% FBS-supplemented RPMI-1640 medium. Suspended cells were cultured overnight. Adherent cells (peritoneal macrophages) were reseeded at 1 × 10⁴ cells per well in 24-well dishes and cultured with DMEM supplemented with 20% CT26 cultured medium or 20% macrophage cultured medium for 48 h. The cultured media were collected after 48 h culture of 10,000 cells with 3 mL DMEM and filtered with a 0.2 μm syringe filter (Advantec, Tokyo, Japan).

2.10. Statistical Analysis

Statistical significance was calculated using ordinary analysis of variance by InStat software (version 3.0; GraphPad Software, Inc., La Jolla, CA, USA). Data are expressed as the mean ± standard deviation of three independent experiments. p < 0.05 (two-sided) was considered statistically significant.

3. Results

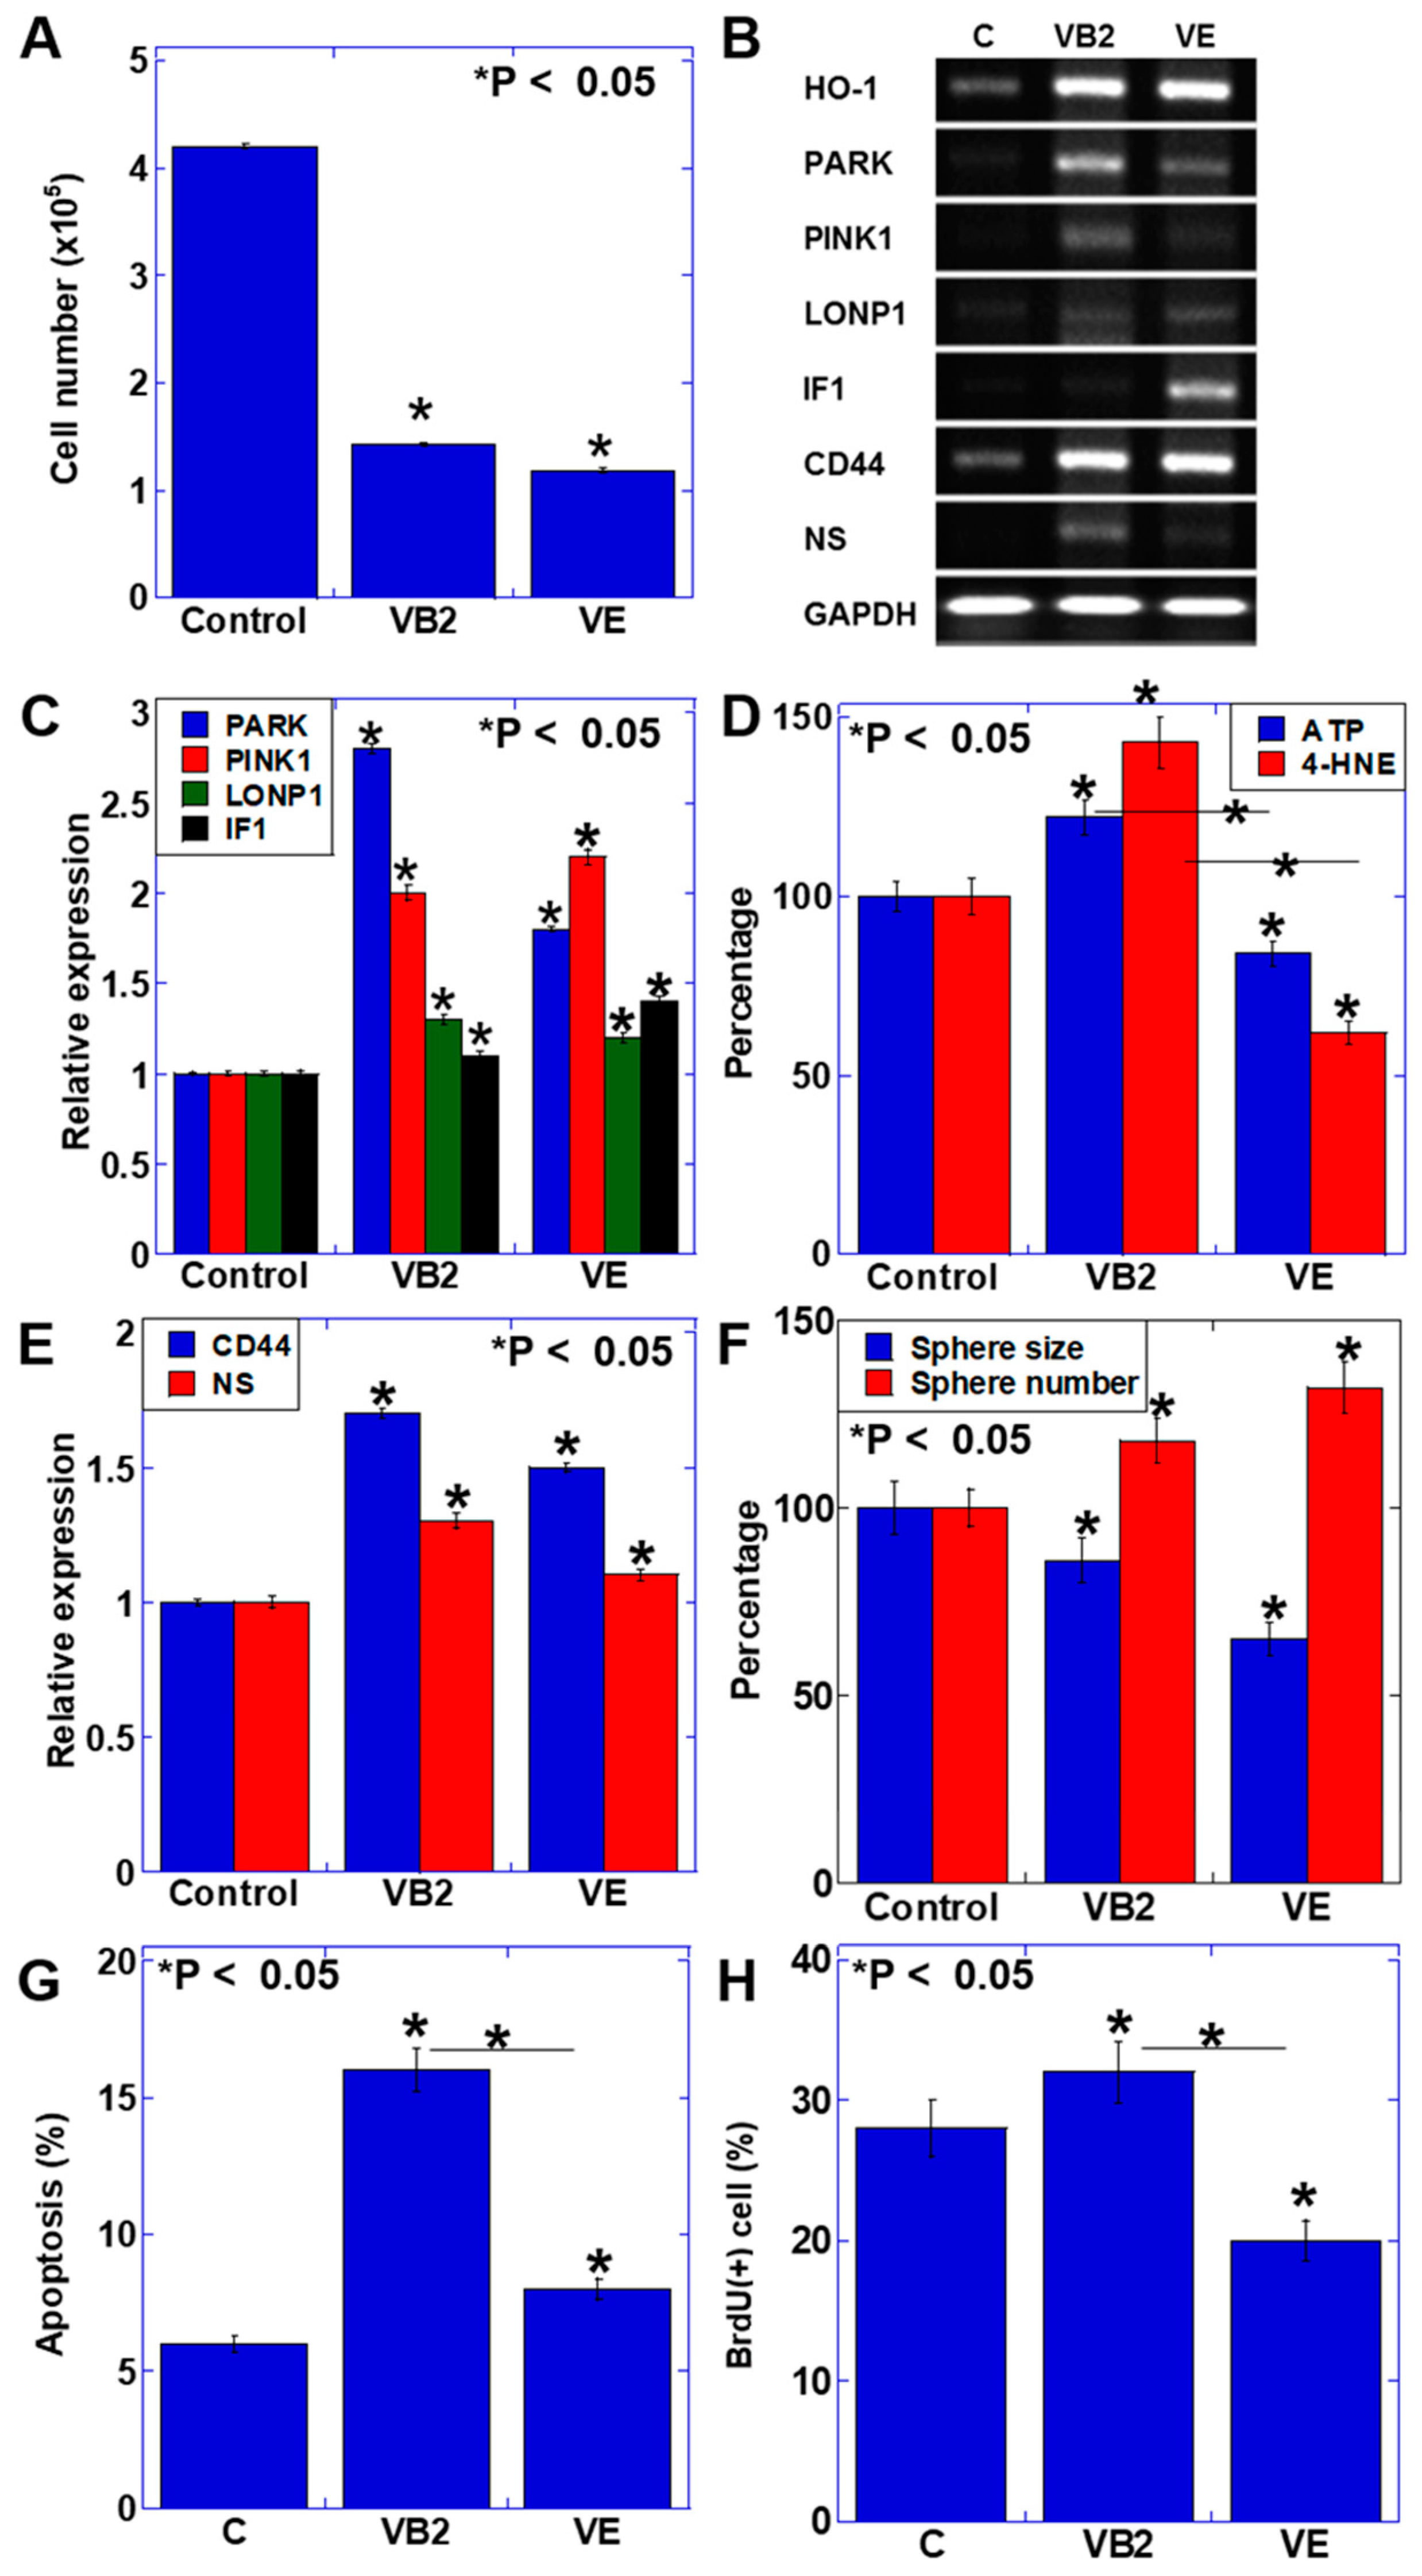
3.1. Effect of VB2 and VE on the Proliferation and Gene Expression of CT26 Cells

CT26 mouse colon cancer cells were treated with VB2 or VE (Figure 1). Both VB2 and VE suppressed the proliferation of CT26 cells (Figure 1A). Gene expression related to oxidative stress (heme oxygenase (HO)-1), mitochondrial quality control (E3 ubiquitin-protein ligase parkin (PARKIN), PTEN-induced kinase 1 (PINK1), LON protease (LONP)-1, inhibitor of F1 (IF1)), and stemness (CD44 and nucleostemin) was examined (Figure 1B–F). The expression of HO-1 and mitochondrial quality control-associated genes was increased by VB2 and VE treatments (Figure 1B,C). VB2 treatment also increased the production of ATP and 4-HNE. In contrast, adenosine triphosphate (ATP) and 4-HNE levels were decreased by VE treatment (Figure 1D). The expression of stemness-related markers was increased by both VB2 and VE treatments (Figure 1A,E). Upon examination of sphere formation in CT26 cells, the sphere size was found to be decreased, whereas the sphere number was increased by both VB2 and VE treatments.

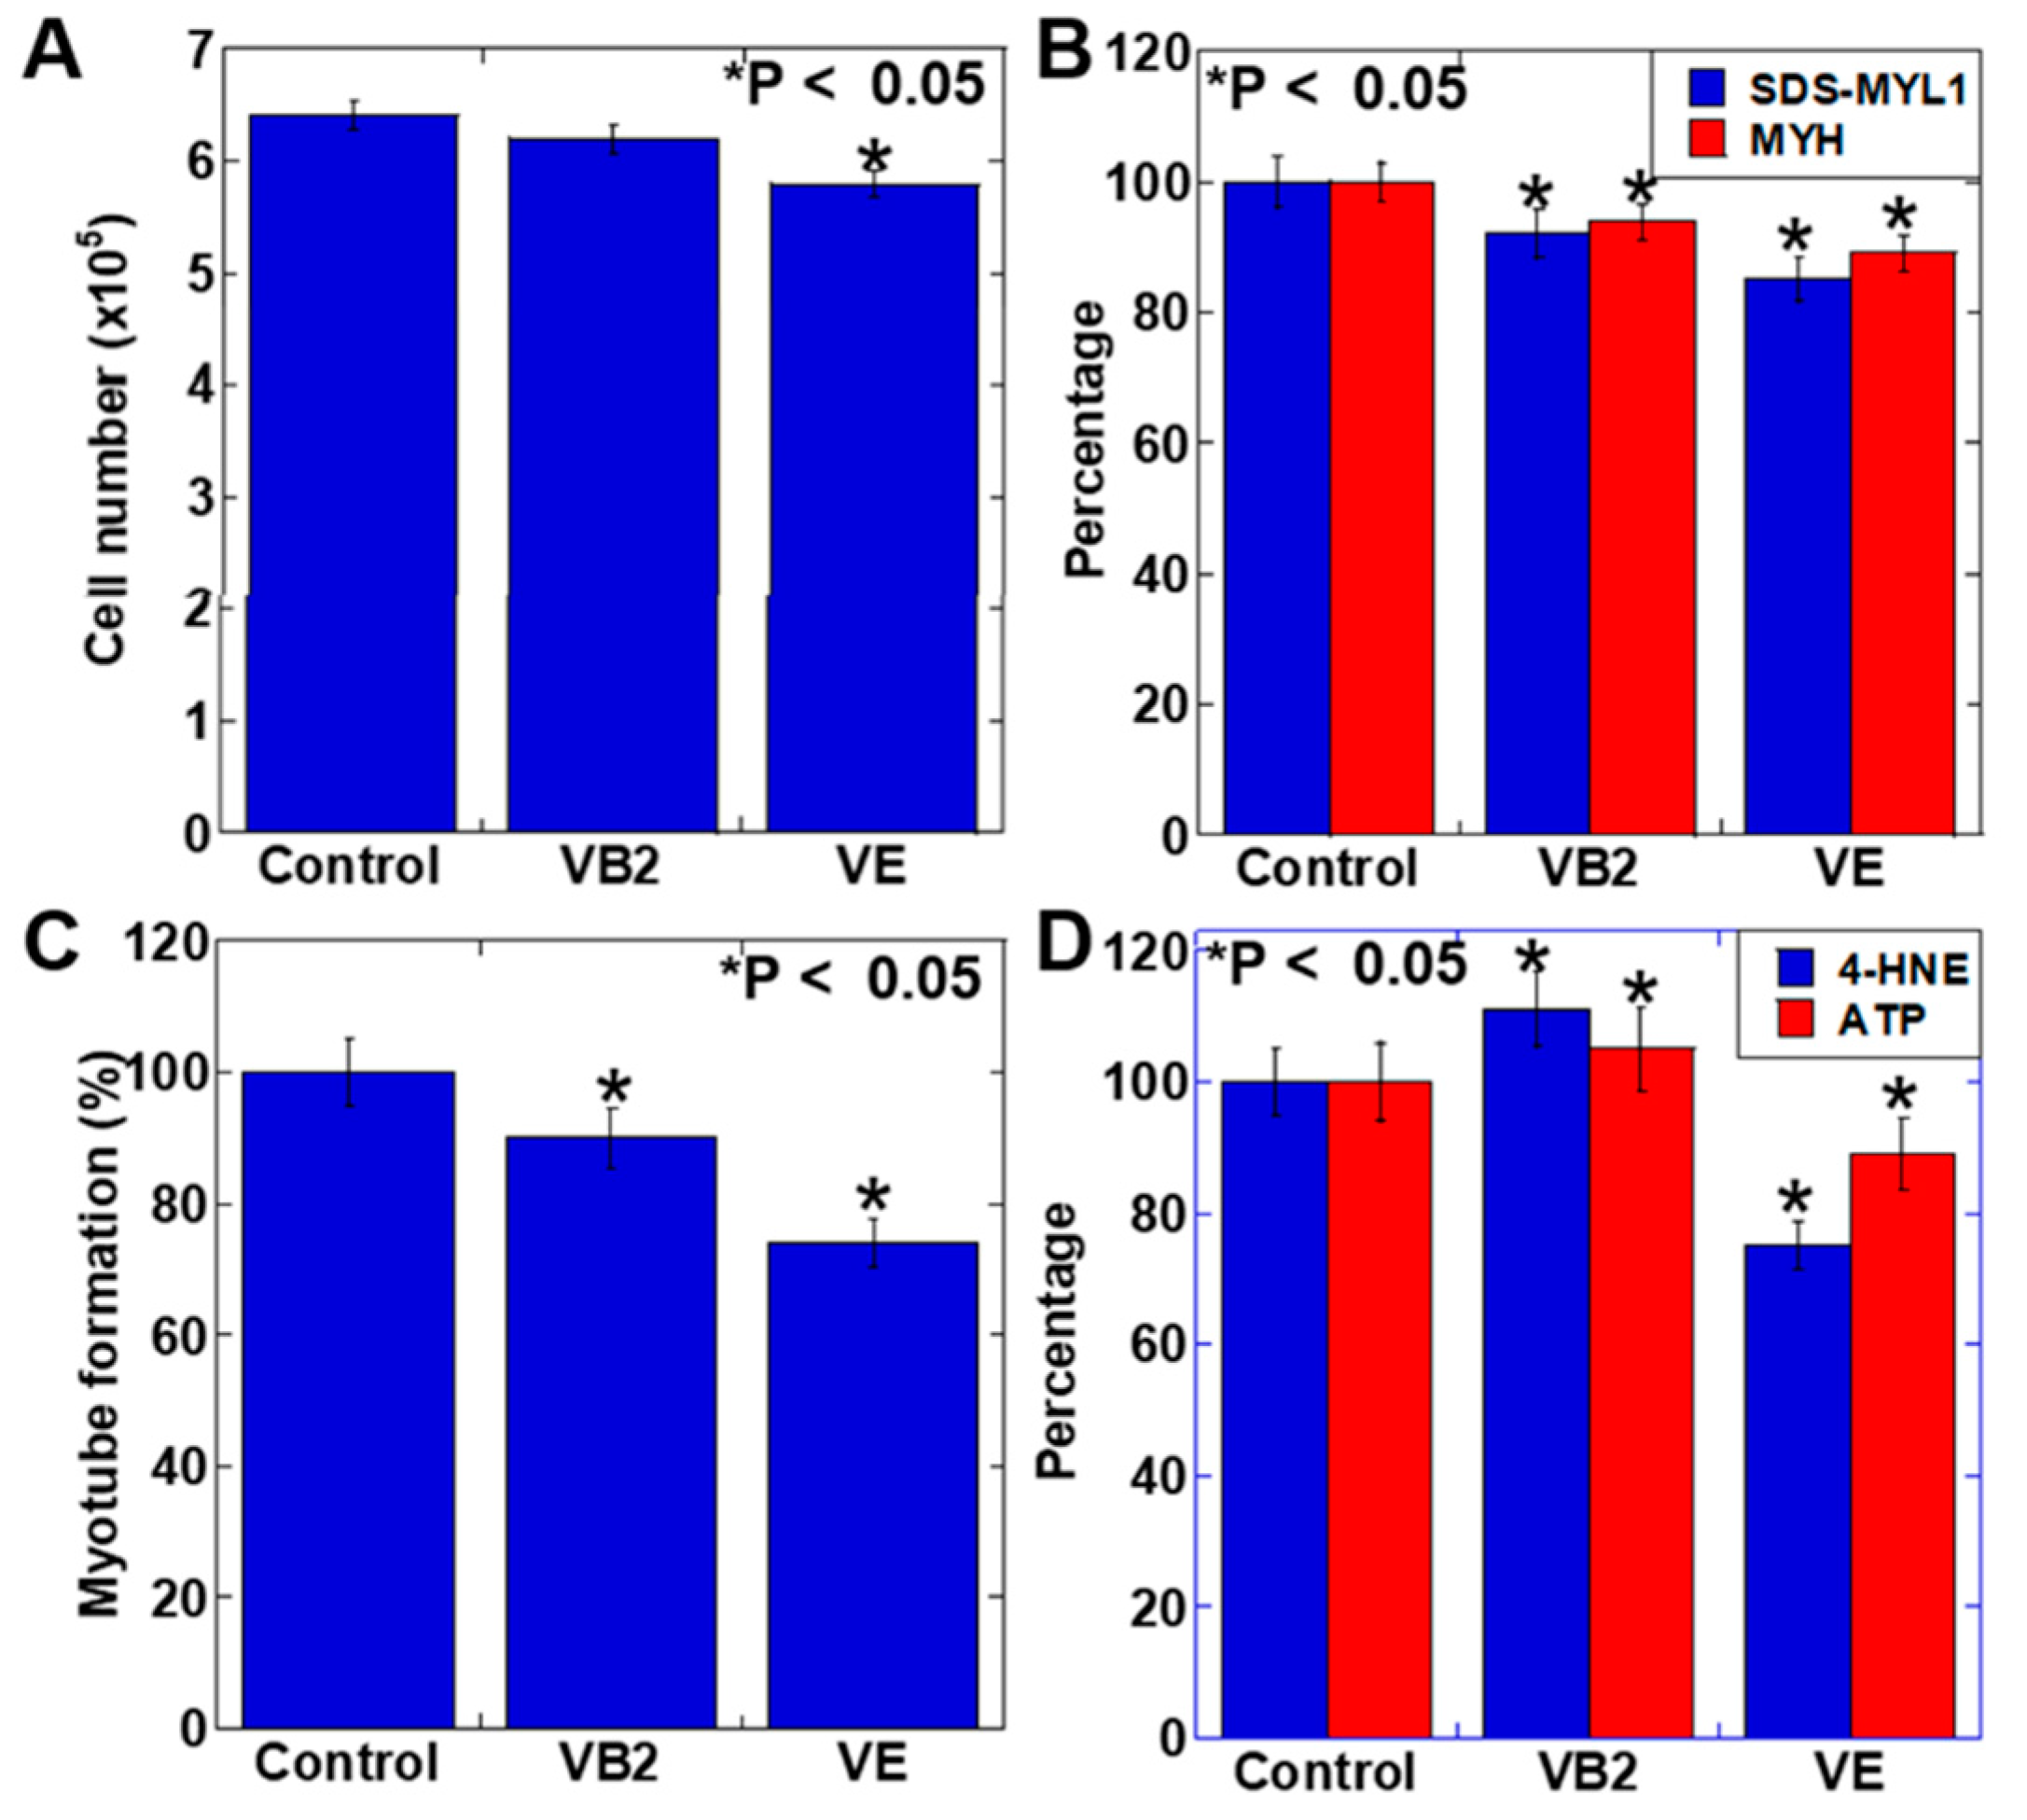
3.2. Effect of VB2 and VE Treatments on the Proliferation and Maturation of C2C12 Myoblasts

We next examined the effects of VB2 and VE treatments on C2C12 mouse myoblasts (Figure 2). The proliferation of C2C12 cells was decreased by VE treatment but not by VB2 treatment (Figure 2A). To evaluate the effect of VB2 and VE treatments on C2C12 cell maturation, myotube formation and protein levels of sodium dodecyl sulfate-soluble myosin light chain-1 (SDS-MYL1) and myosin heavy chain (MYH) were examined (Figure 2B,C). Both VB2 and VE treatments decreased myotube formation and protein levels of SDS-MYL1 and MYH in C2C12 cells. VB2 increased 4-HNE and ATP levels, whereas VE decreased both 4-HNE and ATP levels (Figure 2D).

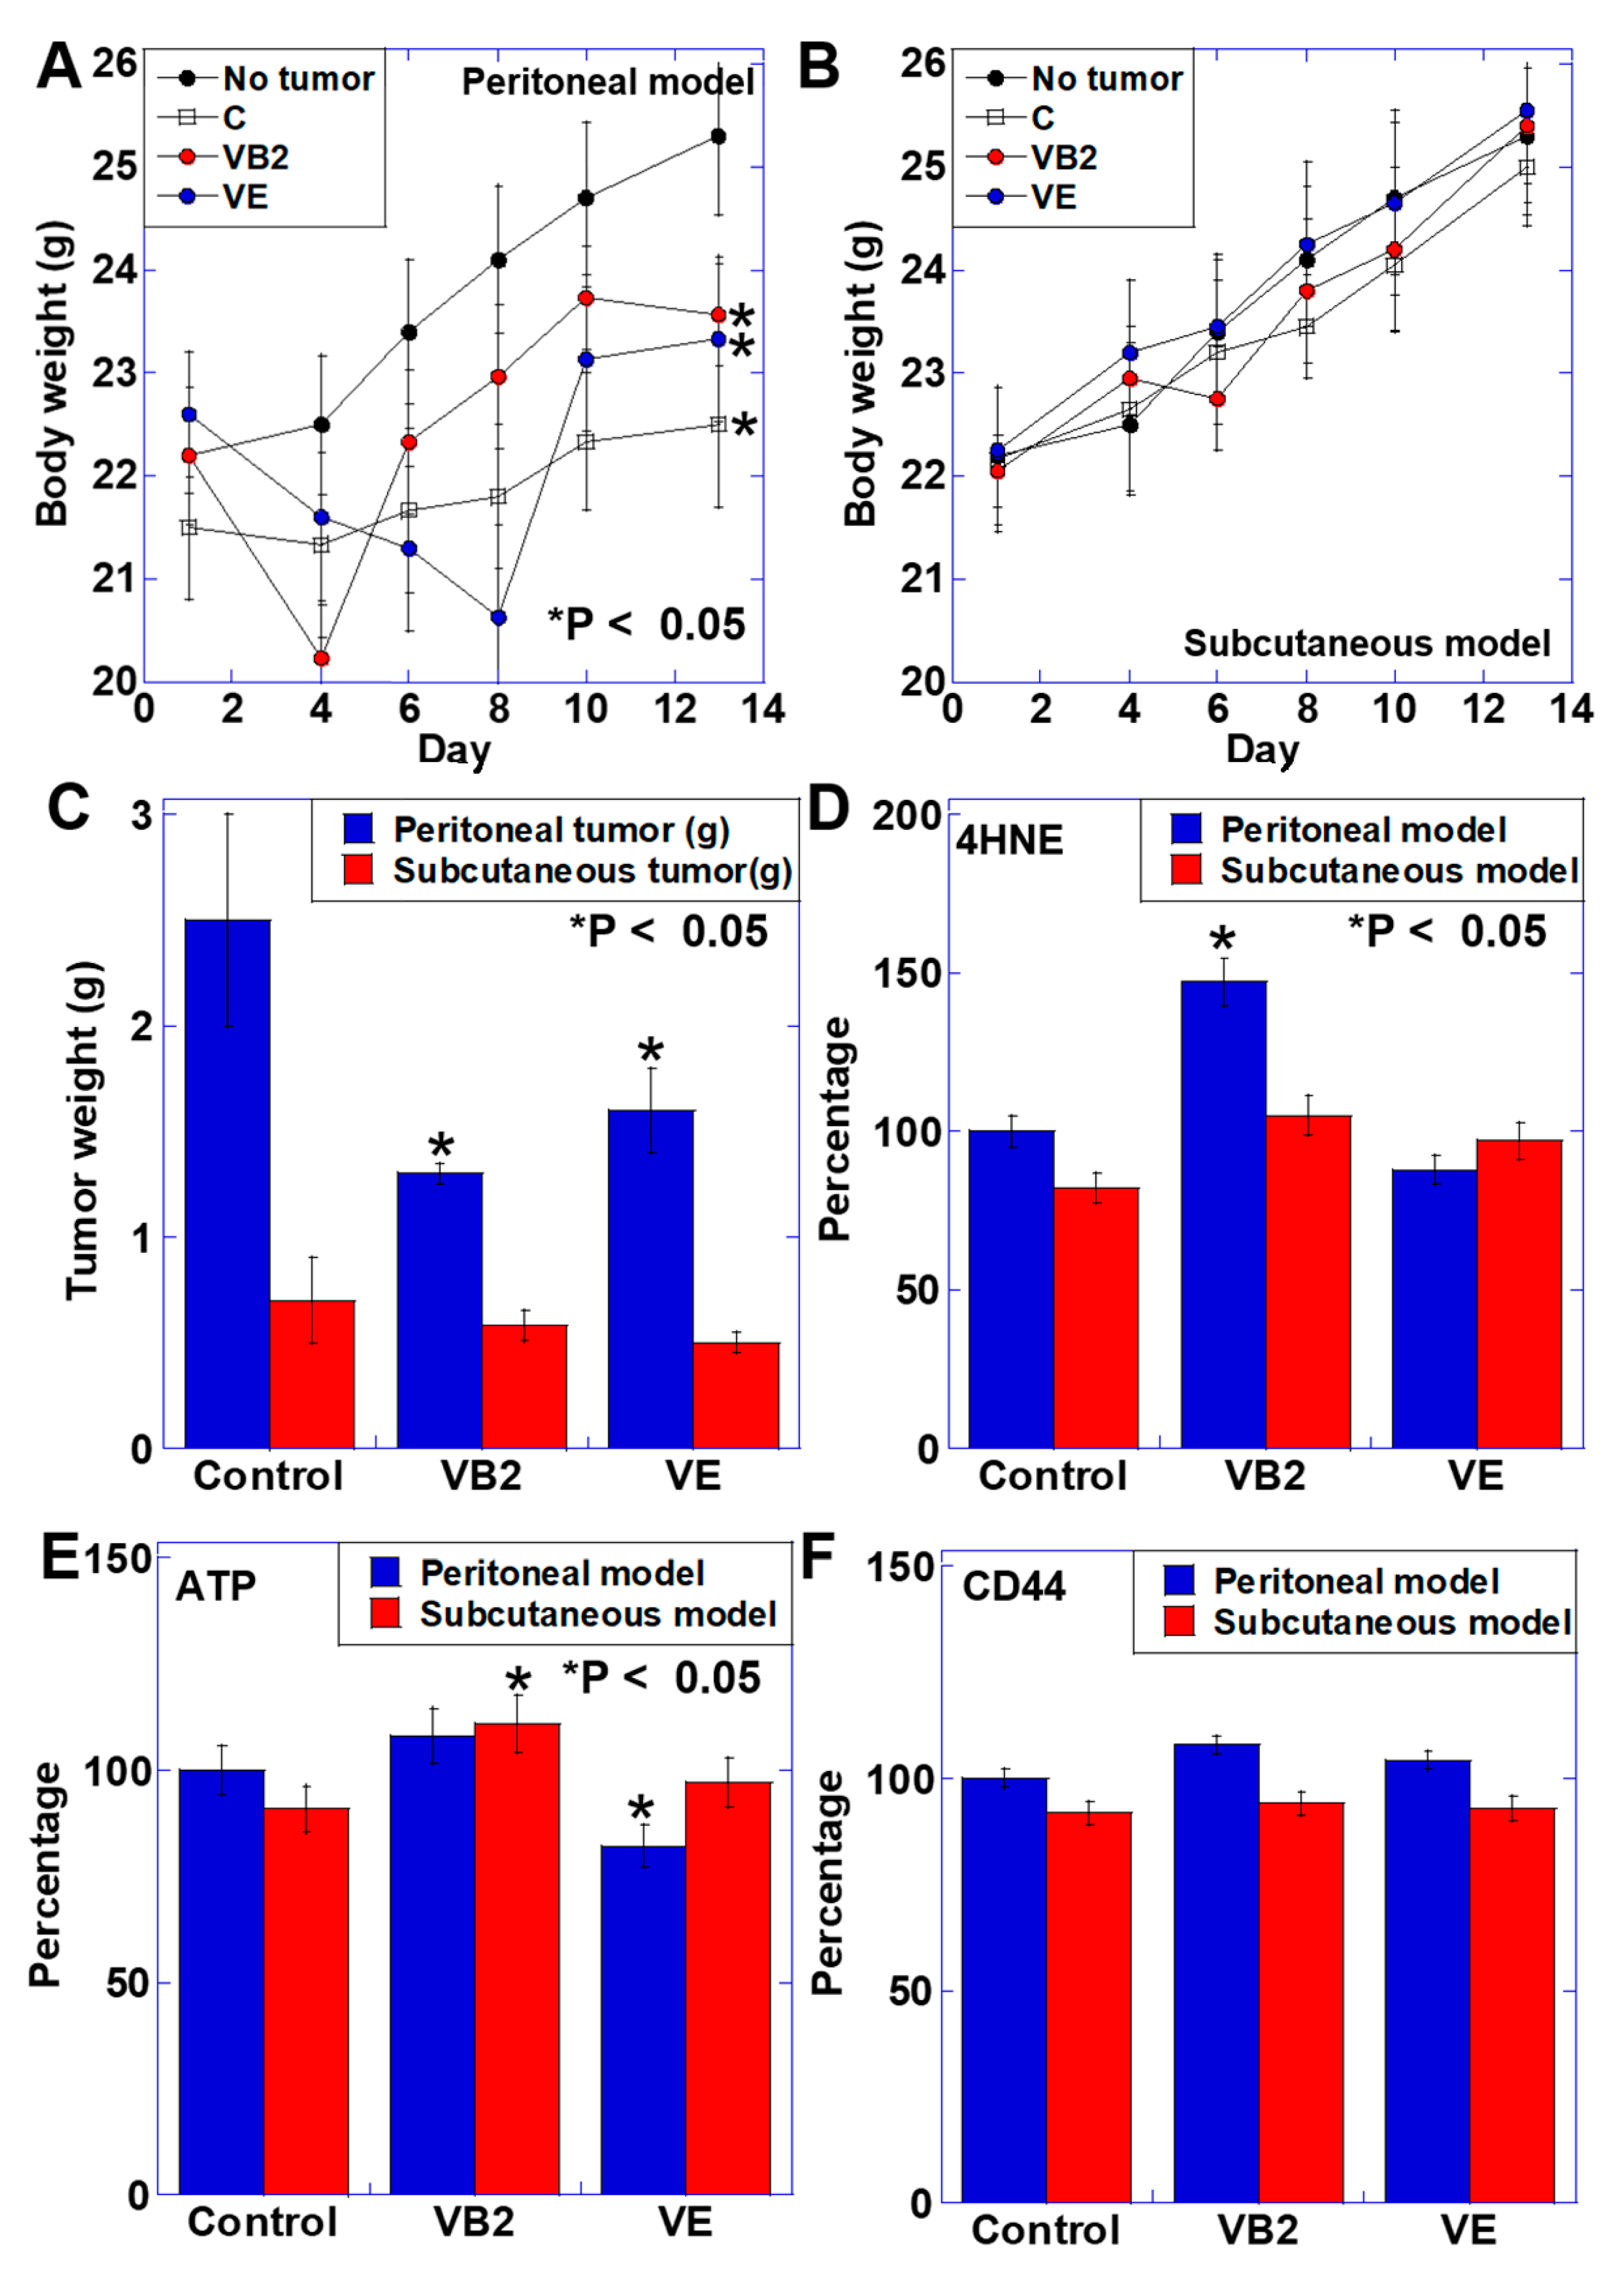
3.3. Effect of VB2 and VE Treatments on Tumors in the Peritoneal and Subcutaneous Models

We examined the effect of VB2 and VE treatments on tumors using the peritoneal and subcutaneous models (Figure 3). Body weight was not affected by VB2 or VE treatments in the two models (Figure 3A,B). As shown in Figure 3C, more significant tumor growth was observed in the peritoneal model than in the subcutaneous model. Tumor growth was suppressed by VB2 and VE treatments in the peritoneal model but not in the subcutaneous model. Furthermore, 4-HNE levels were increased only in the VB2-treated peritoneal model (Figure 3D). ATP production was increased by VB2 treatment in the two models; however, VE decreased ATP production in the peritoneal model (Figure 3E). The protein levels of CD44 were not different between the two models, and the levels were not affected by VB2 or VE treatments (Figure 3F).

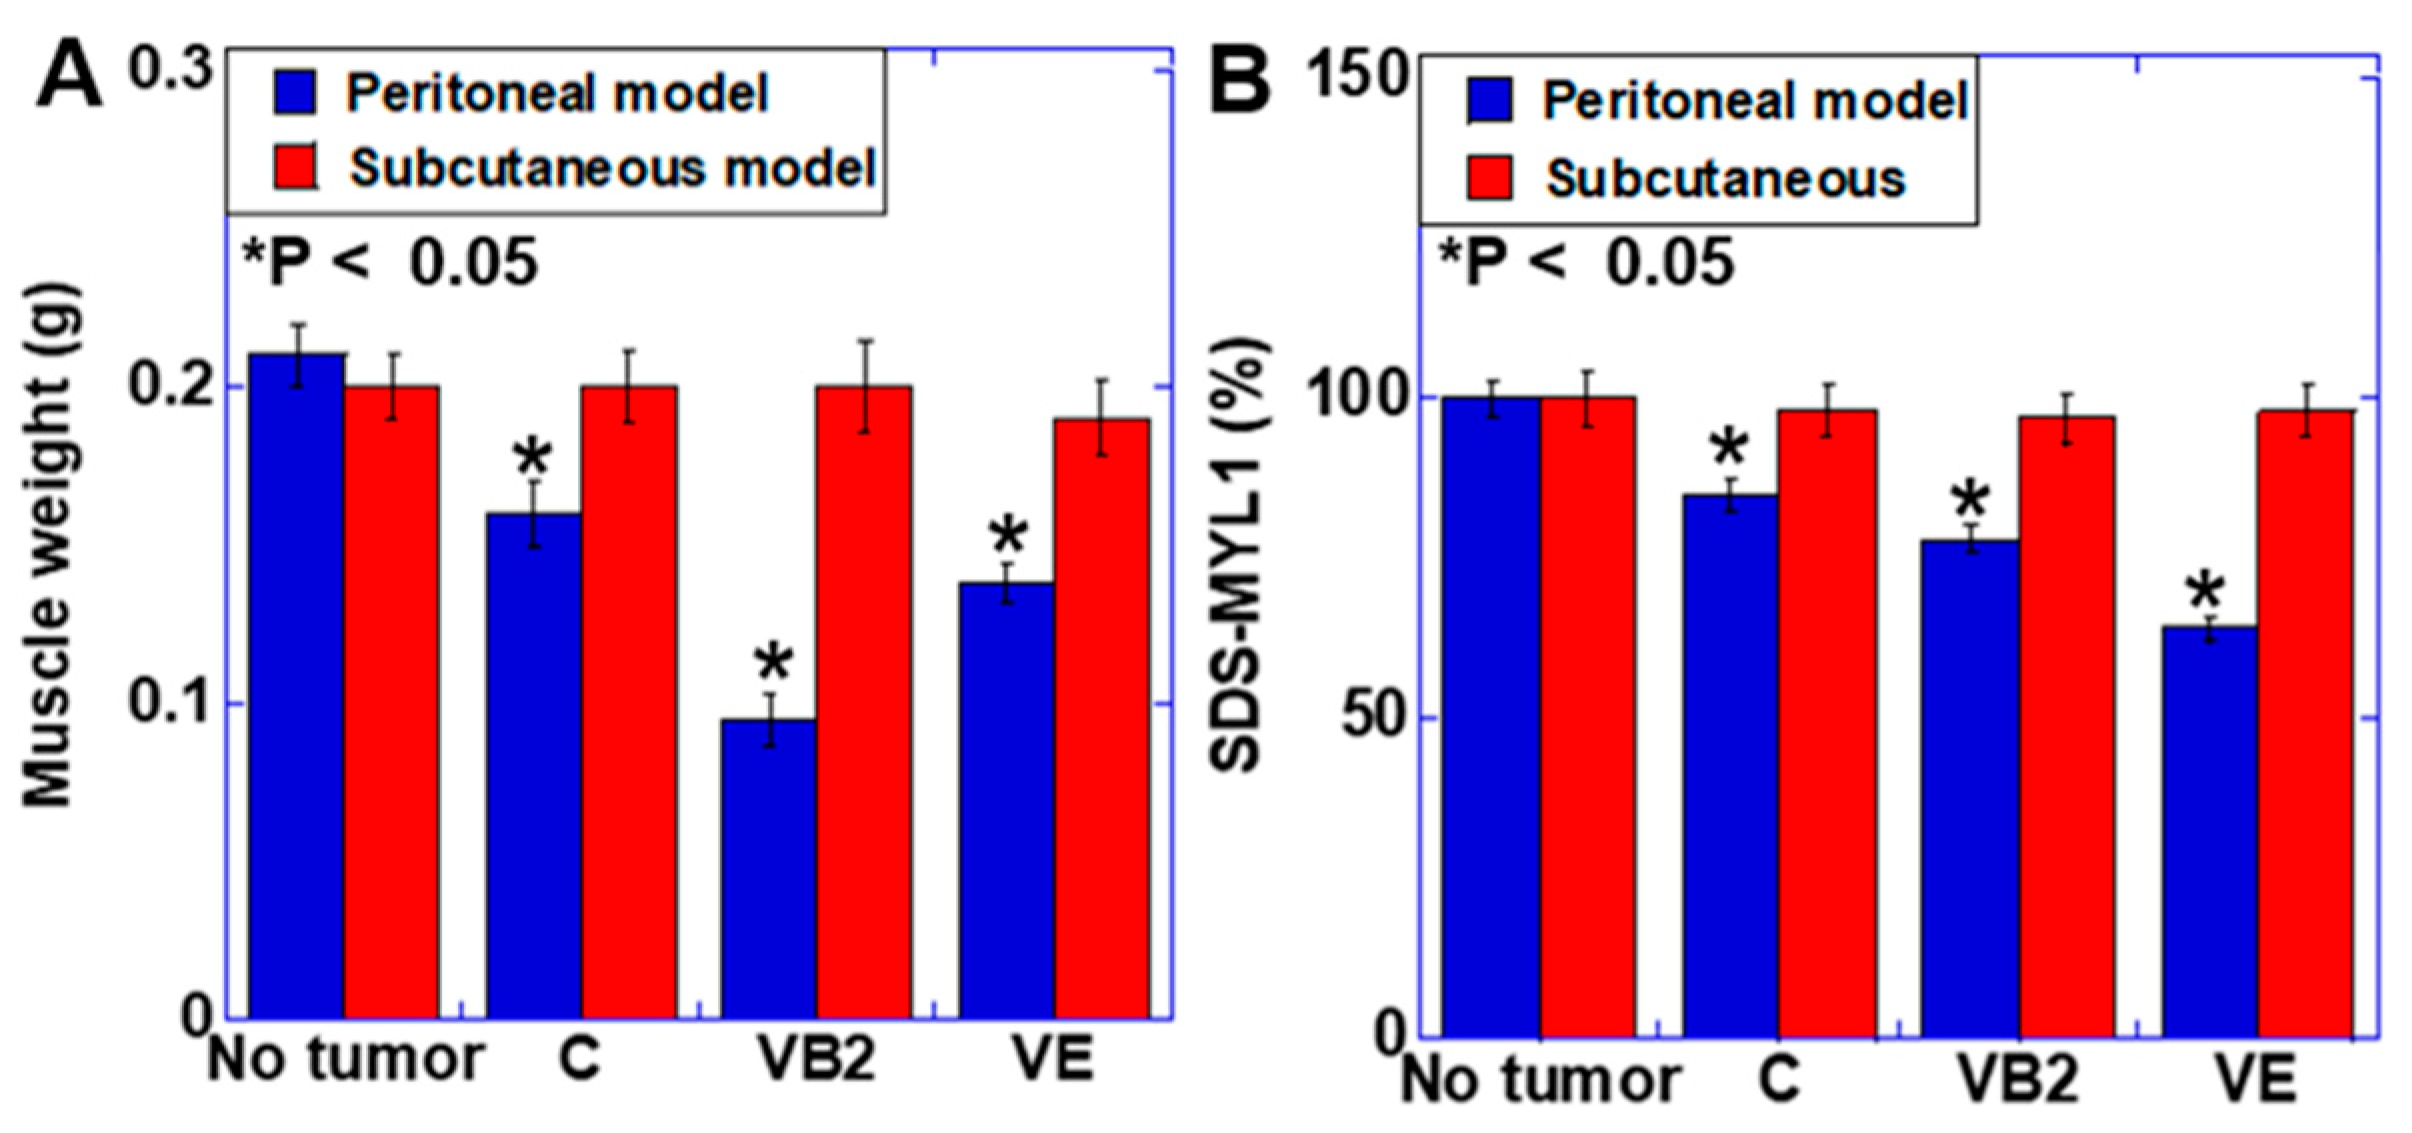
3.4. Effect of VB2 and VE Treatments on Skeletal Muscle Weight and Maturation in the Peritoneal and Subcutaneous Models

We next compared the effects of VB2 and VE treatments in the two tumor models (Figure 4). Muscle weight was reduced by 24% in the peritoneal model compared with that in the tumor-free control, whereas no significant change was observed in the subcutaneous model (Figure 4A). In the peritoneal model, a further decrease in muscle weight was observed after both VB2 and VE treatments compared with the untreated control. In contrast, in the subcutaneous model, no significant changes were observed after VB2 and VE treatments. SDS-MYL1 expression was reduced by 26% in the peritoneal model compared with that in the tumor-free control, whereas no significant change was observed in the subcutaneous model (Figure 4B). In the peritoneal model, both VB2 and VE treatments induced a further decrease in SDS-MYL1, whereas in the subcutaneous model, no significant change was observed after VB2 and VE treatments. Thus, there was a clear difference in the induction of muscular atrophy between the two tumor models.

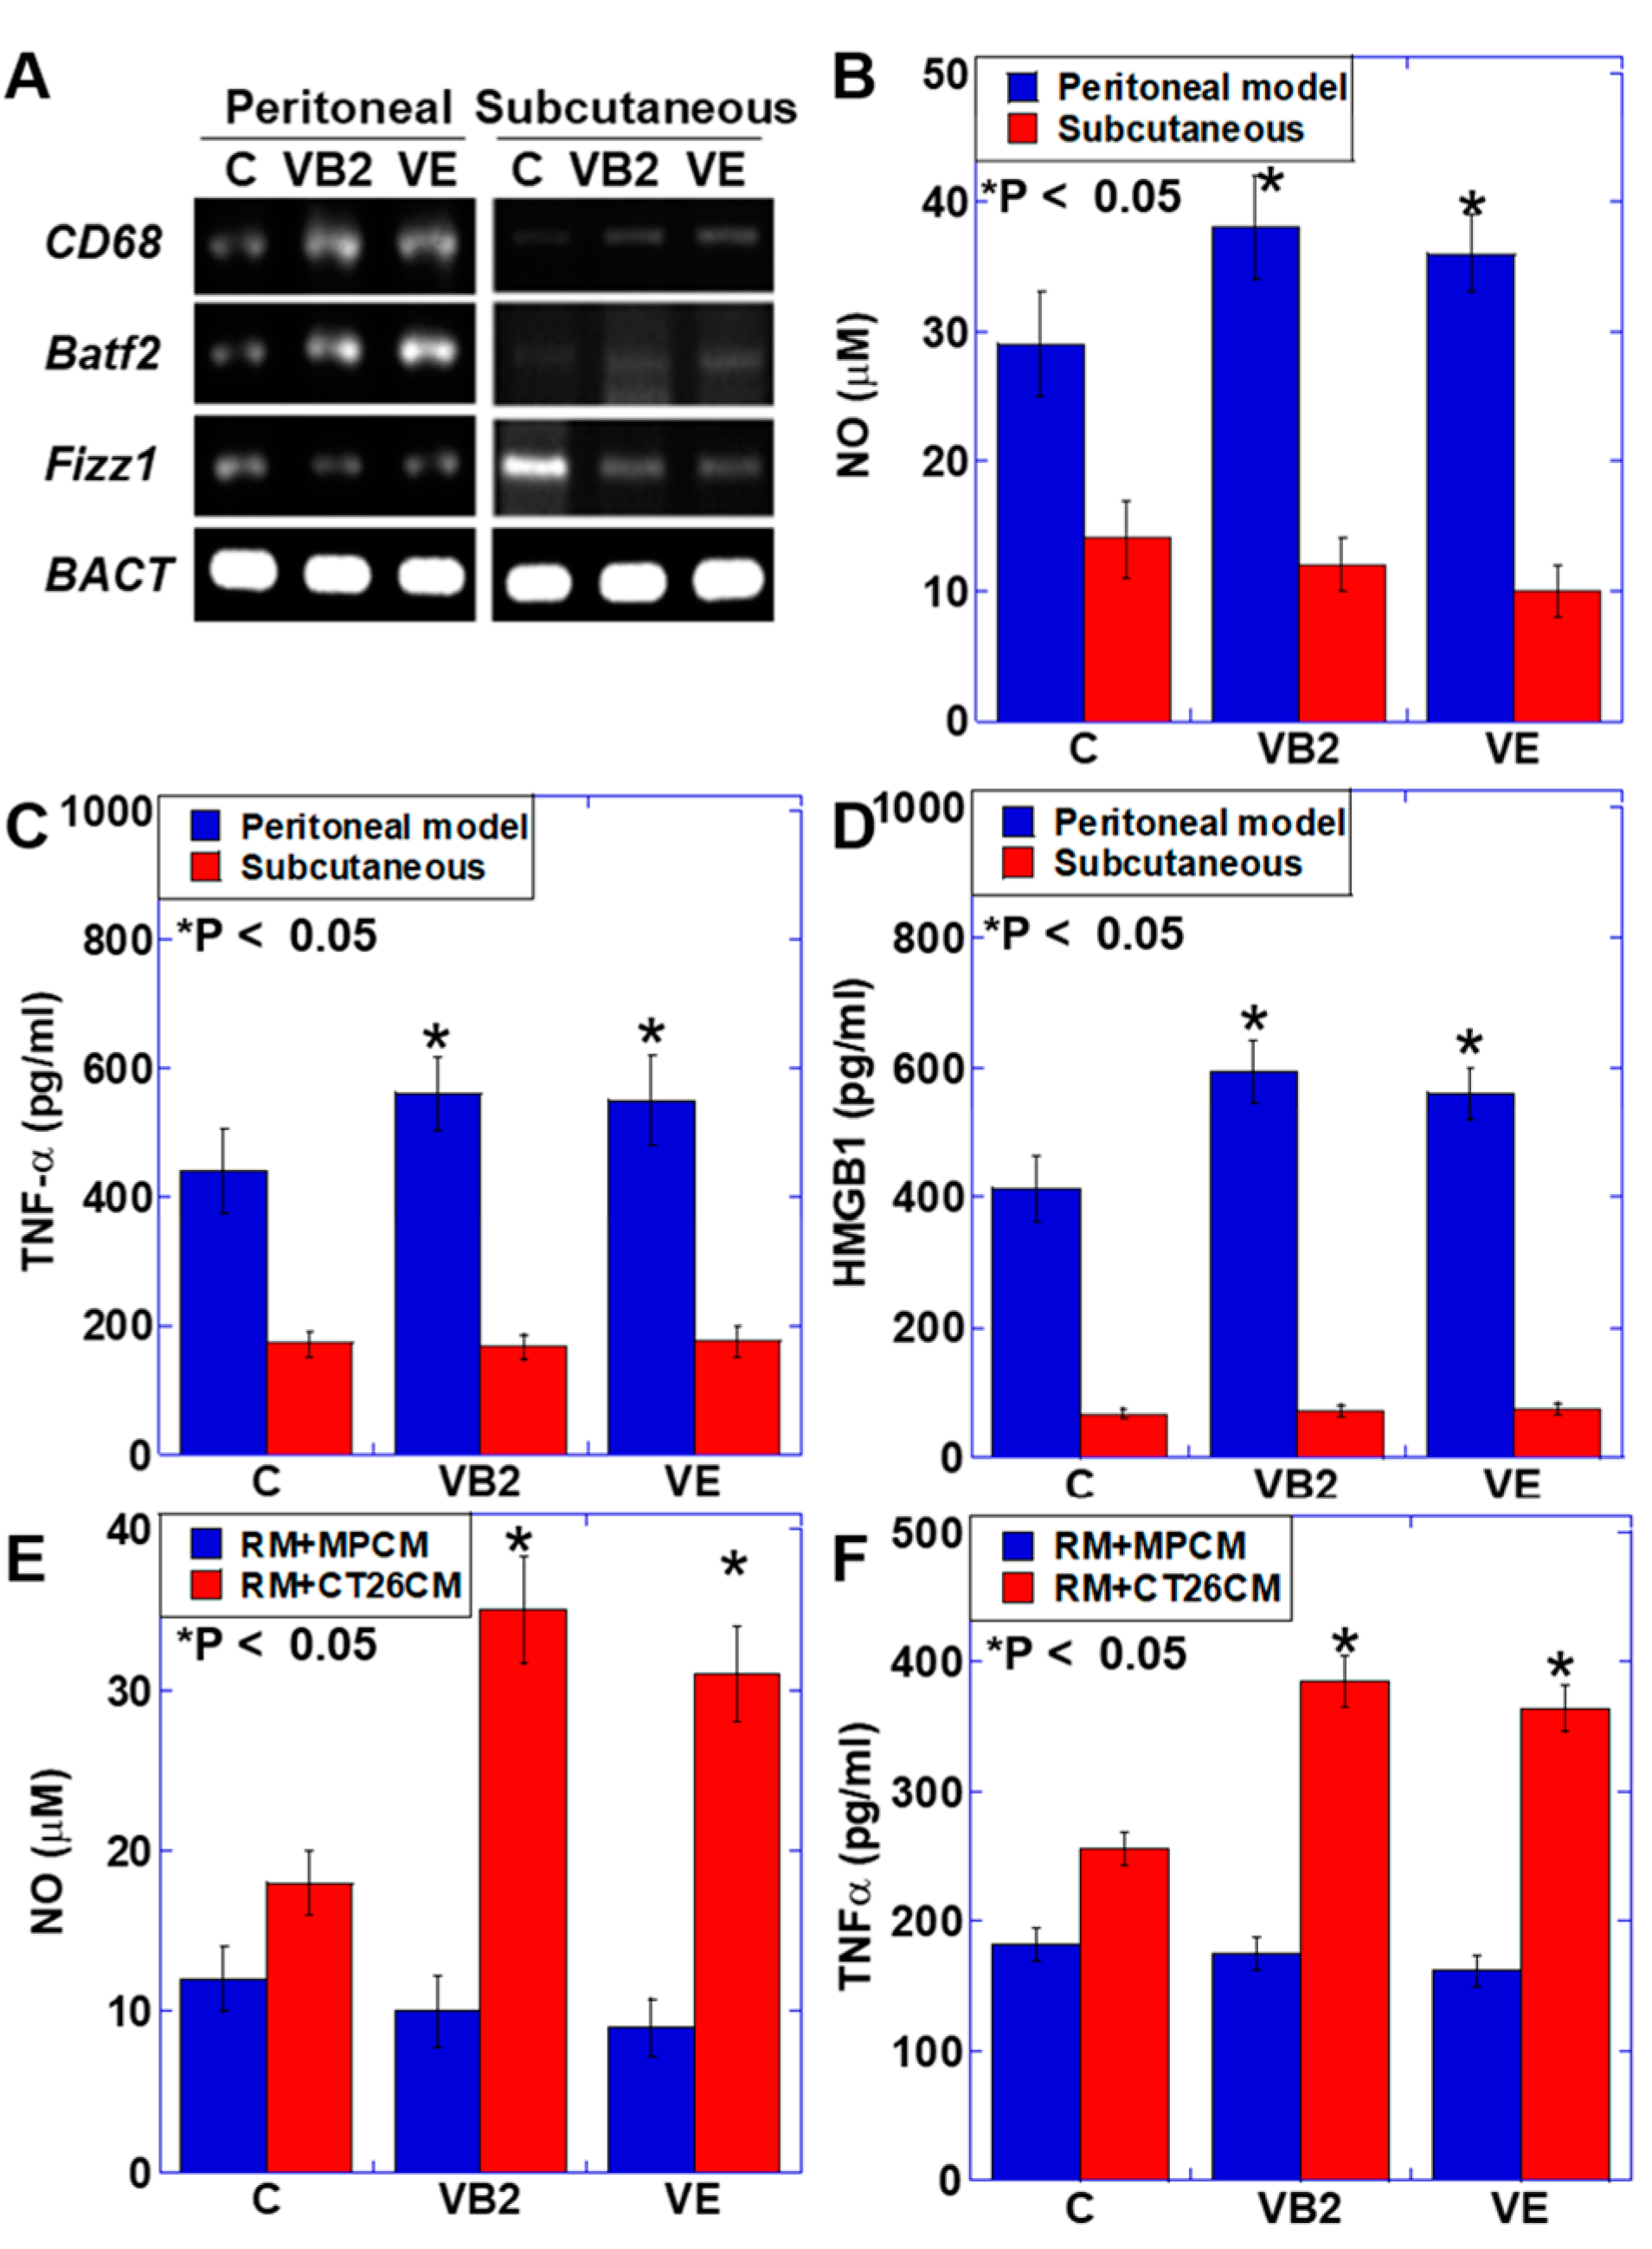
3.5. Effect of VB2 and VE Treatments on Macrophages in the Peritoneal and Subcutaneous Models

We previously reported that high mobility group box-1 (HMGB1) and tumor necrosis factor (TNF)-α are strongly involved in the development of cancer-related cachexia [8,13]. In addition, macrophages are responsible for secreting HMGB1 and TNFα. In this study, we examined the differences in macrophages between the peritoneal and subcutaneous models (Figure 5). The amount of intratumoral macrophages was assessed by measuring the mRNA expression of total macrophages (CD68), M1 macrophages (Batf2), and M2 macrophages (Fizz1) (Figure 5A). The expression of CD68, Batf2, and Fizz1 was higher in the peritoneal model than in the subcutaneous model. In the peritoneal model, the expression of CD68 and Batf2 was increased by VB2 and VE treatments, whereas Fizz1 expression was decreased by treatment with them. In contrast, VB2 and VE treatments did not affect the expression of the macrophage markers in the subcutaneous model. As shown in Figure 5B–D, the levels of nitric oxide (NO), TNFα, and HMGB1 were markedly higher in the peritoneal model than in the subcutaneous model. The levels of NO, TNFα, and HMGB1 were increased by VB2 and VE treatments in the peritoneal model, whereas no change was found in these inflammatory factors in the subcutaneous model by VB2 and VE treatments.

4. Discussion

In this study, we investigated the effects of VB2 and VE treatments on cancer cells and skeletal muscles in vitro and in vivo. In vitro, VB2 and VE treatments exerted marked inhibitory effects on CT26 cells. The expression of PARKIN and PINK1, which are involved in mitochondrial quality control [29], was enhanced by both VB2 and VE treatments. Expression of LONP1, which is responsible for the shift in energy metabolism from oxidative phosphorylation to glycolysis [30], and IF1, which inhibits F1F0-ATPase activity [31], was also increased.
Differences in the production of ATP and oxidative stress were observed between the two vitamins. VB2 increased both ATP production and oxidative stress, whereas VE decreased both. VB2 increased both apoptosis and cell division, but the former was more prominent. In contrast, VE reduced both apoptosis and cell division, but the latter was more pronounced. Therefore, it was considered that both vitamins caused a decrease in the number of cancer cells. Moreover, both vitamins have been reported to induce apoptosis in cancer cells through alterations in membrane lipids and signal transduction [32,33,34]. However, the effect of VB2 and VE treatments on cancer stemness has not been reported thus far. In our data, spheres decreased in size but increased in number as the cell number decreased. The expression of stem cell markers also increased. It was considered that stem cell activity increased with both vitamin treatments. The same tendency as above was observed in the peritoneal model, whereas the alteration was unclear in the subcutaneous model.
In C2C12 skeletal myoblasts, VB2 and VE treatments showed a decrease in muscle maturity. VB2 increased both ATP production and oxidative stress, whereas VE decreased both. This effect was similar to that observed in CT26 cancer cells, although the alteration was mild. In the peritoneal model, the maturity of skeletal muscles was decreased, whereas no significant change was observed in the subcutaneous model. In C2C12 myoblasts, vitamin B2 increased both ATP production and oxidative stress, but vitamin E decreased both. These had similar results to CT26 cells, but the changes were mild. This may be due to differences in mitochondrial quality control between C2C12 and CT26 cells. In cancer cells, the quality control of mitochondria is deteriorated, and it is considered that they have various impairments, which have been confirmed in our previous studies [12,13]. In this study as well, decreased expression of mitochondrial quality control molecules such as PARK and PINK1 was observed in CT26 cells. In contrast, it was not observed in C2C12 cells (data not shown).
We inoculated the same CT26 cells subcutaneously and intraperitoneally in syngeneic BALB/c mice and examined the differences. Although there was no significant difference in food intake, the peritoneal model evoked cachexia, resulting in weight loss and muscle weight loss. In contrast, the subcutaneous model did not induce cachexia. A clear difference between the two models reflected the varied response of macrophages to the tumor. Compared with the subcutaneous model, the peritoneal model showed marked infiltration of macrophages and an increase in the blood levels of TNFα, HMGB1, and NO, which are thought to be derived from infiltrated macrophages. We previously reported that TNFα and HMGB1 are involved in the development of cachexia in patients with colorectal cancer [8]. Thus, it is suggested that abnormal activation of macrophages for cancer induces cachexia.
Both models responded differentially to VB2 and VE treatments. The effect of VB2 and VE treatments was not clear in the subcutaneous model because of the low number of infiltrating macrophages. In contrast, in the peritoneal model, the production of NO and inflammatory cytokines was promoted by both VB2 and VE treatments.
Riboflavin activates macrophages [35], whereas decreased riboflavin impairs functions such as proliferation, oxidative stress production, phagocytosis, cytokine secretion (TNFα and HMGB1), and NO production [36]. In contrast, riboflavin reduces NOD-like receptor family pyrin domain-containing-3 inflammasome activity in macrophages, including maturation and secretion of interleukin (IL)-1β, IL-18, and caspase-1 [37], and suppresses nuclear factor (NF)-κB in response to bacterial stimulation. Further, it reduces the production of TNFα and NO [38].
VE generally suppresses inflammation by reducing prostaglandin E2 expression, NO production, and inflammatory cytokine production by suppressing macrophage cyclooxygenase and activating NF-E2-related factor-2 [39]. In contrast, tumor-bearing animals show promoted intratumoral infiltration of immune cells such as killer cells [40] and increased TNFα levels [41].
In our macrophage culture system experiments, cytokine production and NO production were markedly induced by adding the culture supernatant of CT26 cancer cells together with VB2 and VE. This suggests that the effects of VB2 and VE on macrophages found in micropathogens and tumors may be different. Specifically, VB2 and VE treatments may regulate macrophage activation upon micropathogen stimuli but may cause excessive macrophage activation in tumors. The pro-inflammatory effect of VB2 and VE may suppress tumor progression but exacerbate sarcopenia in skeletal muscles.
Risk for skeletal muscle atrophy is considered necessary for the use of VB2 and VE in cancer patients. In this study, the effect of using VB2 and VE alone was examined; however, VB2 and VE are used in the form of multivitamins in actual clinical situations. It is thought that there are many cases. In the future, a comprehensive study of vitamin groups on cancer-related sarcopenia is required. In addition, we have reported the improvement of cancer-related sarcopenia by the combined use of glucose and a medium-chain fatty acid [12,13], and it is desirable to examine the combined use of these nutrients and vitamins. Examination of the use of such comprehensive nutrients may enable more effective nutritional interventions for cancer-related sarcopenia.

Author Contributions

Study concept and design: H.K.; Acquisition of data: T.M., K.G., S.N., Y.W. and S.M.; Analysis and interpretation of data: T.M., K.G., R.F.-T., S.K., T.S., H.O. and I.K.; Drafting of the manuscript: T.M. and K.G.; Editing of the manuscript: H.K.; Supervision: A.K., K.H. and Y.T.; All authors have read and agreed to the published version of the manuscript.

Funding

This work was supported by MEXT KAKENHI grant numbers 19K16564 (R.F.-T.), 20K21659 (H.K.), 20K18007 (S.K.).

Institutional Review Board Statement

The study was conducted according to the guidelines of the Declaration of Helsinki, and approved by the Committee for Animal Experimentation of Nara Medical University (protocol code 11813, 25 October 2016).

Informed Consent Statement

Not applicable.

Data Availability Statement

Not applicable.

Acknowledgments

The authors thank Tomomi Masutani for expert assistance with the preparation of this manuscript.

Conflicts of Interest

The authors declare that the research was conducted in the absence of any commercial or financial relationships that could be construed as a potential conflict of interest.

Abbreviations

VB2vitamin B2
VEvitamin E
ATPadenosine triphosphate
ROSreactive oxygen species
HOheme oxygenase
PARKINE3 ubiquitin-protein ligase parkin
PINKPTEN-induced kinase
LONPON protease; IF1, inhibitor of F1; NS, nucleostemin
4-HNE4-hydroxynonenal
SDS-MYL1sodium dodecyl sulfate-soluble myosin light chain-1
MYHmyosin heavy chain
HMGBhigh mobility group box
TNFtumor necrosis factor
NOnitric oxide; BrdU, 5-bromo-2’-deoxyuridine

References

  1. Blum, D.; Stene, G.B.; Solheim, T.S.; Fayers, P.; Hjermstad, M.J.; Baracos, V.E.; Fearon, K.; Strasser, F.; Kaasa, S.; Koen, M.; et al. Validation of the Consensus-Definition for Cancer Cachexia and evaluation of a classification model—A study based on data from an international multicentre project (EPCRC-CSA). Ann. Oncol. 2014, 25, 1635–1642. [Google Scholar] [CrossRef]
  2. Fearon, K.C.; Voss, A.C.; Hustead, D.S. Definition of cancer cachexia: Effect of weight loss, reduced food intake, and systemic inflammation on functional status and prognosis. Am. J. Clin. Nutr. 2006, 83, 1345–1350. [Google Scholar] [CrossRef]
  3. Tisdale, M.J. Cachexia in cancer patients. Nat. Rev. Cancer 2002, 2, 862–871. [Google Scholar] [CrossRef]
  4. Evans, W.J.; Morley, J.E.; Argiles, J.; Bales, C.; Baracos, V.; Guttridge, D.; Jatoi, A.; Kalantar-Zadeh, K.; Lochs, H.; Mantovani, G.; et al. Cachexia: A new definition. Clin. Nutr. 2008, 27, 793–799. [Google Scholar] [CrossRef]
  5. Fearon, K.C. Cancer cachexia: Developing multimodal therapy for a multidimensional problem. Eur. J. Cancer 2008, 44, 1124–1132. [Google Scholar] [CrossRef]
  6. Argilés, J.M.; Busquets, S.; López-Soriano, F.J. Cytokines as mediators and targets for cancer cachexia. Cancer Treat. Res. 2006, 130, 199–217. [Google Scholar]
  7. Nardone, O.M.; de Sire, R.; Petito, V.; Testa, A.; Villani, G.; Scaldaferri, F.; Castiglione, F. Inflammatory Bowel Diseases and Sarcopenia: The Role of Inflammation and Gut Microbiota in the Development of Muscle Failure. Front. Immunol. 2021, 12, 694217. [Google Scholar] [CrossRef]
  8. de Sire, R.; Rizzatti, G.; Ingravalle, F.; Pizzoferrato, M.; Petito, V.; Lopetuso, L.; Graziani, C.; de Sire, A.; Mentella, M.C.; Mele, M.C.; et al. Skeletal muscle-gut axis: Emerging mechanisms of sarcopenia for intestinal and extra intestinal diseases. Minerva Gastroenterol. Dietol. 2018, 64, 351–362. [Google Scholar] [CrossRef]
  9. Son, J.; Yu, Q.; Seo, J.S. Sarcopenic obesity can be negatively associated with active physical activity and adequate intake of some nutrients in Korean elderly: Findings from the Korea National Health and Nutrition Examination Survey (2008–2011). Nutr. Res. Pract. 2019, 13, 47–57. [Google Scholar] [CrossRef]
  10. Mochamat; Cuhls, H.; Marinova, M.; Kaasa, S.; Stieber, C.; Conrad, R.; Radbruch, L.; Mucke, M. A systematic review on the role of vitamins, minerals, proteins, and other supplements for the treatment of cachexia in cancer: A European Palliative Care Research Centre cachexia project. J. Cachexia Sarcopenia Muscle 2017, 8, 25–39. [Google Scholar]
  11. Penna, F.; Camperi, A.; Muscaritoli, M.; Filigheddu, N.; Costelli, P. The role of vitamin D in cancer cachexia. Curr. Opin. Support. Palliat Care 2017, 11, 287–292. [Google Scholar] [CrossRef]
  12. Mori, T.; Ohmori, H.; Luo, Y.; Mori, S.; Miyagawa, Y.; Nukaga, S.; Goto, K.; Fujiwara-Tani, R.; Kishi, S.; Sasaki, T.; et al. Giving combined medium-chain fatty acids and glucose protects against cancer-associated skeletal muscle atrophy. Cancer Sci. 2019, 110, 3391–3399. [Google Scholar] [CrossRef]
  13. Nukaga, S.; Mori, T.; Miyagawa, Y.; Fujiwara-Tani, R.; Sasaki, T.; Fujii, K.; Mori, S.; Goto, K.; Kishi, S.; Nakashima, C.; et al. Combined administration of lauric acid and glucose improved cancer-derived cardiac atrophy in a mouse cachexia model. Cancer Sci. 2020, 111, 4605. [Google Scholar] [CrossRef]
  14. Ortega, R.M.; Jiménez Ortega, A.I.; Perea Sánchez, J.M.; Cuadrado Soto, E.; Aparicio Vizuete, A.; López-Sobaler, A.M. Nutritional value of dairy products and recommended daily consumption. Nutr. Hosp. 2019, 36, 25–29. [Google Scholar] [CrossRef] [Green Version]
  15. Gil, Á.; Ortega, R.M. Introduction and Executive Summary of the Supplement, Role of Milk and Dairy Products in Health and Prevention of Noncommunicable Chronic Diseases: A Series of Systematic Reviews. Adv. Nutr. 2019, 10 (Suppl. S2), S67–S73. [Google Scholar] [CrossRef]
  16. Saedisomeolia, A.; Ashoori, M. Riboflavin in Human Health: A Review of Current Evidences. Adv. Food Nutr. Res. 2018, 83, 57–81. [Google Scholar]
  17. Bémeur, C.; Butterworth, R.F. Nutrition in the management of cirrhosis and its neurological complications. J. Clin. Exp. Hepatol. 2014, 4, 141–150. [Google Scholar] [CrossRef] [PubMed] [Green Version]
  18. Mishanina, T.V.; Kohen, A. Synthesis and application of isotopically labeled flavin nucleotides. J. Label. Comp. Radiopharm. 2015, 58, 370–375. [Google Scholar] [CrossRef] [Green Version]
  19. Molano-Arevalo, J.C.; Hernandez, D.R.; Gonzalez, W.G.; Miksovska, J.; Ridgeway, M.E.; Park, M.A.; Fernandez-Lima, F. Flavin adenine dinucleotide structural motifs: From solution to gas phase. Anal. Chem. 2014, 86, 10223–10230. [Google Scholar] [CrossRef] [Green Version]
  20. Giancaspero, T.A.; Busco, G.; Panebianco, C.; Carmone, C.; Miccolis, A.; Liuzzi, G.M.; Colella, M.; Barile, M. FAD synthesis and degradation in the nucleus create a local flavin cofactor pool. J. Biol. Chem. 2013, 288, 29069–29080. [Google Scholar] [CrossRef] [Green Version]
  21. Etchegaray, J.P.; Mostoslavsky, R. Interplay between Metabolism and Epigenetics: A Nuclear Adaptation to Environmental Changes. Mol. Cell 2016, 62, 695–711. [Google Scholar] [CrossRef] [Green Version]
  22. Niki, E.; Traber, M.G. A history of vitamin E. Ann. Nutr. Metab. 2012, 61, 207–212. [Google Scholar] [CrossRef]
  23. Jiang, Q. Natural Forms of Vitamin E as Effective Agents for Cancer Prevention and Therapy. Adv. Nutr. 2017, 8, 850–867. [Google Scholar] [CrossRef]
  24. Chung, E.; Mo, H.; Wang, S.; Zu, Y.; Elfakhani, M.; Rios, S.R.; Chyu, M.C.; Yang, R.S.; Shen, C.L. Potential roles of vitamin E in age-related changes in skeletal muscle health. Nutr. Res. 2018, 49, 23–36. [Google Scholar] [CrossRef] [PubMed]
  25. Terawaki, K.; Sawada, Y.; Kashiwase, Y.; Hashimoto, H.; Yoshimura, M.; Suzuki, M.; Miyano, K.; Sudo, Y.; Shiraishi, S.; Higami, Y.; et al. New cancer cachexia rat model generated by implantation of a peritoneal dissemination-derived human stomach cancer cell line. Am. J. Physiol. Endocrinol. Metab. 2014, 306, E373–E387. [Google Scholar] [CrossRef] [Green Version]
  26. Pin, F.; Barreto, R.; Kitase, Y.; Mitra, S.; Erne, C.E.; Novinger, L.J.; Zimmers, T.A.; Couch, M.E.; Bonewald, L.F.; Bonetto, A. Growth of ovarian cancer xenografts causes loss of muscle and bone mass: A new model for the study of cancer cachexia. J. Cachexia Sarcopenia Muscle 2018, 9, 685–700. [Google Scholar] [CrossRef] [Green Version]
  27. Sasaki, T.; Yoshida, K.; Kondo, H.; Ohmori, H.; Kuniyasu, H. Heme oxygenase-1 accelerates protumoral effects of nitric oxide in cancer cells. Virchows. Arch. 2005, 446, 525–531. [Google Scholar] [CrossRef] [PubMed]
  28. Kusume, A.; Sasahira, T.; Luo, Y.; Isobe, M.; Nakagawa, N.; Tatsumoto, N.; Fujii, K.; Ohmori, H.; Kuniyasu, H. Suppression of dendritic cells by HMGB1 is associated with lymph node metastasis of human colon cancer. Pathobiology 2009, 76, 155–162. [Google Scholar] [CrossRef]
  29. Ejma, M.; Madetko, N.; Brzecka, A.; Guranski, K.; Alster, P.; Misiuk-Hojło, M.; Somasundaram, S.G.; Kirkland, C.E.; Aliev, G. The Links between Parkinson’s Disease and Cancer. Biomedicines 2020, 8, 416. [Google Scholar] [CrossRef] [PubMed]
  30. Gibellini, L.; Losi, L.; De Biasi, S.; Nasi, M.; Lo Tartaro, D.; Pecorini, S.; Patergnani, S.; Pinton, P.; De Gaetano, A.; Carnevale, G.; et al. LonP1 Differently Modulates Mitochondrial Function and Bioenergetics of Primary Versus Metastatic Colon Cancer Cells. Front. Oncol. 2018, 8, 254. [Google Scholar] [CrossRef]
  31. García-Bermúdez, J.; Cuezva, J.M. The ATPase Inhibitory Factor 1 (IF1): A master regulator of energy metabolism and of cell survival. Biochim. Biophys. Acta 2016, 1857, 1167–1182. [Google Scholar] [CrossRef]
  32. Mikkelsen, K.; Prakash, M.D.; Kuol, N.; Nurgali, K.; Stojanovska, L.; Apostolopoulos, V. Anti-Tumor Effects of Vitamin B2, B6 and B9 in Promonocytic Lymphoma Cells. Int. J. Mol. Sci. 2019, 20, 3763. [Google Scholar] [CrossRef] [PubMed] [Green Version]
  33. Sylvester, P.W. Vitamin E and apoptosis. Vitam. Horm. 2007, 76, 329–356. [Google Scholar] [PubMed]
  34. Zingg, J.M. Vitamin E: Regulatory Role on Signal Transduction. IUBMB Life 2019, 71, 456–478. [Google Scholar] [CrossRef]
  35. Araki, S.; Suzuki, M.; Fujimoto, M.; Kimura, M. Enhancement of resistance to bacterial infection in mice by vitamin B2. J. Vet. Med. Sci. 1995, 57, 599–602. [Google Scholar] [CrossRef] [Green Version]
  36. Mazur-Bialy, A.I.; Pochec, E.; Plytycz, B. Immunomodulatory effect of riboflavin deficiency and enrichment—Reversible pathological response versus silencing of inflammatory activation. J. Physiol. Pharm. 2015, 66, 793–802. [Google Scholar]
  37. Ahn, H.; Lee, G.S. Riboflavin, vitamin B2, attenuates NLRP3, NLRC4, AIM2, and non-canonical inflammasomes by the inhibition of caspase-1 activity. Sci. Rep. 2020, 10, 19091. [Google Scholar] [CrossRef]
  38. Dey, S.; Bishayi, B. Riboflavin along with antibiotics balances reactive oxygen species and inflammatory cytokines and controls Staphylococcus aureus infection by boosting murine macrophage function and regulates inflammation. J. Inflamm. 2016, 13, 36. [Google Scholar] [CrossRef] [Green Version]
  39. Singh, U.; Jialal, I. Anti-inflammatory effects of alpha-tocopherol. Ann. N. Y. Acad. Sci. 2004, 1031, 195–203. [Google Scholar] [CrossRef]
  40. Shklar, G.; Schwartz, J.L.; Trickler, D.P.; Reid, S. Prevention of experimental cancer and immunostimulation by vitamin E (immunosurveillance). J. Oral. Pathol. Med. 1990, 19, 60–64. [Google Scholar] [CrossRef]
  41. Shklar, G.; Schwartz, J. Tumor necrosis factor in experimental cancer regression with alphatocopherol, beta-carotene, canthaxanthin and algae extract. Eur. J. Cancer Clin. Oncol. 1988, 24, 839–850. [Google Scholar] [CrossRef]
Figure 1. Effect of VB2 and VE on cell growth, mitochondrial activity, and stemness in CT26 colon cancer cells. CT26 cells were treated with VB2 (50 μg/mL) or VE (800 μg/mL) for 48 h. (A) Cell numbers; (B) mRNA expression of genes associated with oxidative stress (HO-1), mitochondrial quality control (PARKIN, PINK1, LONP1, IF1), and stemness (CD44, NS); (C) Semi-quantification of mRNA expression of mitochondrial quality control-associated genes; (D) Intracellular ATP and 4-HNE; (E) Semi-quantification of mRNA expression of stemness-associated genes; (F) Sphere assay after treatment with VB2 (50 μg/mL) or VE (800 μg/mL) for 7 days; (G) Evaluation of apoptosis; (H) BrdU intake for cell proliferation. Error bars indicate standard deviation from three independent examinations. Statistical differences were calculated by ordinary analysis of variance. VB2, vitamin B2; VE, vitamin E; HO-1, heme oxidase-1; PARK, parkin; PINK1, PTEN-induced kinase-1; LONP, LON protease-1; IF1, inhibitor of F1; NS, nucleostemin; GAPDH, glyceraldehyde-3-phosphate dehydrogenase; ATP: adenosine triphosphate; 4-HNE, 4-hydroxynonenal.
Biomed 01 00004 g001
Figure 2. Effect of VB2 and VE on cell growth and muscle maturation in C2C12 myoblast cells. C2C12 cells were treated with VB2 (50 μg/mL) or VE (800 μg/mL) for 48 h. (A) Cell number; (B) Intracellular concentrations of SDS-MYL1 and MYH for skeletal muscle maturation; (C) Myotube formation was induced with insulin (1 mg/mL) in high glucose (450 mg/mL) DMEM for 6 days (D) Intracellular ATP and 4-HNE. Error bars indicate standard deviation from three independent examinations. Statistical differences were calculated by ordinary analysis of variance. VB2, vitamin B2; VE, vitamin E; SDS-MYL1, SDS-soluble myosin light chain-1; MYH, myosin heavy chain; 4-HNE, 4-hydroxynonenal.
Biomed 01 00004 g002
Figure 3. Effect of VB2 and VE on tumor growth of CT26 cells in mice. CT26 cells were inoculated in the peritoneal cavity (peritoneal model) or subcutaneous tissue (subcutaneous model). Mice were fed with a CE-2 diet or experimental diets: VB2 diet (50 mg/kg/day) or VE diet (800 mg/kg/day). (A) Body weight of mice in the peritoneal model; (B) Body weight of mice in the subcutaneous model; (C) Tumor weight; (DF) Levels of 4-HNE (D), ATP (E), and CD44 (F) in tumors assessed by ELISA. Error bars indicate standard deviation from three independent examinations. Statistical differences were calculated by ordinary analysis of variance. VB2, vitamin B2; VE, vitamin E; 4-HNE, 4-hydroxynonenal.
Biomed 01 00004 g003
Figure 4. Effect of VB2 and VE on skeletal muscle in CT26-inoculated mice. CT26 cells were inoculated in the peritoneal cavity (peritoneal model) or subcutaneous tissue (subcutaneous model). Mice were fed with a CE-2 diet or experimental diets: VB2 diet (50 mg/kg/day) or VE diet (800 mg/kg/day). (A) Wet weight of Table 1 levels in the muscle; (B) SDS-MYL1 was examined as muscle maturity. Error bars indicate standard deviation from three independent examinations. Statistical differences were calculated by ordinary analysis of variance. VB2, vitamin B2; VE, vitamin E; SDS-MYL1, SDS-soluble myosin light chain-1.
Biomed 01 00004 g004
Figure 5. Effect of VB2 and VE on immune cells. (A) Macrophage polarization in CT26 tumors. The following markers were used: CD68 for general macrophage, Batf2 for M1 macrophage, and Fizz1 for M2 macrophage; (BD) Serous concentrations of NO (B), mouse TNFα (C), and HMGB1 (D) in CT26-inoculated mice; (E,F) Peritoneal macrophages collected from BALB/c mice were treated with 20% CT26 cell cultured medium or 20% macrophage cultured medium in regular DMEM for 48 h. Concentrations of NO (E) and TNFα (F) in the medium were examined. Error bars indicate standard deviation from three independent examinations. Statistical difference was calculated by ordinary analysis of variance. Peritoneal, peritoneal inoculation mode; subcutaneous, subcutaneous inoculation model; VB2, vitamin B2; VE, vitamin E; Batf2, basic leucine zipper transcription factor, ATF-like 2; Fizz1, parasite-induced macrophage novel gene 1 protein; BACT, β-actin; NO, nitric oxide; TNF, tumor necrosis factor; HMGB, high mobility group B.
Biomed 01 00004 g005
Table 1. Primer sets for RT-PCR.
Gene NameGene SymbolGenBank ID Primer Sequence
Heme oxygenase-1HO-1NM_010442.2UCACGCATATACCCGCTACCT
LCCAGAGTGTTCATTCGAGCA
E3 ubiquitin-protein ligase PARKINAB019558.1UTGGAAAGCTCCGAGTTCAGT
parkin LCCTTGTCTGAGGTTGGGTGT
PTEN-induced kinase-1PINK1NM_026880.2UCCCACACCCTAACATCATCC
LACTGGGAGTCTGCTCCTCAA
LON protease-1LONP1NM_028782.2UGACAGAGAACCCGCTAGTGC
LCTCAGTGGTTCTGGGATGGT
Inhibitor of F1IF1AF002718.1UTCTGGGGTATGAAGGTCCTG
LTCGAATGGTGGTCAATCTCA
CD44CD44M27130.1UTGGATCCGAATTAGCTGGAC
LAGCTTTTTCTTCTGCCCACA
NucleosteminNSBC037996.1UATGTGGGGAAAAGCAGTGTC
LTGGGGGAGTTACAAGGTGAG
Glyceraldehyde-3-phosphate dehydrogenaseGAPDHNM_001289726.1UAACTTTGGCATTGTGGAAGG
LACACATTGGGGGTAGGAACA
CD68CD68BC021637.1UTTCTGCTGTGGAAATGCAAG
LAGAGGGGCTGGTAGGTTGAT
Basic leucine zipper transcription factor, ATF-like 2Batf2BC024521.1UAGCACGAATCCTTGGAGAAA
LGTTCCTGGCAGCCATTGTAT
Parasite-induced macrophage novel gene 1 proteinFizz1AF316397.2UCCCTTCTCATCTGCATCTCC
LCAGTAGCAGTCATCCCAGCA
β-actinBACTNM_007393.5UACAATGAGCTGCGTGTGGCC
LAGGGACAGCACAGCCTGGAT
Publisher’s Note: MDPI stays neutral with regard to jurisdictional claims in published maps and institutional affiliations.

