Entry

Two Geophysical Technologies Used in Archaeological Research Simplified and Explained

Department of Civil and Environmental Engineering and Science, Duquesne University, Pittsburgh, PA 15282, USA
Encyclopedia 2025, 5(3), 151; https://doi.org/10.3390/encyclopedia5030151
Submission received: 6 June 2025 / Revised: 10 September 2025 / Accepted: 11 September 2025 / Published: 15 September 2025
(This article belongs to the Section Earth Sciences)

Definition

The geophysical techniques ground penetrating radar (GPR) and electrical resistivity tomography (ERT) are commonly used data collection methodologies in numerous disciplines, including archaeology. Many researchers are now, or will be in the future, associated with projects that use these geophysical techniques, but who are not well versed in the instrumentation, its function, related terminology, data interpretation, and outcomes. This entry outlines the general approach and background for completing this type of research, dissects the methodology from a completed geoarchaeological project that uses both GPR and ERT, and provides concise definitions and explanations for all facets of the methodology. Based on this methodology, 21 terms or concepts related to GPR are explained in detail, as are 26 terms or concepts related to ERT, and visual representations of some of the terms and concepts are further illuminated via 11 figures. There are also 133 references linked to the various concepts and terms presented in this entry.

1. Introduction

Geophysics is a non-intrusive, non-destructive way to study the Earth’s physical properties and processes by interpreting quantitative data collected using seismic, gravity, magnetic, electromagnetic, and electrical measurements to understand the Earth’s structure, composition, and dynamics [1]. The geophysical technologies associated with these methods are used in a variety of disciplines, which include, but are not limited to, archaeology, civil engineering, natural and geologic hazard mitigation, geologic mapping, hydrogeology (contaminant plume mapping, groundwater management), environmental assessment (monitoring, impact), forensic science, locating and recovering resources, and seismic studies. This entry focusses on archaeological geophysics, which is a growing area of research that uses, among various geophysical technologies, ground penetrating radar (GPR) and electrical resistivity tomography (ERT) for the non-invasive, non-destructive investigation of near-surface environments. These methods are complementary to archaeological research because they assist with interpreting stratigraphy, the physical properties of near-surface materials, anthropogenic change, and spatial dimensional data [2].
Archaeological studies are concerned with the near-surface stratigraphy of soils and sediments present at archaeologic sites, within which objects/artifacts, now often referred to as material culture, are buried [3]. The formation of culturally influenced landscapes disrupts natural stratigraphic patterns in near-surface materials, and the nature and form of these disturbances aid archaeologists with linking the current landscape with past human activities [4]. Quantifying the physical characteristics of soils provides important information about the soil’s genesis, morphology, and classification, and also its texture, structure, consistency, plasticity, bulk density, porosity, and permeability [5]. These soil physical characteristics in turn affect the soil’s available water-holding capacity (AWHC), which influences GPR and ERT signal penetration depth, with dry, sandy soils allowing signals to penetrate deeper, while moisture-laden or saturated soils limit resistivity and thus the depth of signal penetration [6].
In recent years, archaeology has developed an approach to investigating interactions between people and their environments. A large and growing database on the cumulative impact of humans on the global environment, over a variety of timescales, now exists [7]. Much attention is now given to the integration of different geophysical techniques in order to obtain detailed interpretations to characterize archaeological constructions and artifacts [8]. Interdisciplinary collaboration enhances the investigation of archaeological sites, thus broadening the understanding of the linkages between past landscapes, people, and material culture [9].
Efforts at assessing and analyzing the spatial dimension of archaeological sites have been improved because of advances in digital technology, like geographic information systems (GIS), and electromagnetic (GPR) and electrical geophysical techniques (ERT). These advances have influenced the way archaeological data are collected in the field and subsequently processed, analyzed, and interpreted [10]. Research designs in archaeological research that include GPR and ERT methodologies can utilize sample designs that are stratified, sequential, adaptive, or non-geometric. Combining these sample designs, and GPR and ERT methodologies, with spatial analysis provides a more complete view of the spatial dimension of the collected data [11].
In the GPR and ERT Methods section below, some details related to the main companies that manufacture the instrumentation used to collect GPR and ERT data are discussed. This is followed by an explanation of the logistics and processes involved in collecting GPR and ERT data, the types of results that are generated, and how these data are interpreted. Next, a detailed GPR and ERT methodology from a published study is presented. This methodology is dissected, and the terms and concepts related to GPR and ERT data collection and processing are explained in detail in the Explanation of Terms and Concepts section. References are provided for the terms and concepts, which link to citations in the References section, and when appropriate, visual depictions are provided. The Summary, Conclusions, and Prospects section provide a summation of the most salient points presented in this entry, and it looks towards continued expansion of cross-disciplinary research utilizing geophysics in archaeological studies.

2. GPR and ERT Methods

2.1. Instrumentation

Geophysical instruments can detect buried archaeological features, with detectability dependent on the contrast between the feature and the surrounding materials, depth below the surface, and the geophysical technique that is being used. Each geophysical technique measures a different geophysical property or measures similar properties but in a different way [12]. GPR and ERT are two of the most common geophysical techniques used in archaeological research. There are numerous manufacturers of GPR and ERT systems used in archaeological research. Three manufacturers of GPR and ERT systems are discussed below. Each brief overview is extracted from the manufacturer’s website, and it links to the References section of this entry, where a link to that website is provided. The product and application descriptions are somewhat similar for the different manufacturers, but the specific details provided on a manufacturer’s website assist in differentiating the specific operational and technical details for each.

2.1.1. Ground Penetrating Radar (GPR) Systems

  • Sensors and Software Inc., located in Mississauga, Ontario, Canada, is a recognized worldwide company that designs and manufacturers GPR instrumentation and software for numerous applications that include locating buried utilities, and numerous engineering applications like concrete scanning, structural assessment, mining, and quarrying. Their systems are also used in forensics, geology, geotechnical and environmental assessment, glaciology, agriculture, unexploded ordnance (UXO) detection, and archaeology [13]. The methodology associated with using a Sensors and Software pulseEKKO™ system, as part of an archaeological study, is outlined in Appenidx A, of this entry, because this system was used to collect GPR data in the examples provided in this entry.
  • Geophysical Survey Systems, Inc. located in Nashua, NH, USA, designs and builds GPR tools that are used in engineering applications like checking the structural health of roads, bridges, and skyscrapers. Additionally, their systems are used for locating buried utilities; hydrogeological investigations; geological investigations and mapping; forensics applications like evidence and clandestine grave location; archaeological excavation planning; cemetery mapping; and cultural resource management [14].
  • Guideline Geo, whose global headquarters are located in Stockholm, Sweden, is a global geophysics and geotechnology company that offers GPR sensors, software, services, and support needed to map and visualize the subsurface. It provides complete solutions and applications in four key growth areas, which include detecting and mapping groundwater; environmental and geological risk assessments; infrastructural site investigations; and mineral exploration. Guideline Geo acquired MALÅ Imaging Radar Array (MIRA) systems, which was originally located in Malå, Sweden, which is a technically advanced one-pass 3D GPR system for large-scale mapping and subsurface object identification [15].

2.1.2. Electrical Resistivity Tomography (ERT) Systems

  • Guideline Geo, as noted above, is a geotechnology company that offers sensors, software, services, and support to map and visualize the subsurface using GPR and ERT. In the 1990’s they acquired the Swedish company ABEM (Aktiebolaget Elektrisk Malmletning), which is a pioneer in geophysical solutions for resource and infrastructural development using resistivity, induced polarization, electromagnetics, and seismic studies. Areas of emphasis for this instrumentation include groundwater mapping, mineral exploration, and engineering and infrastructure site investigations [16]. The methodology associated with using an ABEM Terrameter LS system, as part of an archaeological study, is part of Appendix B, of this entry because, this system was used to collect ERT data in the examples provided in this entry.
  • Advanced Geoscience Incorporated (AGI), located in Austin, TX USA, is the leading developer and manufacturer of electrical resistivity, induced polarization (IP), and self-potential (SP) systems used to explore the subsurface, primarily by measuring the electrical properties of the earth’s materials. Resistivity measures the resistance of the ground to electrical current, while IP and SP measure the electrical response of the ground to applied or natural electrical fields. AGI ERT systems are used for siting groundwater wells, monitoring groundwater pollution plumes, finding caves and sinkholes, monitoring landslides, finding economic minerals, and exploring archaeological sites [17].
  • Zonge International, located in Reno, NV USA, provides geophysical equipment to geoscientists worldwide for use in exploration, environmental, and geotechnical surveys. Both resistivity (ERT) and induced polarization (IP) geophysical survey methods are used to reveal variations in, for example, fluid saturation, fluid resistivity, rock type, porosity, and permeability. This data can be used to delineate aggregate deposits for quarries, estimate depth to bedrock and the water table, detect and map geologic features, and define mining and archaeological targets [18].

2.2. Collection of GPR Data

GPR data can be collected via transects or grids. Transects are single lines along which data are collected. Multiple transect lines can be closely spaced (0.5 m or less between transect lines), forming one axis of a grid. Figure 1 shows GPR data being collected in one direction along transect lines that are marked by multiple fiberglass survey tapes, which are spaced 0.5 m apart. Placing lines perpendicular to these transect lines, that intersect at right angles, would form the x axis of a grid, with the perpendicular lines forming the Y axis (Figure 1). Prior knowledge of the history of a data collection location, and the intended purpose of the data collection, often influences whether data is collected along individual transects, numerous parallel transect lines, or via grids. Data collection along only a single transect line or widely spaced lines usually occurs as part of initial reconnaissance of a study site, wherein a general understanding of the subsurface directly under the transect line is the desired aim. These results influence whether multiple transect lines are placed parallel to each other, like in Figure 1.
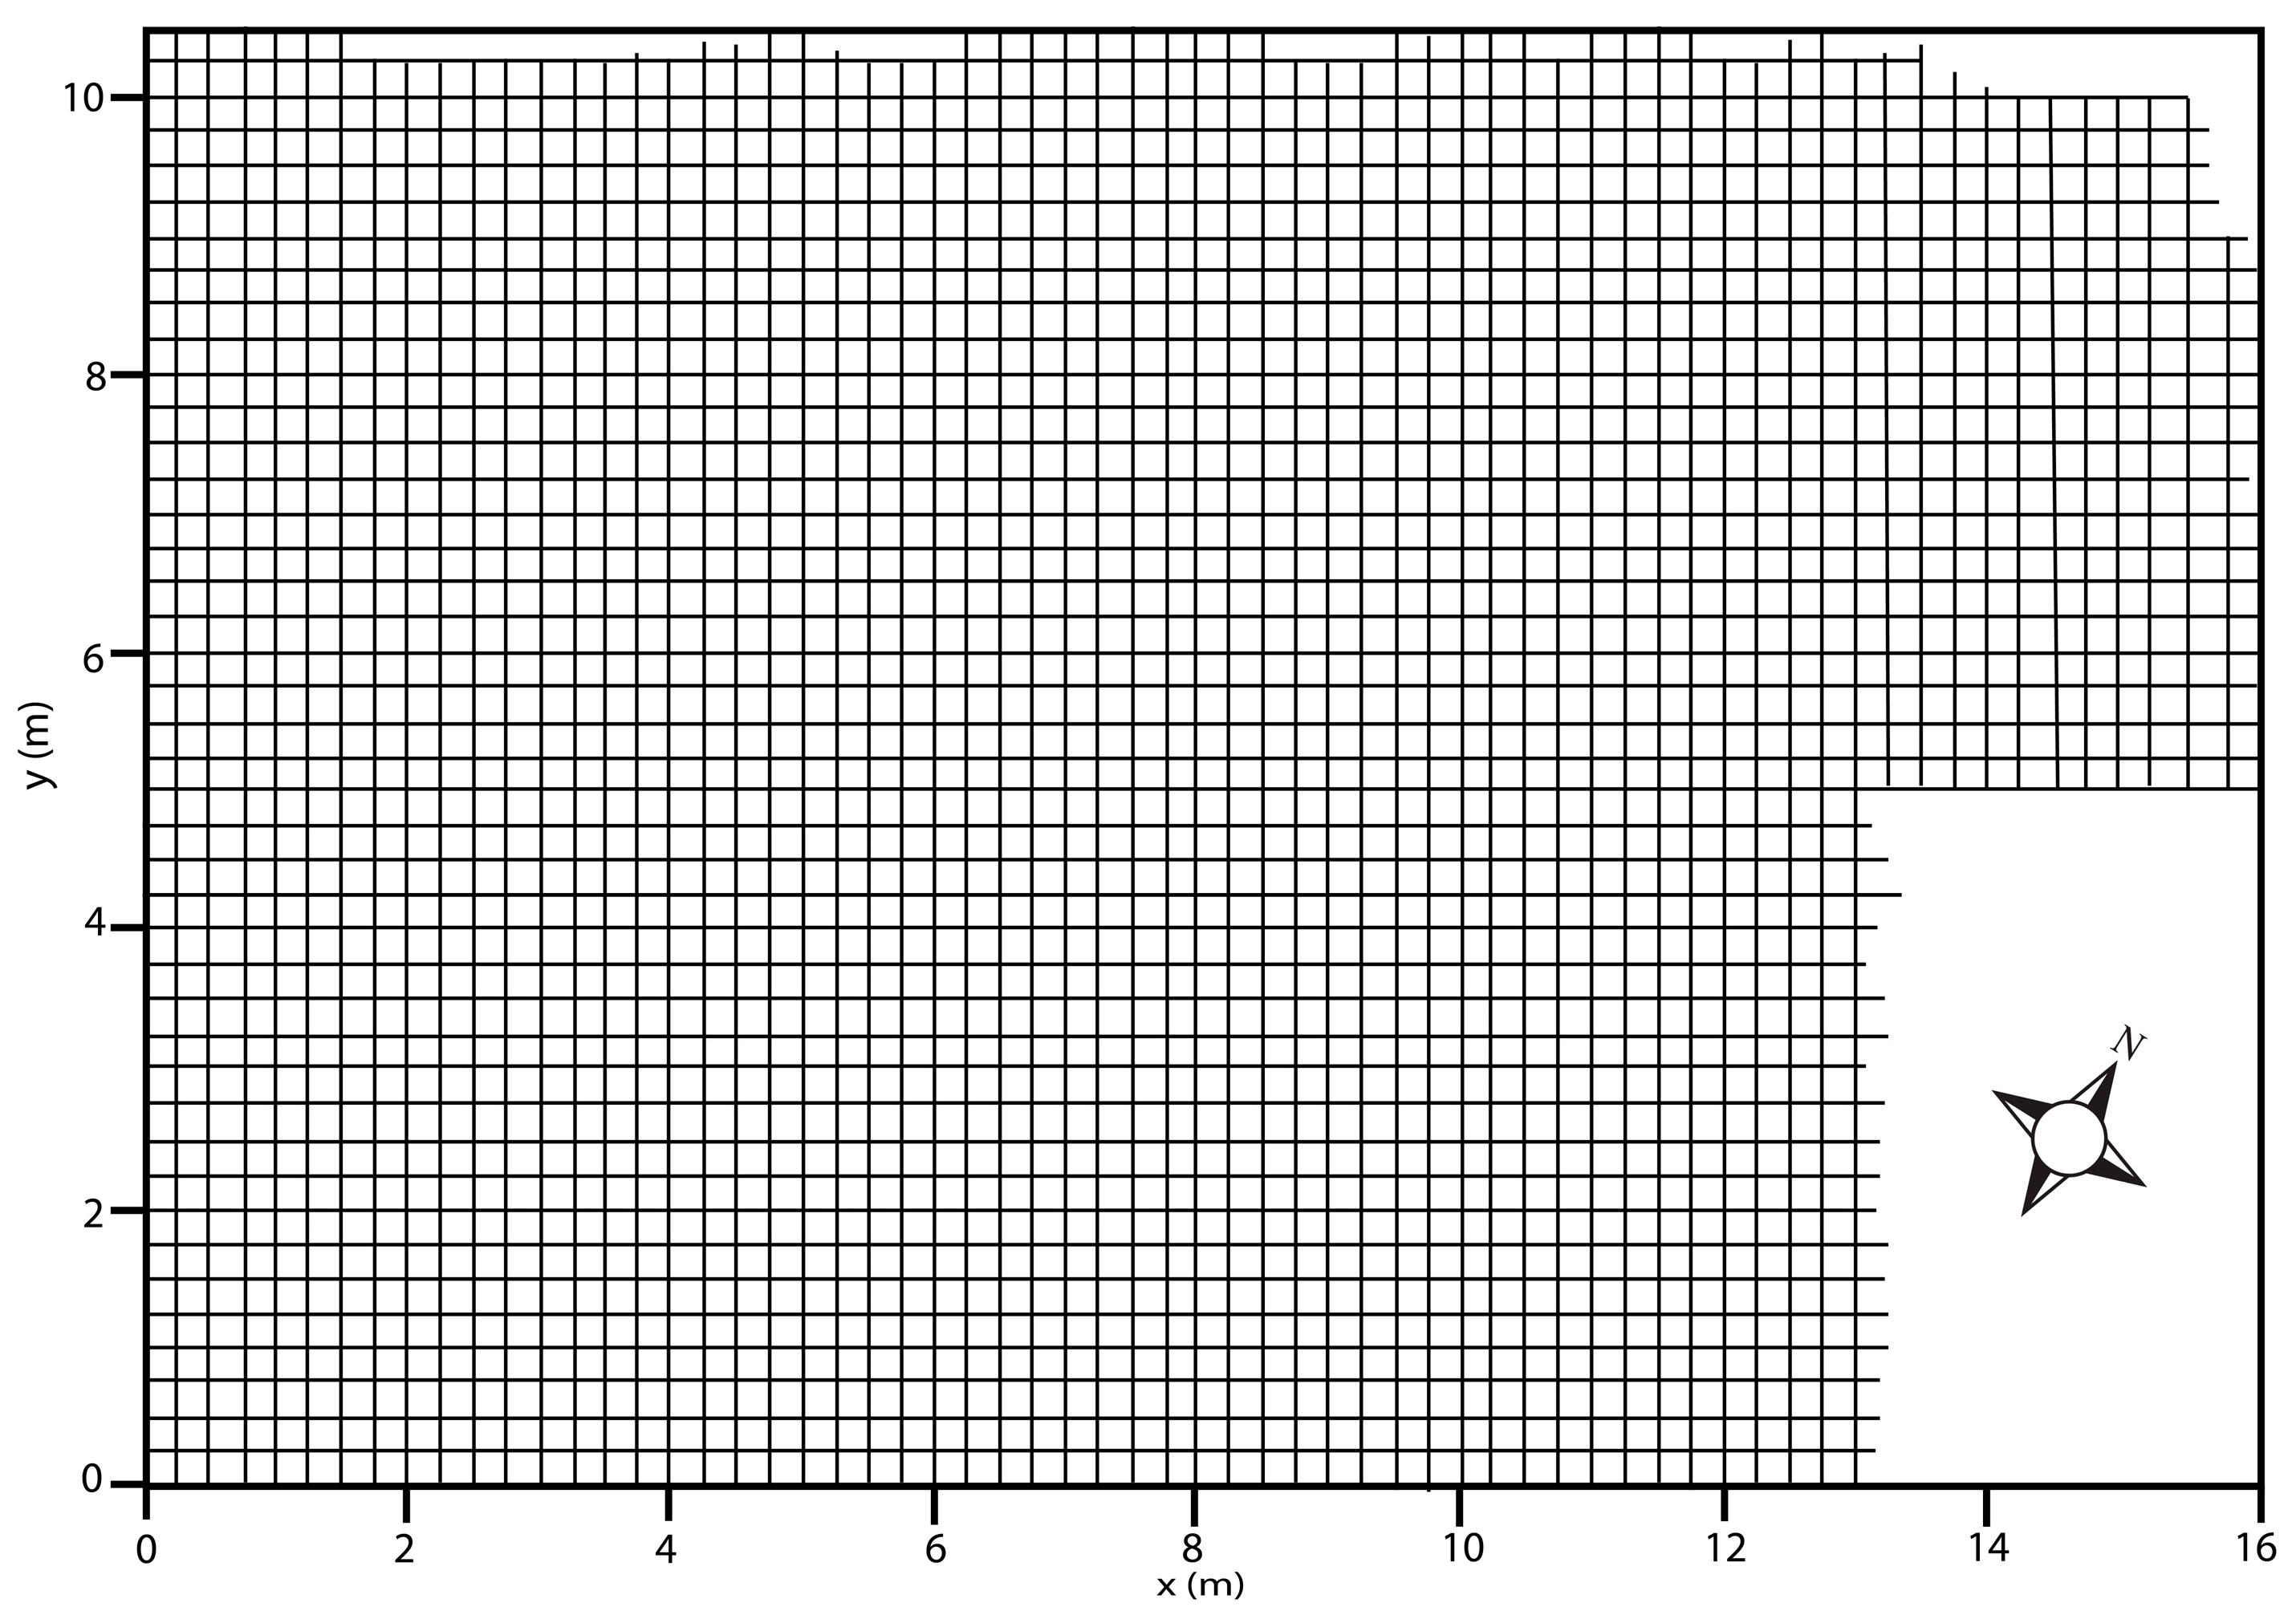
The determination of whether data is collected along both the x and y axes of a grid is based on several factors, which include the time available for data collection, the known history of the site, and the desired outcome. Data collection times from closely spaced gridlines depend on the length of the transect lines that make up the grid, groundcover, and the local terrain. Over essentially flat, grassy terrain, to collect data from a 20 × 20 m grid, in both the x and y directions, with the data collected with a spacing of 0.25 m within the grid, can take six hours or more. Within an archaeological context, the known history of a site is important because it assists with deciding whether to invest the extra time to collect data in both the x and y directions. If information about the history and possible buried features at the site is known, and one-directional transect lines are located and orientated to pass over possible buried features, the collected data may be adequate to successfully image those features [19]. If the desired results are not obtained, then the existing transect lines can become part of an x-y grid. Figure 2 depicts an x-y grid that was created as part of research conducted at the Rasu Street Prison in Vilnius, Lithuania [20]. The grid is 10.5 m in length along the y axis, and 16.0 m along the x axis. Data were collected along transect lines within the grid that were 0.25 m apart, and hence there were 6 lines along the x axis, and 42 lines along the y axis (Figure 2). The lines within the grid do not traverse the entire extent of the grid in the southeast corner because a building is present at that location. A wall with recessed sections is located on the northwest side of the grid along the x axis, and an irregular wall intersects the northeast side along the y axis.
A 14 m × 16.5 m grid, with transect lines 0.25 m apart, created at the remains of the Kahal Grande Synagogue in Rhodes, Greece, illustrates the placement of a grid amongst archaeological remains (Figure 3). After interpreting the data collected south to north along 34 transect lines along the y axis, it was decided to create a grid and collect data from west to east from an additional 28 lines along the y axis, which were again spaced 0.25 m apart. The results obtained from the three-dimensional x-y grid indicated several possible excavation targets.

GPR Data Collection System and Results

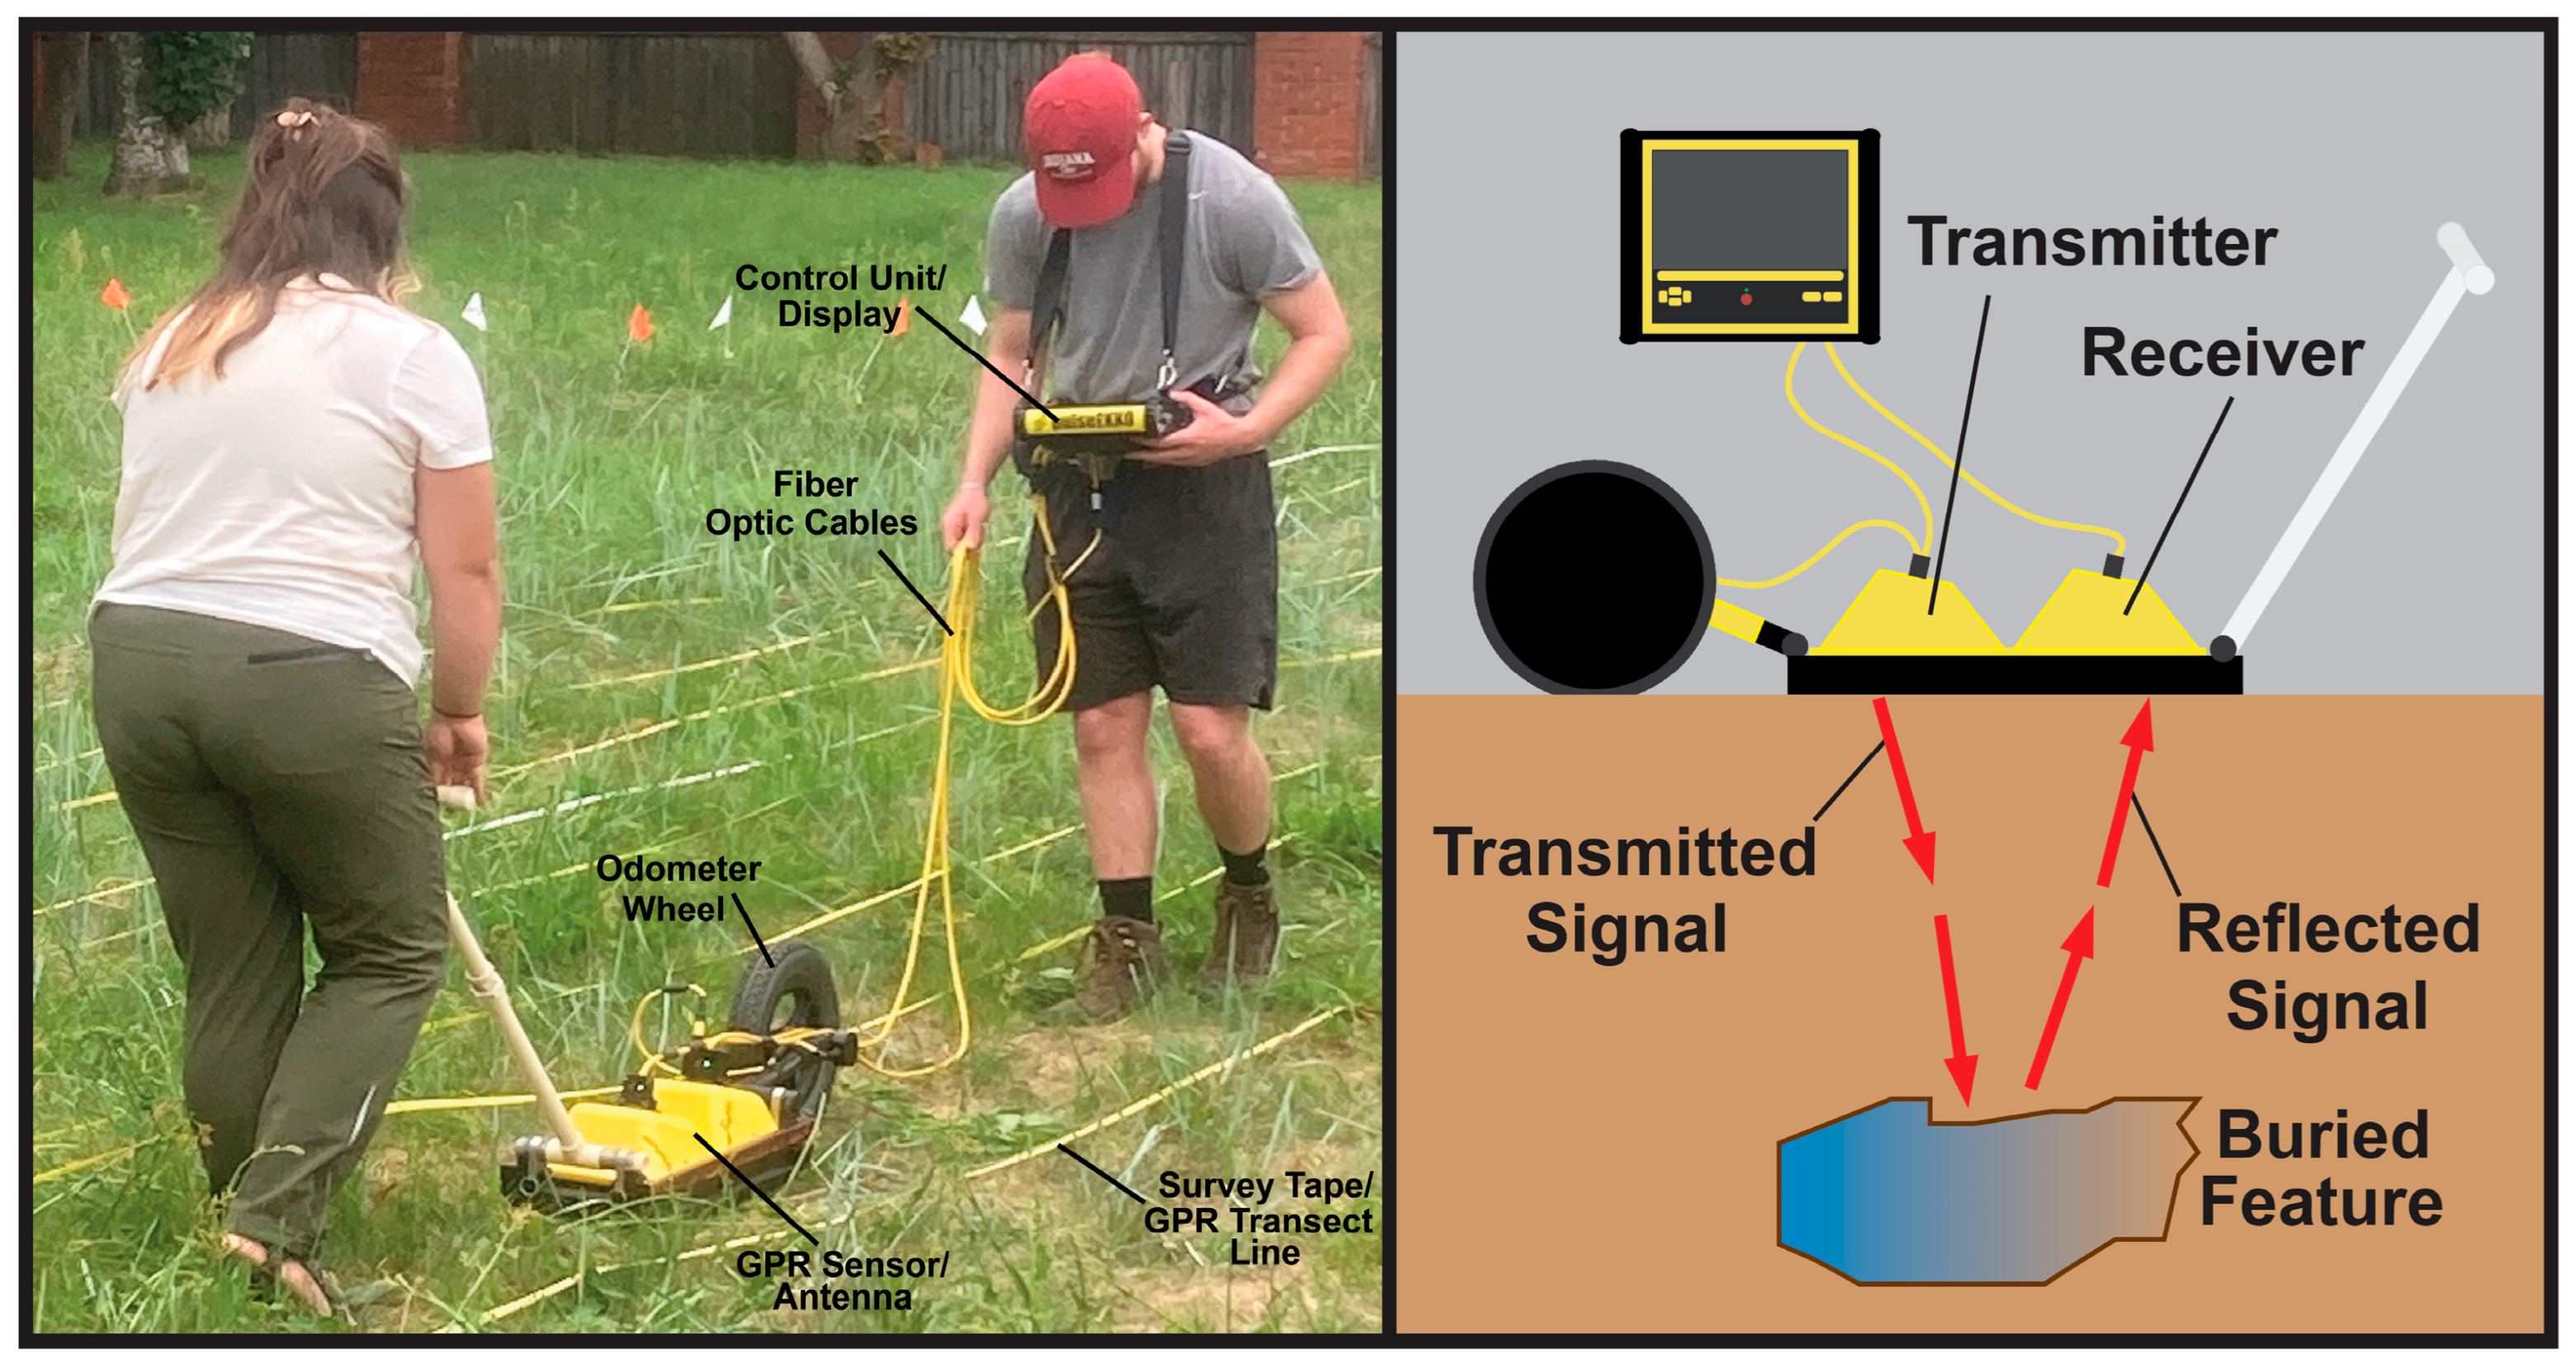
As already established, there are numerous manufacturers of GPR systems that are used in archaeological research. Three of these were previously discussed in Section 2.1, Section 2.1.1. One of these systems, the Sensors and Software pulseEKKO™ system, is used as an example, and it is discussed in detail below. Two persons are generally required to operate this system (Figure 4), although a single operator can also collect data. In the two-operator scenario, one of the operators pulls the GPR system, which consists of the GPR sensor and antenna, along the ground parallel to survey tapes laid on the land surface to mark the locations of the various transect lines. The other operator holds the control/display unit, following the path of the GPR system, and controlling the operations that are part of the data collection process. The GPR sensor/antenna is connected to the control unit via fiber optic cables. An odometer wheel is affixed to the sensor/antenna unit, which, by way of the rotation of the wheel, controls when the GPR signal is emitted into the ground. In an archaeological context, the transmitted signal will interact with any buried structures, objects, or artifacts it encounters, effectively reflecting the signal back to the receiver portion of the system. Interpretation of these reflection patterns can assist archaeologists with designating possible excavation targets.
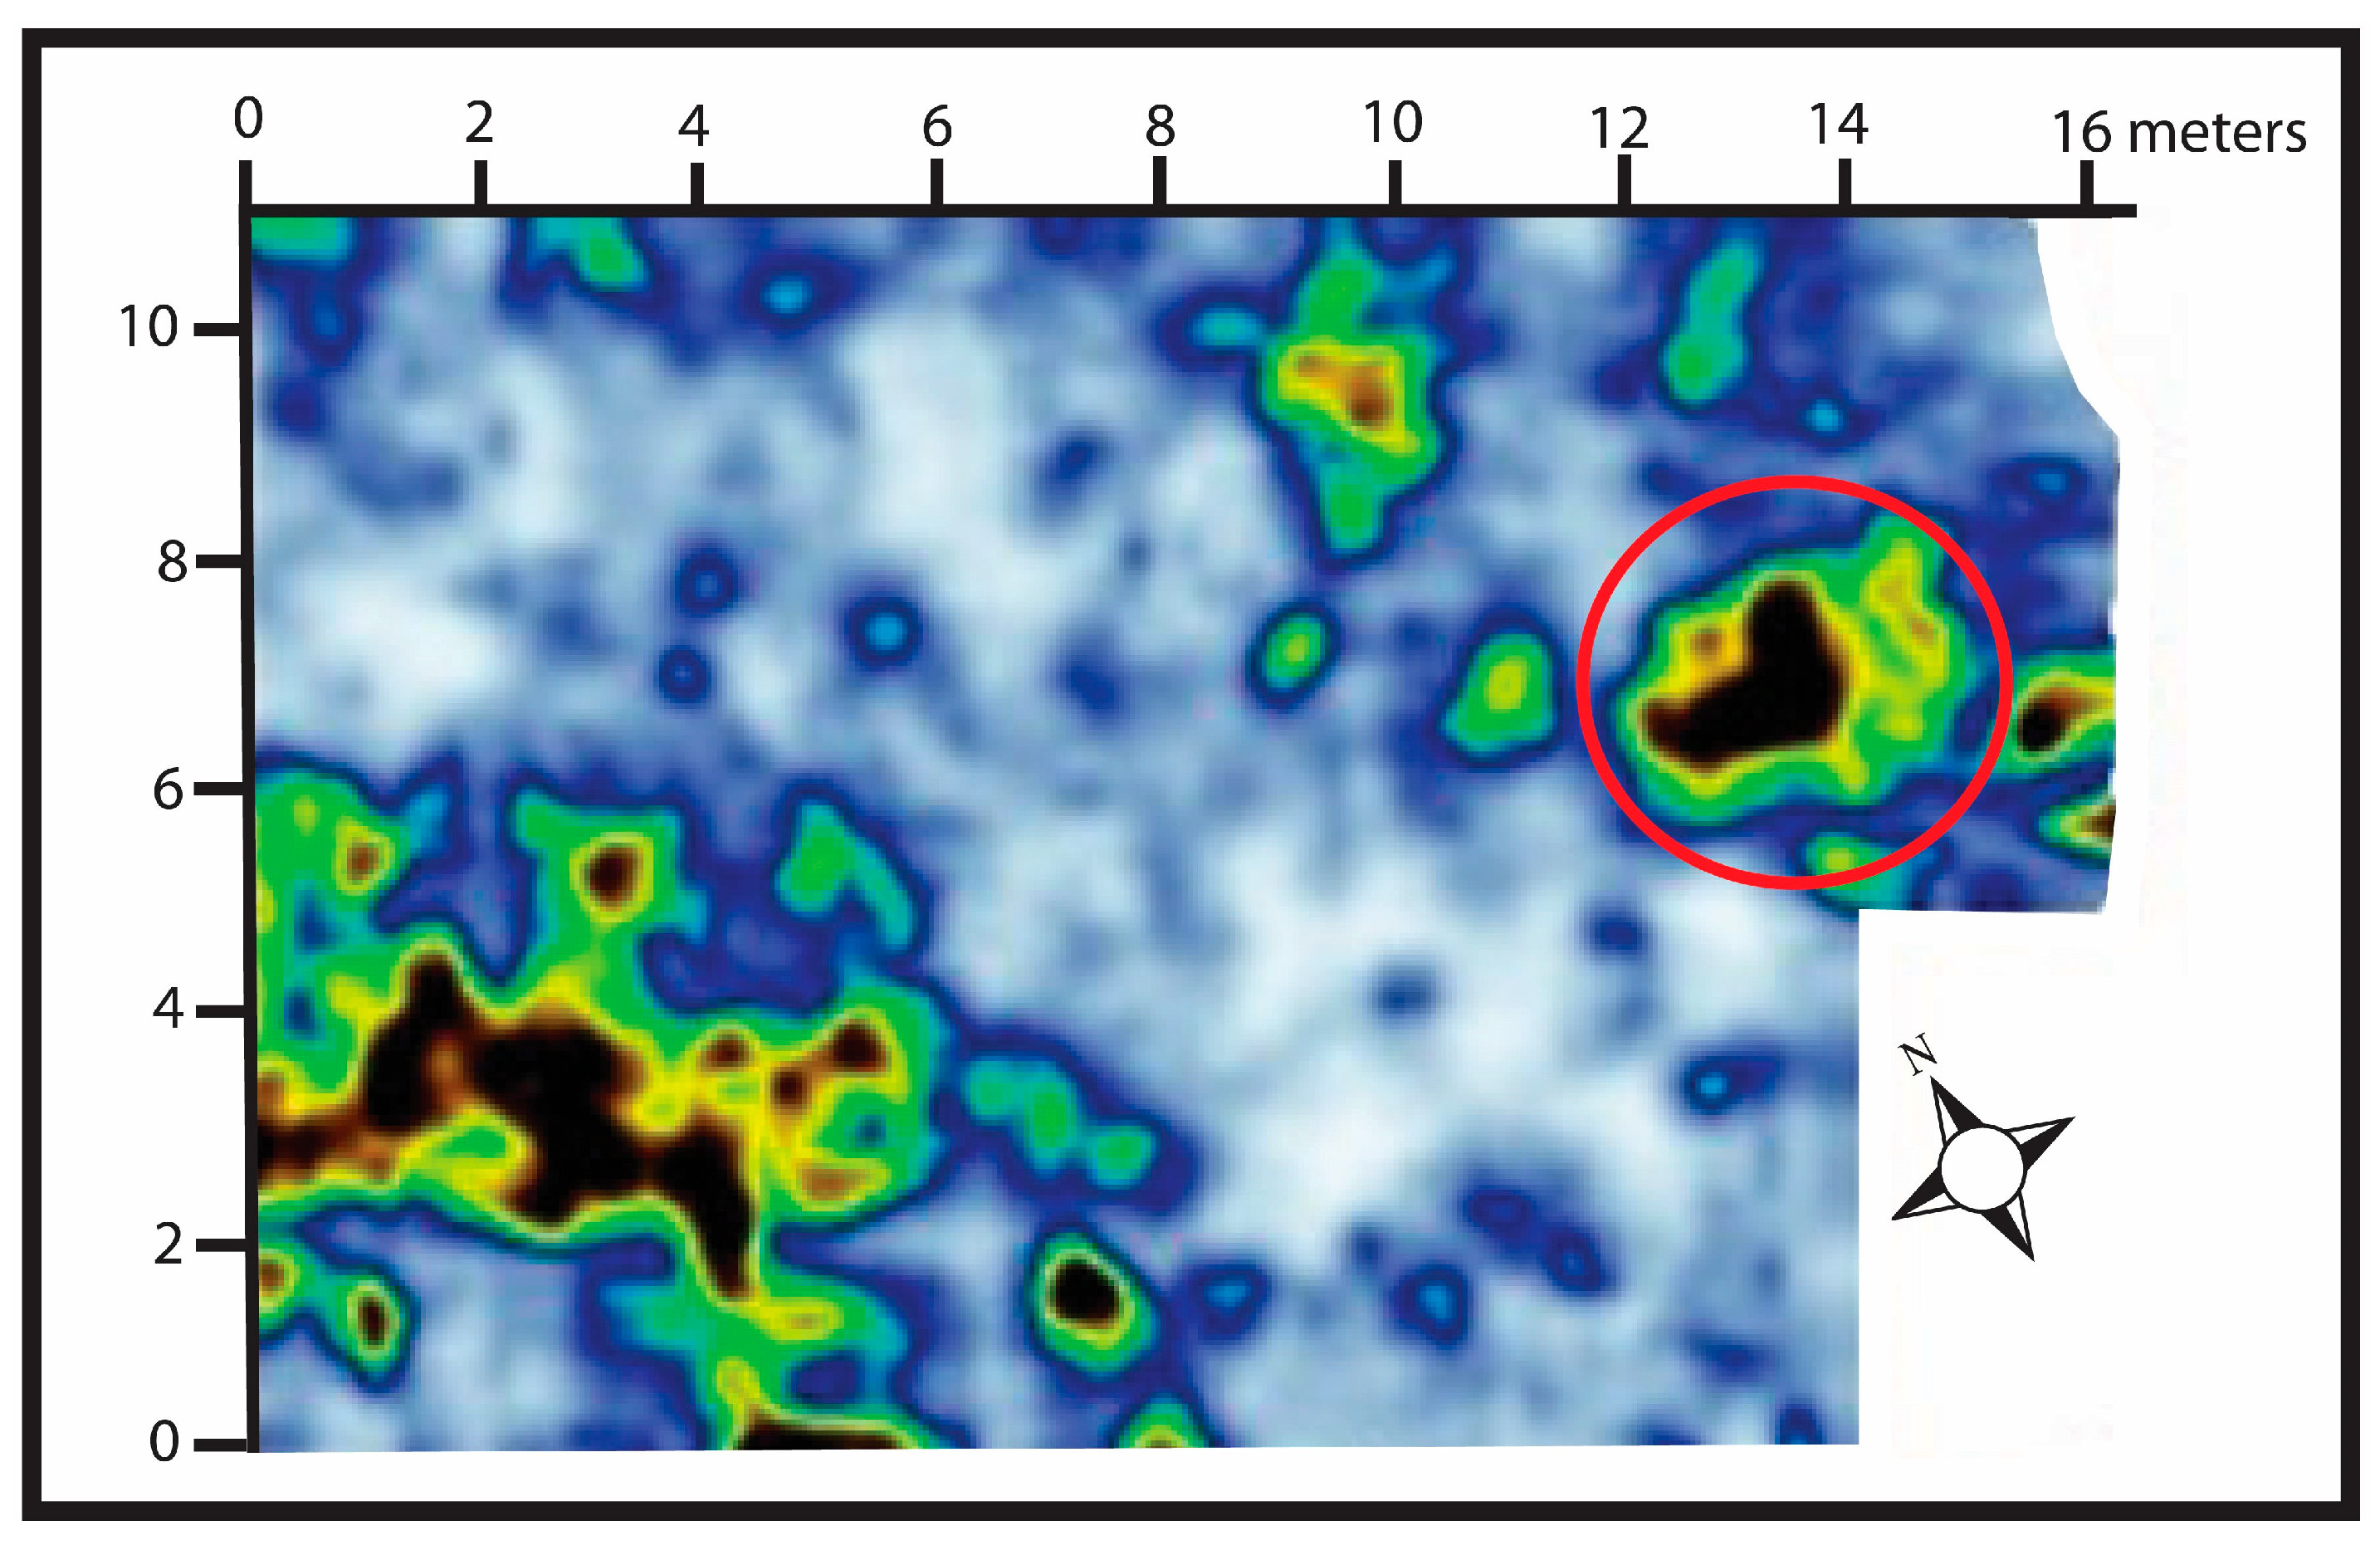
Figure 5 presents a composite GPR data slice from 81 to 131 cm below the surface from the Rasu Street Prison, which was collected to establish high-value excavation targets related to a single grave that historic documents indicated was present in this area (see Figure 2) [20]. Variations in the reflection patterns may indicate the location of these possible buried remains. The reflection pattern centered within the red circle at the intersection of 7 m along the y axis and 13 m along the x axis coincides with an anomaly discovered using ERT analysis. This relationship led to creating a 2 m × 2 m excavation at this location. Skeletal remains that consisted of a human skull and upper torso were exposed at a depth of 1.4 m beneath the land surface. Hence, GPR, coupled with ERT analysis, successfully imaged reflection patterns that, after excavation, led to the discovery of a single grave that contained human remains.

2.3. Collection of ERT Data

Electrical resistivity tomography (ERT) measures the spatial distribution and contrast of electrical resistivity in the subsurface [21]. ERT measurements are most often performed, as part of archaeological research, along linear surface transect lines of varying lengths depending on the objectives of the research and the physical nature of the study site. In archaeological studies, the placement of the transect lines is often guided by historical knowledge of the site. Also, a series of transect lines can be established that overlap at right angles to create a grid. The data collected along single transect lines is used to produce a two-dimensional (2D) electrical image, and the data collected from an ERT grid is used to create a three-dimensional (3D) distribution of subsurface resistivity values, analogous to a medical CAT (computed axial tomography) scan [21,22]. Although numerous data collection arrays are associated with the application of ERT in archaeological research, the array used most often is the single transect line.
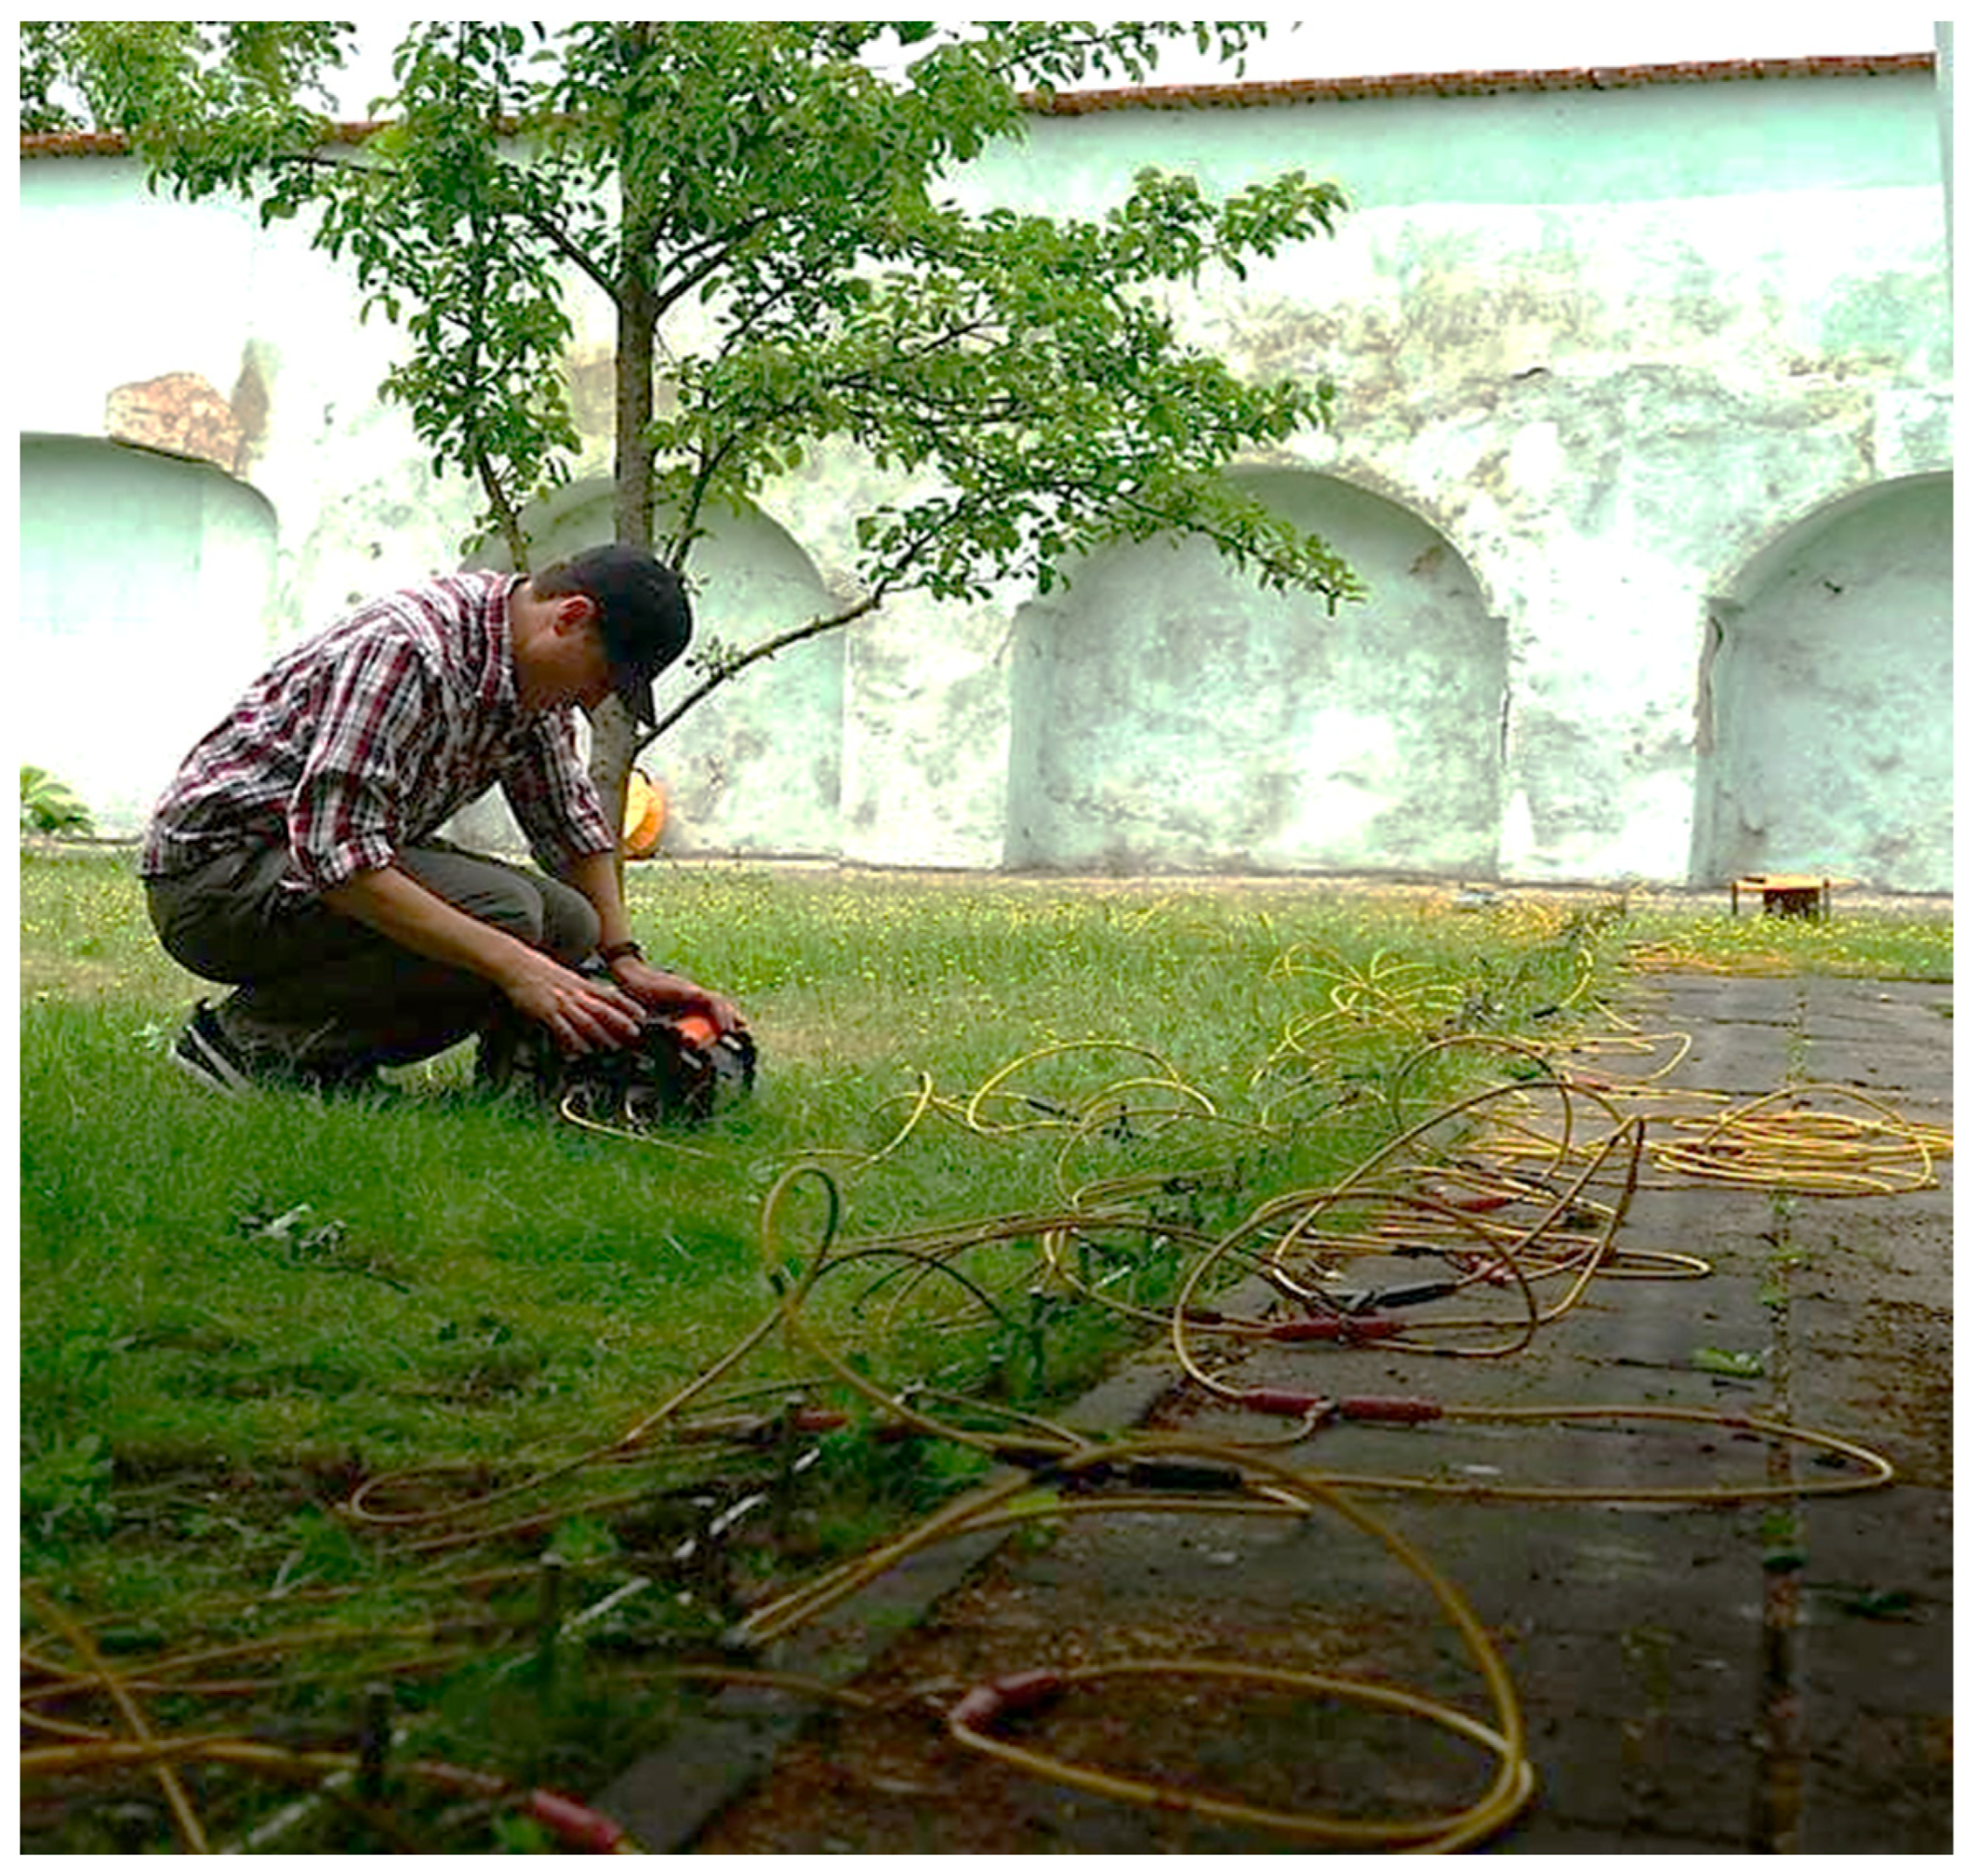
In the context of archaeological research, ERT can be used to (1) estimate the depth, thickness, and resistivity of subsurface layers, and depth to the water table, which can be used to augment excavation plans; (2) identify the location of buried archaeological objects; and (3) facilitate the creation of a comparative database that integrates ERT data with artifacts that are recovered after excavation [23,24,25,26,27]. Figure 6 shows ERT data being collected at the Rasu Street Prison using one linear transect line [20]. This single transect line configuration (called a dipole-dipole array) is a common configuration where two pairs of electrodes are used, one for the injection of current and the other where the potential difference in the current between the pairs of electrodes is measured [28].
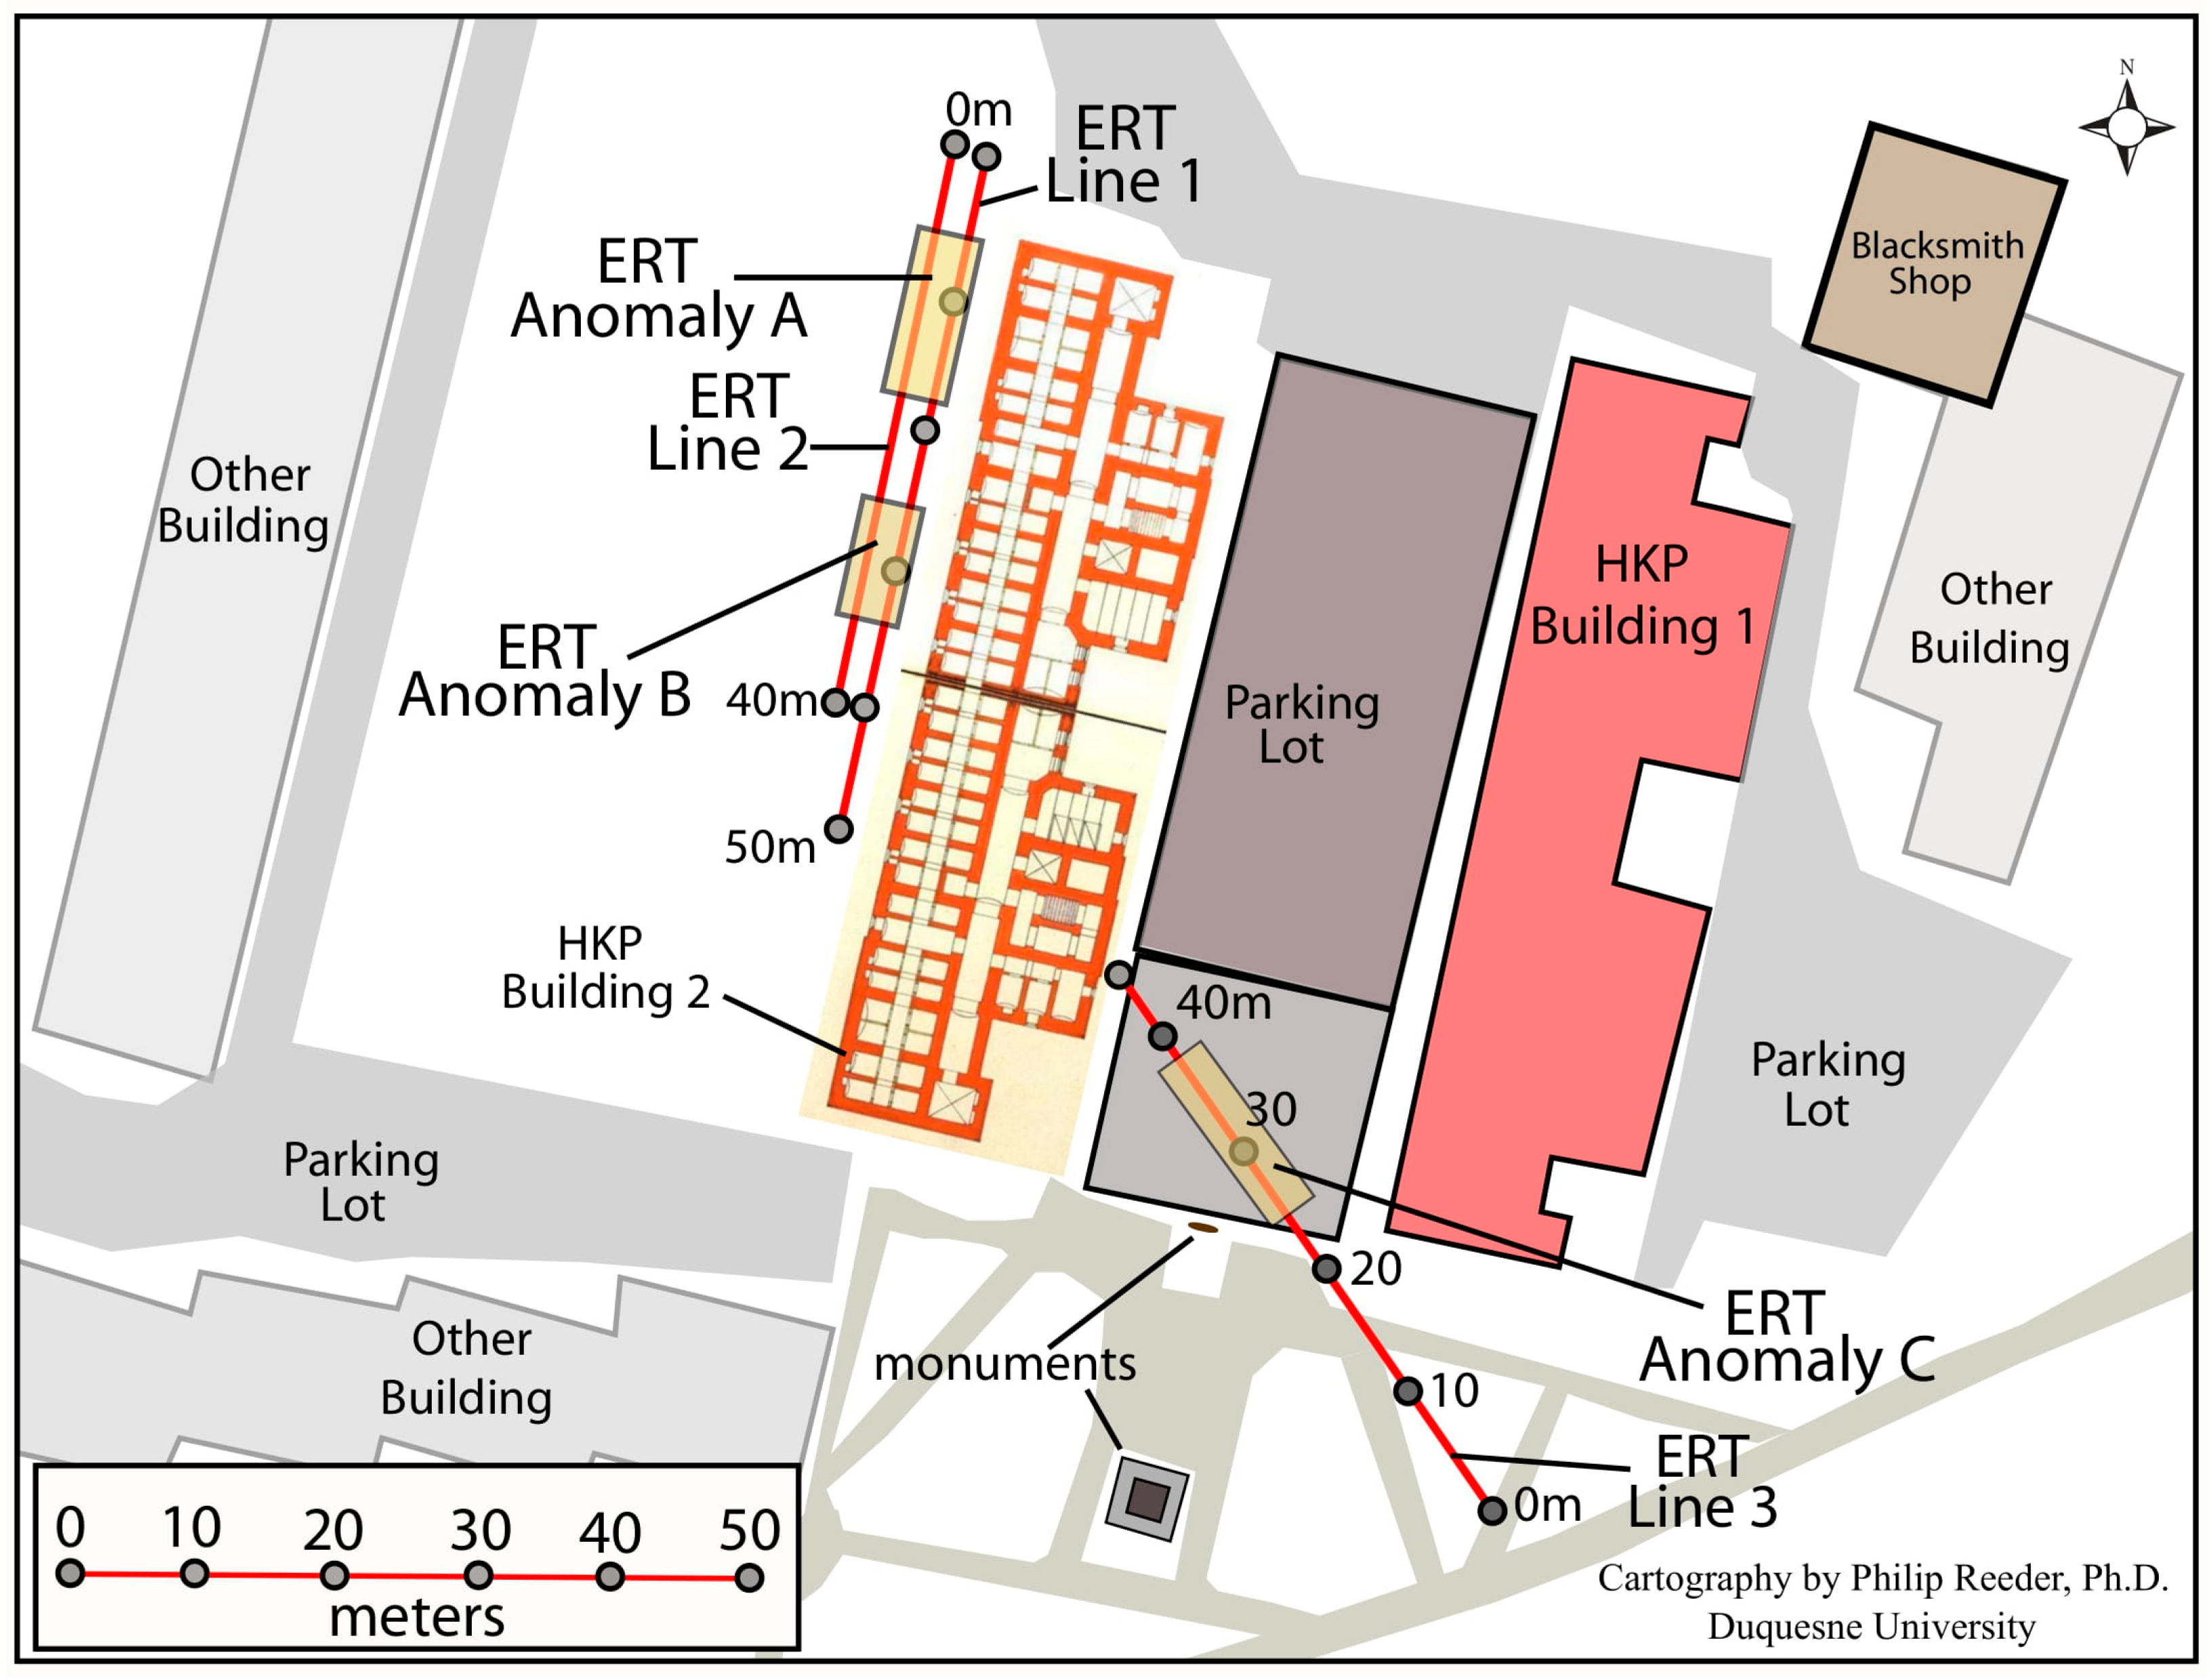
Figure 7 presents a map of the Heereskraftfahrpark (HKP) 562 Forced-Labor Camp in Vilnius, Lithuania. Part of the research design for this project included using ERT to locate three mass graves at this World War II era site [29]. Historical documents and survivor testimony indicated that in early July 1944, 500 inhabitants of the camp were transported to the nearby Ponary Forest and murdered by firing squads composed of local militias collaborating with the German military that occupied the region. These victims were then buried in already-prepared mass graves in the forest. Two hundred other inhabitants of HKP, who were hiding within the camp, were eventually found, shot, and hastily buried in two shallow on-site trenches. These events coincided with the arrival of the Soviet Red Army and the rapid departure of German troops, as the balance of power shifted toward the end of World War II. Inhabitants of the camp who remained hidden and survived the massacre almost immediately removed the decomposing bodies from the trenches and reburied them in a deeper, single mass grave. The intent of research completed at HKP in 2017 was to first determine the location of the two initial burial trenches (anomalies A and B associated with ERT lines 1 and 2 in Figure 7), and then confirm the mass burial site (ERT anomaly C as part of ERT line 3). ERT successfully imaged these locations, and it was pivotable in adding this important information to the existing base of historical knowledge for the Holocaust at HKP, in Vilnius, and beyond [29].

ERT Data Collection System and Results

The ABEM Terrameter LS system (Figure 8) was used to collect data at the Rasu Street Prison using the methodology presented in Appendix B. The initial deployment of cables as part of the creation of ERT transect lines and grids is labor-intensive and time-consuming, depending on the length of the lines, dimensions of the grid, electrode spacing, and number of electrodes used [30]. For example, a field crew of three persons could effectively establish a 100-m-long transect line, with a one-meter electrode spacing, and collect and process ERT data within a timeframe of 4 to 6 h. Added length, or the establishment of a grid, can double or even triple the data collection and processing time depending on the added distance or the complexity of the grid [31,32]. Most of the added time is related to set-up, take-down, and moving the transect line(s) or grid. In recent years, with the advent of modern inversion software, like RES2DINV [33], the ERT data can be processed in the field on a laptop computer, which allows for rapid analysis and visualization of subsurface resistivity [31]. This inversion software plays a crucial role in converting the apparent resistivity values initially collected in the field to true resistivity values for the subsurface area, through which the electrical current flows by using various algorithms inherent in the software [33].
Figure 8 depicts the processes and related hardware and instrumentation needed for the creation of and data collection at a single ERT transect line, in this case, at the HKP site in Lithuania [29]. Figure 8 also contains a schematic of the ERT system function and the data collection process. In the photograph in Figure 8, a fiberglass survey tape is extended across the land surface as a guide to indicate the desired path of the transect line. ERT cable is unwound from the cable reel and is laid across the land surface, along the same path as the survey tape. Steel electrodes are driven into the ground at a preselected interval along the cable, and the electrodes are connected directly to the cable via the clip links. The 12-volt battery serves as an external power supply and is connected to the ABEM Terrameter LS resistivity (RES), time-domain induced polarization (IP), and self-potential data acquisition system. As depicted in the photo and schematic diagram, the ABEM Terrameter LS is connected to two separate cables (cables 1 and 2), which are in turn connected to six electrodes on cable 1 and seven electrodes on cable 2. Simply put, ERT works by injecting electrical current into the ground using a pair of what are referred to as current electrodes, and then measuring the voltage at one or more additional pairs of electrodes, which are referred to as potential electrodes. As the current flows through the subsurface, it encounters varying resistance depending on the materials it encounters, and based on the collected resistance data, and depending on whether it is collected from a single transect line or a grid, a 2D or 3D image of the resistivity distribution in the subsurface can be created [21]. These variations in resistivity are influenced by the local lithology, water saturation, porosity, and in an archaeological context, whether the transmitted signal interacts with any buried structures, objects, or artifacts [34,35]. Like GPR data, interpretation of ERT resistivity patterns can assist archaeologists with designating excavation targets.
Figure 9 presents a 19 m long, two-dimensional ERT resistivity cross-section from the Rasu Street Prison, which contains resistivity anomalies between 16 and 18 m at the north end of the line [20]. Along this section of the transect line, the more resistive near-surface materials to the north and south (above 18 m and below 16 m) are replaced by less-resistive materials from 16 to 18 m along the line. The more resistant materials to the north and south vary between 550 and 800 ohm/m, whereas from 16 m to 18 m along the transect line, the materials are consistently around 500 ohms/m. This occurs because a grave was created and then refilled as part of the burial process at this location, which was discussed earlier. These actions mixed the soils and changed the water-holding capacity, thus affecting the soil’s resistivity. This ERT data, coupled with GPR data collected in the same location, successfully imaged resistivity and reflection patterns that led the discovery of a single grave that contained human remains [20].

2.4. Description and Explanation of GPR and ERT Methodologies

In Appendix A and Appendix B, the detailed methodology for a study completed at the Rasu Street Prison in Vilnius, Lithuania (and published in the journal Histories) is presented as an example of a typical methodology for an archaeological project that uses both ERT and GPR for data collection (reprinted from Ref. [20]). ERT and GPR were selected for use in this project due to their non-destructive and non-invasive nature, which facilitates quick and efficient mapping of subsurface features and potential archaeological remains. The non-invasive data, and related interpretations, revealed potential buried structures and artifacts, and they assisted in pinpointing the exaction location, thus reducing costs.
The use of GPR and ERT in archaeological research is not without limitations. The penetration of the GPR signal, for example, can be inhibited by the presence of clay-rich soils. At the Rasu Street Prison site, the clay percentage in the soil was minimal, and hence the penetration of the GPR signal was not affected. The use of GPR and ERT in archaeological research can be affected by the presence of modern infrastructure that coexists with the archaeological remains. Construction that postdates the archaeological features, and buried water, sewer, gas, and electric transmission lines, can complicate the interpretation of GPR and ERT data because signals from the more modern infrastructure need to be differentiated from archaeological remains. At Rasu Street Prison, buried modern infrastructure was not an issue.
In the detailed methodologies in Appendix A and Appendix B, it is evident that numerous technical details are presented, and terms are used, many of which may be unfamiliar to a non-frequent user of these technologies. Specific terms and technical details within Appendix A are explained in detail, and they are in some cases augmented by visual examples in Section 3.1. Similarly, specific terms and technical details within Appendix B are explained in detail, and they are in some cases augmented by visual examples in Section 3.2.

3. Explanation of Terms and Concepts

3.1. GPR Methodology Simplified and Explained

Propagation and reflection of pulsed, high-frequency electromagnetic (EM) energy: The transmitter within the GPR unit emits a short burst of electromagnetic (EM) waves (energy), which then interact with the materials they are traveling through, causing some energy to be transmitted, some to be absorbed, and some to be reflected. The reflected energy is collected by the receiver within the GPR system, and the receiver processes this reflected signal, providing information about the location, depth, and shape of subsurface features [36,37,38].
Near surface, high-resolution, near-continuous profiles: The penetration depth of GPR signals is controlled in part by the frequency of the radar waves used and by the type of material from which data is being collected. Signal penetration depth can range from less than a meter (in clay-rich soils, for example) to over 30 m in sandy soils using a low-frequency GPR antenna [39]. High-resolution GPR data refers to scans that capture a large amount of detailed data, which facilitates more precise imaging of subsurface features. High-resolution GPR is valuable for applications requiring accurate mapping of shallow subsurface structures, such as utility locating, environmental assessments, and archaeological investigations [40]. In sedimentary geology, ground penetrating radar (GPR) is used primarily for stratigraphic studies where near-continuous, high-resolution profiles aid in determining (1) stratigraphic architecture, (2) sand-body geometry, and (3) correlation and quantification of sedimentary structures [41].
500-Megahertz (MHz) antenna: A wide variety of antenna frequencies are available for GPR systems. A 500 MHz antenna transmits electromagnetic waves at a frequency of 500 million cycles per second (500 MHz) to create images of the subsurface [42]. The most detailed, highest-resolution data is achieved by using higher frequencies and an array of closely spaced transect lines [43]. When using GPR in archaeological studies, the fact that the antenna frequency and depth of penetration are inversely related needs to be considered. Lower frequencies (100 MHz, for example) penetrate deeper, but with less resolution, while higher frequencies (500 MHz, for example) provide better resolution, but have a shallower depth of penetration. Archaeological investigations often target shallow depths, so considering the balance between depth and resolution is critical [44], and the use of a 500-Megahertz (MHz) antenna is common practice [45,46,47].
Antenna separation was 0.5 m: GPR systems, like the Sensors and Software pulseEKKO™ system [13], use separate antennas to transmit and receive the electromagnetic pulses that are emitted by the transmitter, reflected by subsurface materials, and then collected by the receiver. The linear distance between the physical center of the transmitter and receiver antennas is referred to as the antenna separation [48].
Step size was 0.02 m: The term “step size” refers to a method where the GPR system is triggered by a rotating odometer wheel attached to the GPR system (see Figure 4) to collect data at specific, evenly spaced intervals along a survey line or grid, which ensures a uniform data coverage and allows for precise spatial referencing of the collected GPR data. In the example depicted in Figure 4, the rotating odometer wheel triggers data acquisition by releasing electromagnetic pulses every 0.02 m along a survey line [49].
Carrier transport system: GPR data collection as part of archaeological studies is normally focused on the ground surface, as opposed to data collected from drilled boreholes. GPR systems can also be mounted on, for instance, a drone for air-borne investigations. For GPR ground surveys, the GPR antennas are often pulled or pushed by hand or vehicle [50]. The carrier transport system depicted in Figure 4 facilitates pulling the GPR transmitter and receiver across the land surface. This is accomplished via a handle attached to the antenna.
Vertically stacked with an appropriate sampling rate: Vertical stacking refers to recording numerous repetitions of a GPR electromagnetic signal and computing the average value. The number of repeated measurements averaged to obtain this value are referred to as stacks [48]. This stacking is a post-processing technique that uses the collected data. The sampling rate is determined during the data acquisition phase and is essential for capturing the initial data accurately. By using an appropriate sampling rate and then applying vertical stacking, GPR data can be processed to enhance the signal and reduce random noise, improving the signal-to-noise ratio and resulting in clearer images of the subsurface [51].
GFP Edit and EKKO Project software: The EKKO Project is an all-inclusive software solution for managing, displaying, processing, and interpreting GPR data. It facilitates efforts at locating utilities or scanning concrete, and it aids archaeologists, law enforcement, geoscientists, environmental scientists, geotechnical engineers, and other GPR practitioners to visualize GPR data and turn it into usable information [52]. GPF Edit is designed to create, view, and edit GFP (GPR files and parameters) files. These files contain information about groups of GPR lines that are related to one another in some manner, and when this information (line names, position, direction, processing information) is organized under a GFP file, the data can be easily read in the EKKO Project, where it is further processed and then visualized [53].
Automatic gain control (AGC): In the context of GPR, AGC refers to a processing technique that adjusts the amplitude of the GPR signal to compensate for variations in signal strength caused by factors like ground conductivity, depth, and signal attenuation. It assists in making GPR profiles visually clearer by equalizing the energy spectrum along the entire section, which makes it easier to see subtle features that may otherwise be obscured by variations in signal strength. By adjusting the signal amplitude, contrast, and visibility of subsurface features in the GPR data, they are enhanced and hence made more balanced and visually appealing [54,55].
Signal saturation correction: Signal saturation correction, which is also known as de-wowing, is a crucial step in GPR data processing to remove a low-frequency, slowly decaying “wow” artifact in the data that distorts the GPR signal and makes it difficult to distinguish important reflections within the signal [56]. The low-frequency data components related to de-wowing are associated with either inductive phenomena or possible instrumentation dynamic range limitations. To correct for this, various techniques can be employed, including a technique that is referred to as “wow reduction”, which helps to remove low-frequency oscillations caused by the receiver’s inability to adjust quickly to signal variations [48].
Trace stacking (horizontal averaging): Trace stacking, also known as horizontal averaging, is a term used to describe stacking (recording and averaging) of complete traces, wherein traces are a sequence of sample points in the GPR data that indicate the variation in the signal amplitude over time [48]. Trace stacking improves the signal-to-noise ratio (SNR) because coherent signals from different traces will align and constructively interfere. At the same time, random noise will tend to average out and enhance image quality [57].
Point stacking (running average): The term used to describe this is stacking (averaging of repetitive observations) at a single time point, which is carried out sequentially for all the points in a GPR trace [48]. At greater depths, GPR signals can be weak and susceptible to noise. Stacking multiple traces at a collection point on the ground, where multiple GPR traces are recorded, assists in effectively reducing the impact of random noise, highlighting stronger signals from subsurface reflections [58].
Two-way travel time window: The time the receiver antenna listens for, in which it records echoes from an electromagnetic pulse that the transmitter has emitted into the ground, is referred to as the two-way travel time window. This time window is typically measured in nanoseconds (ns), and it determines the total trace length and influences how deep the GPR signal can penetrate the subsurface. Longer time windows can increase signal penetration depth but can create file size issues because they create larger file sizes [59].
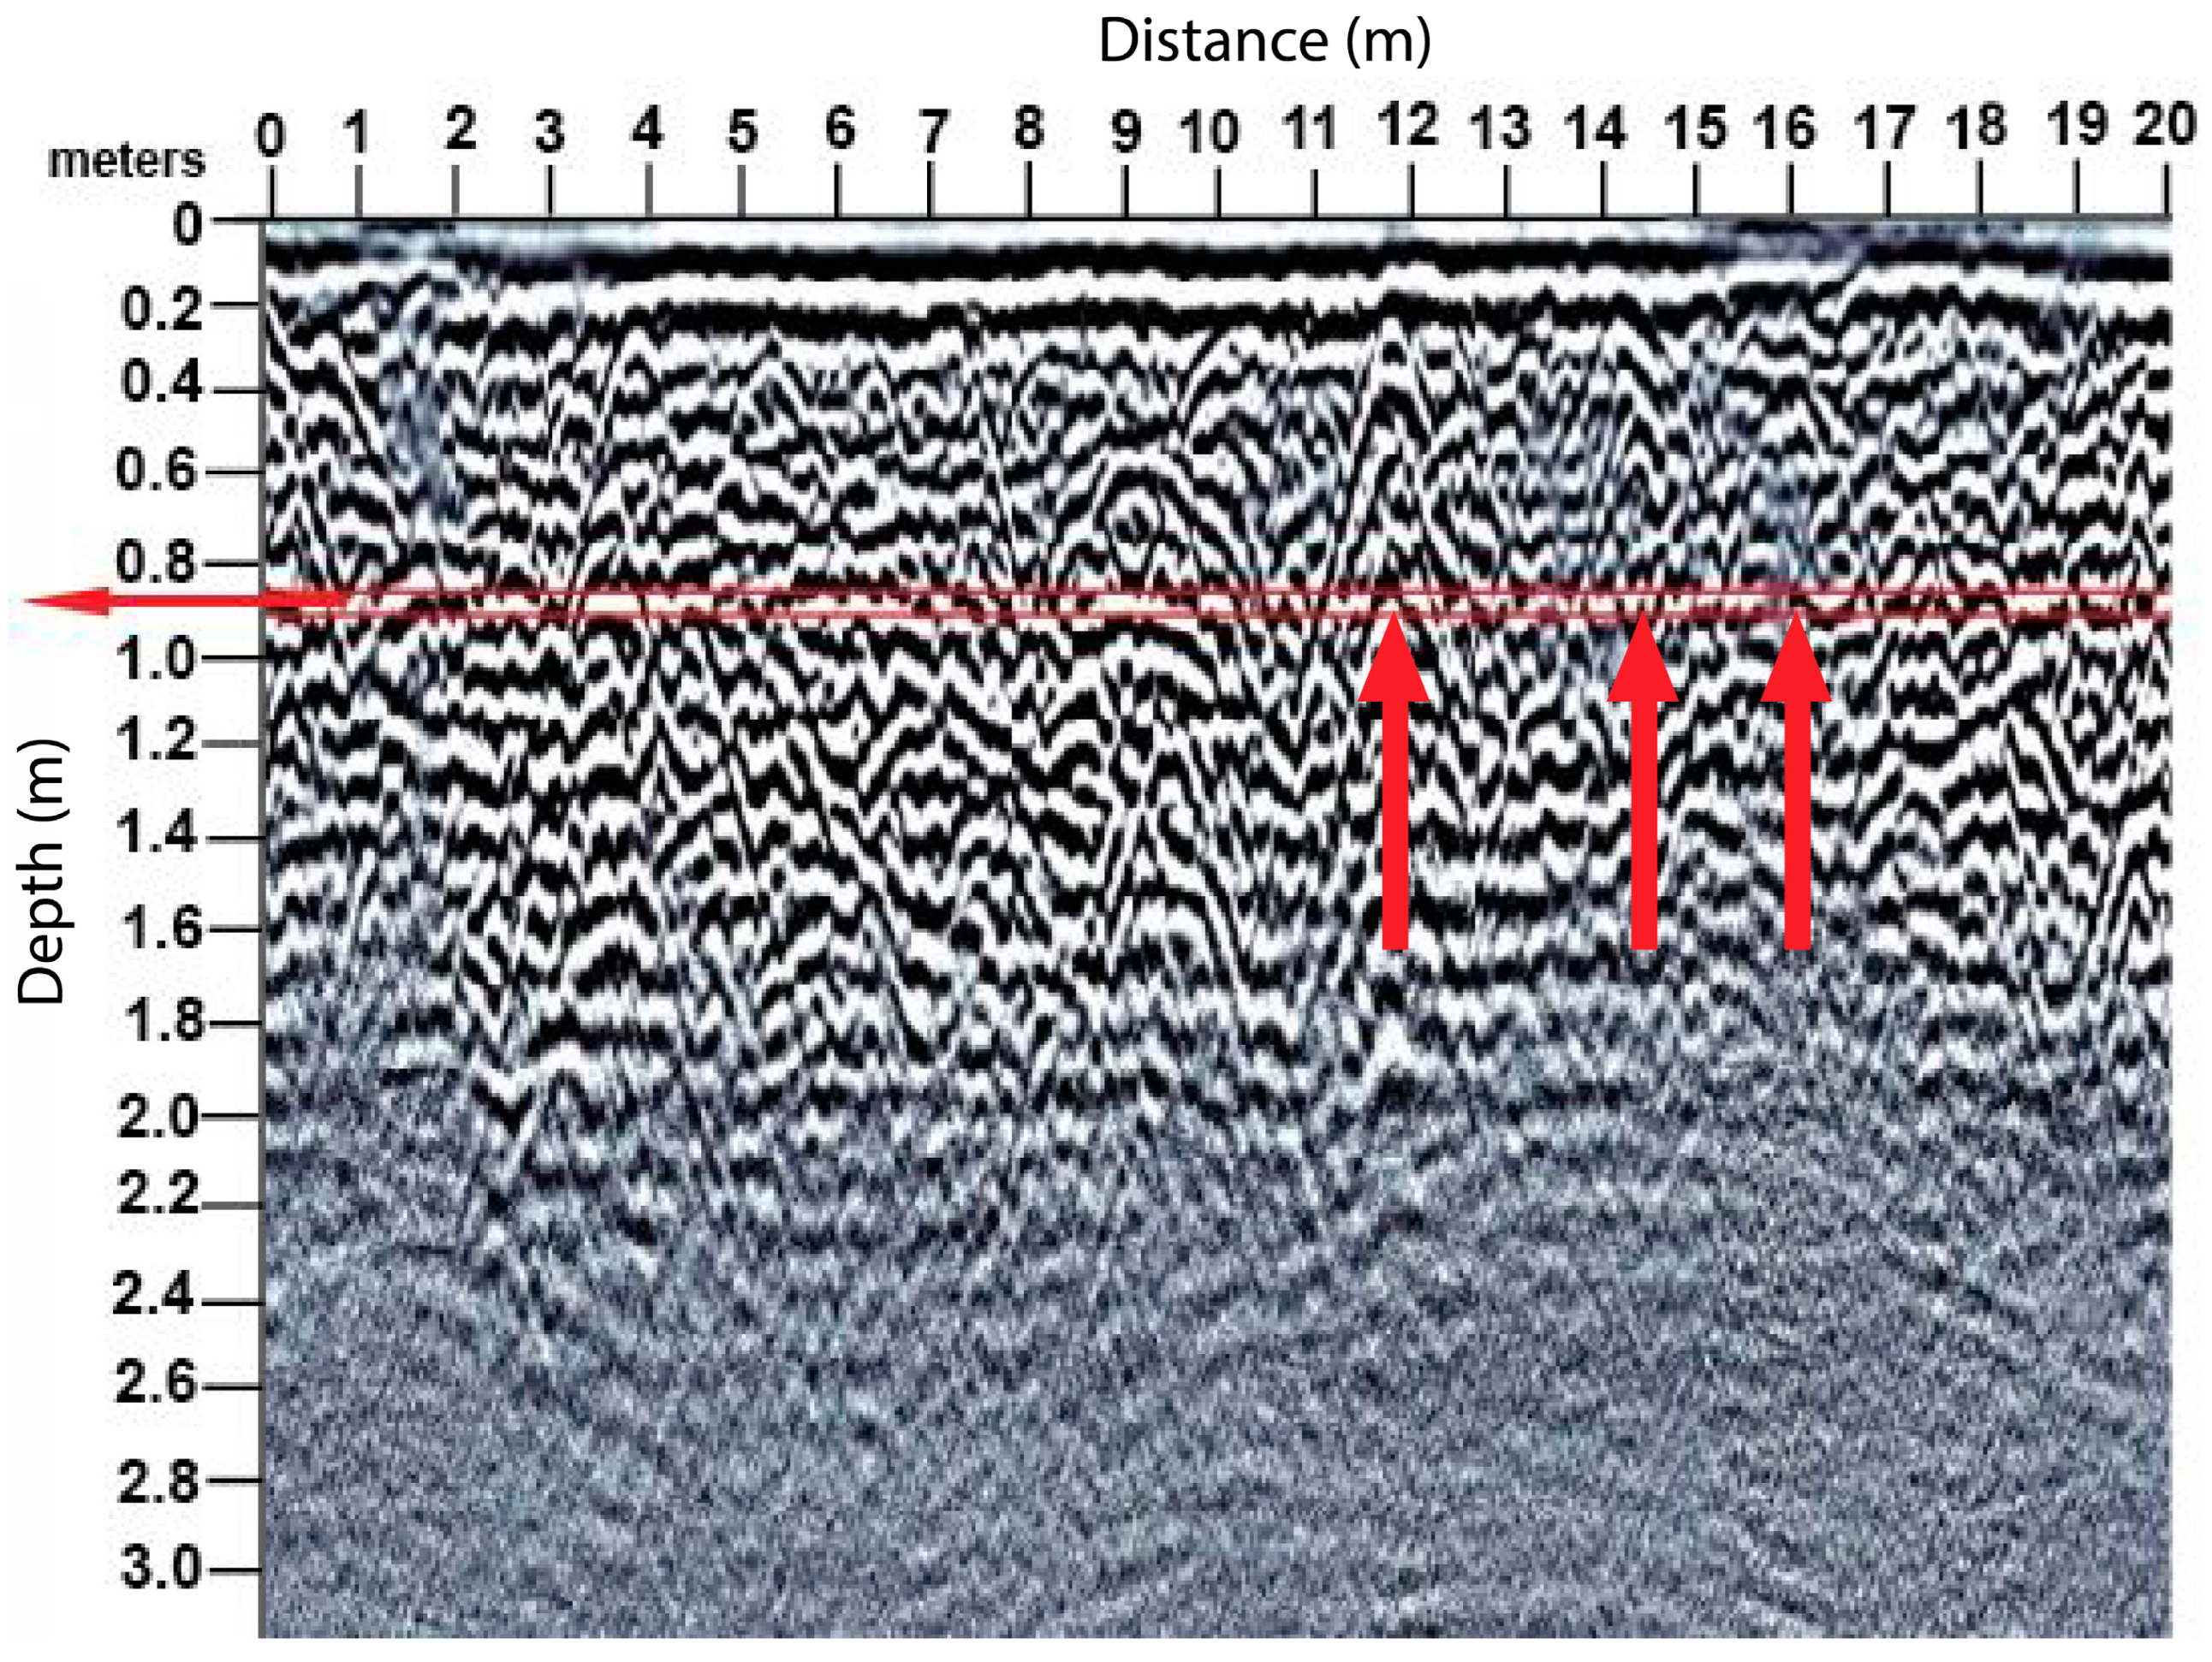
100 ns: This refers to the timeframe within which a GPR signal travels from the transmitter, reflects off a buried target, and returns to the receiver. The time window, and the velocity of the radar wave in the subsurface material, determines the depth to which the GPR signal can penetrate. For example, if the velocity is 0.05 m/ns, a 100 ns time window would correspond to a maximum depth of penetration of 5 m [60].
Near-surface velocity of 10 cm/ns: A near-surface velocity of 10 cm/ns (which is the same as 0.1 m/ns) is how quickly the emitted radar signal (electromagnetic waves) travels through a given subsurface material. Often used in near-surface GPR, it is considered an average velocity for many subsurface materials, particularly in shallow investigations [61]. The near-surface velocity is part of the calculation that converts the time it takes the emitted electromagnetic radar signal to travel to a buried object (reflector), and the depth of that buried feature [62], with this velocity influenced by soil type, moisture content, and other soil characteristics. It is, therefore, common to estimate or determine the velocity specific to the area being surveyed [63].
Hyperbolic (hyperbola) velocity calibration tool within the EKKO_Project software package: The “Hyperbola Velocity Calibration” tool is used to determine the velocity at which the emitted electromagnetic GPR signal travels through the subsurface materials that are being studied. It uses hyperbolic reflections that are created when the signal bounces off subsurface point objects or stratigraphic boundaries [64]. Hyperbola are characteristic inverted “U”- or “V”-shaped features that are present in cross-sections created based on the GPR electromagnetic response from encountering a buried point target (Figure 10). The apex of the hyperbola (top of the inverted U or V) represents the location of the GPR signals on the closest approach to that object [48]. By analyzing the shape and position of these hyperbolas, the tool helps refine the velocity estimate, which is crucial for accurate depth interpretation and visualization of subsurface features [65].
Topcon Total Station, and/or a Topcon Laser: When interpreting collected GPR data, it is important to correct for differences in elevation amongst the collected data points before interpreting the data. The elevation data upon which these topographic corrections are based is normally collected using a laser leveler, total station, or global positioning system (GPS). The collected GPR data is usually displayed as a rectangular two-dimensional profile (cross-section), with the vertical (y) and horizontal (x) axes proportional to depth below the land surface and distance along the GPR transect lines, respectively. Because the land surface is often not horizontal (flat), this leads to a distorted view of the true characteristics of the reflection patterns within the data. Because the relief of the land surface varies with distance, the depth value of the reflection patterns will no longer represent the true and exact position of these features. Without applying a topographic correction, the reflection patterns are interpreted based on the presumption that the land surface is flat, even though it is variable. Further, when the land surface is not flat, it leads to collecting data related to the same subsurface object from different angles, and at different depths because of the variations in surface topography above the data collection point. This in turn makes any interpretation of the data inaccurate because the variable elevations above the data collection points have not been taken into consideration. For these reasons, topographic correction is required so an accurate interpretation of the data can be completed [66].
Radar stratigraphic analysis (distinct signature patterns): GPR images the subsurface using electromagnetic pulses that can reveal stratigraphic layers beneath the surface based on changes in permittivity (the ability of a material to store electrical potential energy under the influence of an electric field). This non-destructive method can assist in rapidly mapping soil horizons (layers), bedrock configurations, and in the context of this entry, buried archaeological features [41,67]. Distinctive reflection or amplitude signature patterns can exist within the data, which can assist in identifying specific subsurface features associated with archaeological remains like burials, voids, or buried structures [68].
Lateral and vertical geometry and stratification: As part of radar stratigraphic analysis, and the delineation of distinct signature patterns, the lateral and vertical geometry of natural and anthropogenically modified subsurface layers, and buried objects can be quantified. By analyzing the reflected signals, GPR can reveal information about the subsurface, including the location and thickness of different geological and anthropogenic layers, and in an archaeological context, the presence and locations of buried structures, artifacts, and other objects of archaeological significance [69].

3.2. ERT Methodology Simplified and Explained

ERT is a technique for mapping the distribution of subsurface electrical resistivity, or inverse conductivity, in a cross-sectional format: ERT is used to predict the spatial distribution of subsurface electrical resistivity. Because electrical resistivity is directly related to myriad subsurface characteristics, like the rock type, porosity, ionic strength of the pore fluids, and the conductivity of geologic materials, it is widely used in studies involving archaeological prospection [70]. ERT data are collected by establishing an electrical potential difference between two current (injection) electrodes and many pairs of potential electrodes (see Figure 8). The injected current is collected and converted into apparent resistivity, which provides a representation of the subsurface spatial distribution of electrical resistivity, thus highlighting similarity and differences in the subsurface [71]. In a cross-sectional format, conductivity is the inverse of resistivity and is a measure of how well a material conducts electricity, whereas resistivity is the opposite, offering a measure of the material’s resistance to the flow of electrical current. A higher conductivity means the material allows current to flow more easily [72].
Resistivity data: Resistivity data are measurements that quantify a material’s resistance to the flow of electric current, which indicates how strongly these materials resist the passage of electricity [73]. Resistivity data assists in developing a detailed understanding of the subsurface, and in an archaeological context, identifying different materials/structures that are related to the material culture of a site that are buried in the subsurface [74]. Resistivity is often represented by the Greek letter ρ (rho) and is calculated using the formula: ρ = RA/l, where R is the resistance, A is the cross-sectional area, and l is the length of the material [75].
Linear array of electrodes: In research using ERT, linear arrays of stainless-steel electrodes are used in transect lines and grids to measure the electrical resistance of the ground. Spacing of the electrodes varies depending on the objectives of the survey and the local geological conditions [76]. Different electrode arrays like the dipole-dipole, Schlumberger, and Wenner are used depending on the desired penetration depth and resolution. The dipole-dipole array works best for detecting horizontal resistivity changes, but is less sensitive to vertical changes. The Wenner array is good for vertical resistivity changes and detecting horizontal structures. The Schlumberger is more sensitive to vertical resistivity changes. An advantage of the Schlumberger array is that it takes less setup time compared to the Wenner array [77].
Direct current (DC) resistivity transmitter, receiver, and electronic switching relays: Direct current (DC) is transmitted into the ground, typically through two what are referred to as current electrodes. As previously described, a 12-volt battery can power an ABEM Terrameter LS resistivity (RES) data acquisition system (see Figure 8), which both transmits this current into the ground through the current electrodes, and receives the returned current through what are referred to as potential electrodes, thus measuring the potential voltage difference between these two (potential) electrodes [21,78]. As part of the ERT data collection process, numerous four-electrode resistivity measurements are made, which requires switching between different combinations of transmitter and receiver dipoles. Electronic switching relays automate this process, allowing data to be acquired from various combinations of electrodes [79].
Spacing between electrodes: The spacing between electrodes controls the horizontal and vertical resolution of the data, with a smaller spacing resulting in higher horizontal and vertical resolution. The array’s length controls the investigation depth. The relationship is, the more extended the electrode array, the greater the investigation depth [21]. Shallow investigations, like those associated with archaeological investigations, generally use smaller spacings, for example, 0.75, 1.5, or 3.0 m, which yields higher-resolution data [80].
Sequential and automated, taking advantage of all possible combinations of current injection and potential measurement electrodes: ERT data collection is usually sequential and automated, using all possible combinations of electrical current injection and measurement from potential electrodes. This approach facilitates the collection of the most detailed subsurface resistivity images possible [81]. Specifically, sequential data collection involves repeatedly injecting current into the ground for various combinations of electrodes. This process creates a series of measurements that can be used to build a 2D or 3D image of the subsurface [21,31,82]. The ABEM Terrameter LS resistivity (RES) data acquisition system manages the electrode movements, data acquisition, and processing, which reduces manual effort and allows for faster data collection [16,83].
Data are inverted (i.e., modeled) using a two-dimensional (2D) finite difference or a finite element inversion routine using RES2DINV tomographic “inversion” software: The data inversion process, also referred to as modeling, is a mathematical process that uses software like RES2DINV version 5.0 [33] to interpret measured electrical resistivity data in order to create an accurate subsurface model that best matches the measurements [84]. This inversion is typically achieved using either a finite difference or finite element method, both numerical methods used to approximate solutions to differential equations. Both methods assist in calculating how electrical current propagates through the subsurface, which facilitates the creation of a 2D model of the subsurface [85,86,87]. Figure 11 depicts an ERT profile created using this methodology.
Minimum electrode spacing of 0.125 m: There is a relationship between how far apart electrodes are placed along an ERT transect line and the depth to which the signal will penetrate. A minimum electrode spacing of 0.125 m is a reasonable starting point for shallower investigations, like those often associated with archaeological research [21,88]. Penetration depth is related to but is not entirely proportional to electrode spacing. Increased spacing leads to deeper penetration, but the relationship is not linear. The maximum depth is generally not just a multiple of the electrode spacing but rather a complex function of the array type used (Wenner, Schlumberger, dipole-dipole) and other mitigating factors related to, for example, local soil, geology, and hydrologic characteristics [89].
Multicore cable: Multicore cables used for ERT research allow the simultaneous transfer of current and potential signals from a resistivity meter to the ground and then back to the meter. These cables can possess multiple takeouts, which are locations along the cable where it can be connected to electrodes via clip lines (see Figure 8). Options for the number of takeouts along the cable can range from 10 to 48, depending on the survey requirements and the number of electrodes needed [90].
Injection electrodes/reception electrodes: The array of electrodes used to collect ERT data are strategically placed to image subsurface structures based on their electrical resistivity/conductivity. The injection electrodes are the source of the electrical current, generally provided by a 12-volt battery, that is sent into the ground. The reception electrodes measure the electrical potential or current changes related to the injected current. Specifically, the injected current travels through the ground, and the reception electrodes measure the current’s voltage at different points along the array of electrodes [91].
Multiple gradient arrays/expanded gradient acquisition sequence: This sequence, which is used as part of the data acquisition process in ERT surveys, involves using a multi-gradient array of electrodes. This approach is also known as a Full-Range Gradient (FRG) survey, wherein there are multiple potential (reception) electrodes for each current (injection) electrode. This array, therefore, includes a high number of potential electrodes external to the electrical current electrode. This approach aims to improve the resolution, sensitivity, and penetration depth of ERT surveys [92].
Multichannel systems: Multichannel ERT systems use more electrodes and can measure more voltage readings simultaneously, which allows for more accurate imaging, and also increased efficiency because more electrodes and simultaneous measurements lead to faster data collection. Additionally, multichannel systems can be used for both 2D and 3D surveys, thus adding flexibility to any ERT survey [93].
Removal of any negative values and apparent outliers: Removing negative values and apparent outliers is a common step to ensure data quality and accuracy in ERT surveys. Negative values are usually not the result of instrument malfunction, and they most often owe their origin to poor electrode connections, inappropriate power settings, battery capacity, or dirty connections and/or damaged cables [94]. Both negative values and data outliers can be removed using the error statistics tool that is part of the RES2DINV version 5.0 software package [33].
L2-norm smoothness constraints and model cell widths: As previously noted, finite difference or finite element inversion routines are completed using RES2DINV version 5.0 tomographic “inversion” software [33,45,84,86]. Specifically, the L2-norm smoothness constraints, which are part of the inversion algorithm, encourage solutions that have gradual changes in resistivity values, which assists in preventing the creation of unrealistic, highly discontinuous models. The model cell width refers to the size of individual cells representing the subsurface in the inversion model. For example, a cell size of 0.0625 m means that each cell in the model has dimensions of 0.0625 m × 0.0625 m, which is half the minimum electrode spacing of 0.125 m. This cell size ensures sufficient detail in the model without being unnecessarily fine [95].
Convergence was reached after no more than five iterations, and root-mean-square errors were 3–8%: Using the iterative-based, smoothness-constrained, least squares inversion algorithm in the RES2DINV version 5.0 inversion program, convergence was reached after no more than five iterations and root-mean-square errors, and the data derived from these iterations were in the range of 3 to 8% [96]. The root-mean-square error (RMSE) measures the average difference between a statistically derived model’s predicted values and the actual values. Mathematically, it is the standard deviation of the residuals. Residuals represent the distance between the regression line and the data points in the model [97].
IP (electrically induced polarization): IP is a technique used in geophysics that measures the electrical response of subsurface materials to a direct current (DC) electrical field that is injected into the subsurface via electrodes associated with the ERT system. It is essentially the ability of earth materials and buried objects (artifacts) to store and discharge the electrical charge after this external electrical field is applied and then removed. This property is known as chargeability and is related to the magnitude of electrical charge polarization within the subsurface materials, which creates a temporary storage of the electrical charge within these materials. When the input of current ceases, the materials discharge this charge over time, producing a measurable voltage decay signal [98].
IP images the subsurface in terms of its changeability: In contrast to resistivity measurements taken as part of ERT surveys, IP is imaging chargeability and the subsurface material’s ability to first store and then release the electrical charge. This method can image variations in water flow and water storage in clay-rich materials [99], and it can also image minerals, especially metallic minerals in the subsurface. In an archaeological context, IP can image artifacts that contain metal and that are buried in the subsurface [100].
Chargeability, measured in milliseconds (msec): As already established, chargeability is the ability of earth materials and buried objects to store and discharge the electrical charge after an external electrical field is applied and then removed [98]. It quantifies the amount of voltage that persists after the current is stopped, representing the area under the decaying voltage curve, which is measured in milliseconds (msec) [101].
Chargeability section can be inverted (i.e., modeled): The mathematical data inversion process that uses software like RES2DINV [33] to interpret measured electrical resistivity data [84] can also be used to model subsurface chargeability based on the observed IP data [102].
Zero chargeability: Sand and silt generally have near-zero chargeability, which means they do not tend to accumulate electrical charges when exposed to an electrical field. Sand and silt may possess some very low chargeability, but it is usually not measurable or significant compared to materials like clay, which has a measurable chargeability [103]. Because sand and silt have a near-zero chargeability, if the subsurface materials at an archaeological site consist of sand and silt-sized materials, but IP anomalies are imaged, that may be an indication of human-constructed or -derived features in the subsurface that contain metal [104].
Clay chargeability: As noted above, clay has a measurable chargeability. Further, materials rich in clay exhibit high chargeability in IP surveys, meaning that these clays can effectively store and release electrical charges when subjected to an external electrical field. This ability to polarize is related to the presence of clay minerals in the subsurface materials, and also the interactions between those minerals and the fluids contained within the clay matrices [105].
Metal objects: IP surveys are often associated with engineering (economic) studies to detect mineralized zones in the subsurface that possess metallic materials, but in the context of archaeology, they can also provide information about buried metal objects that may be linked to anthropogenic activities [106].

4. Summary, Conclusions, and Prospects

This entry intends first to explain the role geophysics can play in archaeological research and then focus on the specific use of the geophysical methods of ground penetrating radar (GPR) and electrical resistivity tomography (ERT). The use of these two methodologies is becoming more common in archaeological research. It can be traced to its origins in the early 20th century when researchers experimented with radiowaves to explore the subsurface. Focused initially on geological and military applications, it has evolved significantly because of the development of more robust computational and signal-processing capabilities [107].
The desire for non-invasive/non-destructive archaeological approaches proliferated when using geophysical techniques like GPR and ERT. For centuries, aspirations to meld traditional archaeological excavation methods with new, technologically based alternatives have fortified the link between archaeological traditions and technological growth and have expanded the use of multidisciplinary research designs in archaeology.
Because geophysical techniques like GPR and ERT are now more commonly used in archaeological studies, many researchers not well-versed in these emerging technologies are being exposed. This entry outlines the general approach and background for completing archeologically related research using GPR and ERT. It then dissects the methodology from a geoarchaeological project completed at the Rasu Street Prison in Vilnius, Lithuania. It uses GPR and ERT technologies to collect non-invasive data in order to determine excavation targets [20]. Researchers, students, teachers, and others can use this background information and detailed methodological explanation to better understand the intricacies of completing non-invasive, non-destructive archaeological research using GPR and ERT.
Three different GPR and ERT systems are discussed to facilitate a better understanding. Then, techniques related to the collection of GPR data are described, with three examples provided, which is followed by a description of the GPR data collection system that was used to collect GPR data at the Rasu Street Prison, with an image of the collected data provided. The same information for data collection using ERT is provided as well. Then, detailed information for 21 terms or concepts presented in Appendix A, are provided, as are 26 terms or concepts related to Appendix B. Hence, a total of 47 terms and concepts are explained, visual representations of some of these terms and concepts are provided via 11 figures, and throughout this entry, the approach, general background, and terms and concepts related to the methodology are further illuminated via 133 references.
This entry is intended to be a resource to facilitate a more complete understanding of the use of the geophysical techniques GPR and ERT in archaeological research. The examples that are provided in this entry, and the linkages to the literature via the references, will expand the knowledge base of those who read this entry, who are not experts in the field, and will serve to further illustrate the valuable linkages that can be forged between traditional and technology-driven archaeological approaches. Beyond the knowledge provided by this entry, the next logical step is to create a similar publication that focuses on other geophysical methodologies compatible with archaeological research. This can include, but is not limited to, magnetometry, seismic studies, gravity (micro-gravity) measurements, and thermal infrared imaging. Specifically, magnetometry is well-suited to detect buried metal objects, as seismic data, which uses reflected sound waves, can be used to create images of subsurface features, helping archaeologists identify and map buried structures or remains without excavation. Gravity surveys can detect subsurface features and structures without excavation by measuring variations in Earth’s gravitational field, and thermal imaging (thermography) is a non-destructive technique used to detect and analyze variations in temperature caused by buried features or artifacts [108,109].

Funding

Research by the author that is discussed in this article was funded by grants from the Charles Henry Leach II Fund and the School of Science and Engineering at Duquesne University, the Uniting Foundation, the Museum of the Jews in Latvia, the University of Hartford, the Jewish Community of Lithuania, and the Embassy of the United States of America in Vilnius, Lithuania. Additional funding was provided to colleagues that worked on these projects via the International Fellows Program, L.E. Phillips Family Foundation, Jeff Liddicoat, and the Office of Research and Sponsored Program—Student/Faculty Collaboration/Summer Research Experience for Undergraduate Grants from the University of Wisconsin-Eau Claire.

Institutional Review Board Statement

Not applicable.

Informed Consent Statement

Not applicable.

Data Availability Statement

No new data were created or analyzed in this entry. Data sharing is not applicable to this entry.

Acknowledgments

It would not have been possible for me to complete the research referenced and used as examples in this article without the assistance and cooperation of numerous individuals and organizations. My colleagues Harry Jol, Alastair McClymont, Paul Bauman, Mantas Daubaras, Ramunas Smigelskas, and Richard Freund were instrumental in the successful completion of these projects. As were our local collaborators, in Latvia, the Museum of the Jews in Latvia, Ilya Lensky, the Jewish Community of Latvia, the Uniting Foundation, the Jewish Community of Liepaja, the Liepaja Jewish Heritage Foundation, and Ilana Ivanova. I also thank the Jewish Community of Lithuania. Lastly, completion of these various projects would not have been possible without the assistance of students from various academic institutions in the United States. The students who participated are too numerous to list, but I thank them and their academic institutions, which include Duquesne University, University of Wisconsin-Eau Claire, University of Hartford, Christopher Newport University, University of British Columbia, and Indiana University.

Conflicts of Interest

The author declares no conflicts of interest.

Appendix A. GPR Methodology

The GPR technique used in this entry [20] is based on the propagation and reflection of pulsed, high-frequency electromagnetic (EM) energy [110,111]. The use of this field technique, which provides near-surface, high-resolution, near-continuous profiles for the investigation of shallow subsurface features is being used more frequently at archaeological sites because of the availability of portable, robust digital GPR systems [112,113,114]. Publications resulting from past investigations have shown that GPR is a valuable, efficient, and effective research methodology [41,115,116,117,118,119,120,121]. GPR profiles were collected with 500-Megahertz (MHz) antennae. The antenna separation was 0.5 m, and to provide good horizontal resolution, the step size was 0.02 m. To aid in data collection, a carrier transport system was used, so the system could be easily dragged across the land surface. Each trace was vertically stacked with an appropriate sampling rate. The digital profiles were downloaded, saved to an external hard drive, processed, and plotted using GFP Edit and EKKO_Project software version 3 packages [122]. Basic processing included automatic gain control (AGC), signal saturation correction, trace stacking (horizontal averaging), and point stacking (running average). The two-way travel time window used for each gridline was 100 ns, to represents a balance between detection depth, data resolution, and processing efficiency, and the near-surface velocity of 10 cm/ns was estimated for each gridline in this entry using the hyperbolic (hyperbola) velocity calibration tool within the EKKO_Project version 3 software package [122]. Multiple hyperbolic features within each of the gridlines were used to estimate the 10 cm/ns near-surface velocity measurement. The profiles were corrected for topography using a Topcon Total Station and/or a Topcon Laser Leveler. The application of radar stratigraphic analysis (distinct signature patterns) on the collected data provides the framework to investigate lateral and vertical geometry and stratification of archaeological features [123,124].

Appendix B. ERT Methodology

ERT is a technique for mapping the distribution of subsurface electrical resistivity, or inverse conductivity, in a cross-sectional format [125,126,127]. As part of the ERT data collection process, resistivity data are collected through a linear array of electrodes coupled to a direct current (DC) resistivity transmitter, receiver, and electronic switching relays. The spacing between electrodes controls the horizontal and vertical resolution of the data, with a smaller spacing resulting in higher horizontal and vertical resolution. The array’s length controls the investigation depth. The relationship is, the more extended the electrode array, the greater the investigation depth. Data collection is sequential and automated, taking advantage of all possible combinations of current injection and potential measurement electrodes [111,112]. Downloaded data are processed and analyzed on a laptop computer, often in the field. Then, the data are inverted (i.e., modeled) using a two-dimensional (2D) finite difference or a finite element inversion routine using RES2DINV tomographic “inversion” version 5.0 software, which iteratively calculates the 2D (or cross-sectional) model of the ground that best fits the data that have been measured [33]. The final 2D cross-section, known as a “true” geoelectric section, plots resistivity (in Ohm-m) or conductivity (in milliSiemens per meters [mS/m]) versus depth [85,128]. All ERT data were acquired for this research using a minimum electrode spacing of 0.125 m. These surveys utilized an ABEM Terrameter LS resistivity system, and the data were acquired using an expanded gradient acquisition sequence [45,46,47]. Figure 8 depicts the ERT data acquisition system used for this research.
A 12 V battery powered the transmitter within the ERT system. The electrodes inserted into the ground are connected to the transmitter unit via a multicore cable. Individual measurements are then obtained by sending an electrical current from the 12 V battery to a pair of injection electrodes, and the resulting voltage is measured on a pair of separate reception electrodes. An expanded gradient acquisition sequence can be used to acquire ERT profiles to optimize the lateral and vertical resolution of the desired subsurface target. Multiple-gradient arrays of the type used in this research are more efficient to collect with multichannel systems because they have a lower sensitivity to noise [45,46,47]. Data processing included the removal of any negative values and apparent outliers. The ERT methods used in this research yielded a cross-section showing changes in the soil resistivity. All ERT inversions were calculated using L2-norm smoothness constraints, and model cell widths were set to equal half (0.0625 m) of the minimum electrode spacing (0.125 m). For each inverted profile, convergence was reached after no more than five iterations, and root-mean-square errors were 3–8% [45,46,47].
IP (electrically induced polarization) is a second electrical imaging survey collected simultaneously and with the same equipment [129,130]. While resistivity surveys the subsurface in terms of its unit volume resistance to the passage of electrical current, IP images the subsurface in terms of its changeability, which is loosely analogous to the ability of the subsurface to store an electrical charge [131]. Resistivity measurements take place while current passes through the subsurface. During IP measurement, no current is actively transmitted through the subsurface materials. Chargeability, measured in milliseconds (msec), represents the area under the voltage curve that rapidly decays after current transmission ceases [132]. A chargeability section can be inverted (i.e., modeled) from the acquired raw IP data. Generally, sand and silt will have zero chargeability, and clay may have a very low but measurable chargeability of a few msec. Metal objects in the subsurface can have a chargeability of tens, hundreds, or thousands of msec, depending on the size, surface area, and burial depth [133]. Hence, an IP survey can detect metal objects buried in the subsurface.

References

  1. Geological Society of America (GSA). Geophysics Overview. Center for Professional Excellence. 2025. Available online: https://careers.geosociety.org/career/geophysicist (accessed on 26 March 2025).
  2. Sarris, A.; Kalayci, T.; Moffat, I.; Manataki, M. An Introduction to Geophysical and Geochemical Methods in Digital Geoarchaeology. In Digital Geoarchaeology, Natural Science in Archaeology; Siart, C., Forbriger, M., Bumboozer, O., Eds.; Springer: Cham, Switzerland, 2018. [Google Scholar] [CrossRef]
  3. Guarinello, N. Archaeology and the Meanings of Material Culture. In Global Archaeological Theory; Springer: Boston, MA, USA, 2006; pp. 19–27. [Google Scholar] [CrossRef]
  4. Salisbury, R.; Bull, I.; Cereda, S.; Draganits, E.; Dulias, K.; Kowarik, K.; Meyer, M.; Zavala, E.; Salisbury, K. Making the Most of Soils in Archaeology. A Review. Archaeol. Austriaca 2022, 106, 319–334. [Google Scholar] [CrossRef]
  5. Huddleston, J.; Kling, G. Manual for Judging Oregon Soils; Extension Service 1996; Oregon State University: Corvallis, OR, USA, 1996; 102p, Available online: https://ir.library.oregonstate.edu/concern/open_educational_resources/3197xm437 (accessed on 20 April 2025).
  6. Capozzoli, L.; Giampaolo, G.; DeMartino, G.; Perciante, F.; Lapenna, V.; Rizzo, E. ERT and GPR Prospecting Applied to Unsaturated and Subwater Analogue Archaeological Site in a Full-Scale Laboratory. Appl. Sci. 2022, 12, 1126. [Google Scholar] [CrossRef]
  7. Kirch, P. Archaeology and Global Time Change: The Holocene Record. Annu. Rev. Environ. Resour. 2005, 30, 409–440. [Google Scholar] [CrossRef]
  8. Deiana, R.; Leucci, G.; Martorana, R. New Perspectives on Geophysics for Archaeology: A Special Issue. Surv. Geophys. 2018, 39, 1035–1038. [Google Scholar] [CrossRef]
  9. De Giorgi, L.; Leucci, G. The archaeological site of Sagalassos (Turkey): Exploring the mysteries of the invisible layers using geophysical methods. Explor. Geophys. 2018, 49, 751–761. [Google Scholar] [CrossRef]
  10. Landeschi, G. Rethinking GIS, three-dimensionality, and space perception in archaeology. World Archaeol. 2019, 51, 17–32. [Google Scholar] [CrossRef]
  11. Banning, E. Archaeological Spatial Analysis; Gillings, M., Hacıgüzeller, P., Lock, G., Eds.; Routledge: London, UK, 2020; Chapter 2; 24p. [Google Scholar] [CrossRef]
  12. State Historic Preservation Office: Ohio History Connection, Archaeology Guidelines Supplement for Geophysical Survey. 2022. 47p. Available online: https://www.ohiohistory.org/wp-content/uploads/2022/12/Archaeology_Guidelines_Supplement_Geophysical_Survey.pdf (accessed on 20 April 2025).
  13. Sensors and Software: From Radiodetection. Ground Penetrating Radar (GPR) Solutions 2025. Available online: https://www.sensoft.ca/ (accessed on 23 April 2025).
  14. Geophysical Survey Systems, World Leader in Ground Penetrating Radar (GPR). 2025. Available online: https://www.geophysical.com/about-gssi (accessed on 25 April 2025).
  15. Guideline Geo, MALÅ GPR Systems. 2025. Available online: https://www.guidelinegeo.com/mala-ground-penetrating-radar-gpr/ (accessed on 25 April 2025).
  16. Guideline Geo, ABEM Geophysical Solutions. 2025. Available online: https://www.guidelinegeo.com/abem-resistivity-seismics-tem/ (accessed on 28 April 2025).
  17. Advanced Geoscience Incorporated (AGI), Electrical Resistivity Imaging Instruments. 2025. Available online: https://www.agiusa.com/ (accessed on 25 April 2025).
  18. Zonge International, Electrical & Electromagnetic Geophysical Survey Methods. 2025. Available online: http://zonge.com/geophysical-methods/electrical-em/ (accessed on 1 May 2025).
  19. Malagodi, S.; Orlando, L.; Piro, S.; Rosso, F. Location of Archaeological Structures using GPR Method: Three-dimensional Data Acquisition and Radar Signal Processing. Archaeol. Prospect. 1996, 3, 13–23. [Google Scholar] [CrossRef]
  20. Reeder, P.; Jol, H.; McClymont, A.; Bauman, P.; Daubaras, M. Interconnected Histories: Searching for Jacob Gens’ Grave and Instead Finding a Forgotten Early 18th Century Cemetery. Histories 2025, 5, 17. [Google Scholar] [CrossRef]
  21. CLU-IN, Characterization Technology Guides, Geophysical Methods: Electrical Resistivity Tomography, 2025. Available online: https://clu-in.org/characterization/technologies/default2.focus/sec/Geophysical_Methods/cat/Electrical_Resistivity_Tomography/ (accessed on 10 May 2025).
  22. Harikumar, R.; Prabu, R.; Raghavan, S. Electrical Impedance Tomography (EIT) and Its Medical Applications: A Review. Int. J. Soft Comput. Eng. (IJSCE) 2013, 3, 193–198. [Google Scholar]
  23. Benson, R.; Glaccum, R. Geophysical Techniques for Sensing Buried Wastes and Waste Mitigation. Lockheed Engineering and Management Services, Environmental Monitoring Systems Lab, U.S. Department of Commerce, National Technical Information Service 1984, 256p. Available online: https://nepis.epa.gov/Exe/tiff2png.cgi/P1007SIO.PNG?-r+75+-g+7+D%3A%5CZYFILES%5CINDEX%20DATA%5C81THRU85%5CTIFF%5C00001925%5CP1007SIO.TIF (accessed on 10 May 2025).
  24. Atekwana, E.; Atekwana, E. Geophysical Signatures of Microbial Activity at Hydrocarbon Contaminated Sites: A Review. Surv. Geophys. 2009, 31, 247–283. [Google Scholar] [CrossRef]
  25. Reci, H.; Jata, I.; Bushati, S. ERT Method for the Detection of Buried Archaeological Objects in Apollonia and Bylis, Albania. Rom. Rep. Phys. 2015, 67, 665–672. [Google Scholar]
  26. Negri, S.; Leucci, G.; Mazzone, F. High resolution 3D ERT to help GPR data interpretation for researching archaeological items in a geologically complex subsurface. J. Appl. Geophys. 2008, 65, 111–120. [Google Scholar] [CrossRef]
  27. Deiana, R.; Bonetto, J.; Mazzariol, A. Integrated Electrical Resistivity Tomography and Ground Penetrating Radar Measurements Applied to Tomb Detection. Surv. Geophys. 2018, 39, 1081–1105. [Google Scholar] [CrossRef]
  28. Puspita, M.; Suyanto, I. Investigation of groundwater aquifer at Noborejo, Salatiga using Electrical Resistivity Tomography (ERT) and Vertical Electrical Sounding (VES) methods. In International Conference on Innovation and Technology, IOP Conference: Earth and Environmental Science; IOP Publishing: Bristol, UK, 2020; Volume 524, p. 012009. [Google Scholar] [CrossRef]
  29. Reeder, P.; Jol, H.; Freund, R.; McClymont, A.; Bauman, P.; Šmigelskas, R. Investigations at the Heereskraftfahrpark (HKP) 562 Forced-Labor Camp in Vilnius, Lithuania. Heritage 2023, 6, 466–482. [Google Scholar] [CrossRef]
  30. Day-Lewis, F.; Johnson, C.; Singha, K.; Lane, J., Jr. Best Practices in Electrical Resistivity Imaging: Data Collection and Processing, and Application to Data from Corinna, Maine. An Administrative Report for EPA Region 1. 227p. Available online: https://clu-in.org/programs/21m2/projects/EPA_admin_report_02Dec2008_final.pdf (accessed on 10 May 2025).
  31. Papadopoulos, N.; Tsourlos, P.; Tsokas, G.; Sarris, A. Efficient ERT measuring and inversion strategies for 3D imaging of buried antiquities. Near Surf. Geophys. 2007, 5, 349–361. [Google Scholar] [CrossRef]
  32. Interstate Technology and Regulatory Council (ITRC), Implementing Advanced Site Characterization Tools. ASCT-1. Washington, DC; 2019. Available online: https://asct-1.itrcweb.org/5-surface-geophysics/?print=pdf (accessed on 9 May 2025).
  33. RES2DINV (Version 5.0), Rapid 2-D Resistivity & IP Inversion. Geotomo Software, 2025. Available online: https://ags-cloud.dk/AGS/Geotomo%20Manuals/Res2DInv_Manual.pdf (accessed on 11 May 2025).
  34. Lu, D.; Wang, F.; Chen, X.; Ou, J.; Wang, H. An Improved ERT Approach for the Investigation of Subsurface Structures. Pure Appl. Geophys. 2017, 174, 375–386. [Google Scholar] [CrossRef]
  35. Diallo, M.; Cheng, L.; Rosa, E.; Gunther, C.; Chouteau, M. Integrated GPR and ERT data interpretation for bedrock identification at Cléricy, Québec, Canada. Eng. Geol. 2019, 248, 230–241. [Google Scholar] [CrossRef]
  36. Jia, W.; Wang, S.; Min, S.; Zhang, Y. Electromagnetic energy focusing technology with GPR array transmitting antenna for high resolution detection. Measurement 2022, 203, 112000. [Google Scholar] [CrossRef]
  37. Bernabini, M.; Pettinelli, E.; Pierdicca, N.; Piro, S.; Versino, L. Field experiments for characterization of GPR antenna and pulse propagation. J. Appl. Geophys. 1995, 33, 63–76. [Google Scholar] [CrossRef]
  38. EPA: United States Environmental Protection Administration. Ground Penetrating Radar (GPR): Basic Concept. Available online: https://www.epa.gov/environmental-geophysics/ground-penetrating-radar-gpr (accessed on 20 May 2025).
  39. Zhang, C.; Gravey, M.; Mariéthoz, G.; Irving, J. Reconstruction of High-Resolution 3D GPR Data from 2D Profiles: A Multiple-Point Statistical Approach. Remote Sens. 2024, 16, 2084. [Google Scholar] [CrossRef]
  40. Bano, M.; Economou, N.; Bradford, J.; Giannopoulos, A.; Klotzsche, A.; Slob, E.; Tsoflias, G. GPR data imaging and interpretation—Introduction. Geophysics 2022, 87, WBi–WBii. [Google Scholar] [CrossRef]
  41. Bristow, C.S.; Jol, H.M. An Introduction to Ground Penetrating Radar (GPR) in Sediments, GPR in sediments: Advice on data collection, basic processing and interpretation, a good practice guide. In Geological Society; Special Publications: London, UK, 2003; Volume 211, pp. 9–27. [Google Scholar]
  42. Junoh, M.; Sulaiman, S.; Razali, M.; Rashid, N.; Mahmood, M.; Satirapod, C. Utilizing of 500 MHz Ground Penetrating Radar Antenna Coupling at Different Interval Heights Clearance. IOP Conference Series: Earth and Environmental Science, 1217. In Proceedings of the 6th International Conference on Research Methodology for Built Environment and Engineering, Bangkok, Thailand, 28 February–2 March 2023; pp. 1–15. [Google Scholar] [CrossRef]
  43. Quang-Huy, T.; Sharma, B.; Theu, L.; Tran, D.; Chowdhury, S.; Karthik, C.; Guruswamy, S. Frequency-hopping along with resolution-turning for fast and enhanced reconstruction in ultrasound tomography. Sci. Rep. 2024, 14, 15483. [Google Scholar] [CrossRef]
  44. Sensors and Software from Radiodetection. Field Guide for Archeologists Using GPR. Available online: https://www.sensoft.ca/wp-content/uploads/2021/10/Field-Guide-for-Archaeologist-Using-GPR-FinalV2.pdf (accessed on 20 May 2025).
  45. McClymont, A.F.; Bauman, P.D.; Freund, R.A.; Seligman, J.; Jol, H.M.; Reeder, P.; Bensimon, K.; Vengalis, R. Preserving Holocaust history: Geophysical investigations at the Ponary (Paneriai) extermination site. Geophysics 2021, 87, 15–25. [Google Scholar] [CrossRef]
  46. McClymont, A.; Konik, J.; Jol, H.; Bauman, P.; Miazga, C.; Reeder, P. 3D characterization of the Mila 18 archaeological site in Warsaw, Poland: From imaging to excavation. Lead. Edge 2024, 43, 657–664. [Google Scholar] [CrossRef]
  47. Reeder, P.; Jol, H.; McClymont, A.; Bauman, P.; Barrow, M. Using Geophysics to Locate Holocaust Era Mass Graves in Jewish Cemeteries: Examples from Latvia and Lithuania. Heritage 2024, 7, 3766–3798. [Google Scholar] [CrossRef]
  48. Sensors and Software from Radiodetection. Glossary of GPR Terms. Antenna Separation. Available online: https://www.sensoft.ca/resources/glossary-of-gpr-terms-2-2/ (accessed on 20 May 2025).
  49. Hui, C.; Luo, T.; Lai, W.; Chang, R. GPR mapping with mobile mapping sensing and tracking technologies. Tunn. Undergr. Space Technol. 2022, 122, 104362. [Google Scholar] [CrossRef]
  50. GuidelineGeo, Ground Penetrating Radar-GPR. Can GPR Surveys Be Carried Out on Ground or in Ground. Available online: https://www.guidelinegeo.com/ground-penetrating-radar-gpr/ (accessed on 20 May 2025).
  51. Kruske, M.; Ernenwein, E. What do we gain from high-rate digital stacking? In Proceedings of the 18th International Conference on Ground Penetrating Radar, Golden, CO, USA, 14–19 June 2020. [Google Scholar] [CrossRef]
  52. Sensors and Software from Radiodetection. EKKO_Project™ GPR Software. Available online: https://www.sensoft.ca/products/ekko-project/overview/ (accessed on 20 May 2025).
  53. Sensors and Software from Radiodetection. GFP_Edit. Available online: https://www.sensoft.ca/wp-content/uploads/2016/03/GFP_Edit-Users-Guide.pdf (accessed on 20 May 2025).
  54. Onajite, E. Automatic Gain Control. Chapter 5—Understanding the Detail Seismic Processing Techniques Used to Convert the Acquired Seismic Data into the Geologic Section of the Earth. In Seismic Data Analysis Techniques in Hydrocarbon Exploration; Elsevier: Amsterdam, The Netherlands, 2014; pp. 71–85. [Google Scholar] [CrossRef]
  55. Adepelumi, A.; Fayemi, O.; Akindulureni, J. Geophysical Mapping of Subsurface Stratigraphy Beneath a River Bed Using Ground Penetrating Radar: Lagos Nigeria Case Study. Univers. J. Geosci. 2013, 1, 10–19. [Google Scholar] [CrossRef]
  56. Fisher, S.; Stewart, R.; Jol, H. Processing ground penetrating radar (GPR) data. CREWES Res. Rep. 1994, 4, 1–21. [Google Scholar]
  57. Yilmazi, O. Velocity Stack Processing. Geophys. Prospect. 1989, 37, 357–382. [Google Scholar] [CrossRef]
  58. Forte, E.; Pipan, M. Review of multi-offset GPR applications: Data acquisition, processing, and analysis. Signal Process. 2018, 132, 210–220. [Google Scholar] [CrossRef]
  59. Conyers, L. Ground-Penetrating Radar for Landscape Archaeology; University of Denver: Denver, CO, USA; Available online: https://mysite.du.edu/~lconyer/landscape_archaeology.pdf (accessed on 5 June 2025).
  60. Andres, C.; Smith, I.; Lee, A.; Mishev, I.; Daly, M.; Lacelle, D.; Rabus, B.; Thomson, L. Integrated Synthetic Aperture Radar (SAR) and Multi-frequency ground penetrating radar (GPR) for Shallow Ice Targets in Tombstone Territorial Park, Yukon, Canada: Insights for the International Mars Ice Mapper Mission (I-MIM). LPI Contrib. 2024, 3040, 2247. [Google Scholar]
  61. Sudakova, M.; Sadurtdinov, M.; Skvortsov, A.; Tsarev, A.; Malkova, G.; Molokitina, N.; Romanovsky, V. Using Ground Penetrating Radar for Permafrost Monitoring from 2015–2017 at CALM Sites in the Pechora River Delta. Remote Sens. 2021, 13, 3271. [Google Scholar] [CrossRef]
  62. Jacob, R.; Urban, T. Ground-Penetrating Radar Velocity Determination and Precision Estimates Using Common-Midpoint (CMP) Collection with Hand-Picking, Semblance Analysis and Cross-Correlation Analysis: A Case Study and Tutorial for Archaeologists. Archaeometry 2015, 58, 987–1002. [Google Scholar] [CrossRef]
  63. Tillard, S.; Dubois, J. Analysis of GPR data: Wave propagation velocity determination. Appl. Geophys. 1995, 33, 77–91. [Google Scholar] [CrossRef]
  64. GPR Training Courses.Com. Introduction to GPR Training Courses, pulseEkko Pro Velocity Analysis, 2025. Available online: https://gprtrainingcourses.com/gpr-training-courses/pulseekko-pro-course/pulseekko-pro-velocity-analysis-page/# (accessed on 22 May 2025).
  65. Wunderlich, T.; Majchczack, B.; Wilken, D.; Segschneider, M.; Rabbel, W. What Is Beyond Hyperbola Detection and Characterization in Ground-Penetrating Radar Data?—Implications from the Archaeological Site of Goting, Germany. Remote Sens. 2024, 16, 4080. [Google Scholar] [CrossRef]
  66. Bekic, B. Topography Correction and the Importance of Applying It to the GPR Records. Geoscanners AB. Geophysical Survey Solutions. Application Note No. AN012072911EN. Available online: http://www.geoscanners.es/appnotes/topography_correction.pdf (accessed on 22 May 2025).
  67. Medina, P.; Limarino, C.; Bonomo, N.; Bernárdez, S.; Osella, A. Using Ground Penetrating Radar, and attribute analysis for identifying depositional units in a fluvial-aeolian interaction environment: The Guandacol Valley, northwest Argentina. J. South Am. Earth Sci. 2020, 98, 102467. [Google Scholar] [CrossRef]
  68. Martindale, A.; Wadsworth, W.; Simons, E.; Whiting, B.; Grier, C. The challenges of signal interpretation of burials in ground-penetrating radar. Archaeol. Prospect. 2023, 31, 337–351. [Google Scholar] [CrossRef]
  69. Mumpy, A.; Jol, H.; Kean, W.; Isbell, J. Architecture, and Sedimentology of an Active Braid Bar in the Wisconsin River Based on 3-D Ground Penetrating Radar; Geoscience World; Geological Society of America: Boulder, CO, USA, 2007; Volume 432. [Google Scholar] [CrossRef]
  70. Pereira, J.; Hernández, J.; Zanini, A.; Varouchakis, E.; Azevedo, L. Iterative geostatistical electrical resistivity tomography inversion. Hydrogeol. J. 2023, 31, 1627–1645. [Google Scholar] [CrossRef]
  71. Loke, M.; Chambers, J.; Rucker, D.; Kuras, O.; Wilkinson, P. Recent developments in the direct-current geoelectrical imaging method. J. Appl. Geophys. 2013, 95, 135–156. [Google Scholar] [CrossRef]
  72. US EPA, Environmental Geophysics, Electrical Conductivity and Resistivity. Available online: https://www.epa.gov/environmental-geophysics/electrical-conductivity-and-resistivity (accessed on 27 May 2025).
  73. Loke, M. Electrical Imaging Surveys for Environmental and Engineering Studies. A Practical Guide to 2-D and 3-D Surveys. Available online: https://www.geometrics.com/wp-content/uploads/2018/10/Lokenote.pdf (accessed on 28 May 2025).
  74. Gaffney, C. Detecting Trends in the Prediction of the Buried Past: A Review of Geophysical Techniques in Archaeology. Archaeometry 2008, 50, 313–336. [Google Scholar] [CrossRef]
  75. US EPA, Environmental Geophysics, Electrical Resistivity. Available online: https://www.epa.gov/environmental-geophysics/electrical-resistivity (accessed on 28 May 2025).
  76. Ullah, S.; Iqbal, M.; Zhou, B. A Novel Electrode Array for Electrical Resistivity Tomography to Assess Groundwater Resources: Field Test at Liwa UAE. J. Environ. Eng. Sci. 2020, 15, 1900056. [Google Scholar] [CrossRef]
  77. Moreira, C.; Lapola, M.; Carrara, A. Comparative Analyzes Among Electrical Resistivity Tomography Arrays in the Characterization of Flow Structure in Free Aquifer. Universidad Nacional Autónoma de México. Geofísica Int. 2016, 55. Available online: https://www.redalyc.org/jatsRepo/568/56844823003/html/index.html (accessed on 28 May 2025).
  78. Geophysics for Practicing Geophysicists. DC Resistivity Instruments. 2017. Available online: https://gpg.geosci.xyz/content/DC_resistivity/DC_instruments.html (accessed on 28 May 2025).
  79. Zonge International, DC Resistivity & Electrical Resistivity Tomography Methods (ERT). 2025. Available online: http://zonge.com/geophysical-methods/electrical-em/dc-resistivity/ (accessed on 28 May 2025).
  80. Ciani, L.; Patrizi, G.; Innocenti, A.; Fanti, R.; Pazzi, V. Considerations on the Electrode-Spacing-to-Electrode-Diameter Ratio in Electrical Resistivity Tomography (ERT): An Operational Approach. IEEE Trans. Instrum. Meas. 2024, 73, 4504312. [Google Scholar] [CrossRef]
  81. Li, A.; Parsekian, A.; Grana, D.; Carr, B. Quantification of measurement uncertainty in electrical resistivity tomography data and its effect on the inverted resistivity model. Geophysics 2025, 90, 275–291. [Google Scholar] [CrossRef]
  82. Advanced Geoscience Incorporated (AGI), Dipole-Dipole Array: Electrical Resistivity Methods, Part 3, 2017. Available online: https://www.agiusa.com/dipole-dipole%E2%80%8B-%E2%80%8Barray%E2%80%8B (accessed on 25 May 2025).
  83. Guideline Geo, ABEM Terrameter LS, Resistivity, and Imaging, 2025. Available online: https://wwwguidelinegeoc.cdn.triggerfish.cloud/uploads/2016/06/ABEM-Terrameter-LS-Product-Brochure.pdf (accessed on 28 May 2025).
  84. Olayinka, A.A.I.; Yaramanci, U. Use of block inversion in the 2-D interpretation of apparent resistivity data and its comparison with smooth inversion. J. Appl. Phys. 2000, 45, 63–81. [Google Scholar] [CrossRef]
  85. Fang, H.; Jiang, L.; Jin, G.; Zou, A.; Wang, B. Cross-street electrical resistivity imaging for environmental applications. J. Appl. Geophys. 2023, 217, 105182. [Google Scholar] [CrossRef]
  86. Boonchaisuk, S.; Vachiratienchai, C.; Siripunvaraporn, W. Two-dimensional direct current (DC) resistivity inversion: Data space Occam’s approach. Phys. Earth Planet. Inter. 2008, 168, 204–211. [Google Scholar] [CrossRef]
  87. Alzahrani, H.; Abdelrahman, K.; Hazaea, S. Use of geoelectrical resistivity method for detecting near-surface groundwater potential zones at Riyadh city, Saudi Arabia. J. King Saud Univ.-Sci. 2022, 34, 1–8. [Google Scholar] [CrossRef]
  88. Asare, A.; Owusu-Nimo, F.; Ali, B.; Ampofo, B. Estimating the depth of investigation in electrical resistivity survey: Laboratory measurements. J. Sci. Technol. 2024, 42, 13–24. [Google Scholar] [CrossRef]
  89. Bernard, J. Iris Instruments: Short Note on the Depth of Investigation of Electrical Methods. Available online: https://www.iris-instruments.com/Pdf_file/Resistivity_Imaging/methods_depth_investigation.pdf (accessed on 9 May 2025).
  90. SEIS Tech, Multi Electrode Resistivity Cable (IP Resistivity Cable). Available online: https://www.seis-tech.com/resistivity-cable/ (accessed on 29 May 2025).
  91. Vásconez-Maza1, M.; Martínez-Pagán, P.; Aktarakçi, H.; García-Nieto, M.; Martínez-Segura1, M. Enhancing electrical contact with a commercial polymer for electrical resistivity tomography on archaeological sites: A case study. Materials 2020, 13, 5012. [Google Scholar] [CrossRef]
  92. Zhou, B.; Ullah, S.; Asim, M.; Won, M.; Alkatheeri, S. An alternative to the traditional electrode arrays for 2D electrical resistivity tomography: Enhanced version of the common gradient measurement. In Proceedings of the Fifth International Conference on Engineering Geophysics (ICEG), Al Ain, UAE, 21–24 October 2020. [Google Scholar] [CrossRef]
  93. Jiang, F.; Ni, J.; Chen, H.; Gao, L.; Chen, S.; Wu, X.; Su, Z.; Lei, Y.; Dai, M.; Han, R.; et al. Resistivity tomography based on multichannel electrodes. Appl. Geophys. 2024, 21, 639–649. [Google Scholar] [CrossRef]
  94. GuidelineGeo. Why Am I Getting Negative Resistivity Values? Available online: https://www.guidelinegeo.com/help-articles/negative-resistivity-why-am-i-getting-negative-resistivity-values/ (accessed on 29 May 2025).
  95. Loke, M.; Acworth, I.; Dahlin, T. A comparison of smooth and blocky inversion methods in 2-D electrical imaging surveys. ASEG Ext. Abstr. 2001, 1, 1–4. [Google Scholar] [CrossRef]
  96. McClymont, A.; Hayashi, M.; Bentley, L.; Christensen, B. Geophysical imaging and thermal modeling of subsurface morphology and thaw evolution of discontinuous permafrost. J. Geophys. Res. Earth Surface 2013, 118, 1826–1837. [Google Scholar] [CrossRef]
  97. Frost, J. Statistics by Jim: Root Mean Square Error (RMSE). Available online: https://statisticsbyjim.com/regression/root-mean-square-error-rmse/ (accessed on 29 May 2025).
  98. US EPA, Environmental Geophysics, Induced Polarization (IP) and Complex Resistivity. Available online: https://www.epa.gov/environmental-geophysics/induced-polarization-ip-and-complex-resistivity (accessed on 2 June 2025).
  99. Orozco, A.; Steiner, M.; Katona, T.; Roser, N.; Moser, C.; Stumvoll, M.; Glade, T. Application of induced polarization imaging across different scales to understand surface and groundwater flow at the Hofermuehle landslide. Catena 2022, 219, 1–18. [Google Scholar] [CrossRef]
  100. Weller, A.; Nordsiek, S.; Bauerochse, A. Spectral Induced Polarization—A Geophysical Method for Archaeological Prospection in Peatlands. J. Wetl. Archaeol. 2006, 6, 105–125. [Google Scholar] [CrossRef]
  101. Geophysics for Practicing Geophysicists. Chargeability. 2017. Available online: https://gpg.geosci.xyz/content/physical_properties/induced_polarization_physical_properties_duplicate.html (accessed on 2 June 2025).
  102. Zeid, N.; Corradini, E.; Bignardi, S.; Morandi, N.; Nizzo, V.; Santarato, G. Unusual Geophysical Techniques in Archaeology—HVSR and Induced Polarization, a Case History. Near-Surface Geophysics Conference. In Proceedings of the 22nd European Meeting of Environmental and Engineering Geophysics, Barcelona, Spain, 4–6 September 2016; pp. 1–5. Available online: https://www.researchgate.net/publication/307594492 (accessed on 11 May 2025).
  103. Masria, A.; Alshammari, O.; Ghareeb, M.; Seif, A.; Abd-Elmaboud, M.; Ammar, A. 2D and 3D Modeling of Resistivity and Chargeability to Identify the Type of Saturated Groundwater for Complex Sedimentary Facies. Hydrology 2024, 11, 120. [Google Scholar] [CrossRef]
  104. Abidin, M.; Saad, R.; Wijeyesekera, D.; Ahmad, F.; Baharuddin, M.; Tajudin, S.; Madun, A. The Influences of Basic Physical Properties of Clayey Silt and Silty Sand on Its Laboratory Electrical Resistivity Value in Loose and Dense Conditions. Saina Malays. 2017, 46, 1959–1969. [Google Scholar] [CrossRef]
  105. EM Geosci. Factors Impacting Conductivity and Chargeability, Physical Properties, Electrical Conductivity. 2025. Available online: https://em.geosci.xyz/content/physical_properties/electrical_conductivity/electrical_conductivity_factors.html (accessed on 2 June 2025).
  106. Earth Science Australia. Earth Sciences E-Learning, Exploration Geophysics, 2025. Available online: https://earthsci.org/education/fieldsk/geophysics/geophysics.html (accessed on 2 June 2025).
  107. Admin-Y2Kdo, Process Cloud Mapping, Engineering and Technology, Unearthing the Past: How Ground Penetrating Radar Transforms Archaeological Discoveries. Available online: https://pcm-cloud.com/engineering-and-technology/how-gpr-transforms-archaeology/ (accessed on 5 June 2025).
  108. Martorana, R.; Capizzi, P.; Pisciotta, A.; Scudero, S.; Bottari, C. An Overview of Geophysical Techniques and Their Potential Suitability for Archaeological Studies. Heritage 2023, 6, 2886–2927. [Google Scholar] [CrossRef]
  109. Wynn, J. A review of geophysical methods used in archaeology. Geoarchaeology 1986, 1, 245–257. [Google Scholar] [CrossRef]
  110. Lombardi, F.; Podd, F.; Solla, M. From Its Core to the Niche: Insights from GPR Applications. Remote Sens. 2022, 4, 3033. [Google Scholar] [CrossRef]
  111. Luo, T.; Lai, W.; Chang, R.; Goodman, D. GPR imaging criteria. J. Appl. Geophys. 2019, 165, 37–48. [Google Scholar] [CrossRef]
  112. Conyers, L. Analysis, and interpretation of GPR datasets for integrated archaeological mapping. Near Surf. Geophys. 2015, 13, 645–651. [Google Scholar] [CrossRef]
  113. Zhao, W.; Forte, E.; Pipan, M.; Tian, G. Ground Penetrating Radar (GPR) attribute analysis for archaeological prospection. J. Appl. Geophys. 2013, 97, 107–117. [Google Scholar] [CrossRef]
  114. Manataki, M.; Vafidis, A.; Sarris, A. GPR Data Interpretation Approaches in Archaeological Prospection. Appl. Sci. 2021, 11, 7531. [Google Scholar] [CrossRef]
  115. Jol, C.; Jol, H.; Dettinger, M.; Singleton, K.; Freund, R.; Reeder, P.; Miazga, C.; Bauman, P.; Wiley, P.; Lensky, I.; et al. Subsurface Imaging of a Holocaust Mass Burial Site: Jungfernhof Concentration Camp, Riga, Latvia. In Proceedings of the 19th International Conference on Ground Penetrating Radar, Golden, CO, USA, 12–17 June 2022. [Google Scholar]
  116. Jol, H.M. Ground penetrating radar antennae frequencies and transmitter powers compared for penetration depth, resolution, and reflection continuity. Geophys. Prospect. 1995, 43, 693–709. [Google Scholar] [CrossRef]
  117. Jol, H.M. (Ed.) Ground Penetrating Radar (GPR) Theory and Applications; Elsevier: Amsterdam, The Netherlands, 2009; 524p. [Google Scholar]
  118. Fischer, A.; Jol, H.; Uchyti1, G.; Hall, N.; Freund, R.; Bauman, P.; McClymont, A.; Miazga, C.; Reeder, P.; Konik, J.; et al. Searching for the Ringleblum Archives: Documentation of Life During the Holocaust—A Ground Penetrating Radar Investigation of Krasinskich Park, Warsaw, Poland. In Proceedings of the 19th International Conference on Ground Penetrating Radar, Golden, CO, USA, 12–17 June 2022; Available online: http://digital.library.wisc.edu/1793/84382 (accessed on 27 April 2025).
  119. Hall, N.; Jol, H.; Fischer, A.; Uchytil1, G.; Freund, R.; Bauman, P.; McClymont, A.; Miazga, C.; Reeder, P.; Konik, J.; et al. Holocaust Archaeology: GPR Subsurface Imaging of the Mila 18 Memorial in Warsaw, Poland. In Proceedings of the 19th International Conference on Ground Penetrating Radar, Golden, CO, USA, 12–17 June 2022. [Google Scholar] [CrossRef]
  120. Uchytil, G.; Jol, H.; Fischer, A.; Hall, N.; Freund, R.; Bauman, P.; McClymont, A.; Miazga, C.; Reeder, P.; Konik, J.; et al. Archaeological GPR investigation of the Bersohn and Bauman Jewish Children’s Hospital in Warsaw, Poland: Locating potential Holocaust artifacts. In Proceedings of the 19th International Conference on Ground Penetrating Radar, Golden, CO, USA, 12–17 June 2022. [Google Scholar] [CrossRef]
  121. Smith, D.; Jol, H.M. Ground penetrating radar: Antenna frequencies and maximum probable depths of penetration in Quaternary sediments. J. Appl. Geophys. 1995, 33, 93–100. [Google Scholar] [CrossRef]
  122. EKKO_Project™ GPR Software; Sensors and Software: Mississauga, ON, Canada, 2024; Available online: https://www.sensoftca/products/ekko-project/overview/ (accessed on 1 February 2025).
  123. Economou, N.; Bano, M.; Ortega-Ramirez, J. Delineation of Fractures Using a 2D GPR Processing Strategy for 3D Imaging: Weak Zones within Carbonates at the Archaeological Site of Xochicalco in Mexico. Appl. Sci. 2021, 11, 5893. [Google Scholar] [CrossRef]
  124. Lanzarone, P.; Bigman, D. Processing considerations and improved interpretation for ground-penetrating radar imaging of a relict archaeological excavation unit. Near Surf. Geophys. 2018, 16, 463–475. [Google Scholar] [CrossRef]
  125. Fischer, P.; Wunderlich, T.; Rabbel, W.; Vött, A.; Willershäuser, T.; Baika, K.; Rigakou, D.; Metallinou, G. Combined Electrical Resistivity Tomography (ERT), Direct-Push Electrical Conductivity (DP-EC) Logging and Coring–A New Methodological Approach in Geoarchaeological Research. Archaeol. Prospect. 2016, 23, 213–228. [Google Scholar] [CrossRef]
  126. Arato1, A.; Piro, S.; Sambuelli, L. 3D inversion of ERT data on an archaeological site using GPR reflection and 3D inverted magnetic data as a priori information. Near Surf. Geophys. 2015, 13, 545–556. [Google Scholar] [CrossRef]
  127. Cardarelli, E.; De Donno, G. Chapter 2—Advances in electric resistivity tomography: Theory and case studies. In Innovation in Near-Surface Geophysics: Instrumentation, Application, and Data Processing Methods; Elsevier: Amsterdam, The Netherlands, 2019; pp. 23–57. [Google Scholar] [CrossRef]
  128. Bièvre, G.; Oxarango, L.; Günther, T.; Goutaland, D.; Massardi, M. Improvement of 2D ERT measurements conducted along a small earth-filled dyke using 3D topographic data and 3D computation of geometric factors. J. Appl. Geophys. 2018, 153, 100–112. [Google Scholar] [CrossRef]
  129. Ali, B.; Nanda, M.; Zainal, M.; Yanis, M.; Surbakti, M.; Idris, N.; Ismail, N. Application of ERT, IP and VLF-EM Methods to Investigate Landslide-Prone Structures at Archaeological Sites in Lamreh, Aceh Besar, Indonesia. Trends Sci. 2024, 21, 7221. [Google Scholar] [CrossRef]
  130. Shao, P.; Shang, Y.; Hasan, M.; Yi, X.; Meng, H. Integration of ERT, IP and SP Methods in Hard Rock Engineering. Appl. Sci. 2021, 11, 10752. [Google Scholar] [CrossRef]
  131. Bala, G.A.; Bery, A.A.; Gnapragasan, J.; Akingboye, A.S. Development of novel resistivity-chargeability statistical relationships for subsurface characterization at Langkawi, Kedah. Environ. Sci. Pollut. Res. 2024, 1, 1–21. [Google Scholar] [CrossRef] [PubMed]
  132. Tso, C.; Kuras, O.; Wilkinson, P.; Uhlemann, S.; Chambers, J.; Meldrum, P.; Graham, J.; Sherlock, E.; Binley, A. Improved characterization and modelling of measurement errors in electrical resistivity tomography (ERT) surveys. J. Appl. Geophys. 2017, 146, 103–119. [Google Scholar] [CrossRef]
  133. Martínez, J.; Rey, J.; Sandoval, S.; Hidalgo, C.; Mendoza, R. Geophysical Prospecting Using ERT and IP Techniques to Locate Galena Veins. Remote Sens. 2019, 11, 2923. [Google Scholar] [CrossRef]
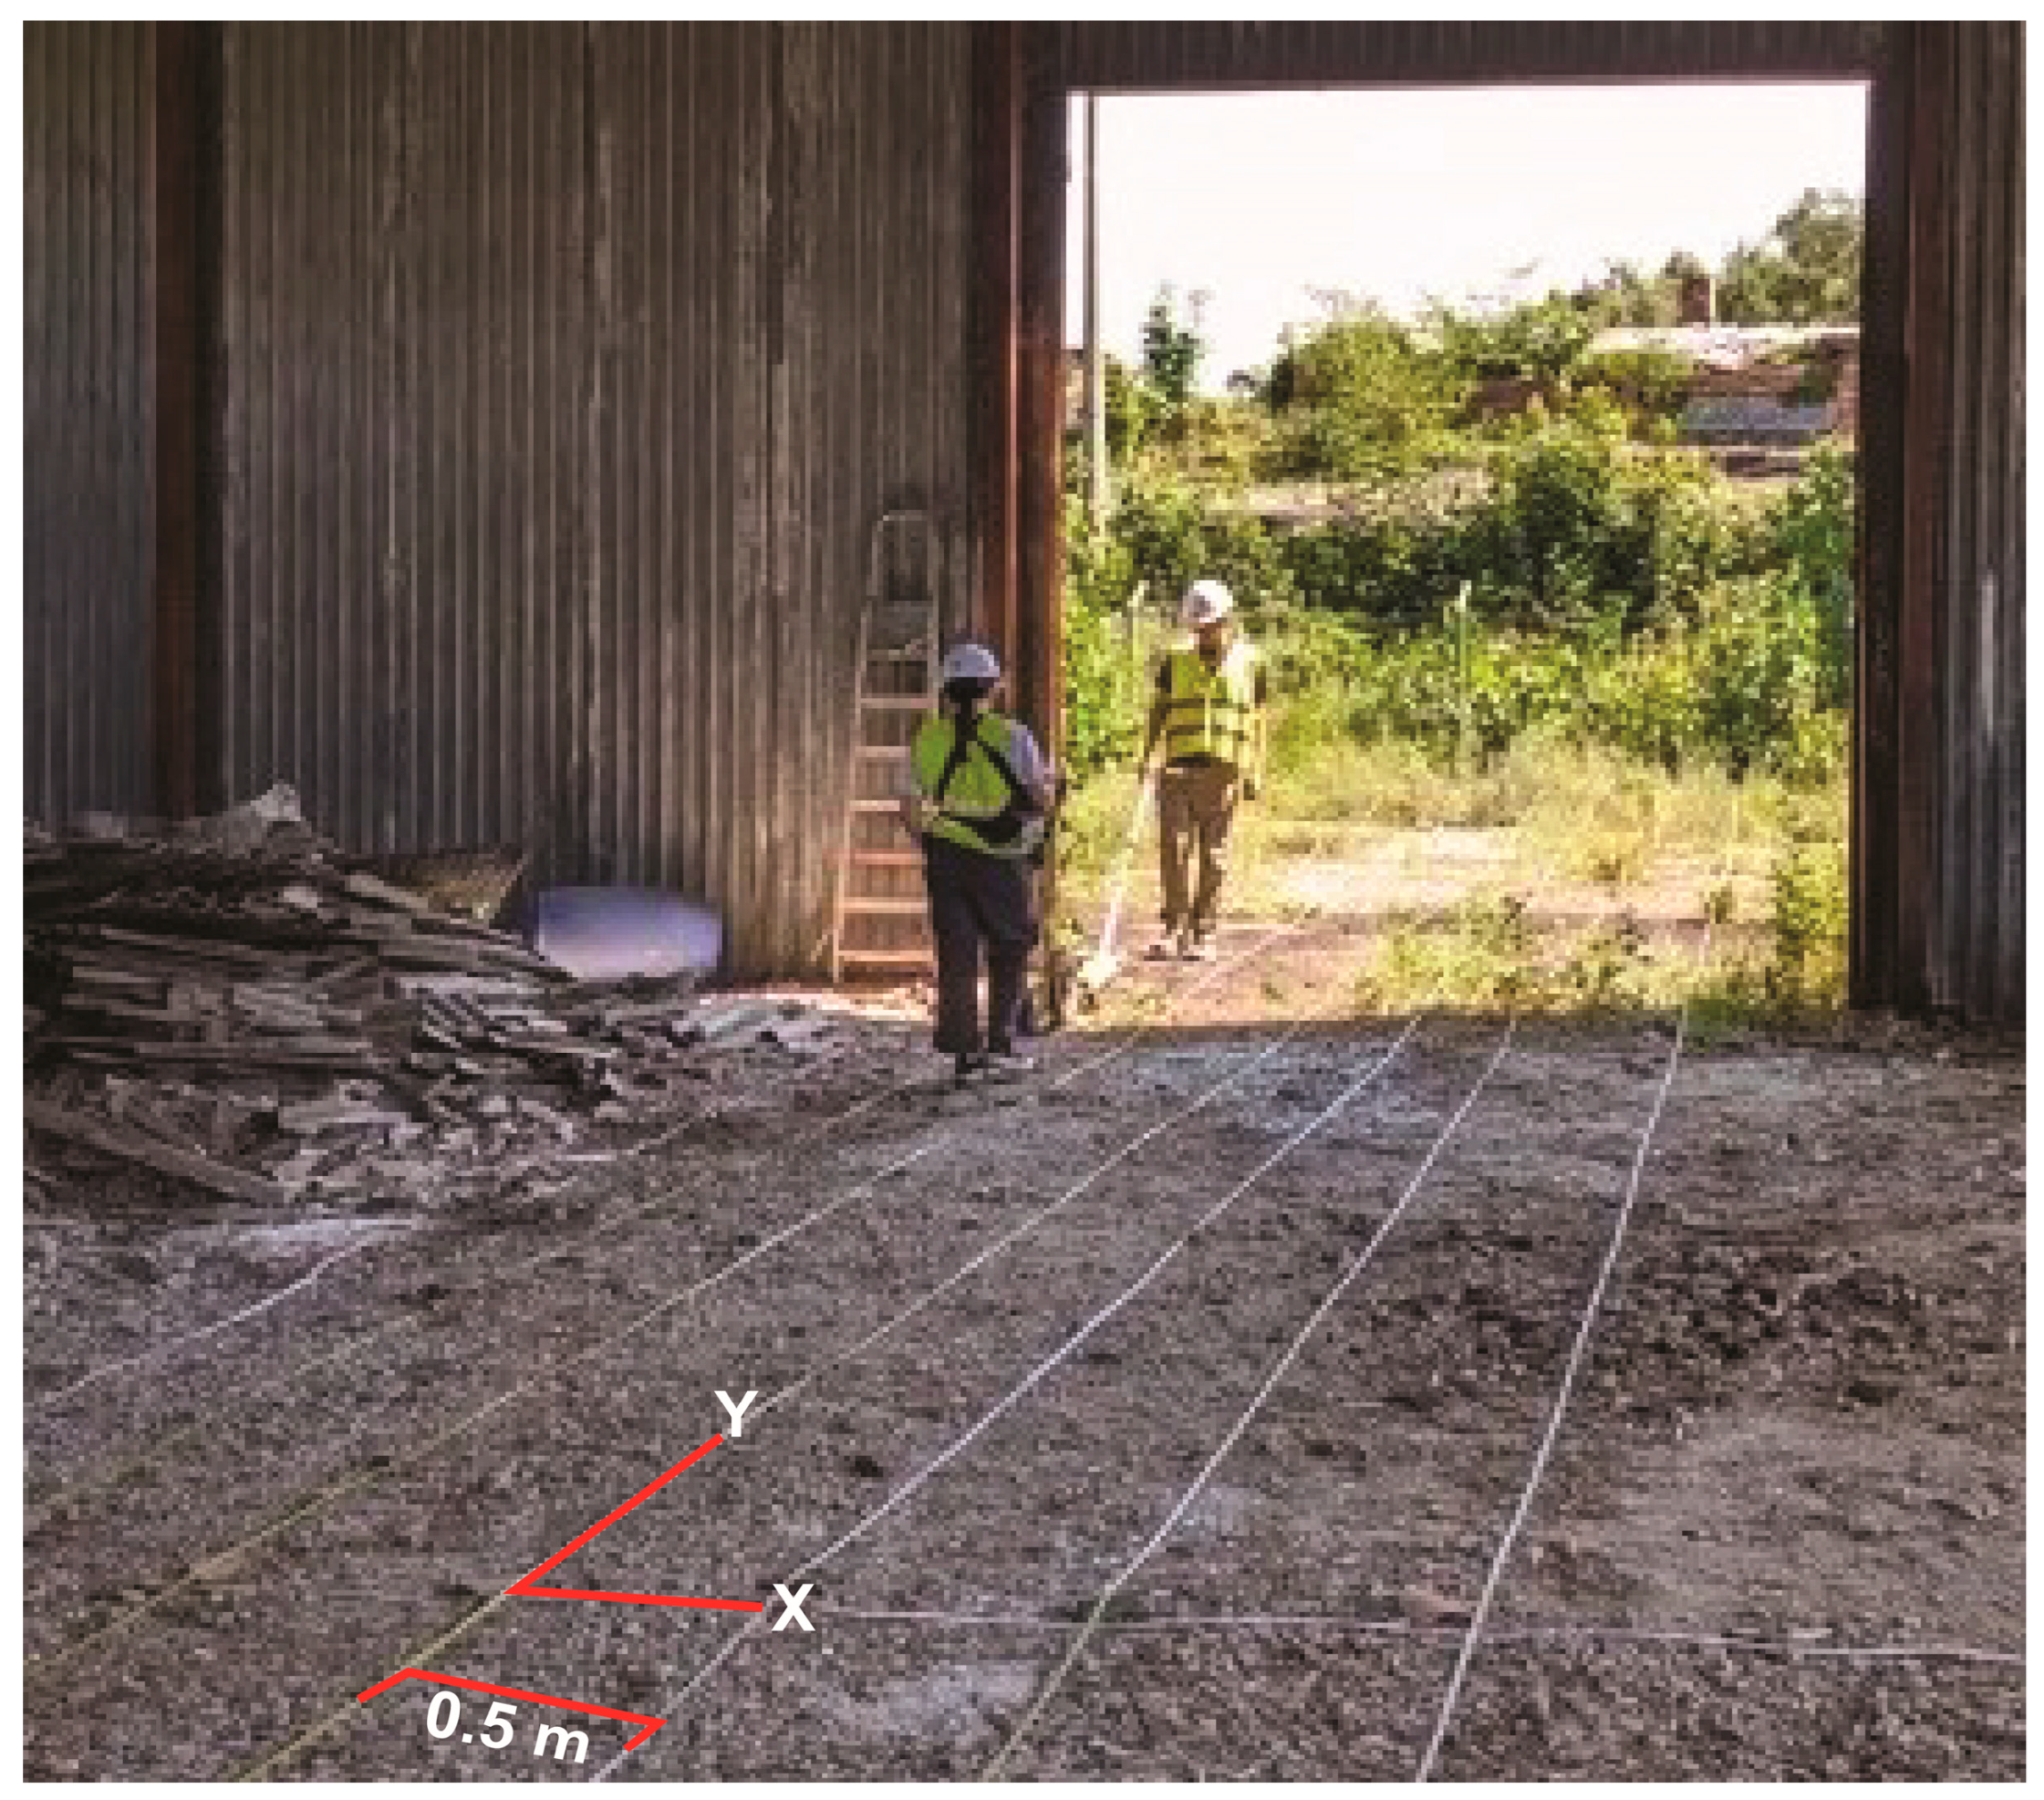
Figure 1. Collecting GPR data in Liepaja, Latvia, as part of a project to determine the location of a mass grave associated with the Holocaust.
Encyclopedia 05 00151 g001
Figure 2. Example of a 16.0 m (x axis) by 10.5 m (y axis) grid from research completed at the Rasu Street Prison in Vilnius, Lithuania. The transect lines are 0.25 m apart, so there are 61 lines along the x axis, and 42 lines along the y axis (data from Ref. [20].)
Encyclopedia 05 00151 g002
Figure 3. A 14 m × 16.5 m GPR grid created at the archaeological remains of the Kahal Grande Synagogue in Rhodes, Greece, with 28 transect lines along the x axis and 34 lines along the y axis, with all lines spaced 0.25 m apart. The red arrows indicate the direction the data was collected.
Encyclopedia 05 00151 g003
Figure 4. Collecting GPR data using a Sensors and Software pulseEKKO™ GPR system, and a schematic diagram depicting how the GPR system operates.
Encyclopedia 05 00151 g004
Figure 5. A composite image of GPR reflection patterns, with the darker colors indicating higher reflection values, from 81 to 131 cm below the surface at the Rasu Street Prison in Vilnius, Lithuania. The red circle highlights a location where archaeological excavation exposed human skeletal remains that consisted of the upper torso and skull (adapted from Ref. [20]).
Encyclopedia 05 00151 g005
Figure 6. Collecting ERT data at the Rasu Street Prison using an ABEM Terrameter LS resistivity (RES), time-domain induced polarization (IP), and self-potential data acquisition system.
Encyclopedia 05 00151 g006
Figure 7. Map of the Heereskraftfahrpark (HKP) 562 Forced-Labor Camp in Vilnius, Lithuania, with the location of three ERT transect lines and three separate anomalies (A, B, C) that may indicate the location of Holocaust-era mass graves highlighted (reprinted from Ref. [29]).
Encyclopedia 05 00151 g007
Figure 8. Collecting ERT data at the site of the former HKP Forced-Labor Camp in Vilnius, Lithuania, and a schematic diagram depicting how the ERT system operates (photo adapted from Ref. [29]).
Encyclopedia 05 00151 g008
Figure 9. ERT profile from the Rasu Street Prison study location (adapted from Ref. [20]).
Encyclopedia 05 00151 g009
Figure 10. An example of a GPR cross-sectional profile showing data from 0.9 m beneath the surface. Numerous hyperbolas, as indicated by the red arrows, are present at this depth in the dataset.
Encyclopedia 05 00151 g010
Figure 11. ERT profile from the Old Jewish Cemetery in Riga, Latvia (adapted from Ref. [47]).
Encyclopedia 05 00151 g011
Disclaimer/Publisher’s Note: The statements, opinions and data contained in all publications are solely those of the individual author(s) and contributor(s) and not of MDPI and/or the editor(s). MDPI and/or the editor(s) disclaim responsibility for any injury to people or property resulting from any ideas, methods, instructions or products referred to in the content.