Abstract
Environmental noise pollution is nowadays one of the most serious health threats. The impact of noise on the human body depends not only on the sound level but also on its spectral distribution. Reliable measurements of the environmental noise spectrum are often hampered by the very high price of top quality measuring devices. This paper explores the possibility of using much cheaper audio recorders for the frequency analysis. Comparative research was performed in laboratory and field conditions, which showed that, with some limitations, these devices can be useful in analyzing the frequency of environmental noise. This provides an opportunity for reducing the cost of noise analysis experimental work.
1. Introduction
Environmental noise has a negative impact on human well-being and health, and excessive exposure to it, in addition to the obvious effect, i.e., hearing loss, causes a number of other diseases and ailments such as cardiovascular diseases, poorer concentration, increased stress levels, increased sugar and cholesterol levels, decreased immunity, sleep disorders and even mental illnesses [1,2,3,4,5,6,7,8,9,10,11,12,13,14,15,16,17,18,19,20,21,22,23,24]. For this reason, monitoring environmental pollution by noise is an important issue. The main sources of environmental noise in the human environment are transport and industry [25,26,27,28,29,30,31,32,33,34,35]. The nuisance of a given noise results not only directly from its intensity, but also from the acoustic signal spectrum [36,37,38,39,40,41,42]. This is due to the non-linear sensitivity of the human ear to particular sound frequencies. As a rule, the most annoying noise is in higher parts of the acoustic spectrum. To assess the noise level and its spectral distribution, the so-called sonometers, i.e., sound level meters measure the sound pressure level. They allow for the immediate control of the noise level and analysis of the frequency spectrum. However, top quality sound level meters are very expensive devices, while cheap ones do not fulfil their purpose due to the use, during their production, of low-class technical components. In particular, the spectral analysis of noise, performed using cheap sonometers, is impossible due to the very limited bandwidth of their measurement microphones. An alternative to the usage of high-class sonometers may be to apply audio recorders, which are much cheaper but often equipped with high-quality built-in microphones with a wide acoustic band; sometimes they allow for the connection of external microphones. Of course, audio recorders do not allow for the direct measurement of sound intensity due to their ability to adjust the recording level. This assessment is only possible by comparison with a sonometer. However, it seems that they can be used for noise spectrum analysis. This paper assesses the suitability of a relatively cheap audio recorder with an external microphone for the spectral analysis of environmental noise. The impetus for the creation of this paper was also research assessing the usefulness of smartphones for the environmental noise analysis [43,44,45,46,47]. The positive results of the studies cited above provide the basis for attempting to use audio recorders as devices that can be useful to assess environmental noise.
2. Subject and Methodology of Research
During the conducted research, usefulness of a portable audio recorder TASCAM—model DR-40X (made by TASCAM Company, Montebello, CA, USA) for spectral analysis of environmental noise has been assessed. Both microphones built into the device and the external condenser microphone from AKG—model P170 (made by AKG Acoustic, Vienna, Austria)—have been checked. The first-class sound level meter from Bruel & Kjaer—model 2250 Light (made by Bruel & Kjaer Sound and Vibration Measurement A/S, Næerum, Denmark)—has been used as a reference device. From the metrological point of view, a first-class sound level meter is a device which meets the requirements of the IEC 61672-1 standard [48]. The above-mentioned standard defines a number of parameters related to linearity, operating temperature range, frequency response, etc., which the meter must meet to be considered as a first-class device. The detailed interpretation of this standard, which is binding in Poland, specifies that the extended uncertainty of the sound level measurement (with level of confidence 95%) cannot exceed the value of U95 = 3 dB [49].
Table 1 presents a summary of the main technical parameters of the used equipment.

Table 1.
Summary of main technical parameters of used equipment.
Comparative research was carried out in two stages. First, measurements were made in controlled conditions, i.e., using a known acoustic signal recorded in a room with a high degree of sound attenuation. In the second stage, the results obtained in field conditions when measuring environmental noise emitted by trains running on the railway line were compared. In both cases, differences in the spectrum of the signal recorded by individual devices were analyzed in detail.
3. Results
3.1. Results of Laboratory Experiments
Laboratory research was performed in a well-soundproofed chamber, whose approximate dimensions are width 212 cm; length 565 cm; height 250 cm. The walls and ceiling were covered with sound-absorbing material, while the floor was a double-layer one with layers separated by sound-damping material. Thanks to this, good insulation from external sounds was obtained, despite the fact that the room itself only partially meets the requirements for anechoic chambers. The background noise level in the chamber was about 18 dB. An overview of the room during the tests is shown in Figure 1.
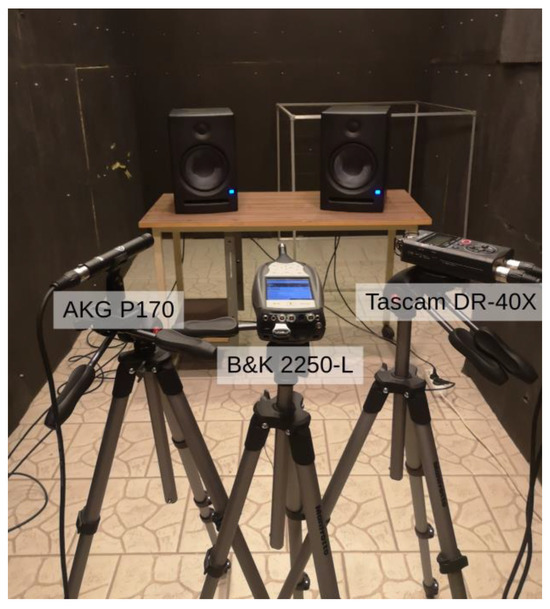
Figure 1.
Equipment arranged in an acoustically insulated chamber.
Two types of waveforms were used as test signals, namely white noise and a chirp signal, i.e., sound with a smoothly changing frequency in the acoustic band area. The sound source was two active PreSonus Eris E5 monitors (made by PreSonus Audio Electronics, Inc., Baton Rouge, LA, USA). For the first test signal, the results were subjected to spectral analysis, while in the second case, the time waveforms of the relative sound level were compared. The shape of the response, both spectral and time, reflects the image of loudspeaker and chamber-resultant frequency characteristics. From the subject analysis point of view, this does not matter, because the interesting issue is the differences between the individual devices not the frequency characteristic of a given element. Microphones of the recording equipment were placed at the height of the tweeter speaker (95 cm above the floor), at a distance of about 130 cm. The devices were located in the central part of the chamber, halfway across its width. During registration, individual devices were placed in the same place, on the symmetrical axis lying between the loudspeakers (differently than shown in Figure 1). This allowed us to obtain the repeatability of registration conditions for all the individual devices. The acoustic signals were recorded alternately by individual devices. Due to the very good measurements repeatability, the results of single recordings were selected for comparison.
A comparison of the spectral analysis results for signals recorded by individual devices is shown in Figure 2. The source sound during this analysis was white noise.
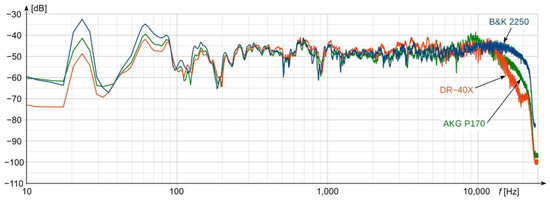
Figure 2.
Comparison of spectral analysis results obtained for signals recorded by individual devices.
The comparison of results presented in Figure 2 shows that, in the frequency range from 100 Hz to 10 kHz, the spectrum for all three devices is very similar. Small differences in the level do not exceed several dB. A slightly lower compliance in the range from 3 to 10 kHz results from the presence of standing waves in the chamber which, in combination with small differences in individual microphone transducer positions in space, gave the effect of some differences in the spectrum shape. Greater deviations between the reference and other devices are present in the areas of very low and very high frequency. They are caused by less linear frequency responses of microphones embedded in the TASCAM recorder and AKG microphone in comparison with the reference instrument—with 2250L Bruel & Kjaer meter. However, the AKG microphone clearly has better frequency parameters compared to the built-in TASCAM microphone, which would contradict the parameters of both devices provided by their manufacturers.
The comparison results of sound level changes in time for the chirp signal, which is shown in Figure 3, confirm the frequency analysis results. Both trials generally confirm the usefulness of cheaper devices for testing environmental noise acoustic spectra. The justification for this conclusion is the lack of local spectrum deviations between devices, which could be misinterpreted in measurements.
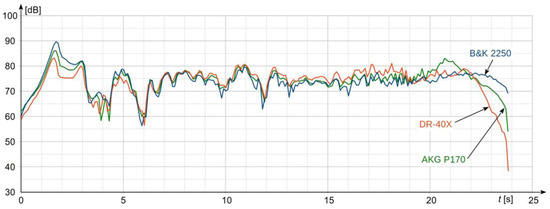
Figure 3.
Comparison of time analysis results obtained for chirp signal recorded by individual devices.
3.2. Results of Field Experiments
In order to confirm the laboratory research results, all the three analyzed devices were compared in field conditions. For this purpose, environmental noise generated by a passing train was measured. All the recording devices were located in accordance with requirements of the ISO 3095 standard [50]. Measurements were performed in a flat-terrain area. During the measurement, the air temperature oscillated around 12 °C, with a relative humidity of 45%. The comparison of the results obtained for two selected electrical multiple units (EMUs) are shown in Figure 4 and Figure 5. Registrations were made during a single passage of each train. The speed of both EMU’s was approximately 110 km/h.
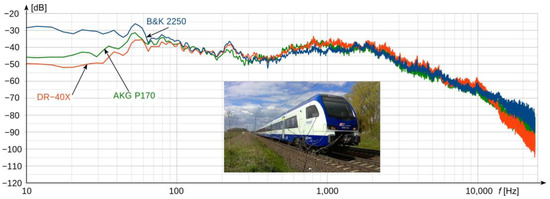
Figure 4.
Comparison for noise spectrum generated by EMU ED160.
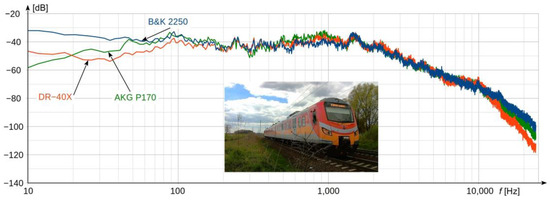
Figure 5.
Comparison for noise spectrum generated by EMU EN57.
The results recorded in field conditions confirm the dependencies observed during laboratory measurements. Basically, there is a compatibility of spectra shapes for each device in the frequency range from 100 Hz to 10 kHz. As a result of sound recording in the open area, and thus a lack of the standing wave effect characteristic for closed rooms, a better compatibility of individual spectra for frequencies from 3 to 10 kHz is visible. The most significant differences in comparison to the reference device occur in the infrasound range. The reason for this feature is the frequency characteristics of the microphones, both built into the TASCAM recorder and the external AKG one. Neither of them has a good frequency response below 20 Hz, so the infrasound, as well as the ability to conduct very low sounds in the 20–60 Hz band, is slightly limited.
The frequency response of the reference instrument reaches 5 Hz. However, it should be remembered that legal provisions regarding environmental noise measurements do not require infrasound measurements.
4. Discussion and Conclusions
The considerations presented in this paper were aimed at checking the usefulness of using cheap audio recorders for environmental noise spectral measurements. Conclusions of the conducted research clearly indicate that such devices may be useful, with certain limitations. If the basic acoustic spectrum is taken into account, i.e., the frequency range from 30 Hz to 15 kHz, the correspondence between results obtained from cheap and reference instruments is very good. Differences are visible only at edges of the acoustic band and in close ultrasound and infrasound areas. Especially in this last part of the spectrum, the results obtained from cheap devices are different than those registered by the reference one. However, it should be noted that the difference lies only in the acoustic level and relative level compared to other frequencies of the acoustic band, while the characteristic frequencies which appear in these areas of the spectrum are visible for all the analyzed recording devices. Having the possibility of comparative tests with a first-class sound level meter, we can determine the deviation of the cheaper device frequency response and correct it by way of calculation. Better results could certainly be obtained by microphones with more flat frequency characteristics. Hence, further research will be aimed at testing other types of external microphones. Having the option of a comparison with a first-class sound level meter, we are provided with an opportunity to calibrate a cheaper device for the possibility of noise-level measuring. The need for calibration and comparison is a certain limitation with regard to using a cheaper recording device. Nevertheless, the results shown indicate the possibility of employing cheaper sound recording devices for the spectral analysis of environmental noise, which allows for a significant reduction in the costs of experimental work. The possibility of a cost reduction is particularly important in the case of research which requires the usage of numerous microphones, e.g., during analysis or acoustic field distribution or during environmental noise measurements performed simultaneously within a larger area. However, it should be remembered that if it is necessary to measure the noise level, it is obligatory to calibrate cheaper recorders by comparing them with a first-class meter device.
Author Contributions
Conceptualization, J.D.S. and R.L.; methodology, J.D.S. and R.L.; software, R.L. and N.K.-B.; validation, R.L. and N.K.-B.; formal analysis, J.D.S. and R.L.; investigation, J.D.S., R.L., M.S., T.W., L.J., S.J., A.W., K.K., M.M., P.C., K.D., N.K.-B. and J.O.; resources, K.D. and S.G.; data curation, J.D.S. and R.L.; writing—original draft preparation, J.D.S.; writing—review and editing, R.L.; visualization, J.D.S.; supervision, A.W. and K.K.; project administration, P.C.; funding acquisition, A.W., K.K., M.M. and P.C. All authors have read and agreed to the published version of the manuscript.
Funding
The research project entitled “System for precise monitoring of the railway traffic impact on environment, including information on traffic, technical and environmental data. BRIK2/0020/2022” is co-financed by the National Centre for Research and Development (NCBR) and PKP Polskie Linie Kolejowe S.A. It is carried out within the framework of a joint undertaking entitled “Research and Development in Railway Infrastructure—BRIK2” in the period from 1 November 2022 to 31 October 2025. Project acronym: InfraNoise.
Data Availability Statement
The data presented in this study are available on request from the corresponding author. The data are not publicly available due to project confidentiality.
Acknowledgments
The field measurements were performed thanks to help of the company PKP Polskie Linie Kolejowe.
Conflicts of Interest
The authors declare no conflict of interest.
References
- Brown, A.L.; Van Kamp, I. WHO Environmental Noise Guidelines for the European Region: A Systematic Review of Transport Noise Interventions and Their Impacts on Health. Int. J. Environ. Res. Public Health 2017, 14, 873. [Google Scholar] [CrossRef] [PubMed]
- Tobias, A.; Recio, A.; Diaz, J.; Linares, C. Health impact assessment of traffic noise in Madrid (Spain). Environ. Res. 2015, 137, 136–140. [Google Scholar] [CrossRef] [PubMed]
- Gupta, A.; Gupta, A.; Jain, K.; Gupta, S. Noise Pollution and Impact on Children Health. Indian J. Pediatr. 2018, 85, 300–306. [Google Scholar] [CrossRef] [PubMed]
- Kim, M.; Chang, S.I.; Seong, J.C.; Holt, J.B.; Park, T.H.; Ko, J.H.; Croft, J.B. Road Traffic Noise: Annoyance, Sleep Disturbance, and Public Health Implications. Am. J. Prev. Med. 2012, 43, 353–360. [Google Scholar] [CrossRef] [PubMed]
- Hartmut, I.; Deepak, P. Noise as a stressor and its impact on health. Noise Health 2000, 2, 5–6. [Google Scholar]
- Münzel, T.; Sørensen, M.; Daiber, A. Transportation noise pollution and cardiovascular disease. Nat. Rev. Cardiol. 2021, 18, 619–636. [Google Scholar] [CrossRef]
- Lusk, S.L.; Gillespie, B.; Hagerty, B.M.; Ziemba, R.A. Acute effects of noise on blood pressure and heart rate. Arch. Environ. Health 2004, 59, 392–399. [Google Scholar] [CrossRef]
- Panulinova, E.; Harabinová, S.; Argalášová, L. Tram squealing noise and its impact on human health. Noise Health 2016, 18, 329–337. [Google Scholar]
- Bronzaft, A. Impact of Noise on Health: The Divide between Policy and Science. Open J. Soc. Sci. 2017, 5, 108–120. [Google Scholar] [CrossRef]
- Ozkurt, N.; Hamamci, S.F.; Sari, D. Estimation of airport noise impacts on public health. A case study of İzmir Adnan Menderes Airport. Transp. Res. Part D Transp. Environ. 2023, 36, 152–159. [Google Scholar] [CrossRef]
- Lim, J.; Kweon, K.; Kim, H.W.; Cho, S.W.; Park, J.; Sim, C.S. Negative impact of noise and noise sensitivity on mental health in childhood. Noise Health 2018, 20, 199–211. [Google Scholar] [PubMed]
- Hegewald, J.; Schubert, M.; Freiberg, A.; Romero Starke, K.; Augustin, F.; Riedel-Heller, S.G.; Zeeb, H.; Seidler, A. Traffic Noise and Mental Health: A Systematic Review and Meta-Analysis. Int. J. Environ. Res. Public Health 2020, 17, 6175. [Google Scholar] [CrossRef] [PubMed]
- Li, A.; Martino, E.; Mansour, A.; Bentley, R. Environmental Noise Exposure and Mental Health: Evidence From a Population Based Longitudinal Study. Am. J. Prev. Med. 2022, 63, e39–e48. [Google Scholar] [CrossRef] [PubMed]
- Brown, B.; Rutherford, P.; Crawford, P. The role of noise in clinical environments with particular reference to mental health care: A narrative review. Int. J. Nurs. Stud. 2015, 52, 1514–1524. [Google Scholar] [CrossRef] [PubMed]
- Guha, M. Noise pollution and mental health. J. Ment. Health 2022, 31, 605–606. [Google Scholar] [CrossRef] [PubMed]
- Zaman, M.; Muslim, M.; Jehangir, A. Environmental noise-induced cardiovascular, metabolic and mental health disorders: A brief review. Environ. Sci. Pollut. Res. 2022, 29, 76485–76500. [Google Scholar] [CrossRef]
- Haines, M.; Stansfeld, S.; Job, R.; Berglund, B.; Head, J. Chronic aircraft noise exposure, stress responses, mental health and cognitive performance in school children. Psychol. Med. 2001, 31, 265–277. [Google Scholar] [CrossRef] [PubMed]
- Tortorella, A.; Menculini, G.; Moretti, P.; Attademo, L.; Balducci, P.M.; Bernardini, F.; Cirimbilli, F.; Chieppa, A.G.; Ghiandai, N.; Erfurth, A. New determinants of mental health: The role of noise pollution. A narrative review. Int. Rev. Psychiatry 2022, 34, 783–796. [Google Scholar] [CrossRef]
- Guski, R.; Schreckenberg, D.; Schuemer, R. WHO Environmental Noise Guidelines for the European Region: A Systematic Review on Environmental Noise and Annoyance. Int. J. Environ. Res. Public Health 2017, 14, 1539. [Google Scholar] [CrossRef]
- Stansfeld, S.A. Noise Effects on Health in the Context of Air Pollution Exposure. Int. J. Environ. Res. Public Health 2015, 12, 12735–12760. [Google Scholar] [CrossRef]
- Dratva, J.; Zemp, E.; Dietrich, D.F.; Bridevaux, P.O.; Rochat, T.; Schindler, C.; Gerbase, M.W. Impact of road traffic noise annoyance on health-related quality of life: Results from a population-based study. Qual. Life Res. 2010, 19, 37–46. [Google Scholar] [CrossRef]
- Veber, T.; Tamm, T.; Ründva, M.; Kriit, H.K.; Pyko, A.; Orru, H. Health impact assessment of transportation noise in two Estonian cities. Environ. Res. 2022, 204, 112319. [Google Scholar] [CrossRef] [PubMed]
- Khomenko, S.; Cirach, M.; Barrera-Gómez, J.; Pereira-Barboza, E.; Iungman, T.; Mueller, N.; Foraster, M.; Tonne, C.; Thondoo, M.; Jephcote, C.; et al. Impact of road traffic noise on annoyance and preventable mortality in European cities: A health impact assessment. Environ. Int. 2022, 162, 107160. [Google Scholar] [CrossRef] [PubMed]
- Clark, C.; Stansfeld, S.A. The Effect of Transportation Noise on Health and Cognitive Development: A Review of Recent Evidence. Int. J. Comp. Psychol. 2007, 20, 145–158. [Google Scholar] [CrossRef]
- Aleknaite, M.; Grubliauskas, R. Assessment and evaluation of railway noise spread dependence on different types of sleepers. Energy Procedia 2018, 147, 249–257. [Google Scholar] [CrossRef]
- Bułhak, J.; Buchalska, E. Redukcja hałasu emitowanego przez tabor kolejowy poprzez zastosowanie kompozytowych wstawek hamulcowych. TTS Tech. Transp. Szyn. 2006, 11–12, 58–62. (In Polish) [Google Scholar]
- Renterghem, T.V.; Forssén, J.; Attenborough, K.; Jean, P.; Defrance, J.; Hornikx, M.; Kang, J. Using natural means to reduce surface transport noise during propagation outdoors. Appl. Acoust. 2015, 92, 86–101. [Google Scholar] [CrossRef]
- Ozer, S.; Yilmaz, H.; Yeşil, M.; Yeşil, P. Evaluation of noise pollution caused by vehicles in the city of Tokat, Turkey. Sci. Res. Essay 2009, 4, 1205–1212. [Google Scholar]
- Khan, D.; Burdzik, R. Measurement and analysis of transport noise and vibration: A review of techniques, case studies, and future directions. Measurement 2023, 220, 113354. [Google Scholar] [CrossRef]
- Panda, K.C. Dealing with Noise and Vibration in Automotive Industry. Procedia Eng. 2016, 144, 1167–1174. [Google Scholar] [CrossRef]
- Knall, V. Railway noise and vibration: Effects and criteria. J. Sound Vib. 1996, 193, 9–20. [Google Scholar] [CrossRef]
- Wegener, K.; Bleicher, F.; Heisel, U.; Hoffmeister, H.W.; Möhring, H.C. Noise and vibrations in machine tools. CIRP Ann. 2011, 70, 611–633. [Google Scholar] [CrossRef]
- Jagniatinskis, A.; Fiks, B.; Zaporozhets, O. Annual Assessment of Transport Noise Using Representative Time Measurements. Procedia Eng. 2016, 134, 301–308. [Google Scholar] [CrossRef]
- Korzeb, J.; Chudzikiewicz, A. Evaluation of the vibration impacts in the transport infrastructure environment. Arch. Appl. Mech. 2015, 85, 1331–1342. [Google Scholar] [CrossRef]
- Polak, K.; Korzeb, J. Pomiary hałasu pochodzącego od pojazdów kolejowych zwiększonych prędkości. Probl. Kolejnictwa Z. 2019, 84, 33–38. (In Polish) [Google Scholar]
- Kurra, S.; Tamer, N. Rating criteria for facade insulation against transportation noise sources. Appl. Acoust. 1993, 40, 213–237. [Google Scholar] [CrossRef]
- Dragan, S.; Bogomolov, A. Methodological Aspects of Industrial and Transport Noise Monitoring. In Management of Noise Pollution; Chapter 3; IntechOpen: London, UK, 2023. [Google Scholar] [CrossRef]
- Ryu, J.; Song, H. Effect of building façade on indoor transportation noise annoyance in terms of frequency spectrum and expectation for sound insulation. Appl. Acoust. 2019, 152, 21–30. [Google Scholar] [CrossRef]
- Makarewicz, R.; Jarzęcki, J.; Berezowska-Apolinarska, K.; Preis, A. Rail transportation noise with and without a barrier. Appl. Acoust. 1989, 26, 135–147. [Google Scholar] [CrossRef]
- Kralov, I.; Piskova, A.; Nedelchev, K. An experimental study and analysis of a new railway transport noise absorber. AIP Conf. Proc. 2014, 1631, 23–28. [Google Scholar] [CrossRef]
- Zepler, E.E.; Sullivan, B.M.; Rice, C.G.; Griffin, M.J.; Oldman, M.; Dickinson, P.J.; Shepherd, K.P.; Ludlow, J.E.; Large, J.B. Human response to transportation noise and vibration. J. Sound Vib. 1973, 28, 375–401. [Google Scholar] [CrossRef]
- Diyar, K.; Burdzik, R. A Review on Different Regulation for the Measurement of Transport Noise and Vibration. J. Meas. Eng. 2023, 11, 196–213. [Google Scholar] [CrossRef]
- Nast, D.R.; Speer, W.S.; Le Prell, C.G. Sound level measurements using smartphone “apps”: Useful or inaccurate? Noise Health 2014, 16, 251–256. [Google Scholar] [CrossRef] [PubMed]
- Murphy, E.; King, E.A. Testing the accuracy of smartphones and sound level meter applications for measuring environmental noise. Appl. Acoust. 2016, 106, 16–22. [Google Scholar] [CrossRef]
- Celestina, M.; Hrovat, J.; Kardous, C.A. Smartphone-based sound level measurement apps: Evaluation of compliance with international sound level meter standards. Appl. Acoust. 2018, 139, 119–128. [Google Scholar] [CrossRef]
- Şabikoğlu, İ.; Akbaba Şabikoğlu, D. Comparison of environment noise intensity using Ios and Android based sound measurement applications and commercial sound measurement devices and obtaining the measurement uncertainty. Yüzüncü Yıl Üniversitesi Fen Bilim. Enstitüsü Derg. 2021, 26, 69–79. [Google Scholar] [CrossRef]
- Sakagami, K.; Satoh, F.; Omoto, A. Use of mobile devices with multifunctional sound level measurement applications: Some experiences for urban acoustics education in primary and secondary schools. Urban Sci. 2019, 3, 111. [Google Scholar] [CrossRef]
- EN IEC 61672-1:2014; Electroacoustics—Sound Level Meters—Part 1: Specifications. Polski Komitet Normalizacyjny: Warszawa, Poland, 2014.
- Rozporządzenie Ministra Środowiska z dnia 16 czerwca 2011 r. w sprawie wymagań w zakresie prowadzenia pomiarów poziomów substancji lub energii w środowisku przez zarządzającego drogą, linią kolejową, linią tramwajową, lotniskiem lub portem. Dz. Ustaw 2011, 140, 8505–8532. (In Polish)
- EN ISO 3095:2013; Acoustic—Railway Applications—Measurement of Noise Emitted by Rail Bound Vehicles. Polski Komitet Normalizacyjny: Warszawa, Poland, 2013.
Disclaimer/Publisher’s Note: The statements, opinions and data contained in all publications are solely those of the individual author(s) and contributor(s) and not of MDPI and/or the editor(s). MDPI and/or the editor(s) disclaim responsibility for any injury to people or property resulting from any ideas, methods, instructions or products referred to in the content. |
© 2023 by the authors. Licensee MDPI, Basel, Switzerland. This article is an open access article distributed under the terms and conditions of the Creative Commons Attribution (CC BY) license (https://creativecommons.org/licenses/by/4.0/).


