
Article

Evaluation of Peritoneal Membrane Function After Dapagliflozin Treatment in a Patient Who Had Undergone Peritoneal Dialysis

1
Faculty of Nursing, Department of Nephrology, An-Najah National University, Nablus P.O. Box 7, Palestine
2
Faculty of Medicine, Arab American University of Palestine, Jenin P.O. Box 240, Palestine
3
Clinical Research in Health Science, Faculty of Graduate Studies, An-Najah National University, Nablus P.O. Box 7, Palestine
*
Author to whom correspondence should be addressed.
Kidney Dial. 2026, 6(3), 49; https://doi.org/10.3390/kidneydial6030049
Submission received: 4 May 2026 / Revised: 10 June 2026 / Accepted: 23 June 2026 / Published: 17 July 2026

Abstract

Peritoneal ultrafiltration failure is a major complication of peritoneal dialysis and a common cause of technique failure often leading to hemodialysis. Chronic exposure to glucose-based dialysate contributes to inflammation, fibrosis, and peritoneal membrane dysfunction. This study evaluated the effects of dapagliflozin on peritoneal membrane function in patients with ultrafiltration failure undergoing continuous ambulatory peritoneal dialysis. In our pre–post observational study, 32 patients with high/high–average peritoneal transport status and ultrafiltration failure received dapagliflozin 10 mg daily for six months. Peritoneal equilibration tests using a 4.25% dextrose solution were performed during early peritoneal dialysis, at ultrafiltration failure, and after treatment. Ultrafiltration volume, dialysate-to-plasma creatinine ratio, dialysate glucose ratio, sodium dip, and clinical/biochemical parameters were assessed. Dapagliflozin treatment was found to be associated with higher ultrafiltration volume (480 mL vs. 90 mL at ultrafiltration failure, p < 0.001), preservation of the intraperitoneal glucose gradient, changes in the dialysate-to-plasma creatinine ratio, and altered sodium dip parameters. Favorable changes were also observed in blood pressure, body mass index, inflammatory markers, hemoglobin, albumin, sodium, bicarbonate, and glycemic indices. No serious adverse events were reported. These findings suggest that dapagliflozin may improve ultrafiltration efficiency and peritoneal membrane function in peritoneal dialysis patients with ultrafiltration failure. Further randomized controlled trials are warranted.

1. Introduction

Peritoneal dialysis (PD) is a common option in renal replacement therapy for individuals with end-stage renal disease (ESRD), using the peritoneum as a dialysis membrane [1] and relying on an osmotic gradient between blood and dialysate to shift salt and water from the vasculature to the dialysate, which is subsequently discarded [2]. The standard osmotic agent used in the peritoneal dialysate is glucose, generally absorbed by the patient in varying degrees depending on the characteristics and transporter status of the peritoneal membrane [3]. PD is based on the exchange of water and solutes between capillary blood and dialysis fluid across the peritoneal membrane.
Globally, approximately 11% of patients receiving dialysis are treated with PD [4]. Given the well-established association between volume overload and adverse outcomes including reduced technique survival and increased mortality, adequate ultrafiltration (UF) is a cornerstone of effective PD therapy [5]. UF depends on the osmotic gradient generated by hypertonic glucose-based dialysate solutions, which facilitates fluid removal across the peritoneal membrane. Notably, UF volume and volume status are closely interrelated. Several studies have demonstrated that higher UF volumes are associated with an improved prognosis in PD patients [6,7].
The osmotic glucose gradient is highest at the initiation of dialysis, but progressively declines as glucose diffuses from the dialysate into the systemic circulation. This decline occurs more rapidly in patients with high peritoneal vascularity or rapid transport status, thereby limiting effective UF [8]. A common clinical strategy to counteract this phenomenon is the use of dialysate solutions with higher glucose concentrations in order to augment the osmotic gradient. However, prolonged exposure to high glucose concentrations induces a “diabetic-like” microenvironment within the peritoneal cavity [9]. Mesothelial cells, the first cellular barrier exposed to glucose-containing PD fluids, are particularly susceptible to glucotoxicity injury. Chronic glucose exposure promotes epithelial to mesenchymal transition (EMT) and stimulates the production of pro-inflammatory, pro-fibrotic, and pro-angiogenic mediators, thus ultimately contributing to leukocyte infiltration, fibrosis, and angiogenesis within the peritoneal membrane [10].
Although the detrimental effects of glucose absorption from the peritoneal cavity have been extensively investigated in PD research [11], data regarding the expression of glucose transporters at the mesothelial cell level and their structural and functional implications remain limited, thus demonstrating the presence of sodium-dependent glucose transporters (SGLT1) on the apical membrane of human peritoneal mesothelial cells (HPMCs) [12]. However, strategies aimed at increasing dialysate glucose concentrations to enhance UF may be counterproductive, as systemic hyperglycemia and increased glucose exposure can accelerate peritoneal membrane injury, potentially leading to technique failure and discontinuation of PD therapy [13].
Patients characterized as high or rapid peritoneal transporters typically achieve adequate solute clearance under standard continuous ambulatory peritoneal dialysis (CAPD) regimens. Nevertheless, they frequently experience UF impairment due to accelerated glucose reabsorption, thereby diminishing the osmotic gradient required for effective fluid removal [14]. Clinically, UF failure is defined as the inability to achieve at least 400 mL of net UF during a 4 h dwell using a 4.25% dextrose solution [15]. Inadequate UF and/or solute clearance contributes to ~18% of overall PD technique failure and subsequent transfer to hemodialysis (HD) [16].
The available literature regarding the effects of sodium–glucose cotransporter 2 (SGLT2) inhibitors in patients undergoing PD remains limited. Recently, an experimental study utilizing a wild-type murine model exposed to glucose-rich dialysate via an intraperitoneal catheter with and without dapagliflozin demonstrated structural and functional improvements in the peritoneal membrane following SGLT2 inhibition [17]. The authors reported the preservation of peritoneal membrane integrity without progression to a high-glucose transporter phenotype. In addition, oral SGLT2 inhibitors have been shown to reduce glucose absorption across the murine peritoneum, thereby enhancing UF. Expression of SGLT2 receptors has also been confirmed in the human peritoneum and in human peritoneal mesothelial cells (HPMCs), where SGLT2 inhibition was associated with decreased glucose uptake under high-glucose conditions [18]. Collectively, these findings suggest that SGLT2 inhibitors may attenuate peritoneal fibrosis, improve UF efficiency, and potentially contribute to better long-term outcomes in patients treated with PD.
To the best of our knowledge, at the time of patient enrollment, no clinical studies had evaluated the use of SGLT2 inhibitors in individuals undergoing PD. Given the clinical relevance of UF failure in PD, recent investigations have demonstrated the expression of SGLT2 in the human peritoneum [19,20]. Pre-clinical studies suggest that SGLT2 inhibition may enhance UF by preserving the intraperitoneal glucose gradient through a suppression of local SGLT2 activity; however, findings have been inconsistent across experimental models [21,22,23]. In addition, SGLT2 inhibitors have been reported to attenuate peritoneal fibrosis and angiogenesis in murine models: processes that are recognized contributors to UF failure and long-term peritoneal membrane dysfunction [24,25].
Recent PD-specific human evidence remains mixed. In a 1-month self-controlled dapagliflozin pilot study, no statistically significant change in glucose absorption or peritoneal membrane function was detected, although several patients showed directional improvement. No major hypoglycemic or urinary safety signal emerged [26]. More recently, the EMPOWERED randomized crossover trial reported that empagliflozin did not significantly increase daily UF over an 8 week period compared with placebo treatment [27]. Contemporary reviews, therefore, consider SGLT2 inhibition in PD promising but still exploratory, with a treatment response likely influenced by baseline transport status, UF phenotype, exposure duration, and specific endpoint measured [28,29].
Based on the available evidence, we hypothesized that SGLT2 inhibitors may enhance UF volume and potentially improve long-term outcomes in patients undergoing PD by mitigating volume overload and attenuating peritoneal membrane injury. Given the limited clinical data regarding the use of SGLT2 inhibitors in the PD population, we initially sought to evaluate their short-term effects over a six-month period. The primary objective of this study was to assess the impact of dapagliflozin on UF volume and peritoneal membrane transport characteristics. Specifically, we aimed to examine whether dapagliflozin influences peritoneal solute transfer rates and reduces intraperitoneal glucose absorption, thereby preserving the osmotic gradient and enhancing ultrafiltration efficiency.

2. Materials and Methods

2.1. Study Design and Study Periods

This study was designed as a prospective observational pre–post study. Dapagliflozin (10 mg once daily) was administered as part of routine clinical care and according to standard medical judgment, rather than as a protocol-driven randomized intervention. Clinical, biochemical, and dialysis-related parameters were prospectively assessed over a six-month follow-up period and compared with baseline values obtained prior to treatment initiation. Each patient served as their own control for the evaluation of changes in UF volume, peritoneal solute transport characteristics, and membrane function. Standard clinical laboratory equipment was used; manufacturer details were not available in the medical records.
Patients were screened for eligibility according to predefined inclusion and exclusion criteria. Although patients with known hypersensitivity to SGLT2 inhibitors were excluded, no such cases were identified among the screened cohort. Data were collected at three predefined time points: (1) initial assessment after initiation of PD, (2) evaluation at the time of documented UF failure, and (3) reassessment after six months of dapagliflozin therapy.

Study Periods

The study was structured across three predefined periods:
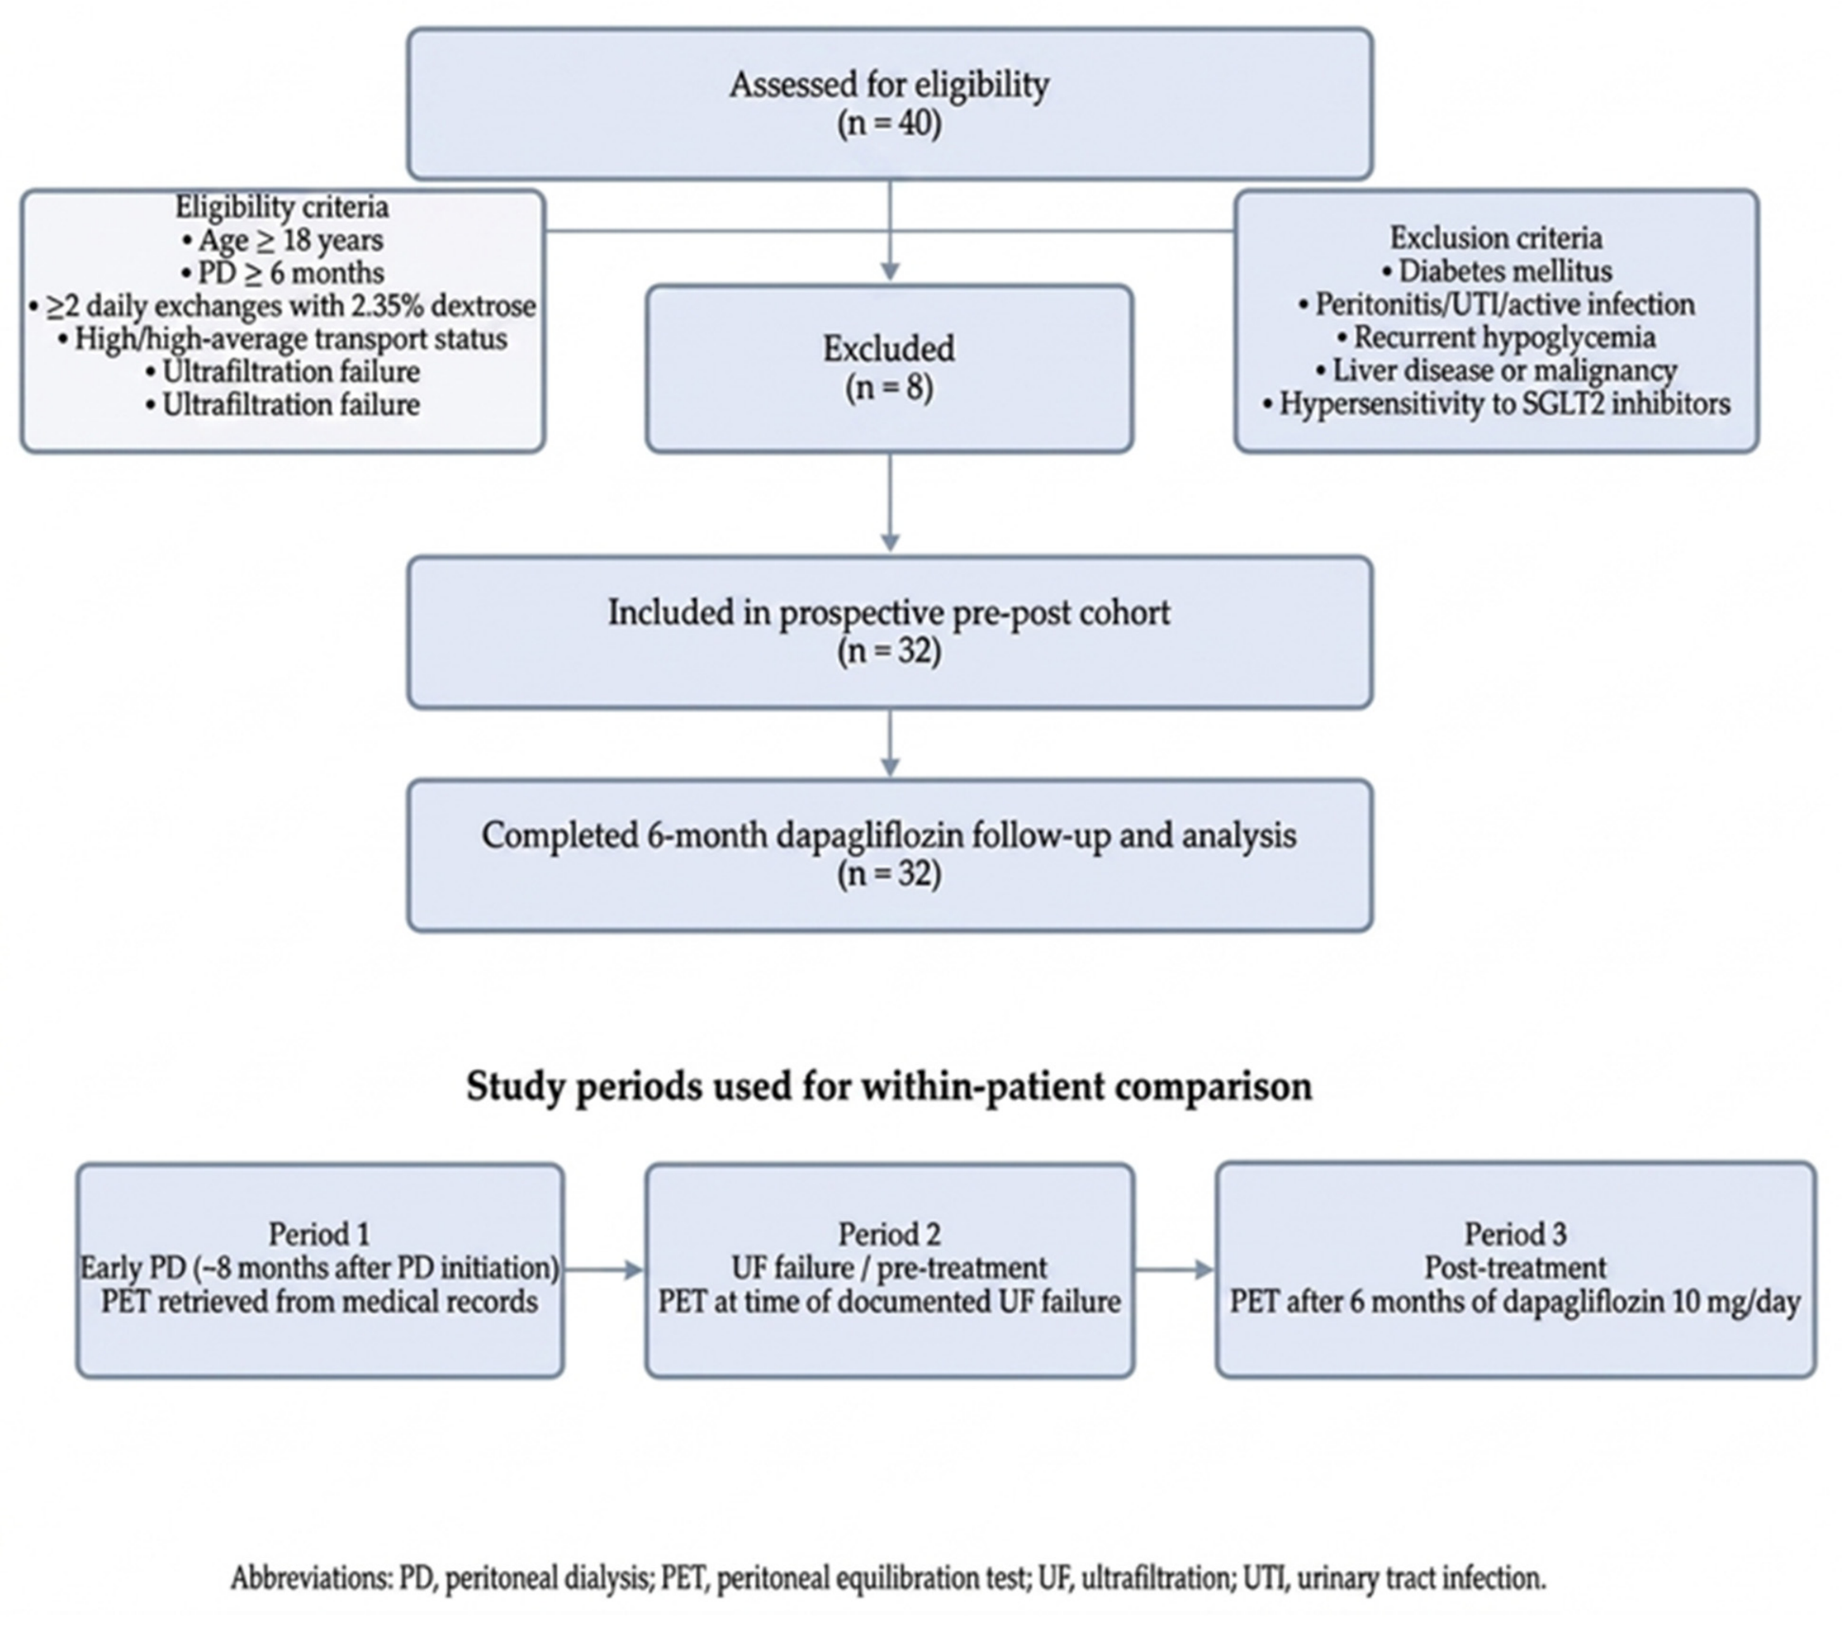
  • First period: (eight months after initiation of PD): The peritoneal equilibration test (PET) results were retrieved from the patients’ medical records in order to establish baseline peritoneal membrane function during the early phase of PD therapy.
  • Second period (pre-treatment): This period began when peritoneal dialysis failure was clinically identified. PET results obtained from the patients’ medical records indicated impaired peritoneal membrane function and UF failure. This phase occurred after a mean PD duration of 7.5 years.
  • Third period (post-treatment): After a diagnosis of peritoneal failure, patients received dapagliflozin at a dose of 10 mg once daily for six months. At the end of the treatment period, follow-up PET results were collected from the medical records to assess changes in peritoneal membrane function and UF parameters.

2.2. Research Design and Patients

This was a non-randomized, single-group pre–post observational study with no control group. The study included 32 patients undergoing CAPD using the Fresenius Medical Care stay•safe® system. All completed the six-month follow-up. Initially, 40 patients were screened for eligibility, of whom eight were excluded since they did not meet the inclusion criteria or declined participation. All tables and figures report the analyzed cohort size (n = 32) unless otherwise indicated. To improve clarity and readability, the baseline characteristics of the study population were reorganized into two separate tables. Table 1 presents the baseline demographic and clinical characteristics, including age, sex distribution, anthropometric measurements, vital signs, and oxygen saturation.
Table 2 summarizes the baseline laboratory parameters and peritoneal dialysis-related characteristics, including hematological, biochemical, inflammatory markers, and peritoneal equilibration test (PET) parameters.
Eligibility criteria included age ≥ 18 years, treatment with PD for at least six months before enrollment, and use of at least two daily exchanges with 2.35% dextrose during the preceding six months. Participants were also required to have high or high-average peritoneal transport status based on a modified 4.25% dextrose PET, defined by a dialysate glucose ratio (D4/D0) < 0.39. All enrolled patients were maintained on a CAPD regimen consisting of four manual 2 L exchanges per day. Exclusion criteria included a history of type 1 or type 2 diabetes mellitus, peritonitis, urinary tract infection, or any other active infection within six months before recruitment; recurrent hypoglycemia; liver disease; known hypersensitivity to SGLT2 inhibitors; or active malignancy.

2.3. Ethical Considerations and Study Approval

Written informed consent was obtained from all participants before study inclusion. The study was conducted within the framework of a collaborative agreement with An-Najah National University, and was developed in partnership with nurses and physicians specializing in PD. Patient recruitment was conducted between December 2023 and December 2024. All participants provided written informed consent prior to enrollment and the initiation of prospective study follow-up procedures.
All study procedures were performed in accordance with the ethical principles outlined in the institutional guidelines. The study protocol was reviewed and approved by the Institutional Review Board of An-Najah National University (Reference No.: Med. April 2023/113). Before enrollment, participants received detailed information regarding the study objectives, procedures, potential risks, and possible adverse effects of the medication. Participation was voluntary, and written informed consent was obtained from each individual. Participant confidentiality and privacy were strictly maintained, and access to study data were restricted to authorized members of the research team.

2.4. Drug Administration, Testing, and Follow-Up

Participants received dapagliflozin at a dose of 10 mg once daily for six months. The medication was dispensed through the hospital pharmacy in accordance with routine clinical practice. PET was performed using a modified protocol of 2 L of 4.25% dextrose solution [9] at baseline, prior to treatment initiation, and repeated after completion of the six-month dapagliflozin treatment period in order to assess changes in peritoneal transport characteristics and UF performance.

2.5. Measurements

Peritoneal fluid samples were analyzed using the indirect ion-selective electrode method. UF volume, body weight, and blood pressure (BP) were recorded at baseline and reassessed during the follow-up PET conducted six months after treatment initiation. No changes were made to participants’ PD prescriptions or concomitant medications throughout the study period. Routine laboratory parameters remained stable, with no clinically significant deviations observed.
Participants were monitored through weekly contact with the research team to assess potential clinical events, including hypoglycemic episodes, BP fluctuations, and weight variations. In addition, during the follow-up period, patients were instructed to promptly report any new symptoms or clinical concerns to the PD unit.

2.6. Study Outcomes

The primary outcomes were the changes observed after six months of daily dapagliflozin treatment (10 mg), including:
  • Changes in the D4/D0 ratio and the dialysate-to-plasma creatinine ratio (D/P).
  • Changes in the peritoneal solute transport rate (PSTR), as assessed by D/P creatinine values.
  • Changes in biochemical and clinical parameters, including serum sodium, albumin, glycated hemoglobin (HbA1c), C-reactive protein (CRP), and net UF volume.
  • Changes in body weight, BP, and antihypertensive medication requirements.
Secondary outcomes included changes in BP, the incidence of infectious events, episodes of hypoglycemia, and variations in serum bicarbonate levels.

2.7. Data Collection and Measurements

Prior to the initiation of dapagliflozin therapy, baseline demographic and clinical characteristics were recorded, including age, sex, primary etiology of renal failure, duration and modality of PD, body mass index (BMI), diabetes mellitus status, prior history of technique failure, and relevant laboratory parameters.
Peritoneal transport characteristics were assessed using a modified PET with 4.25% dextrose. The D/P creatinine ratio was calculated as the ratio of dialysate creatinine concentration after a 4 h dwell to the corresponding serum creatinine concentration. The D4/D0 ratio was determined as the ratio of dialysate glucose concentration at 4 h to its concentration at time zero. Peritoneal ultrafiltration (PUF) was calculated as the difference between the instilled dialysate volume and the drained volume after a 4 h dwell. The sodium dip was defined as the absolute difference between dialysate sodium concentration at baseline and one hour after dwell initiation.
Additional clinical parameters, including BP, heart rate, and body weight, were measured at baseline and at the completion of the six-month follow-up period. Laboratory assessments included serum albumin, fasting blood glucose, blood urea nitrogen (BUN), creatinine, potassium (K), glycated hemoglobin (HbA1c), bicarbonate (HCO3), CRP, and oxygen saturation (SpO2).

2.8. Data Analysis

Data entry and statistical analyses were performed using IBM SPSS Statistics version 27 (IBM Corp., Armonk, NY, USA). Descriptive statistics were used to summarize the data. Categorical variables are presented as frequencies and percentages, whereas continuous variables are reported as medians with corresponding ranges.
The D/P ratio, D4/D0 glucose ratio, peritoneal ultrafiltration (PUF), and sodium dip were analyzed across the three predefined study time points (early PD, UF failure, and post-treatment). Overall differences between time points were assessed using the Friedman test for related samples. Following a significant Friedman test result, post hoc pairwise comparisons were performed using the Wilcoxon signed-rank test with Bonferroni correction for multiple comparisons. The Wilcoxon signed-rank test was also used to evaluate within-patient changes between the pre-treatment and post-treatment phases and was considered the primary method for assessing treatment-related effects. Absolute changes (Δ) between pre-treatment and post-treatment values were calculated and reported as median differences. Where applicable, 95% confidence intervals were estimated.
In addition to the main PET-derived variables, further analyses were conducted for BP, heart rate, body weight, albumin, blood glucose, BUN, creatinine, sodium (Na), potassium (K), hemoglobin (Hb), HbA1c, HCO3, CRP, and SpO2. Data regarding antihypertensive medication use and erythropoietin therapy were also included in the analysis. A two-sided p-value ≤ 0.05 was considered statistically significant for overall analyses, whereas an adjusted p-value < 0.017 was used for post hoc pairwise comparisons following a Bonferroni correction. Effect sizes (r) and absolute changes (Δ) were reported for paired comparisons, in order to quantify the magnitude of change. Effect sizes (r) were calculated for all paired comparisons. Due to the non-parametric nature of the data, confidence intervals were not computed; instead, median differences and effect sizes were reported to enhance interpretability.

3. Results: Clinical and Peritoneal Membrane Outcomes After Dapagliflozin Treatment

3.1. Overview of Patient Characteristics and Treatment Outcomes

3.1.1. Baseline Characteristics

The patient selection process and revised study flow diagram and study periods are summarized in Figure 1. To enhance clarity and consistency with the study design, the primary emphasis was placed on paired comparisons between pre-treatment and post-treatment measurements, reflecting within-patient changes over time. Comparisons across all three predefined time points (early PD, UF failure, and post-treatment) are presented for descriptive context.
To provide the full clinical course prior to advanced statistical interpretation, a longitudinal summary table (Table 3) has been added which displays clinically relevant variables across the early PD, UF, and post-treatment phases.
Table 3. Longitudinal clinical and dialysis-related parameters across the three study phases (n = 32).
VariableEarly Peritoneal DialysisUltrafiltration Failure/Pre-TreatmentPost-TreatmentPre- vs. Post-Treatment p-Value
SBP (mmHg)133.6161.3129.1<0.001
DBP (mmHg)81.6100.173.1<0.001
BMI (kg/m2)27.4430.424.6<0.001
Hemoglobin (g/dL)11.109.011.9<0.001
Albumin (g/dL)3.732.803.80<0.001
Creatinine (mg/dL)7.559.456.60<0.001
CRP (mg/dL)0.762.50.8<0.001
UF (mL)440.090.0480.0<0.001
D/D glucose (4 h)0.310.170.36<0.001
D/P creatinine (4 h)0.640.890.69<0.001
Free Na (1 h)143.2137.9143.6<0.001
Abbreviations: SBP, systolic blood pressure; DBP, diastolic blood pressure; BMI, body mass index; CRP, C-reactive protein; UF, ultrafiltration volume; D/D glucose (4 h), dialysate glucose concentration at 4 h divided by the initial dialysate glucose concentration (D4/D0); D/P creatinine (4 h), dialysate-to-plasma creatinine ratio at 4 h; Free Na (1 h), free water transport assessed by sodium dip at 1 h. Data are presented as medians. The final column summarizes the paired pre-treatment versus post-treatment comparison; full statistical outputs are presented in Table 4, Table 5 and Table 6.
Table 4. Changes in blood pressure and body mass index following six months of dapagliflozin treatment (n = 32).
VariablePre-Treatment MedianPost-Treatment MedianΔ (Post–Pre)p-ValueEffect Size (r)
SBP (mmHg)161.3129.1−32.2<0.0010.873
DBP (mmHg)100.173.1−27.0<0.0010.873
BMI (kg/m2)30.424.6−5.8<0.0010.870
Data are presented as medians. Comparisons were performed using the Wilcoxon signed-rank test. Abbreviations: SBP: systolic blood pressure; DBP: diastolic blood pressure; BMI: body mass index.
Table 5. Laboratory parameter changes in peritoneal dialysis patients after 6 months of dapagliflozin treatment (n = 32).
VariablePre-Treatment MedianPost-Treatment MedianΔ (Post–Pre)p-ValueEffect Size (r)
O2 saturation (%)93.096.5+3.5<0.0010.870
Hemoglobin (g/dL)9.011.9+2.9<0.0010.870
Sodium (mmol/L)131.0138.0+7.0<0.0010.880
HCO3 (mmol/L)16.921.9+5.0<0.0010.870
Potassium
(mmol/L)
5.43.6−1.8<0.0010.880
HbA1c6.405.22−1.18<0.0010.870
Ferritin (µg/L)209.0275.5+66.5<0.0010.870
Creatinine (mg/dL)9.456.60−2.85<0.0010.870
BUN (mg/dL)69.044.0−25.0<0.0010.870
FBS (mg/dL)121.086.0−35.0<0.0010.880
Albumin (g/dL)2.803.80+1.00<0.0010.870
Data are presented as medians. Comparisons were performed using the Wilcoxon signed-rank test. Abbreviations: BUN, blood urea nitrogen; FBS, fasting blood sugar; HbA1c, glycated hemoglobin.
Table 6. Changes in PET-derived and clinical markers across study periods (n = 32).
VariablePre-Treatment MedianPost-Treatment MedianΔ (Post–Pre)p-ValueEffect Size (r)
D/D0 glucose (0 h)0.940.97+0.03<0.0010.730
D/D glucose (2 h)0.320.57+0.25<0.0010.870
D/D glucose (4 h)0.170.36+0.19<0.0010.870
D/P creatinine (0 h)0.190.11−0.08<0.0010.770
D/P creatinine (2 h)0.680.56−0.12<0.0010.870
D/P creatinine (4 h)0.890.69−0.20<0.0010.870
Free Na (0 h)135.7136.1+0.4<0.0010.850
Free Na (1 h)137.9143.6+5.7<0.0010.870
CRP (mg/dL)2.50.8−1.7<0.0010.880
UF (mL)90.0480.0+390.0<0.0010.870
Abbreviations: D/P, dialysate-to-plasma ratio; CRP, C-reactive protein; UF, ultrafiltration.
The mean age of participants was 27.63 years, with a predominance of males (59.4%). The mean duration since initiation of dialysis was approximately 6.5 years, with most patients having been on PD for 5–7 years. The mean BMI was 28.24 ± 3.9 kg/m2, indicating that a substantial proportion of participants were within the overweight range.

3.1.2. Changes in Blood Pressure and BMI

The Friedman test determined whether the SBP and DBP readings of PD patients differed following 6 months of dialysis, during a worsening filter, and subsequently, after 6 months of dapagliflozin administration. A statistically significant difference was found in the patients’ SBP, DBP, and BMI readings, depending on the PD period (use of dapagliflozin (χ2 [2] = 49.65, 58.56, 64.0&, p < 0.001, respectively). A post hoc analysis revealed a significantly higher median reading of the SBP and DBP (161.3 and 100.1 mmHg, respectively) among PD patients at the time of PD (p < 0.001) compared to baseline (131.6 and 81.6 mmHg, respectively) and a significant lower reading of SBP and DBP (129.1 and 73.1 mmHg, respectively) after a 6 month administration of dapagliflozin (p < 0.001) compared to a worsening time. On the other hand, the administration of dapagliflozin significantly lowered the BMI of PD patients (p < 0.001) compared to the BMI at a worsening time (24.6 vs. 30.4, respectively) (Table 4).
Clinical outcomes were analyzed using the Wilcoxon Signed-Rank Test to compare baseline and 6-month post-treatment values. Results showed statistically significant improvements in all measured parameters (p < 0.001). SBP significantly decreased from a median of 161.3 mmHg at baseline to 129.1 mmHg after treatment, with a median reduction of −32.2 mmHg (Z = −4.938, p < 0.001, r = 0.873). DBP decreased from 100.1 mmHg to 73.1 mmHg, with a median change of −27.0 mmHg (Z = −4.938, p < 0.001, r = 0.873). BMI also showed a marked reduction from 30.4 kg/m2 to 24.6 kg/m2, with a median decrease of −5.8 kg/m2 (Z = −4.937, p < 0.001, r = 0.87). Overall, all parameters demonstrated large effect sizes (r ≈ 0.87), indicating a strong and consistent treatment effect across participants.

3.1.3. Changes in Laboratory Parameters

Laboratory parameters were assessed across the three time points using the Friedman test, which demonstrated statistically significant differences over time (p < 0.001). Paired analyses using the Wilcoxon signed-rank test showed further statistically significant differences between the pre-treatment and post-treatment values after six months (Z range: −4.93 to −4.97, p < 0.001), with consistently large effect sizes (r = 0.87–0.89) (Table 5).
Median differences indicated clinically relevant changes across multiple parameters, including increases in hemoglobin (+2.9 g/dL), sodium (+7 mmol/L), bicarbonate (+5 mmol/L), and albumin, alongside reductions in creatinine (−2.85 mg/dL), blood urea nitrogen (−25 mg/dL), fasting blood glucose (−35 mg/dL), potassium, and HbA1c. These findings reflect consistency within patient changes over the study period. However, given the observational pre–post design, they should be interpreted as associations rather than evidence of a causal relationship.

3.1.4. Clinical Marker Changes

Changes in PET-derived parameters and clinical markers are presented in Table 6. Friedman test analysis demonstrated statistically significant differences across the three study periods (p < 0.001). For interpretability, paired comparisons between pre-treatment and post-treatment values were emphasized.
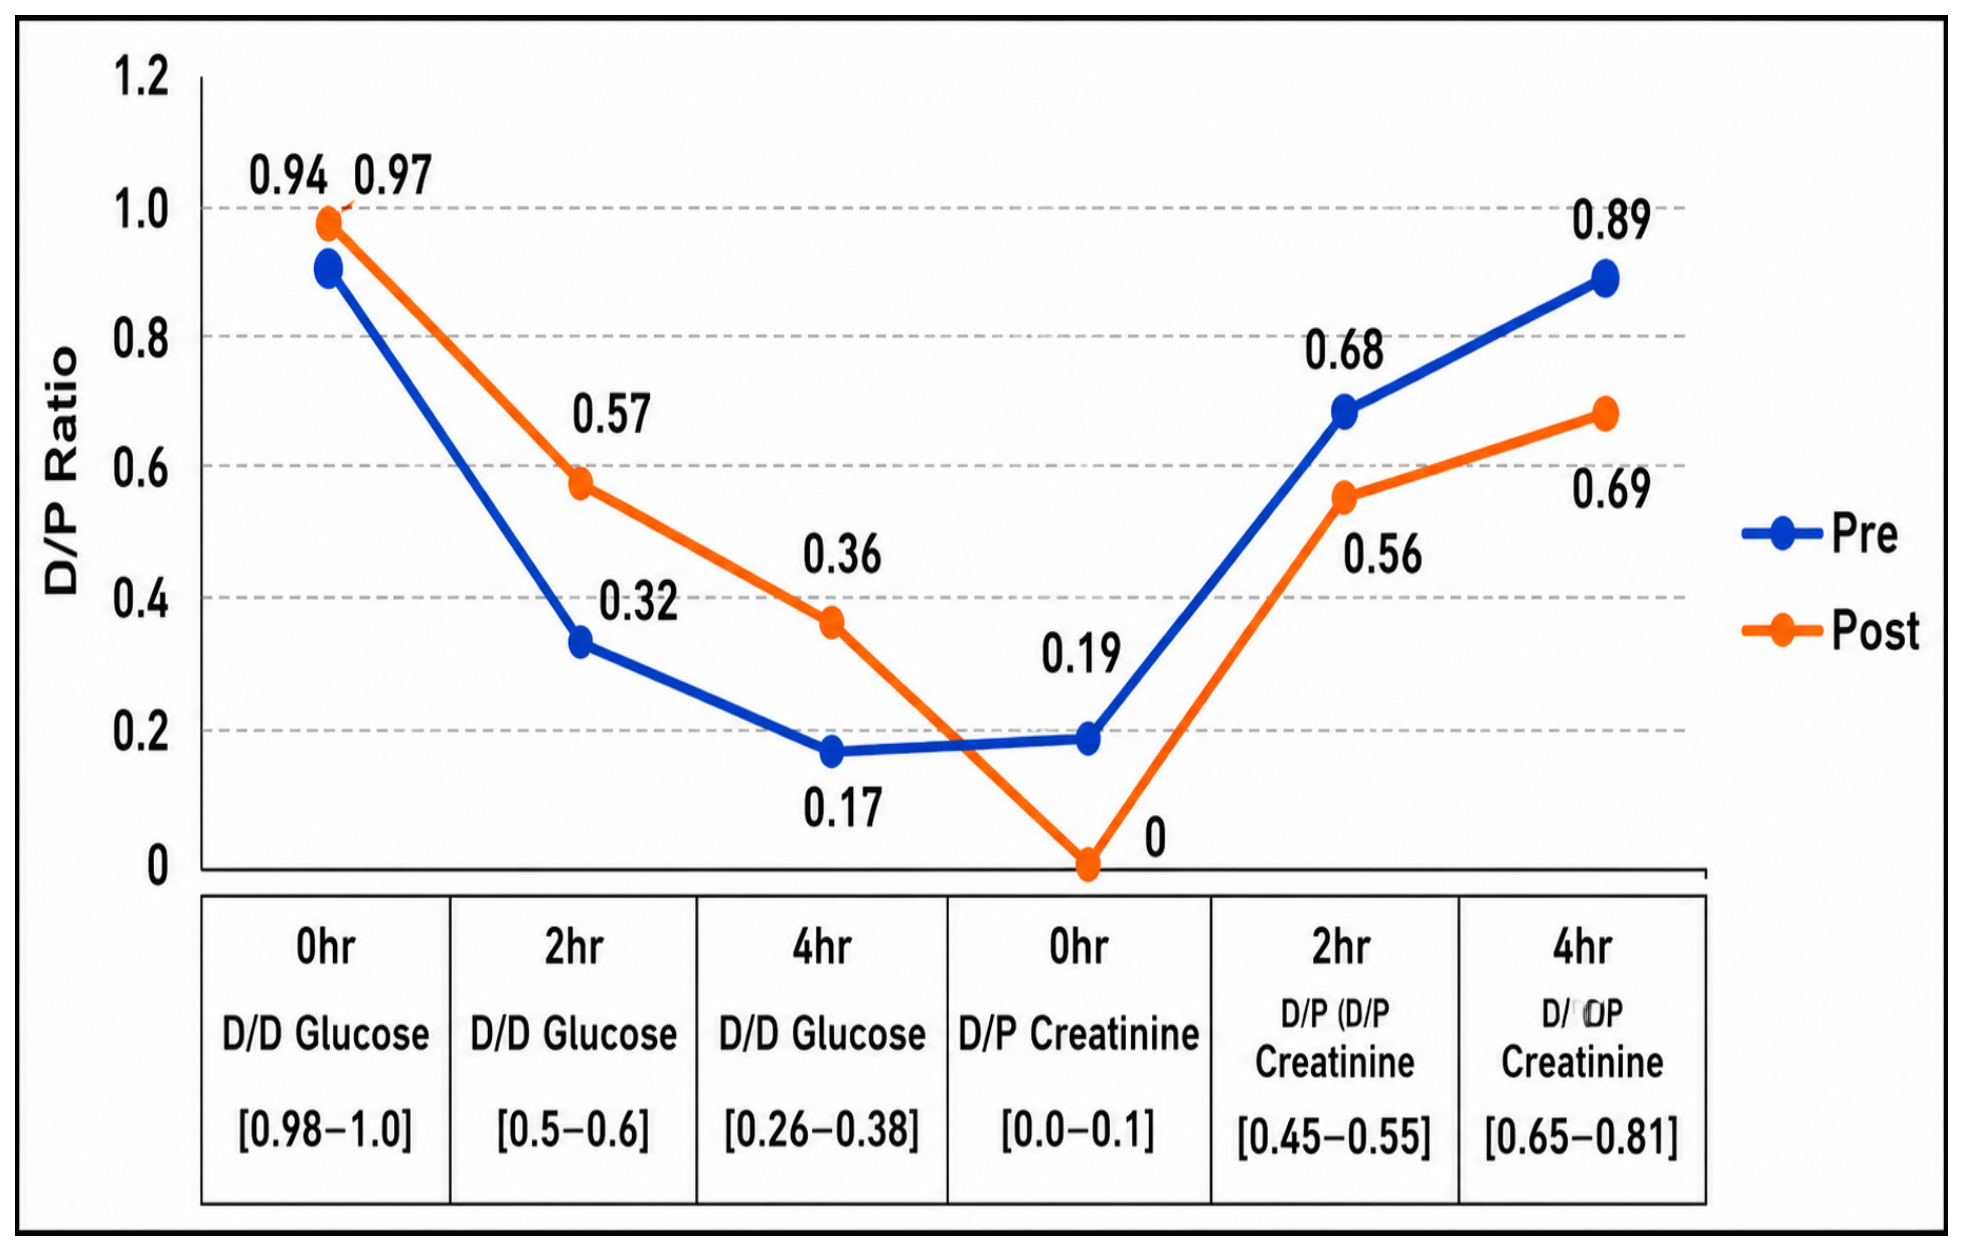
UF volume increased from a median of 90.0 mL during the pre-treatment phase to 480.0 mL after six months (Δ = +390 mL; Z = −4.941, p < 0.001, r = 0.87). In parallel, dialysate glucose ratios (D/D0) increased, while D/P decreased across measured time points. These changes are consistent with a shift in peritoneal transport characteristics over time, with patterns suggestive of a reduced solute transport rate and improved maintenance of the osmotic gradient. In addition, CRP levels decreased (Δ = −1.7 mg/dL), and sodium-related parameters demonstrated measurable changes.
Although these findings are statistically significant and clinically notable, they should be interpreted as associations observed over time rather than definitive evidence of treatment effect. Figure 2 illustrates the trajectory of key parameters across the three time points, showing deterioration at the time of UF failure followed by improvement during the post-treatment period. This graphical pattern is consistent with the tabulated results.

3.1.5. Interpretation of PET Parameters

D/D0 Glucose Ratio
The D/D0 glucose ratio represents the relationship between dialysate glucose concentration at a given time point and its initial concentration. It is commonly used to reflect glucose absorption dynamics across the peritoneal membrane. We observed an increase in D/D0 ratios following the follow-up period, which may reflect changes in intraperitoneal glucose handling.
D/D4 Glucose Ratio
The D/D4 ratio reflects glucose concentration changes over the dwell period and provides insight into the persistence of the osmotic gradient. Observed variations in D/D4 ratios suggest temporal changes in membrane transport behavior; however, inter-individual variability was noted.
D/P Creatinine Ratio
The D/P creatinine ratio is a standard measure of the peritoneal solute transport rate. Higher values are typically associated with faster solute transport.
We observed a reduction in D/P creatinine ratios during the follow-up period, which may indicate a shift in transport characteristics. However, variability between patients was present.
Sodium Dip
The sodium dip, defined as the difference between dialysate sodium concentration at baseline and after one hour, was also evaluated. An increase in sodium dip was observed during the follow-up period, suggesting changes in sodium transport dynamics. The clinical implications of this observation remain uncertain and require further investigation.
Peritoneal Transport Classification
Across the three assessment periods, patients were predominantly classified as high–average transporters based on both glucose and creatinine curves. No major shifts in the transport category were observed at the group level, although intra-individual variability was noted.
Additional Observations
Sodium dip values showed variation across time points, with lower values observed during the UF failure phase and higher values during the follow-up period. These patterns may reflect temporal changes in peritoneal membrane characteristics; however, interpretation remains limited within the current study design.

3.1.6. Safety Observations

All 32 analyzed participants completed the 6-month follow-up. No serious adverse events attributable to dapagliflozin were reported during the observation period, and no participant discontinued treatment due to intolerance. These findings should nevertheless be cautiously interpreted because the study was not powered to detect uncommon safety events.

4. Discussion

Robust clinical evidence supports the use of SGLT2 inhibitors in patients with heart failure and chronic kidney disease (CKD) [30,31]. However, evidence regarding their use in advanced CKD, particularly among patients receiving dialysis, remains limited. Although SGLT2 expression is predominantly localized to the proximal renal tubules, it had been assumed that the benefits of SGLT2 inhibition might diminish along with a progressive loss of kidney function. More recent data, however, suggest that the cardio-renal benefits of SGLT2 inhibitors may persist even at lower levels of kidney function, provided that the estimated glomerular filtration rate (eGFR) is ≥20 mL/min/1.73 m2 [32,33].
In the present study, dapagliflozin use was associated with improvements in UF, peritoneal transport characteristics, and several clinical and laboratory parameters over six months. Because this study was a non-randomized, single-group pre–post observational design without a control group, these findings should be cautiously interpreted. The observed changes cannot be attributed solely to dapagliflozin. The results are best considered as hypothesis-generating rather than evidence of causality.
A key interpretive issue is the potential contribution of SGLT2 inhibitor-related osmotic diuresis to the observed changes in fluid status. SGLT2 inhibitors are known to increase urinary glucose excretion and promote diuresis, which may influence extracellular fluid volume. In the present study, urinary volume was not systematically assessed. This limitation is important, although most participants had long-standing PD and minimal or absent residual renal function, which may reduce the likelihood that urinary losses fully explain the observed changes. Nevertheless, the potential contribution of altered systemic fluid balance cannot be excluded. The rationale for this study arose from recent evidence demonstrating the expression of SGLT2 in the human peritoneum [18].
If SGLT2 participates in glucose uptake from PD solutions, then pharmacological inhibition of this transporter may be associated with preservation of the intraperitoneal glucose gradient and improved UF efficiency. PD is a well-established renal replacement modality for patients with ESRD, using the peritoneal membrane as a semipermeable barrier for fluid and solute exchange. Glucose-based PD solutions generate the osmotic gradient required for UF; however, chronic exposure to high-glucose dialysate has been found to be associated with progressive structural and functional alterations of the peritoneal membrane [34]. These changes may impair dialysis performance over time and contribute to technique failure. Despite advances in understanding the mechanisms of peritoneal injury, effective interventions to preserve membrane function remain limited [35].
Dapagliflozin is a selective SGLT2 inhibitor that blocks SGLT2-mediated glucose transport. Its use in advanced CKD and ESRD has recently been explored in PD patients with type 2 diabetes. A recent case report comprising PD patients described improved UF after dapagliflozin therapy [36], thus supporting the rationale for further study of this population. Additional reports have confirmed SGLT2 expression in the human peritoneum, including increased receptor expression in patients with encapsulating peritoneal sclerosis [20]. Clinical observations have also suggested possible benefits of SGLT2 inhibition in PD, such as improved glycemic control, enhanced UF, and reductions in inflammatory markers [26,37,38]. Simultaneously, preclinical findings have been reported as heterogeneous. Some experimental works have suggested the inhibition of peritoneal glucose transport by dapagliflozin, whereas other studies did not identify significant changes in peritoneal glucose, sodium, or water transport [18,26,38,39,40]. These inconsistencies highlight the need for further clinical evaluation.
Our findings should also be interpreted in light of more recent PD-specific studies reporting different results. Hamdan et al. found no statistically significant change in glucose absorption or PET-derived membrane function after one month of dapagliflozin in CAPD patients [26]. The randomized EMPOWERED crossover trial reported no significant increase in daily UF with empagliflozin over an 8-week period [27].
Several factors may explain these discrepancies. Firstly, our cohort was specifically enriched for patients with established UF and high/high–average transport status, whereas other studies comprised a more heterogeneous PD population. Secondly, our treatment exposure was longer (six months), which may be relevant if membrane remodeling and inflammatory changes require time to evolve. Thirdly, differences in endpoints (daily UF versus PET-derived UF and transport indices), background PD prescriptions, and residual kidney function could materially influence the observed effect size. Accordingly, the divergence between studies is unlikely to be explained by dapagliflozin versus empagliflozin alone and more likely reflects differences in population, follow-up duration, and outcome definition [28,29].
UF failure remains a major limitation of long-term PD and is associated with technique failure and increased morbidity. In this study, comparisons involving early PD and UF failure should be carefully interpreted, as these differences may reflect the natural evolution of peritoneal membrane function over time rather than the effect of treatment. Time-related confounding therefore cannot be excluded. For this reason, paired pre-treatment and post-treatment comparisons provide the most clinically relevant interpretation of the findings.
From a clinical perspective, the observed association between dapagliflozin use and improved UF volume is notable. The increase in UF was accompanied by changes in D/P creatinine, dialysate glucose ratios, and sodium dynamics, which may indicate a shift in peritoneal transport behavior. The reduction in D/P creatinine is consistent with a pattern suggestive of lower transport rates, whereas the preservation of the intraperitoneal glucose gradient may reflect improved osmotic efficiency. The observed increase in sodium dip may also suggest altered free water transport across the peritoneal membrane. Although these findings are mechanistically plausible, they remain inferential since no direct assessment of peritoneal SGLT2 activity was performed.
From a clinical perspective, the observed increase in UF volume may be particularly relevant when interpreted in the context of established UF failure criteria. UF failure is commonly defined as the inability to achieve at least 400 mL of net UF during a 4 h dwell using 4.25% dextrose solution. In the present cohort, the median UF volume increased from 90 mL during the pre-treatment phase to 480 mL following dapagliflozin therapy, thereby exceeding the conventional threshold used to define UF failure. Although causality cannot be established within the current observational design, this magnitude of change may be clinically meaningful, thus suggesting a possible association with improved fluid management and preservation of osmotic efficiency.
Clinically, improved UF efficiency may contribute to better extracellular volume control, reduced fluid overload, improved BP regulation, and a potentially lower risk of PD technique failure. Because inadequate UF is a recognized contributor to hospitalization, cardiovascular burden, and transition to hemodialysis, interventions associated with the preservation of peritoneal membrane function may have important implications for long-term dialysis sustainability. Nevertheless, these findings should be cautiously interpreted and require validation in larger randomized controlled studies.
Two contextual variables deserve explicit consideration. Firstly, diabetes mellitus was an exclusion criterion in the present study, which reduced glycemic confounding but limited generalizability because diabetes is common in PD. It is associated with worse outcomes, including higher mortality, a greater risk of transfer to hemodialysis, and lower access to transplantation [41,42]. Secondly, heart failure status was not systematically adjudicated as a pre-specified covariate. This is relevant since heart failure is common in dialysis populations, substantially contributes to mortality, and may influence congestion, BP, and UF targets [43].
The biochemical findings were also clinically relevant. Over the 6 month period, the study cohort showed favorable changes in hemoglobin, sodium, bicarbonate, creatinine, BUN, fasting blood glucose, potassium, and HbA1c. These changes may reflect improved overall metabolic and volume status during follow-up. However, because the study design did not include a control group, these observations should be interpreted as within-patient changes over time, rather than definitive treatment effects. The consistently large effect sizes support the magnitude of these changes, but they do not establish causality.
The safety profile observed in this cohort was reassuring. No major adverse events attributable to dapagliflozin were recorded during follow-up. This is clinically important due to the fact that the use of SGLT2 inhibitors in non-diabetic PD patients remains less well defined. Potential adverse effects such as volume depletion, hypotension, and euglycemic ketoacidosis are known concerns, particularly in diabetic populations. Although these events were not observed in the present study, careful selection and monitoring remain essential when considering dapagliflozin in PD patients.
This cautious interpretation is reinforced by the emerging literature. In a 1-month dapagliflozin pilot study, no hypoglycemia, dysuria, or change in urinary frequency was reported, although one episode of peritonitis and two episodes of overhydration occurred during follow-up [26]. In contrast, the EMPOWERED randomized trial observed numerically more adverse events with empagliflozin than with a placebo (47% versus 29%). There were also more serious adverse events (11% versus 6%), in spite of no demonstrable short-term UF benefit [27]. Recent reviews have therefore emphasized that genital infections, volume depletion, residual kidney function changes, and rare metabolic complications require dedicated surveillance in larger PD cohorts before routine use can be recommended [28,29].
Overall, the present study provides preliminary clinical observations suggesting that dapagliflozin use may be associated with improved UF efficiency, preservation of the intraperitoneal glucose gradient, and favorable changes in peritoneal membrane transport markers. The findings also suggest possible benefits in cardiometabolic parameters, including blood pressure, BMI, and glycemic control. These observations are clinically relevant since UF failure is a major driver of technique failure in PD. Interventions that preserve membrane function may have important implications for long-term dialysis sustainability.

4.1. Key Findings

The main findings of this study can be summarized as follows: firstly, dapagliflozin use was found to be associated with improved UF efficiency, together with changes in PET-derived parameters, thereby suggesting better maintenance of the osmotic gradient. Secondly, inflammatory activity, as reflected by CRP, showed a favorable trend. Thirdly, BP, BMI, and glycemic parameters also changed during the follow-up period, indicating possible systemic cardiometabolic relevance. These findings should be interpreted as associative and hypothesis-generating.

4.2. Scientific and Clinical Contribution

This study contributes to the emerging evidence on SGLT2 inhibition in peritoneal dialysis by evaluating dapagliflozin in non-diabetic PD patients with ultrafiltration failure. The observed improvements in ultrafiltration and PET-derived parameters provide hypothesis-generating clinical observations that may inform future mechanistic research and adequately powered randomized controlled trials.

4.3. Clinical Implications

The present findings suggest that SGLT2 inhibition may merit further investigation as a potential adjunctive strategy in PD patients with high or rapid peritoneal transport rates. The observed changes in UF and PET-derived parameters raise the possibility that dapagliflozin could help support membrane function over time. However, these mechanistic interpretations remain speculative, as direct measurement of peritoneal SGLT2 expression or activity was not performed. The potential role of dapagliflozin in long-term membrane preservation and cardiometabolic management also warrants further study.

4.4. Limitations

This study has several limitations. Firstly, the six-month follow-up period was relatively short and did not allow an assessment of long-term durability, safety, or membrane preservation. Secondly, the single-center design limited generalizability. Thirdly, the absence of a control group prevented causal inference. Fourthly, factors such as diet, adherence, and lifestyle were not systematically assessed and may have influenced the observed outcomes. Finally, the study did not include direct mechanistic assessment of peritoneal SGLT2 expression or activity.

4.5. Future Directions

Future studies should include adequately powered, multicenter randomized controlled trials with longer follow-up to confirm these preliminary observations. Comparative studies against other UF-enhancing strategies would help clarify the relative benefit of dapagliflozin. In addition, mechanistic investigations are needed to determine how SGLT2 inhibition may influence peritoneal glucose transport, membrane integrity, fibrosis, and sodium handling. Such work would help define the most appropriate clinical role for SGLT2 inhibitors in PD.

5. Conclusions

In this prospective observational pre–post study, dapagliflozin use was found to be associated with improvements in UF, peritoneal transport parameters, and several clinical and laboratory measures in patients undergoing PD. These findings suggest a potential role for dapagliflozin in supporting peritoneal membrane function and overall metabolic control. However, because the study was non-randomized and lacked a control group, the results should be cautiously interpreted and regarded as hypothesis-generating.
Further randomized controlled trials are needed to determine whether these associations reflect a true treatment effect, in addition to establishing the safety and efficacy of dapagliflozin in the PD population. The present findings provide preliminary clinical support for continued investigation of SGLT2 inhibition as a potential strategy to preserve peritoneal membrane function and improve dialysis-related outcomes.

Author Contributions

Conceptualization, M.T., J.Q. and O.S.; methodology: M.T., J.Q., and O.S.; formal analysis and investigation: J.Q., M.T., O.S. and S.H.; writing—original draft preparation: M.T., J.Q., O.S. and S.H. writing—review and editing: O.S. and S.H.; project administration: M.T. and J.Q.; supervision: M.T., J.Q. and O.S. All authors have read and agreed to the published version of the manuscript.

Funding

This research received no external funding.

Institutional Review Board Statement

All procedures conducted in this study adhered to the principles of the Declaration of Helsinki and complied with applicable national guidelines and regulations. The study protocol received approval from the Institutional Review Board of An-Najah National University (Reference #: Med. April 2023/113, 12 April 2021).

Informed Consent Statement

Participation was voluntary, and written informed consent was obtained from each individual.

Data Availability Statement

The datasets generated and/or analyzed during the current study are not publicly available due to patient privacy and ethical restrictions but are available from the corresponding author upon reasonable request.

Acknowledgments

During the preparation of this manuscript, ChatGPT version 5.5 (OpenAI) was used solely to improve language quality, grammar, and readability. All generated suggestions were critically reviewed, edited, and verified by the authors. The authors take full responsibility for the content of the manuscript.

Conflicts of Interest

The authors declare no conflicts of interest.

Abbreviations

The following abbreviations are used in this manuscript:
PDperitoneal dialysis
ESRDend-stage renal disease
UFultrafiltration
SGLT-2sodium–glucose transport protein 2
MCmesothelial cells
EMTepithelial-to-mesenchymal transition
PDFperitoneal dialysis fluids
SGLT-1sodium-dependent glucose transporters
HPMCshuman peritoneal mesothelial cells
CAPDcontinuous ambulatory peritoneal dialysis
HDhemodialysis
PETperitoneal equilibration test
BPblood pressure
PSTRperitoneal solute transport rates
BMIbody mass index
DMdiabetes mellitus
PIFperitoneal ultrafiltration
BUNblood urea nitrogen
Kpotassium
HbA1cA1C
HCO3hemoglobin bicarbonate
CRPC-reactive protein
SATB blood oxygen saturation
Nasodium
Hbhemoglobin
SBPsystolic blood pressure
DBPdiastolic blood pressure
CKDchronic kidney disease

References

  1. Larkin, J.; Barretti, P.; de Moraes, T.P. Editorial: Peritoneal dialysis: Recent advances and state of the art. Front. Physiol. 2023, 14, 1185810. [Google Scholar] [CrossRef] [PubMed]
  2. Krediet, R.T. Physiology of peritoneal dialysis; pathophysiology in long-term patients. Front. Physiol. 2024, 15, 1322493. [Google Scholar] [CrossRef] [PubMed]
  3. Ito, Y.; Sun, T.; Tawada, M.; Kinashi, H.; Yamaguchi, M.; Katsuno, T.; Kim, H.; Mizuno, M.; Ishimoto, T. Pathophysiological Mechanisms of Peritoneal Fibrosis and Peritoneal Membrane Dysfunction in Peritoneal Dialysis. Int. J. Mol. Sci. 2024, 25, 8607. [Google Scholar] [CrossRef] [PubMed]
  4. Cho, Y.; Bello, A.K.; Levin, A.; Lunney, M.; Osman, M.A.; Ye, F.; Ashutantang, G.E.; Bellorin-Font, E.; Gharbi, M.B.; Davison, S.N.; et al. Peritoneal dialysis use and practice patterns: An international survey study. Am. J. Kidney Dis. 2021, 77, 315–325. [Google Scholar] [CrossRef] [PubMed]
  5. Rhee, H.; Baek, M.J.; Chung, H.C.; Park, J.M.; Jung, W.J.; Park, S.M.; Lee, J.W.; Shin, M.J.; Kim, I.Y.; Song, S.H.; et al. Extracellular volume expansion and the preservation of residual renal function in Korean peritoneal dialysis patients: A long-term follow-up study. Clin. Exp. Nephrol. 2016, 20, 778–786. [Google Scholar] [CrossRef] [PubMed]
  6. Ateş, K.; Nergizoğlu, G.; Keven, K.; Sen, A.; Kutlay, S.; Ertürk, S.; Duman, N.; Karatan, O.; Ertug, A.E. Effect of fluid and sodium removal on mortality in peritoneal dialysis patients. Kidney Int. 2001, 60, 767–776. [Google Scholar] [CrossRef] [PubMed]
  7. Lin, X.; Lin, A.; Ni, Z.; Yao, Q.; Zhang, W.; Yan, Y.; Fang, W.; Aiping, G.; Axelsson, J.; Qian, J.; et al. Daily peritoneal ultrafiltration predicts patient and technique survival in anuric peritoneal dialysis patients. Nephrol. Dial. Transplant. 2010, 25, 2322–2327. [Google Scholar] [CrossRef] [PubMed]
  8. Teitelbaum, I. Peritoneal dialysis. N. Engl. J. Med. 2021, 385, 1786–1795. [Google Scholar] [CrossRef] [PubMed]
  9. Rosenberg, M.E. Peritoneal dialysis: Diabetes of the peritoneal cavity. J. Lab. Clin. Med. 1999, 134, 103–104. [Google Scholar] [CrossRef] [PubMed]
  10. Wang, L.; Balzer, M.S.; Rong, S.; Menne, J.; von Vietinghoff, S.; Dong, L.; Gueler, F.; Jang, M.-S.; Xu, G.; Timroott, K.; et al. Protein kinase C alpha inhibition prevents peritoneal damage in a mouse model of chronic peritoneal exposure to high-glucose dialysate. Kidney Int. 2016, 89, 1253–1267. [Google Scholar] [CrossRef] [PubMed]
  11. Kang, Y.; Liu, Y.; Fu, P.; Ma, L. Peritoneal fibrosis: From pathophysiological mechanism to medicine. Front. Physiol. 2024, 15, 1438952. [Google Scholar] [CrossRef] [PubMed]
  12. Schroppel, B.; Fischereder, M.; Wiese, P.; Segerer, S.; Huber, S.; Kretzler, M.; Heiss, P.; Sitter, T.; Schlondorff, D. Expression of glucose transporters in human peritoneal mesothelial cells. Kidney Int. 1998, 53, 1278–1287. [Google Scholar] [CrossRef] [PubMed]
  13. Krediet, R.T. Aging of the peritoneal dialysis membrane. Front. Physiol. 2022, 13, 885802, Erratum in Front. Physiol. 2022, 13, 950933. [Google Scholar] [CrossRef] [PubMed]
  14. Wang, Q.; Zhao, Z.A.; Yao, K.Y.; Cheng, Y.L.; Wong, D.S.H.; Wong, D.W.C.; Cheung, J.C.W. The Versatiity of Biological Field-Effect Transistor-Based Biosensors (BioFETs) in Point-of-Care Diagnostics: Applications and Future Directions for Peritoneal Dialysis Monitoring. Biosensors 2025, 15, 193. [Google Scholar] [CrossRef] [PubMed]
  15. Teitelbaum, I. Ultrafiltration failure in peritoneal dialysis: A pathophysiologic approach. Blood Purif. 2015, 39, 70–73. [Google Scholar] [CrossRef] [PubMed]
  16. Bello, A.K.; Okpechi, I.G.; Osman, M.A.; Cho, Y.; Cullis, B.; Htay, H.; Jha, V.; Makusidi, M.A.; McCulloch, M.; Shah, N.; et al. Epidemiology of Peritoneal Dialysis Outcomes. Nat. Rev. Nephrol. 2022, 18, 779–793. [Google Scholar] [CrossRef] [PubMed]
  17. Balzer, M.S.; Rong, S.; Nordlohne, J.; Zemtsovski, J.D.; Schmidt, S.; Stapel, B.; Bartosova, M.; von Vietinghoff, S.; Haller, H.; Schmitt, C.P.; et al. SGLT2 inhibition by intraperitoneal dapagliflozin mitigates peritoneal fibrosis and ultrafiltration failure in a mouse model. Biomolecules 2020, 10, 1573. [Google Scholar] [CrossRef] [PubMed]
  18. Zhou, Y.; Fan, J.; Zheng, C.; Yin, P.; Wu, H.; Li, X.; Luo, N.; Yu, X.; Chen, C. SGLT-2 inhibitors reduce glucose absorption from peritoneal dialysis solution by suppressing the activity of SGLT-2. Biomed. Pharmacother. 2019, 109, 1327–1338. [Google Scholar] [CrossRef] [PubMed]
  19. Minutolo, R.; Ruotolo, C.; Conte, G.; Grandaliano, G.; De Nicola, L. SGLT2 inhibitors in hemodialysis or peritoneal dialysis patients: Rationale and state-of-the art. Clin. Kidney J. 2026, 19, sfaf350. [Google Scholar] [CrossRef] [PubMed]
  20. Schricker, S.; Oberacker, T.; Fritz, P.; Ketteler, M.; Alscher, M.D.; Schanz, M. Peritoneal expression of SGLT-2, GLUT1, and GLUT3 in peritoneal dialysis patients. Kidney Blood Press. Res. 2022, 47, 125–134. [Google Scholar] [CrossRef] [PubMed]
  21. Li, C.; Zhang, J.; Xue, M.; Li, X.; Han, F.; Liu, X.; Lu, Y.; Xu, L.; Cheng, Y.; Li, T.; et al. SGLT2 inhibition with empagliflozin attenuates myocardial oxidative stress and fibrosis in diabetic mice heart. Cardiovasc. Diabetol. 2019, 18, 15. [Google Scholar] [CrossRef] [PubMed]
  22. Martus, G.; Bergling, K.; de Arteaga, J.; Öberg, C.M. SGLT2 inhibition does not reduce glucose absorption during experimental peritoneal dialysis. Perit. Dial. Int. 2021, 41, 373–380. [Google Scholar] [CrossRef] [PubMed]
  23. Suryantoro, S.D.; Thaha, M.; Sutanto, H.; Firdausa, S. Current Insights into Cellular Determinants of Peritoneal Fibrosis in Peritoneal Dialysis: A Narrative Review. J. Clin. Med. 2023, 12, 4401. [Google Scholar] [CrossRef] [PubMed]
  24. Zhang, Y.; Nakano, D.; Guan, Y.; Hitomi, H.; Uemura, A.; Masaki, T.; Kobara, H.; Sugaya, T.; Nishiyama, A. A sodium-glucose cotransporter 2 inhibitor attenuates renal capillary injury and fibrosis by a VEGF-dependent pathway after renal injury in mice. Kidney Int. 2018, 94, 524–535. [Google Scholar] [CrossRef] [PubMed]
  25. Shentu, Y.; Li, Y.; Xie, S.; Jiang, H.; Sun, S.; Lin, R.; Chen, C.; Bai, Y.; Zhang, Y.; Zheng, C.; et al. Empagliflozin ameliorates peritoneal fibrosis via suppressing TGF-β/Smad signaling. Int. Immunopharmacol. 2021, 93, 107374. [Google Scholar] [CrossRef] [PubMed]
  26. Hamdan, Z.; Abdel-Hafez, Y.; Enaya, A.; Sarsour, A.; Kharraz, L.; Nazzal, Z. Dapagliflozin in peritoneal dialysis patients: A pilot study evaluating peritoneal membrane function. BMC Nephrol. 2024, 25, 37. [Google Scholar] [CrossRef] [PubMed]
  27. Shinzawa, M.; Arisato, T.; Oka, H.; Ueda, Y.; Matsumoto, A.; Kitamura, H.; Hamano, T.; Nakazono, Y.; Nishiya, Y.; Hashimoto, N.; et al. Empagliflozin and ultrafiltration volume in patients undergoing peritoneal dialysis. Kidney Int. Rep. 2025, 11, 141–151. [Google Scholar] [CrossRef] [PubMed]
  28. Stepanova, N. SGLT2 inhibitors in peritoneal dialysis: A promising frontier toward improved patient outcomes. Ren. Replace. Ther. 2024, 10, 5. [Google Scholar] [CrossRef]
  29. Riedl Khursigara, M.; Liu, P.; Kaur, R.; Mavrakanas, T.A. Role of SGLT-2 Inhibitors in Ultrafiltration Failure in Peritoneal Dialysis: A Narrative Review. Can. J. Kidney Health Dis. 2024, 11, 20543581241293500. [Google Scholar] [CrossRef] [PubMed]
  30. Heidenreich, P.A.; Bozkurt, B.; Aguilar, D.; Allen, L.A.; Byun, J.J.; Colvin, M.M.; Deswal, A.; Drazner, M.H.; Dunley, S.M.; Evers, L.R.; et al. 2022 AHA/ACC/HFSA Guideline for the Management of Heart Failure: Executive Summary. J. Am. Coll. Cardiol. 2022, 79, 1757–1780. [Google Scholar] [CrossRef] [PubMed]
  31. de Boer, I.H.; Khunti, K.; Sadusky, T.; Tuttle, K.R.; Neumiller, J.J.; Rhee, C.M.; Rosas, S.E.; Rossing, P.; Bakris, G. Diabetes management in chronic kidney disease: A consensus report by the ADA and KDIGO. Kidney Int. 2022, 102, 974–989. [Google Scholar] [CrossRef] [PubMed]
  32. Zannad, F.; Ferreira, J.P.; Pocock, S.J.; Zeller, C.; Anker, S.D.; Butler, J.; Filippatos, G.; Hauske, S.J.; Brueckmann, M.; Pfarr, E.; et al. Cardiac and kidney benefits of empagliflozin in heart failure across the spectrum of kidney function: Insights from EMPEROR-reduced. Circulation 2021, 143, 310–321, Erratum in Circulation 2021, 143, e29. [Google Scholar] [CrossRef] [PubMed]
  33. Herrington, W.G.; Staplin, N.; Wanner, C.; Green, J.B.; Hauske, S.J.; Emberson, J.R.; Preiss, D.; Judge, P.; Mayne, K.J.; Ng, S.Y.A.; et al. Empagliflozin in patients with chronic kidney disease. N. Engl. J. Med. 2023, 388, 117–127. [Google Scholar] [CrossRef] [PubMed]
  34. Masola, V.; Bonomini, M.; Borrelli, S.; Di Liberato, L.; Vecchi, L.; Onisto, M.; Gambaro, G.; Palumbo, R.; Arduini, A. Fibrosis of peritoneal membrane as target of new therapies in peritoneal dialysis. Int. J. Mol. Sci. 2022, 23, 4831. [Google Scholar] [CrossRef] [PubMed]
  35. Prasad, N.; Chaturvedi, S.; Singh, H.; Udumula, M.P.; Rawat, A.; Jeyakumar, H.; Jaiswal, P.; Kumar, A.; Agarwal, V. Peritoneal dialysis-associated fibrosis: Emerging mechanisms and therapeutic opportunities. Front. Pharmacol. 2025, 16, 1635624. [Google Scholar] [CrossRef] [PubMed]
  36. Lai, J.-W.; Lin, H.-J.; Chou, C.-Y. SGLT-2 inhibitors may increase ultrafiltration in incident peritoneal dialysis patients: A case report. BMC Nephrol. 2023, 24, 106. [Google Scholar] [CrossRef] [PubMed]
  37. Alhwiesh, A.K.; Abdul-Rahman, I.S.; Nasreldin, M.A.; Mohammed, A.M.; Al-Oudah, S.; Al-Thwainy, R.; AlSwal, A.; Alsenpisi, Z.; Abdulrahman, A.; Al Warthan, S.; et al. The use of SGLT2 inhibitors in peritoneal dialysis patients: A shade of light on dapagliflozin. Arch. Nephrol. Urol. 2022, 5, 1–8. [Google Scholar] [CrossRef]
  38. Theofilis, P.; Sagris, M.; Oikonomou, E.; Anatonopoulos, E.; Siasos, G.; Tsioufis, K.; Tousoulis, D. Anti-Inflammatory potential of SGLT2 inhibitors: A systematic review and meta-analysis of preclinical studies in rodents. Eur. Heart J. 2022, 43, ehac544.2683. [Google Scholar] [CrossRef]
  39. Romani, R.F.; Waniewski, J.; Kruger, L.; Lindholm, B.; Nascimento, M.M. Comparison of three PET methods to assess peritoneal membrane transport. Braz. J. Med. Biol. Res. 2019, 52, e8596. [Google Scholar] [CrossRef] [PubMed]
  40. Wang, Y.; Zhang, Y.; Ma, M.; Zhuang, X.; Lu, Y.; Miao, L.; Lu, X.; Cui, Y.; Cui, W. Mechanisms underlying the involvement of peritoneal macrophages in the pathogenesis and novel therapeutic strategies for dialysis-induced peritoneal fibrosis. Front. Immunol. 2024, 15, 1507265. [Google Scholar] [CrossRef] [PubMed]
  41. Khachroumi, N.; Boyer, A.; Lanot, A.; Ficheux, M.; Bechade, C.; Lobbedez, T. Outcomes of diabetic patients undergoing peritoneal dialysis in the French Language Peritoneal Dialysis Registry. Clin. Kidney J. 2025, 19, sfaf382. [Google Scholar] [CrossRef] [PubMed]
  42. Paes de Faria, V.; Dias, J.; Carmo, R.; Lopes, D.; Gomes, A.M. Particularities of peritoneal dialysis in diabetic patients. Nefrologia (Engl. Ed.) 2025, 45, 101324. [Google Scholar] [CrossRef] [PubMed]
  43. Khan, M.S.; Ahmed, A.; Greene, S.J.; Fiuzat, M.; Kittleson, M.; Butler, J.; Bakris, G.L.; Fonarow, G.C. Managing heart failure in patients on dialysis: State-of-the-art review. J. Card. Fail. 2023, 23, 87–107. [Google Scholar] [CrossRef] [PubMed]
Figure 1. Revised study flow diagram and study periods.
Kidneydial 06 00049 g001
Figure 2. Clinical marker changes before and after dapagliflozin treatment (n = 32).
Kidneydial 06 00049 g002
Table 1. Baseline demographic and clinical characteristics of the study population (n = 32).
VariableMean ± SDMedian95% CI
Age (years)27.63 ± 4.3226.0026.07–29.19
Dialysis duration (years)6.52 ± 0.976.606.17–6.87
Weight (kg)74.91 ± 8.8375.5071.73–78.09
Height (cm)163.13 ± 4.42163.00161.54–164.72
Body Mass Index (kg/m2)28.24 ± 3.9027.4426.83–29.65
Systolic Blood Pressure (mmHg)131.00 ± 5.31133.60129.09–132.91
Diastolic Blood Pressure (mmHg)78.54 ± 5.4181.6076.59–80.49
Oxygen Saturation (%)96.31 ± 1.3196.0095.84–96.78
Sex Distribution
SexN (%)
Male19 (59.4%)
Female13 (40.6%)
Abbreviations: SD, standard deviation; CI, confidence interval.
Table 2. Baseline laboratory and peritoneal dialysis characteristics (n = 32).
VariableMean ± SDMedian95% CI
Hemoglobin (g/dL)11.11 ± 0.4011.1010.97–11.25
Sodium (mmol/L)135.91 ± 0.78136.00135.63–136.19
Bicarbonate (mmol/L)21.35 ± 0.6921.6021.10–21.60
Potassium (mmol/L)3.91 ± 0.303.803.80–4.02
HbA1c (%)5.44 ± 0.155.405.39–5.49
Ferritin (µg/L)246.88 ± 18.01249.00240.39–253.37
Creatinine (mg/dL)7.40 ± 0.927.557.07–7.73
Blood Urea Nitrogen (mg/dL)53.75 ± 3.6354.5052.44–55.06
Fasting Blood Sugar (mg/dL)93.41 ± 4.2994.5091.86–94.95
Albumin (g/dL)3.74 ± 0.233.733.66–3.82
C-reactive Protein (mg/dL)0.77 ± 0.240.760.68–0.86
Ultrafiltration (mL)472.19 ± 44.56440.00456.13–488.25
Peritoneal Equilibration Test (PET) Parameters
MedianMean ± SDParameter
ParameterMean ± SDMedian
D/D0 Glucose (0 h)0.92 ± 0.030.91
D/D Glucose (2 h)0.55 ± 0.030.54
D/D Glucose (4 h)0.31 ± 0.030.31
D/P Creatinine (0 h)0.13 ± 0.010.12
D/P Creatinine (2 h)0.53 ± 0.010.53
D/P Creatinine (4 h)0.65 ± 0.030.64
Free Sodium (0 h)137.81 ± 1.47135.80
Free Sodium (1 h)142.75 ± 1.67143.20
Abbreviations: SD, standard deviation; CI, confidence interval; HbA1c, glycated hemoglobin; PET, peritoneal equilibration test; D/P, dialysate-to-plasma ratio; D/D0, dialysate-to-initial dialysate ratio; mL, milliliters; g/dL, grams per deciliter; mmol/L, millimoles per liter; mg/dL, milligrams per deciliter; µg/L, micrograms per liter.
Disclaimer/Publisher’s Note: The statements, opinions and data contained in all publications are solely those of the individual author(s) and contributor(s) and not of MDPI and/or the editor(s). MDPI and/or the editor(s) disclaim responsibility for any injury to people or property resulting from any ideas, methods, instructions or products referred to in the content.