Article

Machine Learning Models to Predict Recoveries and Deaths from COVID-19 in Mexican Society in the Post-Pandemic Era

by
Enrique Luna-Ramírez
1,*,
Jorge Soria-Cruz
1,
Iván Castillo-Zúñiga
1 and
Jaime Iván López-Veyna
2
1
National Technological Institute of Mexico, El Llano Aguascalientes Campus, Km. 18 Carretera Ags.-S.L.P., Aguascalientes 20330, Mexico
2
National Technological Institute of Mexico, Zacatecas Campus, Carr. Panamericana Entronque a Guadalajara s/n, Col. La Escondida, Zacatecas 98000, Mexico
*
Author to whom correspondence should be addressed.
COVID 2025, 5(10), 174; https://doi.org/10.3390/covid5100174
Submission received: 5 September 2025 / Revised: 7 October 2025 / Accepted: 9 October 2025 / Published: 15 October 2025
(This article belongs to the Section Long COVID and Post-Acute Sequelae)

Abstract

The emergence or mutation of aggressive viruses represents a latent threat to human health that could lead to new pandemics, so it is important to constantly monitor and analyze the behavior of the diseases they can cause. In this sense, the purpose of this work was to generate models to predict the behavior of recoveries and deaths from COVID-19 in Mexico in the post-pandemic era, applying machine learning techniques to data related to this disease, published by the Mexican government. Models based on artificial neural networks, logistic regression, and classification algorithms were generated and validated, yielding high rates of correct classification, accuracy, and recall, so that they could be used to make predictions about future cases of patients infected with the SARS-CoV-2 virus.

1. Introduction

This study was motivated by the enormous threat that represented and still represents the COVID-19 disease, even though it has been significantly controlled with the help of vaccines. Therefore, it is worth characterizing its current behavior in society to predict survival and death rates of SARS-CoV-2-infected people in the post-pandemic era. In this sense, this work focused on generating prediction models in the Mexican context, using machine learning techniques that included artificial neural networks, logistic regression models, and classification algorithms.
Since the beginning of the pandemic, various related works have been carried out, some of them, as reviews, highlighting Artificial Intelligence, Deep Learning, and Machine Learning, among other technologies, as important alternatives to analyze the behavior of pandemics and reduce their damage [1,2,3,4]. Other studies use ML and/or DL techniques in diverse contexts to analyze data related to COVID-19. Podder & Mondal [5] carried out a study to predict COVID-19 and intensive care unit requirement using a Brazilian dataset and the Random Forest, XGBoost, and Logistic Regression classifiers; they reported high accuracy and recall levels in their results. Zhan et al. [6] proposed a ML model for COVID-19 prediction based on the Broad Learning System and compared the model´s forecasting results with the results of several classifier-based models to show that their model had the best performance. Purwandari et al. [7] carried out research to predict recovered and death cases from COVID-19 in Malaysia using artificial neural networks; they used the Multi-Layer Perceptron, Auto Regressive, and Extreme Learning Machine models, concluding that the best results for the next 7 days were obtained through the MLP model, but the ELM model performed better on the test data. Yenurkar & Mal [8] proposed a deep learning algorithm to detect positive cases of COVID-19 patients, mortality rate, and recovery rate using real-world datasets. As part of the prediction process, they hybridized two deep learning procedures, ResNet and GoogleNet models. According to the authors, their proposal achieved higher accuracy than other algorithms, such as Linear Regression, Multinomial Naïve Bayes, Random Forest, Stochastic Gradient Boosting, Decision Tree, and Bagging. Villavicencio et al. [9] used several machine learning algorithms to analyze and predict the presence of COVID-19 in people using a Kaggle dataset [10] and the WEKA machine learning tool [11]. They used J48 Decision Tree, Random Forest, Support Vector Machine, K-Nearest Neighbors, and Naïve Bayes algorithms, reporting Support Vector Machine as the algorithm with the best results. Aledhari et al. [12] used an LSTM-RNN model with ANN Regression to predict future COVID-19 cases in the USA context. They used a dataset downloaded from the website “Our World in Data” [13] to analyze COVID-19 cases and another dataset downloaded from the Apple Mobility Index web page [14] to analyze the social distancing issue, and claimed that their model had achieved comparable results, but that it could be improved for better results. Parbat & Chakraborty [15] proposed a support vector regression model to predict the number of deaths and recovered cases, as well as the cumulative number of confirmed cases and the number of daily cases, using a Kaggle dataset [10] for India. They reported a prediction accuracy of over 97%, except for the number of daily cases, for which the model yielded an accuracy of 87%. Lakshmanarao et al. [16] proposed machine learning regressors for COVID-19 predictions. They applied linear regression, polynomial regression, Decision Tree, and Random Forest algorithms on a Kaggle dataset [10] for India and reported an R-squared value of 0.99 with the Decision Tree and Random Forest algorithms. Zgheib et al. [17] proposed an ANN model to predict whether a person had caught COVID-19 or not. They used a dataset of patients tested for COVID-19 at a hospital in Dubai for training their model and achieved an accuracy of 97.6% with an average error of 0.01.
In the Mexican context, Galván-Tejada et al. [18] proposed two online visualization tools to analyze demographic data and comorbidities related to SARS-CoV-2. Mancilla-Galindo et al. [19] proposed a multivariate prediction model of death in Mexican patients with COVID-19; they developed a scoring system based on a Cox regression model using the predictors age, sex, diabetes, chronic obstructive pulmonary disease, hypertension, immunosuppression, obesity, and chronic kidney disease. Gomez-Cravioto et al. [20] carried out a study for projecting COVID-19 infections and deaths in Mexico using machine learning techniques. They used the linear, polynomial, and logistic regression models to describe the growth of COVID-19 incidents in Mexico, and machine learning and time series techniques to identify feature importance and perform forecasting for infected cases and deaths. According to the authors, the logistic growth model fitted the pandemic’s behavior best, and the long short-term memory network could be exploited for predicting daily cases. Ascencio-Montiel et al. [21] analyzed confirmed COVID-19 cases in five infection waves in Mexico using the Mexican Online Epidemiological Surveillance System and logistic regression models to assess the association of demographic factors, comorbidities, waves, and vaccination with the risk of severe disease and in-hospital death. Almustafa [22] applied various ML algorithms to a COVID-19 Mexican patients dataset referred to as Covid109MDP to select the best classification algorithm for dead and survival cases. He reported that the best classification accuracy, of 94.41%, was achieved with the J48 classifier, which, according to the author, can predict a surviving case with 94.88% accuracy. Thus, taking all these studies as a background, our proposal is presented below.

2. Materials and Methods

For carrying out this study, we used the official data on SARS-CoV-2 virus infections and COVID-19 deaths provided by the Government of Mexico through the Epidemiology Department [23], specifically, the data corresponding to the post-pandemic era between January 2024 and April 2025. These data were preprocessed so that they could be exploited using machine learning techniques: artificial neural networks, logistic regression models, and classification algorithms. Figure 1 shows a time series analysis for these data.
Three clear waves are observed in the daily series: (1) the highest peak of the period, January–February 2024, (2) a medium rebound, July–August 2024, then declines towards October–November, and (3) a new increase, December–March 2025. The sharp drop at the end of the series is due to incomplete data caused by delayed reporting.
The 7-Day Moving Average shows the same three waves, but smoothed out. The winter season (January–February) and mid-year (July–August) show the most pronounced increases, which can be interpreted as a sign of seasonality.

2.1. Artificial Neural Networks

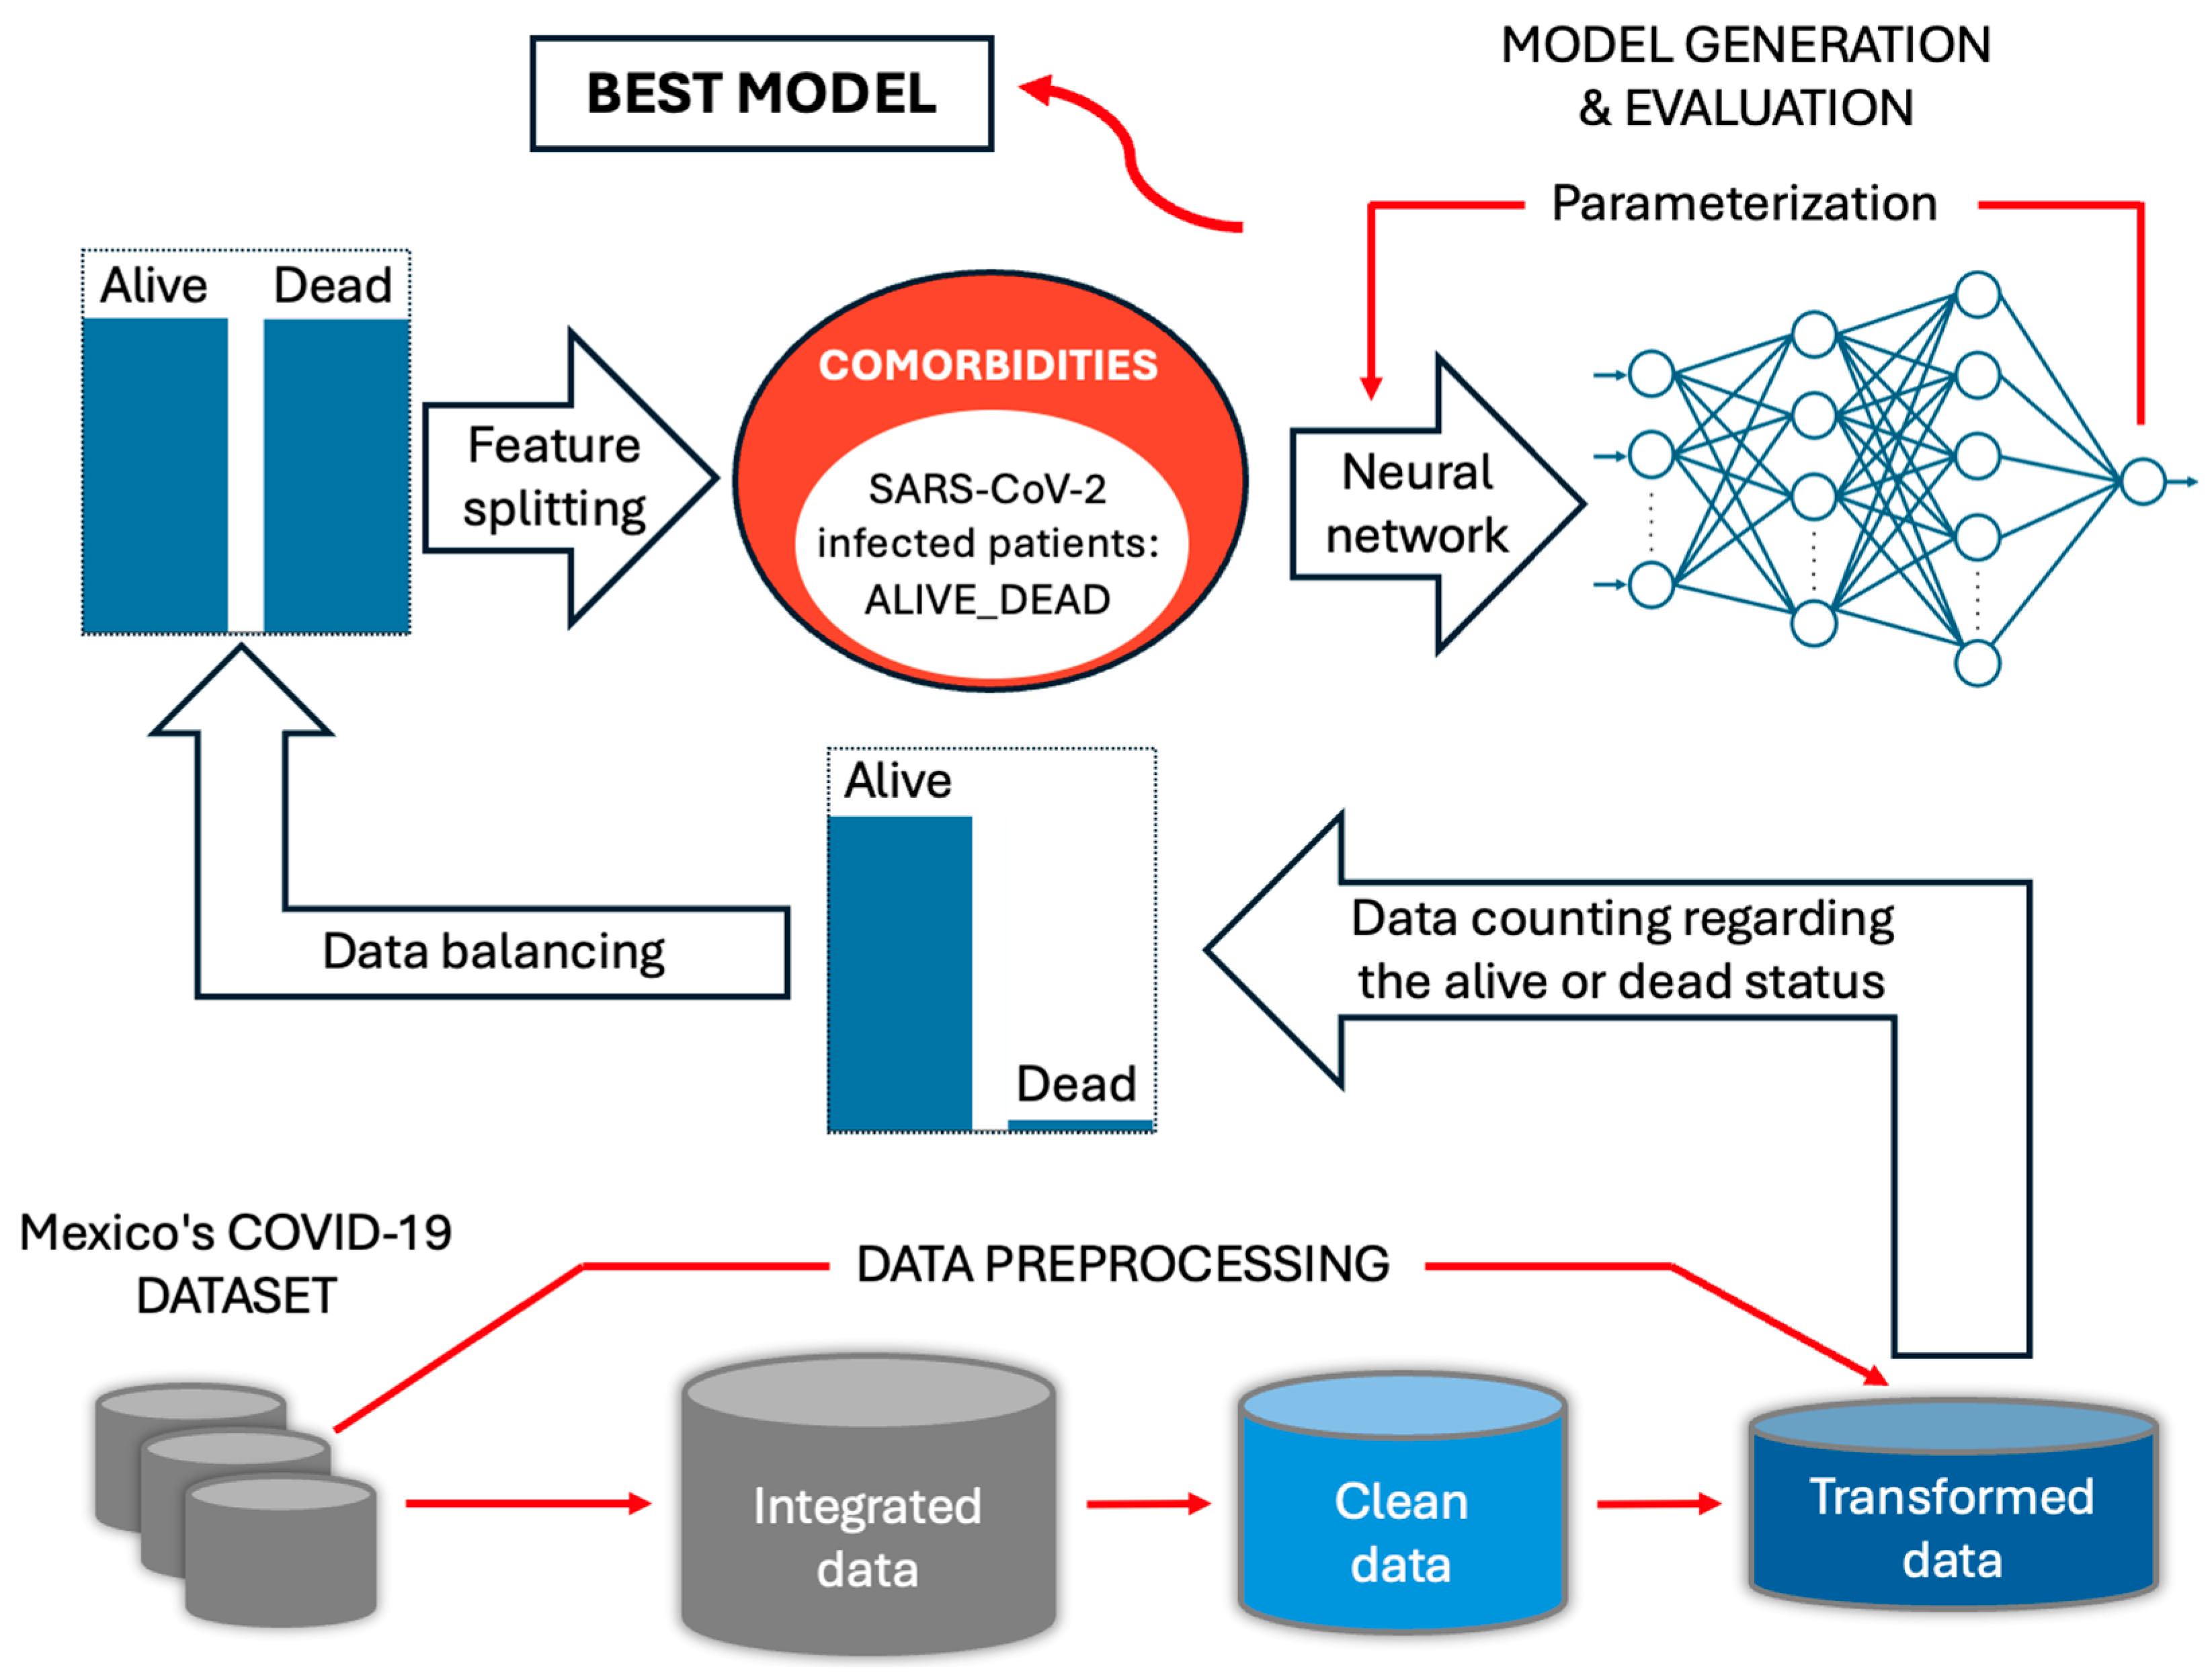
Figure 2 shows the process based on artificial neural networks to exploit Mexico’s COVID-19 dataset, in which the first step is the data preprocessing.
Data preprocessing consisted of (1) integrating the whole data from different periods (weeks and months), since the data are published periodically, (2) cleaning the integrated data of irrelevant information, as is the case of non-significant features and those people not confirmed as SARS-CoV-2 positives, and (3) transforming the clean data into a suitable format for processing through artificial neural networks. These stages were carried out with the help of Microsoft Power BI version· 2.141.1754.0 [24] for data integration, RStudio version: 4.3.1. [25] for a significant feature analysis and Microsoft Excelel version 16.101.3 [26] for data transformation.
The response variable in this work was the so-called ALIVE_DEAD variable, which stores the information about the survival/death of SARS-CoV-2-infected patients. Since the number of survival cases was significantly larger than the number of death cases, it was necessary to balance the data in terms of the response variable through an under-sampling process, so that the bias of constantly predicting the predominant value (alive) could be minimized.
The next step was the feature splitting, that is, the separation of data into two sets: one dataset corresponding to the response variable and another dataset corresponding to the significant variables, most of them comorbidity variables. In this way, we proceeded to generate and evaluate neural network models by testing different parameters and hyperparameters to improve the network’s accuracy in predicting patient survival/death and, thus, to find the best prediction model. This model generation and evaluation stage is shown in the dash-line box at the top of Figure 2. It is worth mentioning that the under-sampling, the feature splitting, and the neural network generation subprocesses were programmed in the Python languagen·version·3.13.7.A [27].

2.1.1. Significant Features

As mentioned above, RStudio [25] was used to identify the most significant features with respect to the response variable ALIVE_DEAD. Thus, of the 42 original features, only the 16 features shown in Figure 3 were significant, some of them with a high degree of significance (INTUBED, COPD, AGE, and PNEUMONIA) and others with lesser significance (MEXICAN_STATE, SMOKING, and DIABETES); nonetheless, all these features were considered in our study. It is important to mention that, based on data behavior, a strong relationship was observed between these features and the recoveries/deaths from COVID-19. For example, an elderly intubated patient with pneumonia or other comorbidities had a high probability of dying, while a young, non-intubated patient had a high probability of surviving. Thus, each significant feature was present in some behavioral pattern related to recovery or death of patients.
The resulting set of 17 variables (16 significant features and 1 response variable) was imported into the WEKA machine learning tool [11], whose purpose at this stage was only to verify data consistency. Thus, as shown in Figure 3, the number of SARS-CoV-2 infected patients was 440,361 during the period from January 2024 to April 2025, which coincided with the number of preprocessed data.

2.1.2. Data Balancing, Training Data, and Test Data

The total number of SARS-CoV-2-infected patients was composed of 436386 surviving patients and 3975 patients who died from COVID-19, so it was necessary to execute an under-sampling process to adjust the number of surviving patients to 3975 for carrying out our study with balanced data.
To generate and evaluate machine learning models in a further stage, 5565 training data and 2385 testing data were taken from the set of 7950 balanced data, corresponding to 70% and 30% of this dataset, respectively, which was the most suitable percentage for training and testing.

2.1.3. Artificial Neural Network Generation and Evaluation

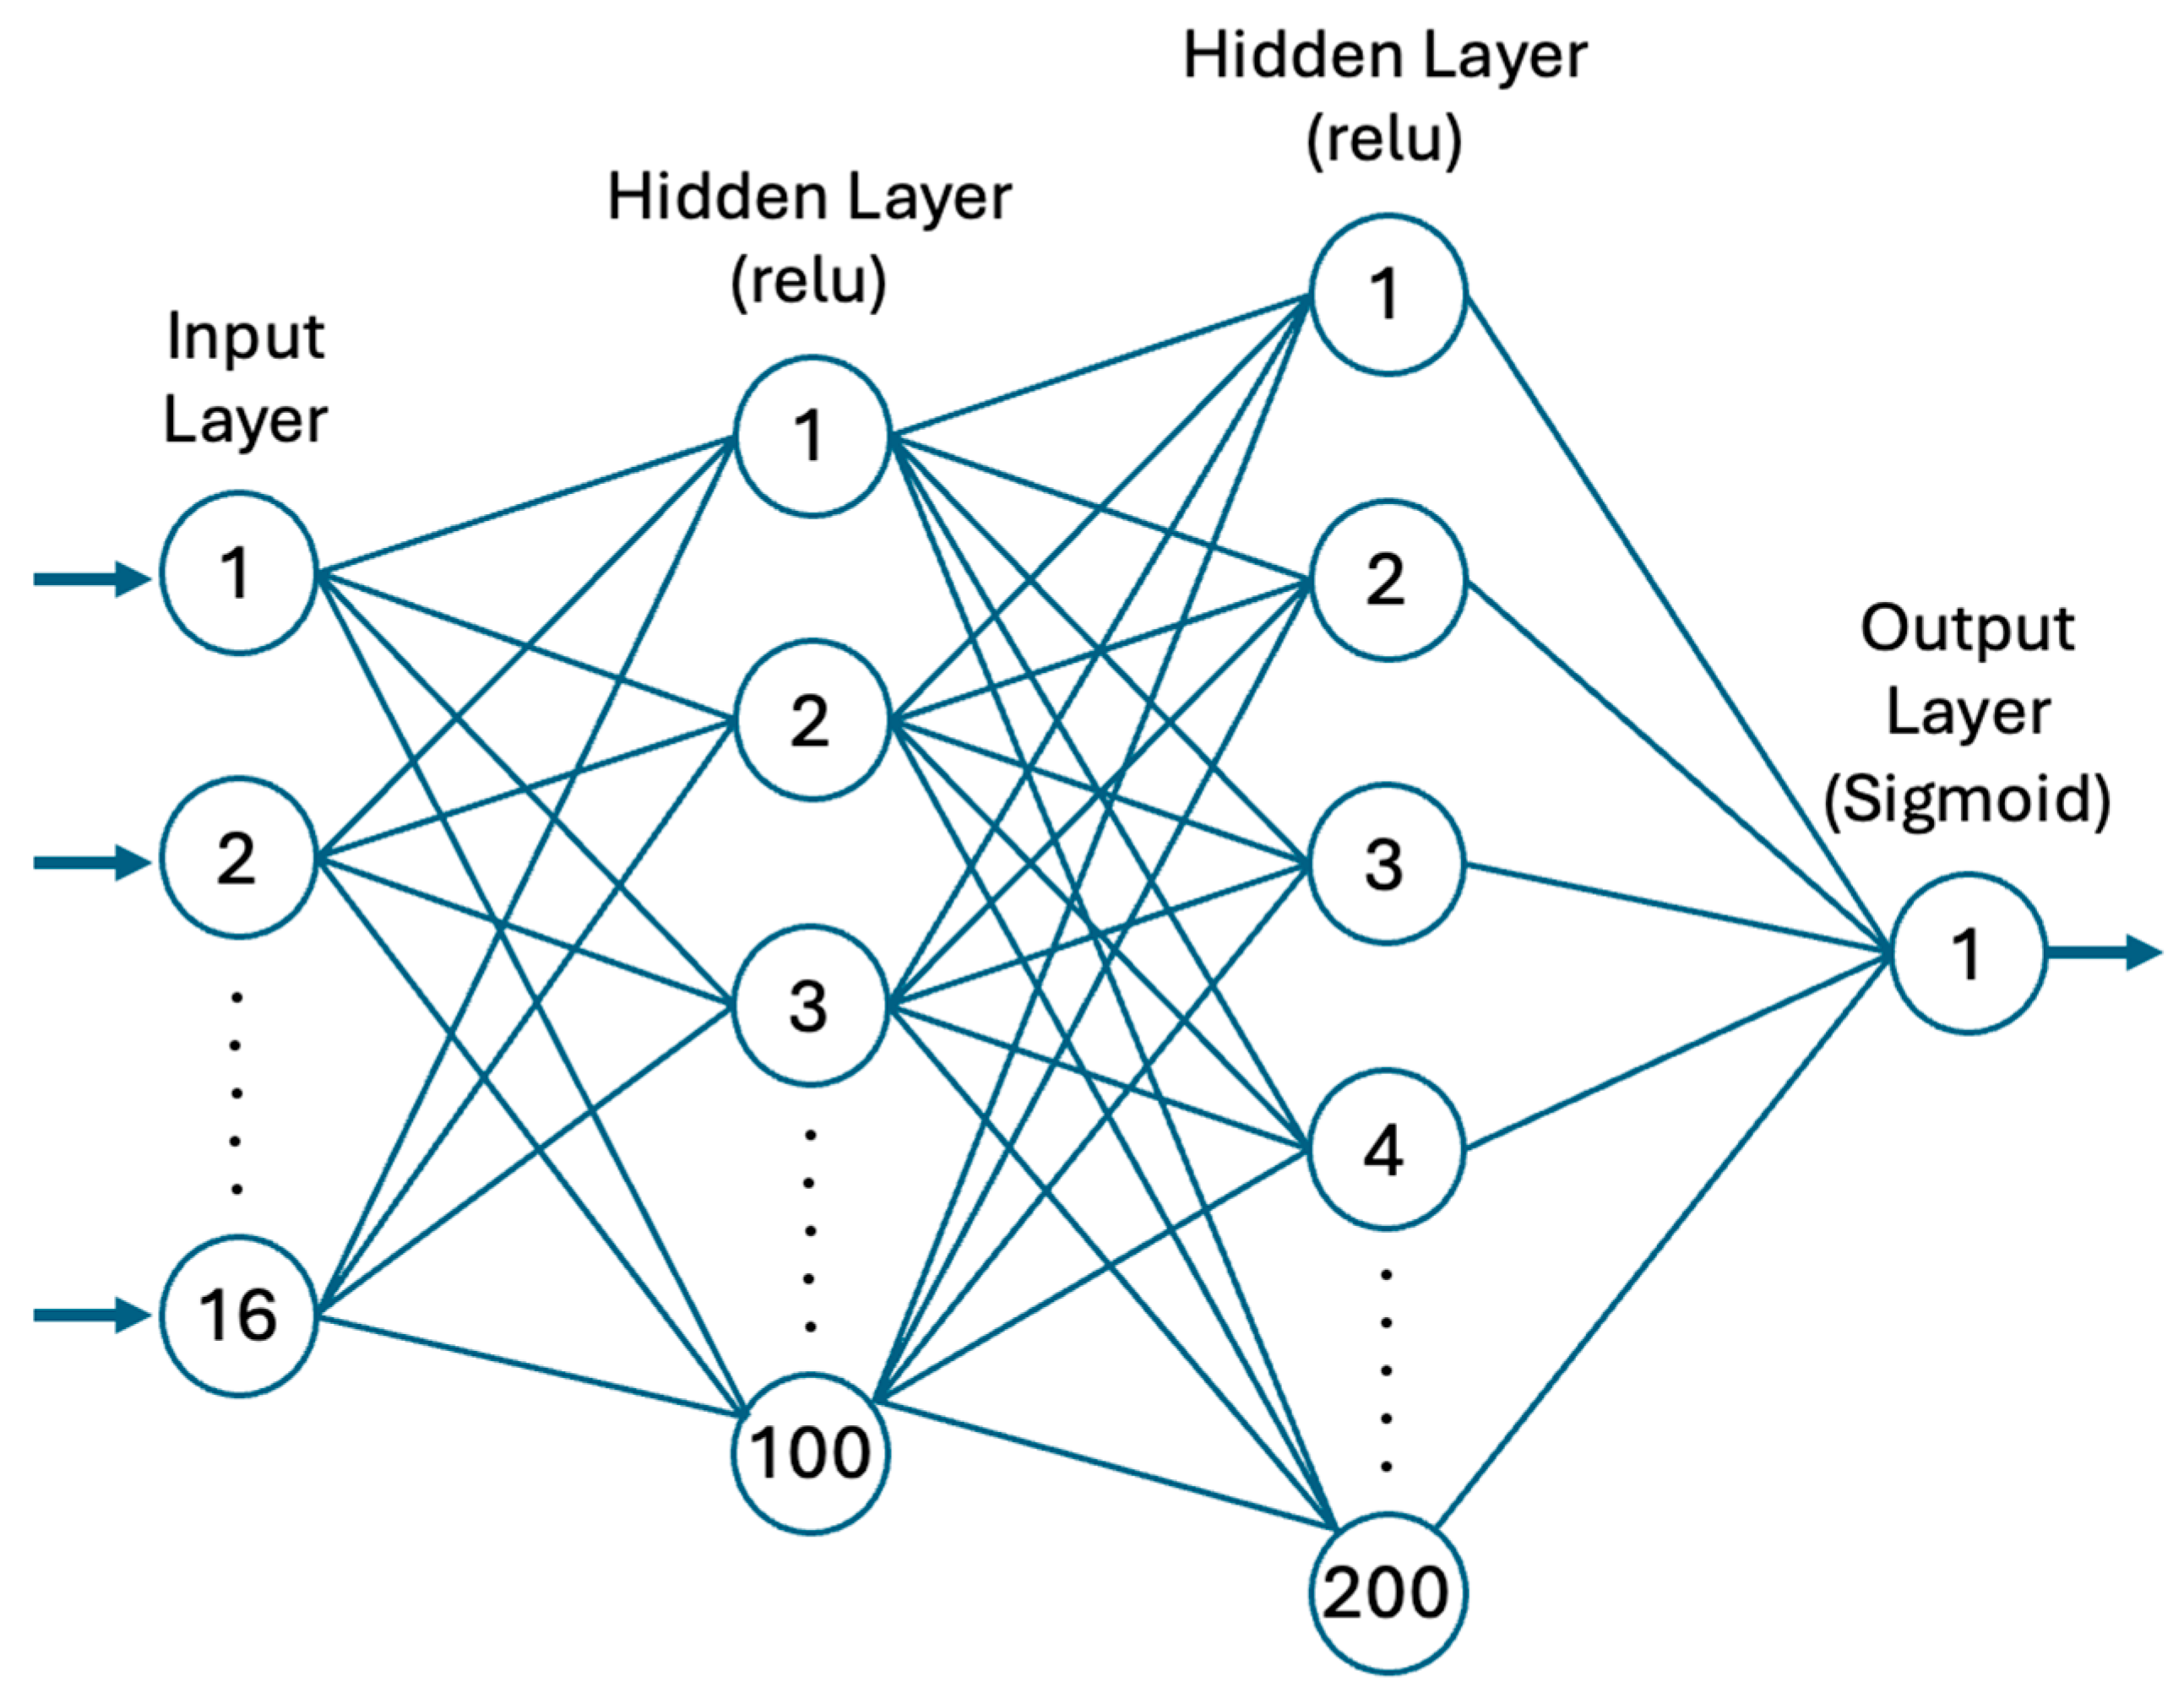
After generating artificial neural network models with different hyperparameters (number of hidden layers, number of neurons per layer, activation functions, optimizers, learning rates, and loss functions), the most suitable parameterization was found, which is shown in Figure 4.
The input layer includes 16 neurons corresponding to the 16 significant variables, while the output layer, with a single neuron, corresponds to the response variable ALIVE_DEAD; this output layer operates with the Sigmoid activation function, commonly used for binary classification (in our case, alive or dead). In addition, the neural network model includes two hidden layers, with 100 and 200 neurons, both operating with the ReLU activation function, the SGD optimizer, a learning rate of 0.01, and the MSE loss function. Thus, by training and testing the neural network model using different hyperparameters, the optimal number of hidden layers and neurons per layer was identified in terms of accuracy and loss.

2.2. Logistic Regression Models

As in the previous technique, these models were run on preprocessed and balanced data using 70% for training and 30% for testing, and the same significant features, yielding results like the optimal results of the neural network in terms of testing accuracy, but with less accurate predictions on the “Alive” class, resulting on a slight overprediction on this class and a significant loss of the “Dead” class actual values, as will be shown later.

2.3. Classification Algorithms

Classification algorithms were also applied to preprocessed and balanced data for generating and evaluating classification models using different classifiers and parameters. Thus, as explained later, the best results were obtained with the C4.5, Random Forest, Naïve Bayes, Bayes Net, and Random Tree classifiers, achieving results close to those obtained using neural networks, particularly with the C4.5 classifier, which yielded a significant correct classification percentage supported by a consistent validation test.

3. Results

The results obtained from the three classification approaches applied to Mexico’s COVID-19 dataset are presented below.

3.1. Artificial Neural Network Results

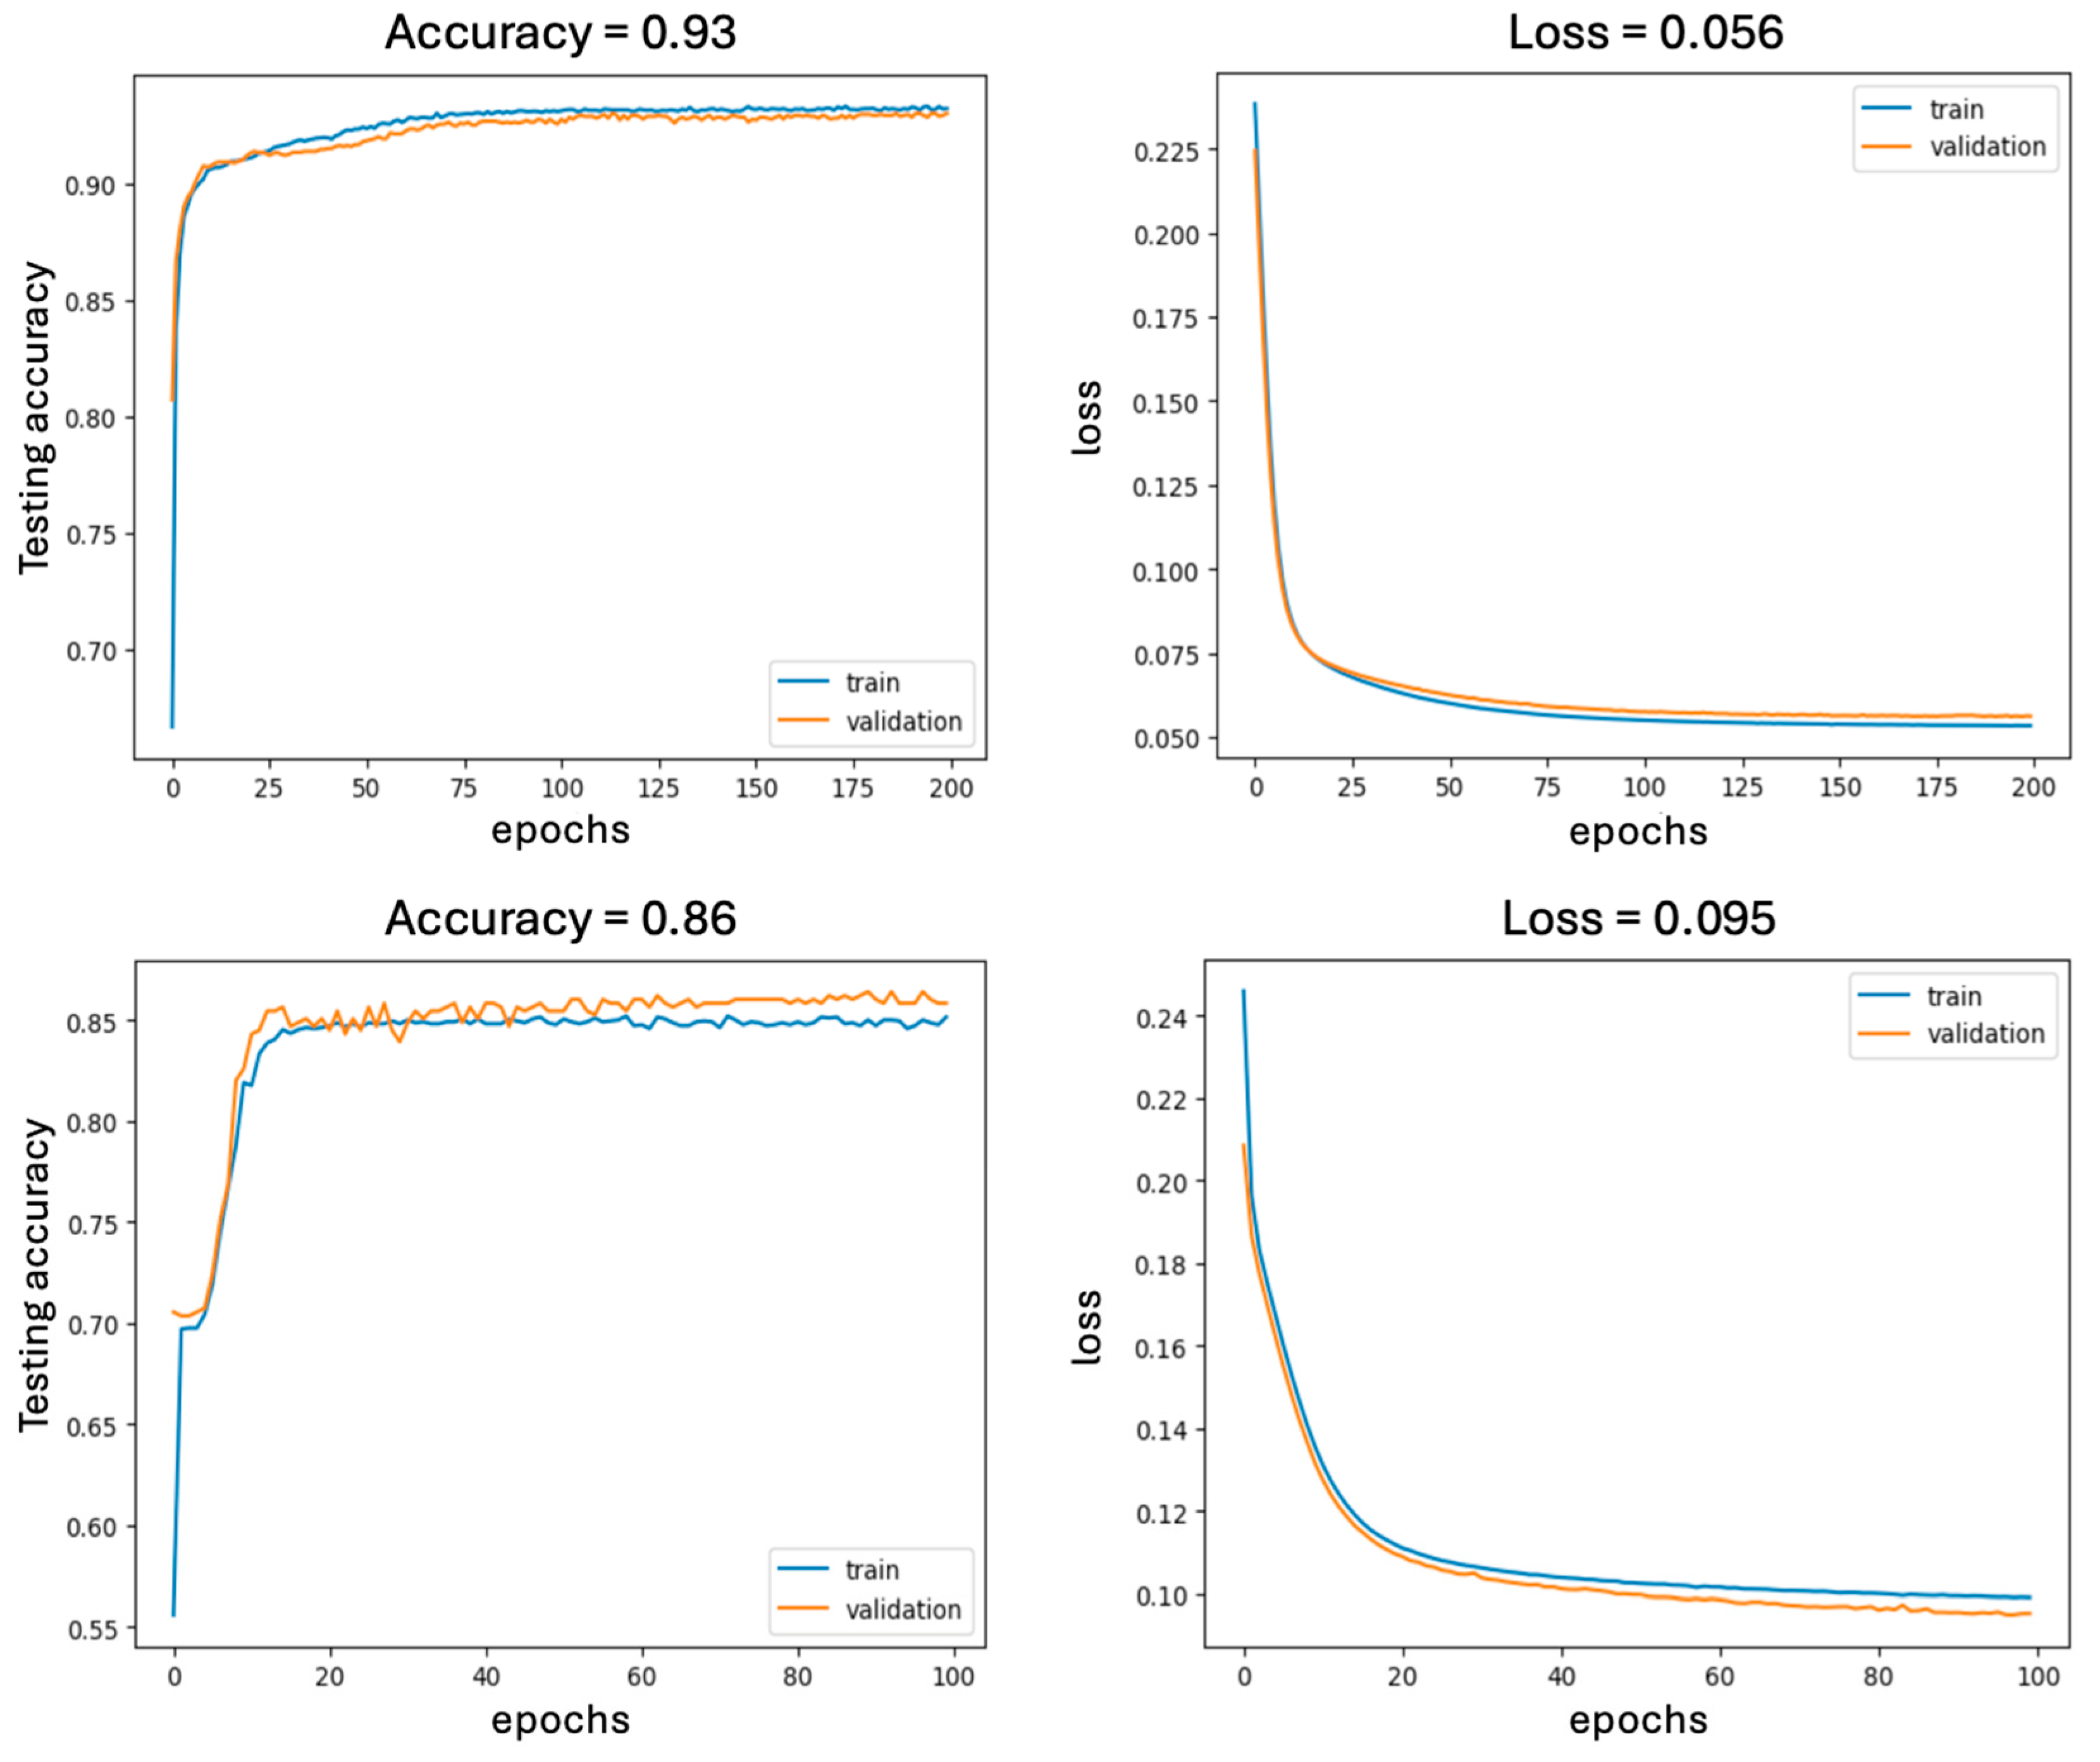
An artificial neural network model evaluation report is presented in Table 1, showing only the evaluation of the best and worst classification models found among the different neural network models that were generated. As can be seen, when running the trained models on the test data, in the case of the best classification model, all test metrics resulted in a value of 0.93, including the confusion matrix results, which indicated that 2219 patients were correctly classified out of 2385, representing a correct classification of 93%. In the case of the worst classification model, the accuracy and recall metrics resulted in a value of 0.86, the same as the correct classification provided by the confusion matrix.
Analyzing Table 1 in more detail, regarding the best classification model, it can be said that the model performance is balanced, since the value of the metrics precision, recall, and f1-score is the same (0.93) for both classes (0 = Alive, 1 = Dead). In the confusion matrix, 79 false positives and 87 false negatives are observed for the “Dead” class, that is, 79 cases were predicted as “Dead” with their actual value being “Alive”, and 87 cases were predicted as “Alive” with their actual value being “Dead”, so it can be stated that the model has a meaningful performance, making few errors in both classes. Regarding the weakest model, in principle, the metrics are significantly disparate, showing an imbalance in the model performance. In addition, a much higher number of false positives (242) than false negatives (96) is observed for the “Dead” class in the confusion matrix, indicating that the model tends to overpredict this class.
As a complement to this information, Figure 5 shows the accuracy and loss graphs for the best and worst classification models. By comparing the graphs, it can be observed that there is a 7% difference in accuracy and a 3.9% difference in loss between the models. In the case of the best model, achieved using 200 epochs, the train and validation curves are almost overlapped, with no signs of overfitting, which shows that the model is well-tuned and stable. At this point, it is important to mention that the first neural network models generated had an overfitting problem, which was solved by using the dropout technique to adjust some hyperparameters: the number of layers and neurons per layer was reduced to increase accuracy and reduce loss of the models.

3.2. Logistic Regression Model Results

Table 2 presents an evaluation report of the best logistic regression model generated. As can be seen, the accuracy of this model is also 0.93, which can be considered significant, considering that the classes are balanced. Furthermore, the macro/weighted f1 value close to 0.93 indicates that performance is consistent across both classes. Nonetheless, the model tends to slightly overpredict the “Alive” class, which can be observed from the 124 false positives and 51 false negatives for this class in the confusion matrix. In other words, the model prediction has an approximate loss of 10% of the “Dead” class actual values.

3.3. Results of Classification Algorithms

An evaluation report of classification-algorithm-based models is presented in Table 3, which shows the five best classification models found using different classifiers and parameters. The models and their evaluation were generated with the WEKA machine learning tool [11] using, as mentioned above, 70% for training and 30% for testing of the balanced data, and a 10-fold cross-validation.
It is important to note that all five models had a significant correct classification percentage and a relatively high Kappa statistic, metrics directly associated with the accuracy and consistency of the validation test, respectively. Additionally, the TP rate, FP rate, precision, recall, and F-measure metrics reinforce the robustness of the models, particularly of the model generated through the J48 classifier, the best of the five models, with a 92.45% accuracy and a 0.849 Kappa value.

3.4. Comparison of Results

It is worth comparing these results with the results of related studies, especially with those conducted in the Mexican context. Table 4 presents a comparative summary of the most relevant studies found, which includes works based on diverse machine learning techniques that use different evaluation metrics. First, it is important to mention that all the works considered in the summary [19,20,21,22] were carried out based on data corresponding to the pandemic period, at different times and with different datasets, while our work was developed based on post-pandemic data, that is, after all SARS-CoV-2 infection waves, so that the behavior patterns of the data in both periods do not necessarily have to be similar.
The study most like ours is the one carried out by Almustafa [22], which makes use of classification algorithms, but not neural networks or regression models. In fact, both works agree on the J48 algorithm as the best classifier, with a slight difference in accuracy (94.41% vs. 92.45%). The other studies make use of other techniques, some of which could be considered in an improved version of this work, for example, using LSTM and convolutional neural networks if convenient.

4. Discussion

The classification models generated from Mexico’s COVID-19 dataset using machine learning techniques, with ALIVE_DEAD as the classification variable and the other 16 significant features as dependent variables, yielded meaningful results. First, neural network models achieved the best results in this research, with an accuracy of 0.93 and a loss of 0.056, using 200 epochs. These results were achieved not only through hyperparameter tuning, but also through data normalization to stabilize training and improve its convergence, as well as to avoid problems with numerical calculations and improve model generalization. Thus, it can be stated that the 0.93 value obtained for all metrics of the best neural network model, achieved for both classes (0—Alive and 1—Dead), is good enough to correctly classify new unknown data and, therefore, predict future cases.
To overcome the non-linear relationships among data and the complexity of their behavioral patterns, different activation functions were used for the hidden layers, obtaining the best results with ReLU, whose main help was to reduce the vanishing gradient problem [28,29] by ensuring that the gradients do not vanish or explode during training. For the output layer, the Sigmoid function was used due to its binary classification nature [30], which also deals with non-linearity, allowing for complex patterns to be learned from data. In the case of optimizing functions, the SGD optimizer was used to identify the direction in which a function has the steepest rate of change [31,32], thus allowing for minimizing the difference between predicted and actual values.
Regarding the other ML techniques used in this work, the logistic regression model yielded practically the same accuracy as the neural network model, but with a higher loss, while the C4.5 classifier yielded a classification rate close to the rate of these two models, so that the corresponding classification tree and main rules that it contains could be used to predict survival and death cases.

5. Conclusions and Future Work

The work conducted in this research, as well as the studies referenced in this article, demonstrates the usefulness of machine learning techniques for analyzing data related to viral diseases, in this case, the COVID-19 disease caused by the SARS-CoV-2 virus. Using this type of technique, it is possible to identify behavior patterns in disease transmission, as well as in recoveries and deaths. Such patterns can be identified using classification models generated around a variable of interest, whose value usually depends on a set of features that significantly influence its behavior.
Thus, in this research, various classification models were generated to analyze the behavior of recoveries and deaths from COVID-19 in Mexican society in the post-pandemic era using ANN, logistic regression models, and classification algorithms. The variable of interest was ALIVE_DEAD, which stores information on the recovery or death of patients and whose value depended mainly on a set of comorbidities. The best models found had a considerably high rate of correct classification, accuracy, and recall.
Nonetheless, as future work, model robustness and predictive results could be improved using a deep learning strategy in conjunction with the progress achieved through machine learning techniques. Such a strategy could include LSTM and convolutional neural networks to achieve a higher accuracy.

Author Contributions

Conceptualization, E.L.-R. and J.S.-C.; methodology, E.L.-R., J.S.-C., I.C.-Z., and J.I.L.-V.; software, E.L.-R., I.C.-Z., and J.I.L.-V.; validation, E.L.-R. and I.C.-Z.; formal analysis, E.L.-R. and J.S.-C.; investigation, E.L.-R. and J.S.-C.; resources, E.L.-R. and J.I.L.-V.; data curation, E.L.-R., J.S.-C., and I.C.-Z.; writing—original draft preparation, E.L.-R., J.S.-C., I.C.-Z., and J.I.L.-V.; writing—review and editing, E.L.-R., J.S.-C., and I.C.-Z.; visualization, J.S.-C. and I.C.-Z.; supervision, E.L.-R. and J.S.-C.; project administration, E.L.-R. and J.S.-C. All authors have read and agreed to the published version of the manuscript.

Funding

This research received no external funding.

Institutional Review Board Statement

This study used publicly available data, which exempts it from the requirement of submission to an ethics committee, in accordance with the General Law on Transparency and Access to Public Information of Mexico, published in the Official Gazette of the Federation on 20 March 2025, with registration DOF 20-03-2025.

Informed Consent Statement

Patient consent was waived due to the use of anonymized data with unrestricted public access.

Data Availability Statement

The data used for this research are available for download on the website of the Epidemiology Department, at https://www.gob.mx/salud/documentos/datos-abiertos-152127 (accessed on 12 August 2025).

Conflicts of Interest

The authors declare no conflicts of interest.

Abbreviations

The following abbreviations are used in this manuscript:
ANNArtificial Neural Network
CIConfidence Interval
COPDChronic Obstructive Pulmonary Disease
DLDeep Learning
ELMExtreme Learning Machine
FPFalse Positive
HRHazard Ratio
LSTMLong-Short Term Memory
MLMachine Learning
MLPMulti-Layer Perceptron
MSEMean Squared Error
ReLURectified Linear Unit
RMSERoot Mean Squared Error
RNNRecurrent Neural Network
SGDStochastic Gradient Descent
TPTrue Positive

References

  1. Piccialli, F.; di Cola, V.S.; Giampaolo, F.; Cuomo, S. The Role of Artificial Intelligence in Fighting the COVID-19 Pandemic. Inf. Syst. Front. 2021, 23, 1467–1497. [Google Scholar] [CrossRef] [PubMed]
  2. Vaishya, R.; Javaid, M.; Khan, I.H.; Haleem, A. Artificial Intelligence (AI) applications for COVID-19 pandemic. Diabetes Metab. Syndr. Clin. Res. Rev. 2020, 14, 337–339. [Google Scholar] [CrossRef] [PubMed]
  3. Debnath, S.; Barnaby, D.P.; Coppa, K.; Makhnevich, A.; Kim, E.J.; Chatterjee, S.; Tóth, V.; Levy, T.J.; Paradis, M.D.; Cohen, S.L. Machine learning to assist clinical decision-making during the COVID-19 pandemic. Bioelectron Med. 2020, 6, 14. [Google Scholar] [CrossRef] [PubMed]
  4. Zafar, N.; Ahamed, J. Emerging technologies for the management of COVID19: A review. Sustain. Oper. Comput. 2022, 3, 249–257. [Google Scholar] [CrossRef]
  5. Podder, P.; Mondal, M.R.H. Machine learning to predict COVID-19 and ICU requirement. In Proceedings of the 2020 11th International Conference on Electrical and Computer Engineering, Dhaka, Bangladesh, 17–19 December 2020. [Google Scholar]
  6. Zhan, C.; Zheng, Y.; Zhang, H.; Wen, Q. Random-Forest-Bagging Broad Learning System with Applications for COVID-19 Pandemic. IEEE Internet Things J. 2021, 8, 15906–15918. [Google Scholar] [CrossRef] [PubMed]
  7. Purwandari, T.; Zahroh, S.; Hidayat, Y.; Sukono Mamat, M.; Saputra, J. Forecasting model of COVID-19 pandemic in Malaysia: An application of time series approach using neural network. Decis. Sci. Lett. 2022, 11, 35–42. [Google Scholar] [CrossRef]
  8. Yenurkar, G.; Mal, S. Future forecasting prediction of COVID-19 using hybrid deep learning algorithm. Multimed. Tools Appl. 2022, 82, 22497–22523. [Google Scholar] [CrossRef] [PubMed]
  9. Villavicencio, C.N.; Macrohon, J.J.E.; Inbaraj, X.A.; Jeng, J.H.; Hsieh, J.G. COVID-19 prediction applying supervised machine learning algorithms with comparative analysis using weka. Algorithms 2021, 14, 201. [Google Scholar] [CrossRef]
  10. Goldbloom, A. Kaggle Datasets. Available online: https://www.kaggle.com/datasets/ (accessed on 21 August 2025).
  11. Frank, E.; Hall, M.A.; Witten, I.H. The WEKA Workbench Data Mining: Practical Machine Learning Tools and Techniques, 4th ed.; Morgan Kaufmann: San Francisco, CA, USA, 2016. [Google Scholar]
  12. Aledhari, M.; Razzak, R.; Parizi, R.M.; Dehghantanha, A. A Deep Recurrent Neural Network to Support Guidelines and Decision Making of Social Distancing. In Proceedings of the 2020 IEEE International Conference on Big Data, Atlanta, GO, USA, 10–13 October 2020. [Google Scholar]
  13. Roser, M. Our World in Data. Available online: https://ourworldindata.org/ (accessed on 21 August 2025).
  14. Apple. Mobility Trends Reports. Available online: https://covid19.apple.com/mobility (accessed on 21 August 2025).
  15. Parbat, D.; Chakraborty, M. A python based support vector regression model for prediction of COVID19 cases in India. Chaos Solitons Fractals 2020, 138, 109942. [Google Scholar] [CrossRef] [PubMed]
  16. Lakshmanarao, A.; Babu, M.R.; Kiran, T.S.R. An Efficient Covid19 Epidemic Analysis and Prediction Model Using Machine Learning Algorithms. Int. J. Online Biomed. Eng. 2021, 17, 176–184. [Google Scholar] [CrossRef]
  17. Zgheib, R.; Chahbandarian, G.; Kamalov, F.; El Labban, O. Neural Networks Architecture for COVID-19 Early Detection. In Proceedings of the 2021 International Symposium on Networks, Computers and Communications, Dubai, United Arab Emirates, 31 Occtober–2 November 2021. [Google Scholar]
  18. Galván-Tejada, C.E.; Zanella-Calzada, L.A.; Villagrana-Bañuelos, K.E.; Moreno-Báez, A.; Luna-García, H.; Celaya-Padilla, J.M.; Galván-Tejada, J.I.; Gamboa-Rosales, H. Demographic and comorbidities data description of population in mexico with SARS-CoV-2 infected patients (COVID19): An online tool analysis. Int. J. Environ. Res. Public Health 2020, 17, 5173. [Google Scholar] [CrossRef] [PubMed]
  19. Mancilla-Galindo, J.; Vera-Zertuche, J.M.; Navarro-Cruz, A.R.; Segura-Badilla, O.; Reyes-Velázquez, G.; Tepepa-López, F.J.; Aguilar-Alonso, P.; Vidal-Mayo, J.d.J.; Kammar-García, A. Development and Validation of the Patient History COVID-19 (PH-Covid19) Scoring System: A Multivariable Prediction Model of Death in Mexican Patients with COVID-19. Epidemiol. Infect. 2020, 148, 1–37. [Google Scholar] [CrossRef] [PubMed]
  20. Gomez-Cravioto, D.A.; Diaz-Ramos, R.E.; Cantu-Ortiz, F.J.; Ceballos, H.G. Data Analysis and Forecasting of the COVID-19 Spread: A Comparison of Recurrent Neural Networks and Time Series Models. Cognit Comput. 2021, 16, 1794–1805. [Google Scholar] [CrossRef] [PubMed]
  21. Ascencio-Montiel Ide, J.; Ovalle-Luna, O.D.; Rascón-Pacheco, R.A.; Borja-Aburto, V.H.; Chowell, G. Comparative epidemiology of five waves of COVID-19 in Mexico, March 2020–August 2022. BMC Infect. Dis. 2022, 22, 813. [Google Scholar] [CrossRef] [PubMed]
  22. Almustafa, K.M. Covid19-Mexican-Patients’ Dataset (Covid19MPD) Classification and Prediction Using Feature Importance. Concurr Comput. 2022, 34, e6675. [Google Scholar] [CrossRef] [PubMed]
  23. Dirección General de Epidemiología. Datos Abiertos de Epidemiología (Open Epidemiology Data). Available online: https://www.gob.mx/salud/documentos/datos-abiertos-152127 (accessed on 12 August 2025).
  24. Microsoft. Power BI Desktop version 2.141.1754.0. Available online: https://www.microsoft.com/es-es/power-platform/products/power-bi (accessed on 13 August 2025).
  25. Posit. RStudio Desktop Version 4.3.1. Available online: https://posit.co/download/rstudio-desktop/ (accessed on 13 August 2025).
  26. Microsoft. Microsoft Excel Version 16.101.3. Available online: https://www.microsoft.com/es-mx/microsoft-365/excel (accessed on 13 August 2025).
  27. van Rossum, G. Python Version 3.13.7. Available online: https://www.python.org/ (accessed on 13 August 2025).
  28. Apicella, A.; Donnarumma, F.; Isgrò, F.; Prevete, R. A survey on modern trainable activation functions. Neural Netw. 2021, 138, 14–32. [Google Scholar] [CrossRef] [PubMed]
  29. Dubey, S.R.; Singh, S.K.; Chaudhuri, B.B. Activation functions in deep learning: A comprehensive survey and benchmark. Neurocomputing 2022, 53, 92–108. [Google Scholar] [CrossRef]
  30. Haque, M.; Afsha, S.; Nyeem, H. Developing BrutNet: A New Deep CNN Model with GRU for Realtime Violence Detection. In Proceedings of the 2022 International Conference on Innovations in Science, Engineering and Technology, ICISET, Chittagong, Bangladesh, 25–28 February 2022. [Google Scholar]
  31. Dubey, S.R.; Chakraborty, S.; Roy, S.K.; Mukherjee, S.; Singh, S.K.; Chaudhuri, B.B. DiffGrad: An Optimization Method for Convolutional Neural Networks. IEEE Trans. Neural. Netw. Learn Syst. 2020, 31, 4500–4511. [Google Scholar] [CrossRef] [PubMed]
  32. Yang, J.; Yang, G. Modified convolutional neural network based on dropout and the stochastic gradient descent optimizer. Algorithms 2018, 11, 28. [Google Scholar] [CrossRef]
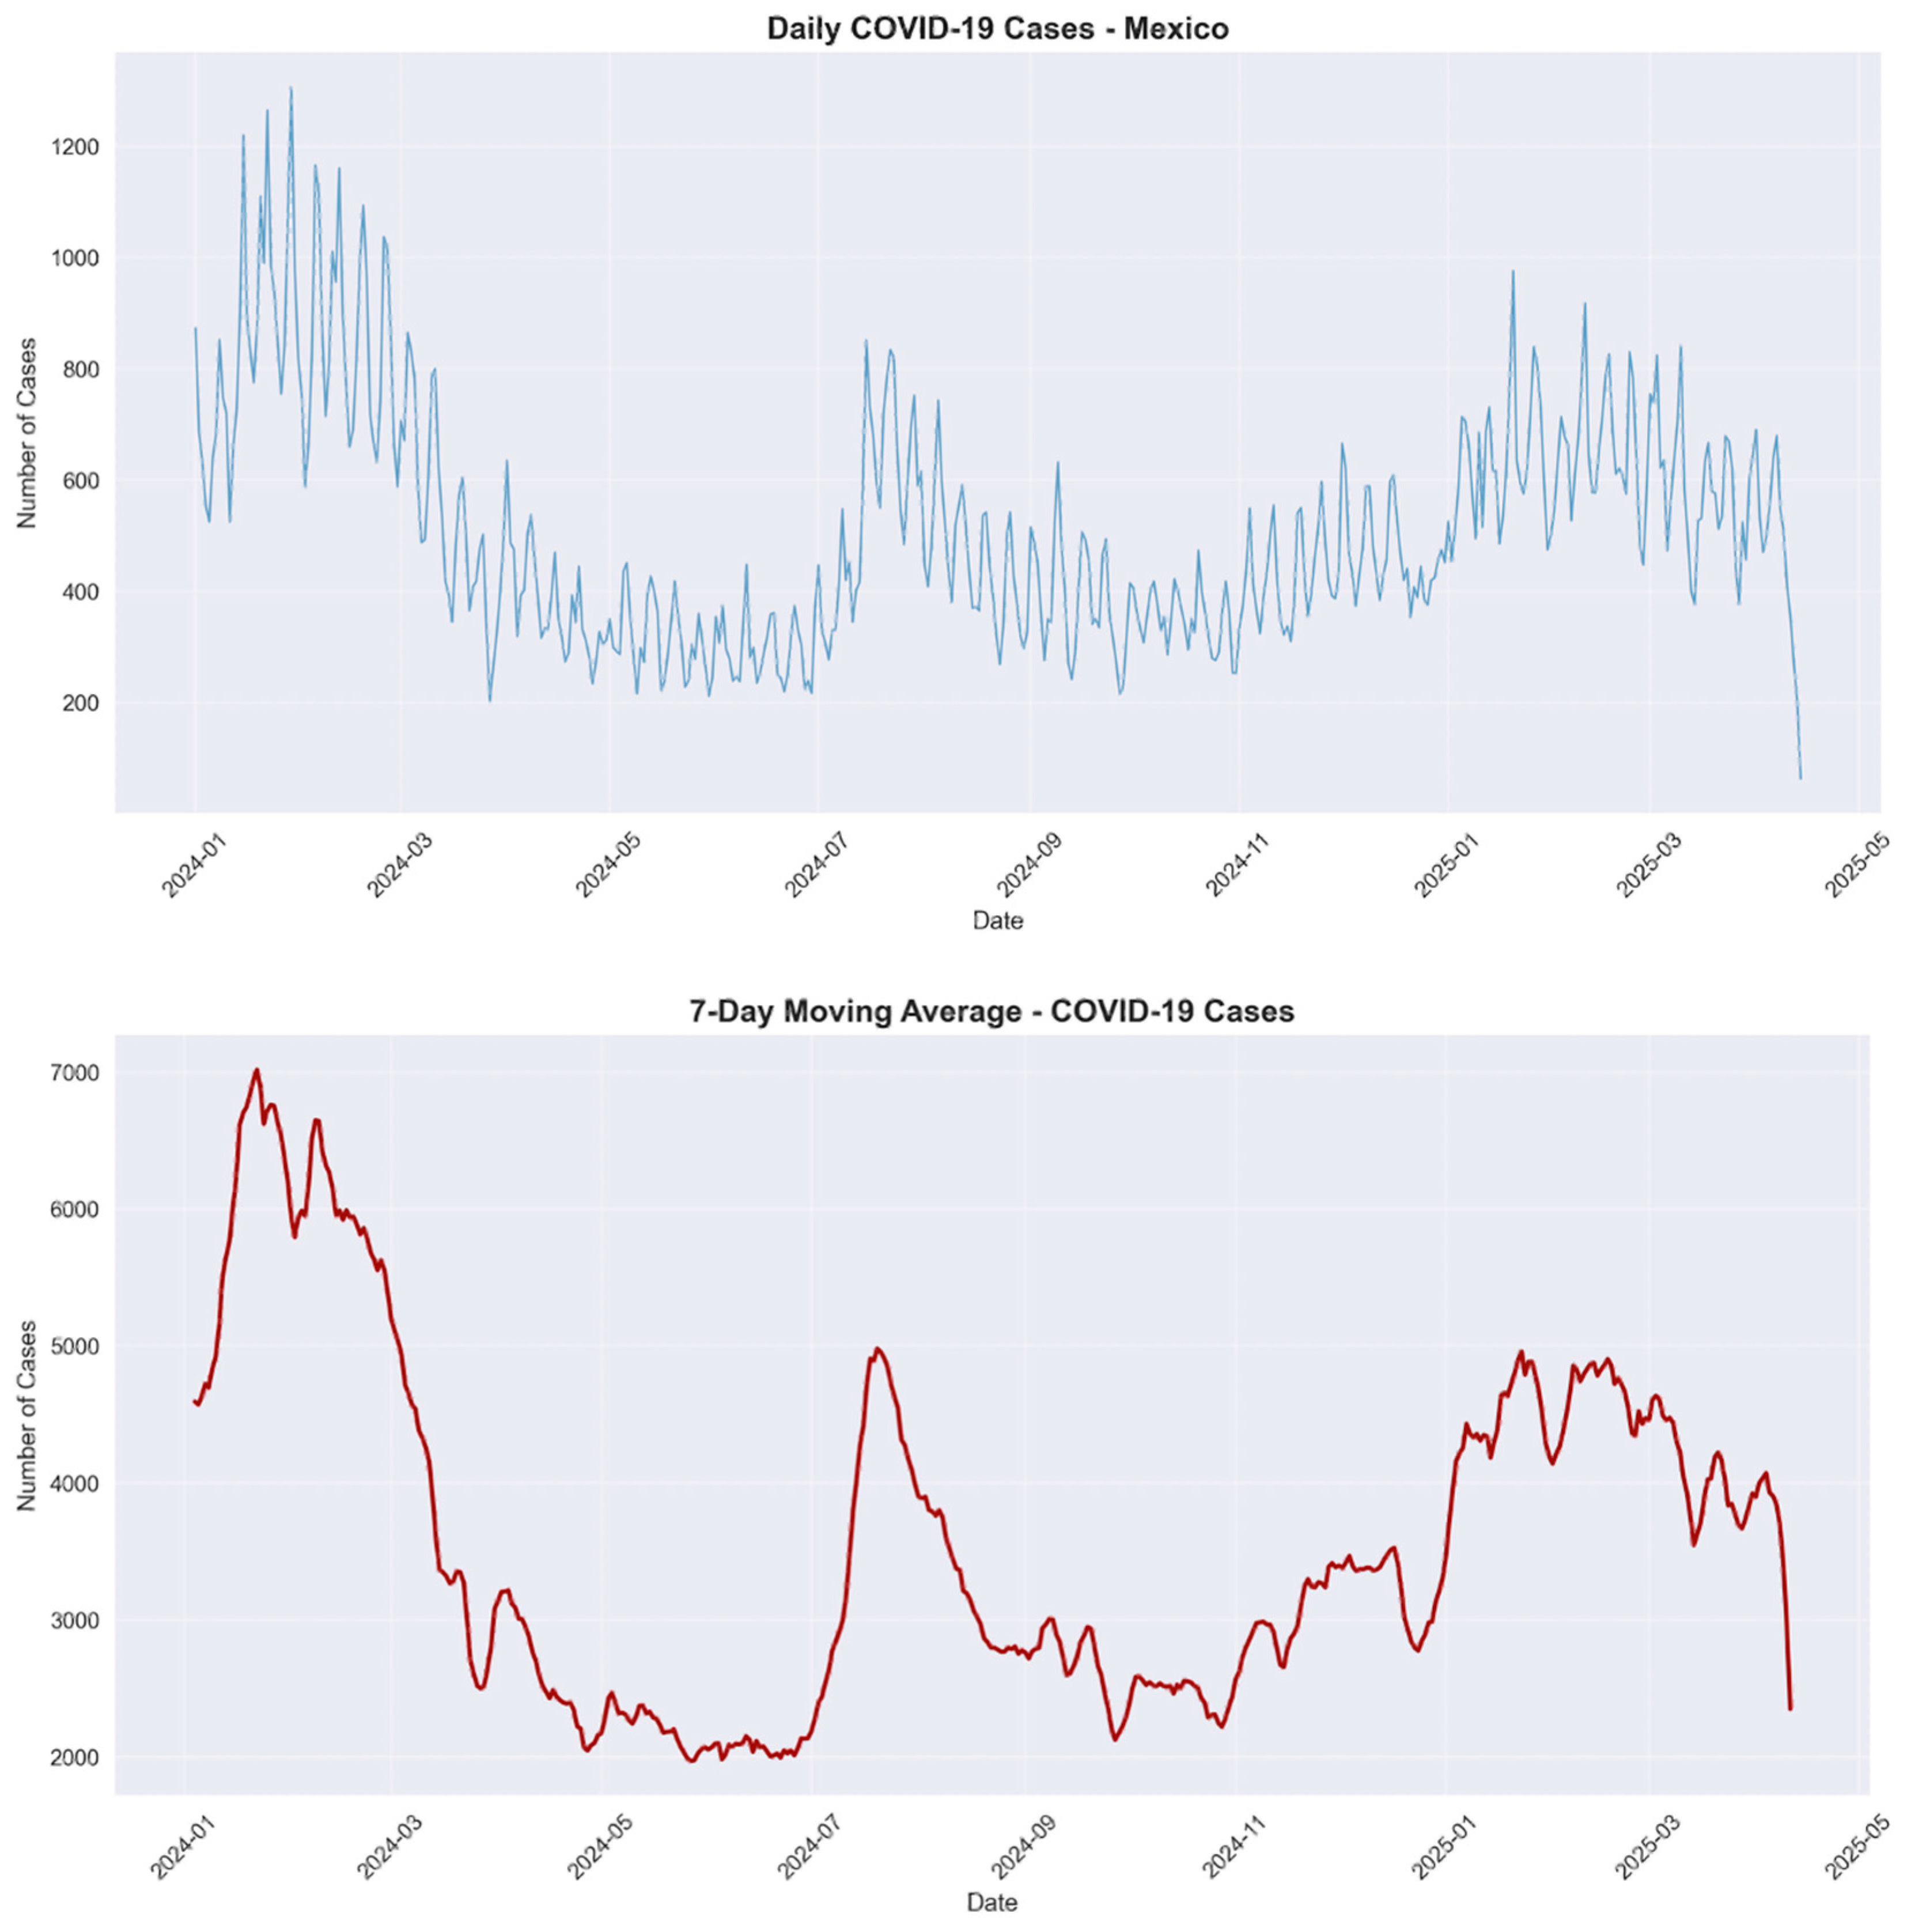
Figure 1. COVID-19 time series analysis from 2024-01 to 2025-04 in Mexico.
Covid 05 00174 g001
Figure 2. Artificial neural network-based process applied to Mexico’s COVID-19 dataset.
Covid 05 00174 g002
Figure 3. Significant features related to the ALIVE_DEAD response variable.
Covid 05 00174 g003
Figure 4. Neural network final parameterization.
Covid 05 00174 g004
Figure 5. Neural network accuracy and loss graphs.
Covid 05 00174 g005
Table 1. Artificial neural network model evaluation report.
Best Neural Network Model
PrecisionRecallf1-ScoreConfusion Matrix
00.930.930.93112579
10.930.930.93871094
01
accuracy 0.93
macro avg0.930.930.93
weighted avg0.930.930.93
Worst Neural Network Model
PrecisionRecallf1-ScoreConfusion Matrix
00.940.860.891436242
10.720.860.7896611
01
accuracy 0.86
macro avg0.830.860.84
weighted avg0.870.860.86
Table 2. Logistic regression model evaluation report.
PrecisionRecallf1-ScoreConfusion Matrix
00.900.960.93114251
10.950.900.921241068
01
accuracy 0.93
macro avg0.930.930.93
weighted avg0.930.930.93
Table 3. Evaluation report of classification algorithm-based models.
ClassifierClassification ReportConfusion Matrix
J48 (C4.5 algorithm)Correctly classified instances 220592.45% DeadAlive
Incorrectly classified instances1807.55%Dead108799
Kappa statistic0.849 Alive811118
ClassTP rateFP ratePrecisionRecallF-MeasureMCCROC areaPRC area
Dead0.9170.0680.9310.9170.9240.8490.9490.932
Alive0.9320.0830.9190.9320.9250.8490.9490.928
0.9250.0760.9250.9250.9250.8490.9490.930
Random ForestCorrectly classified instances 219992.20% DeadAlive
Incorrectly classified instances1867.80%Dead109690
Kappa statistic0.844 Alive961103
ClassTP rateFP ratePrecisionRecallF-MeasureMCCROC areaPRC area
Dead0.9240.0800.9190.9240.9220.8440.9650.960
Alive0.9200.0760.9250.9200.9220.8440.9650.956
0.9220.0780.9220.9220.9220.8440.9650.958
Naïve BayesCorrectly classified instances 219592.03% DeadAlive
Incorrectly classified instances1907.97%Dead109690
Kappa statistic0.8407 Alive1001099
ClassTP rateFP ratePrecisionRecallF-MeasureMCCROC areaPRC area
Dead0.9240.0830.9160.9240.9200.8410.9640.965
Alive0.9170.0760.9240.9170.9200.8410.9640.944
0.9200.0800.9200.9200.9200.8410.9640.954
Bayes NetCorrectly classified instances 219091.82% DeadAlive
Incorrectly classified instances1958.18%Dead1083103
Kappa statistic0.8365 Alive921107
ClassTP rateFP ratePrecisionRecallF-MeasureMCCROC areaPRC area
Dead0.9130.0770.9220.9130.9170.8370.9690.966
Alive0.9230.0870.9150.9230.9190.8370.9690.967
0.9180.0820.9180.9180.9180.8370.9690.966
Random TreeCorrectly classified instances 214189.77% DeadAlive
Incorrectly classified instances24410.23%Dead1065121
Kappa statistic0.7954 Alive1231076
ClassTP rateFP ratePrecisionRecallF-MeasureMCCROC areaPRC area
Dead0.8980.1030.8960.8980.8970.7950.9050.871
Alive0.8970.1020.8990.8970.8980.7950.9050.865
0.8980.1020.8980.8980.8980.7950.9050.868
Table 4. Comparison of studies in the Mexican context.
AuthorsProposal in the Mexican ContextReported MetricsPeriod
Almustafa (2021) [22]Classification algorithms to predict survival and death cases from COVID-19.94.41% accuracy in survival/death classificationPandemic era
Ascencio-Montiel et al. (2022) [21]Logistic regression models to assess the association of demographic factors, comorbidities, waves, and vaccination with the risk of death from COVID-19.Hospital case fatality rate for five infection waves: 45.1%, 50.8%, 43.6%, 34.7%, 17.7% (95% CI)Pandemic era
Gomez-Cravioto et al. (2021) [20]Regression models to describe the growth of COVID-19 incidents and LSTM neural network to perform forecasting for daily cases and fatalities.275.35 RMSE in predicting daily incidents and 31.91 RMSE in predicting daily fatalitiesPandemic era
Mancilla-Galindo et al. (2020) [19]Multivariate prediction model of death in patients with COVID-19 based on Cox regression model.From 1.05 HR to 1.86 HR for regression coefficients (95% CI, p value < 0.0001)Pandemic era
Luna-Ramírez et al. (2025) [this article]Classification models to predict recoveries and deaths from COVID-19 based on ANN, logistic regression models and classification algorithms.93% accuracy and 5.6% loss in predicting recoveries/deathsPost-pandemic era
Disclaimer/Publisher’s Note: The statements, opinions and data contained in all publications are solely those of the individual author(s) and contributor(s) and not of MDPI and/or the editor(s). MDPI and/or the editor(s) disclaim responsibility for any injury to people or property resulting from any ideas, methods, instructions or products referred to in the content.